1. Introduction
Periodic variability of the characteristics of water (especially surface water) forces the exploiters of treatment plants to adapt the conditions of the coagulation process to the quality of raw water [
1]. Correction of coagulant dose is usually a reaction to a deterioration in the quality of treated water, or it depends on a specific parameter of raw water (e.g., turbidity). The Jar test is a popular method of determining the dose of coagulant. However, this method is time consuming, does not illustrate the problem in its entirety, and often ends as a blind shot [
2].
The parameter providing important information about the status of the coagulation process, and allowing for the qualitative determination of the charge neutralization efficiency, is the measurement of the zeta potential (ZP). In case of natural occurring water, ZP value is usually negative due to polar matrix ions adsorption on the surface of the colloidal solids [
3]. Dosing a coagulant (e.g., in the form of an aluminum salt) whose hydrolysis products are positively charged causes a change in ZP towards positive values. Optimal agglomeration will be achieved at the isoelectric point (IP), when ZP is reduced to zero, and the colloid is maximally destabilized [
4].
2. Aim of the Work
The aim of the conducted research is to analyze the utility of the zeta potential measurement in the type and dose of coagulant prediction in the process of natural surface water coagulation. In addition, the effectiveness of coagulation using four types of aluminum coagulants was analyzed.
The first part of the experiment was qualitative analysis of the tested raw water. The characteristics of the coagulants used in this study were also determined. Four types of aluminum-based coagulants were used. The first was aluminum sulfate (Alum), representing the conventional aluminum coagulants. Another coagulant used was polyaluminum chloride (PAC), as a representative of the group of low-basic coagulants. The last two coagulants used in this study were: dialuminum chloride pantahydroxide (PACl) and polyaluminum chloride hydroxide sulfate (PACS), representing a group of high-basic and pre-hydrolyzed coagulants,
Next step was to determine ZP dependence on the coagulant and aluminum dose graph ζ = f(mg/L) and ζ = f(mgAl/L). ZP measurement was carried out with simultaneous dosing of the coagulant which allowed for the determination of the IP for each of the four cases.
In the last part, the coagulation process was carried out. Coagulant doses were previously determined on the basis of IP analysis. For each coagulant, five doses were chosen: IP, IP + 10%, IP + 20%, IP − 10%, IP − 20%. The effectiveness of the coagulation process was evaluated on the basis of the obtained quality parameters. The parameters tested were: basic parameters (pH, turbidity, color, alkalinity), organic matter concentration (Abs254, Total Organic Carbon (TOC) and Disolved Organic Carbon (DOC)), and residual aluminum contamination.
3. Materials and Methods
3.1. Coagulants
As Alum technical grade aluminum sulfate was used (Al2(SO4)3•16H2O). As PAC PAX-18 was used. The last two coagulants used in the study were: Flokor 1,2A (PACl) and Flokor 1ASW (PACS). PAX-18 and Flokor coagulants are the trade names of aqueous solution of specific aluminum salts.
3.2. Methods
3.2.1. Coagulants Analysis
Characterization of coagulants was carried out according to standard PN-EN 1302:2001.
3.2.2. Zeta Potential
For ZP analysis, the Malvern Zetasizer Nano zeta potential meter coupled with automatic titrator was used, and the measurement was based on the electrophoretic light scattering (ELS) technique. The process was conducted in the automatic titration mode in the sequence: dosing, mixing, measurement.
3.2.3. Coagulation and Analytical Techniques
Coagulation process was carried out using the “Jar test” method in a 3-phased sequence:
1 phase: 100 RPM mixing for 1 min.
2 phase: 40 RPM mixing for 15 min.
3 phase: 60 min of sedimentation.
Organic carbon concentration measurement was made on Analytikjena Multi N/C 3100. Al concentrations were determined by the Graphite Furnace Atomic Absorption Spectroscopy (GF-AAS) method, on the Analytikjena contrAA 700.
4. Results
The coagulants selected for these tests were characterized by different structures, aluminum concentrations, pH, and basicity. Survey [
5] indicated the effect of coagulant basicity on the percentage of poly- and monomeric aluminum structures. Increased basicity resulted in a larger share of polymeric aluminum forms, including Al
13 polycations, which are considered to be the most effective and desirable during the coagulation process due to their strong neutralization capacity [
6]. Used coagulants characteristics are shown in
Table 1.
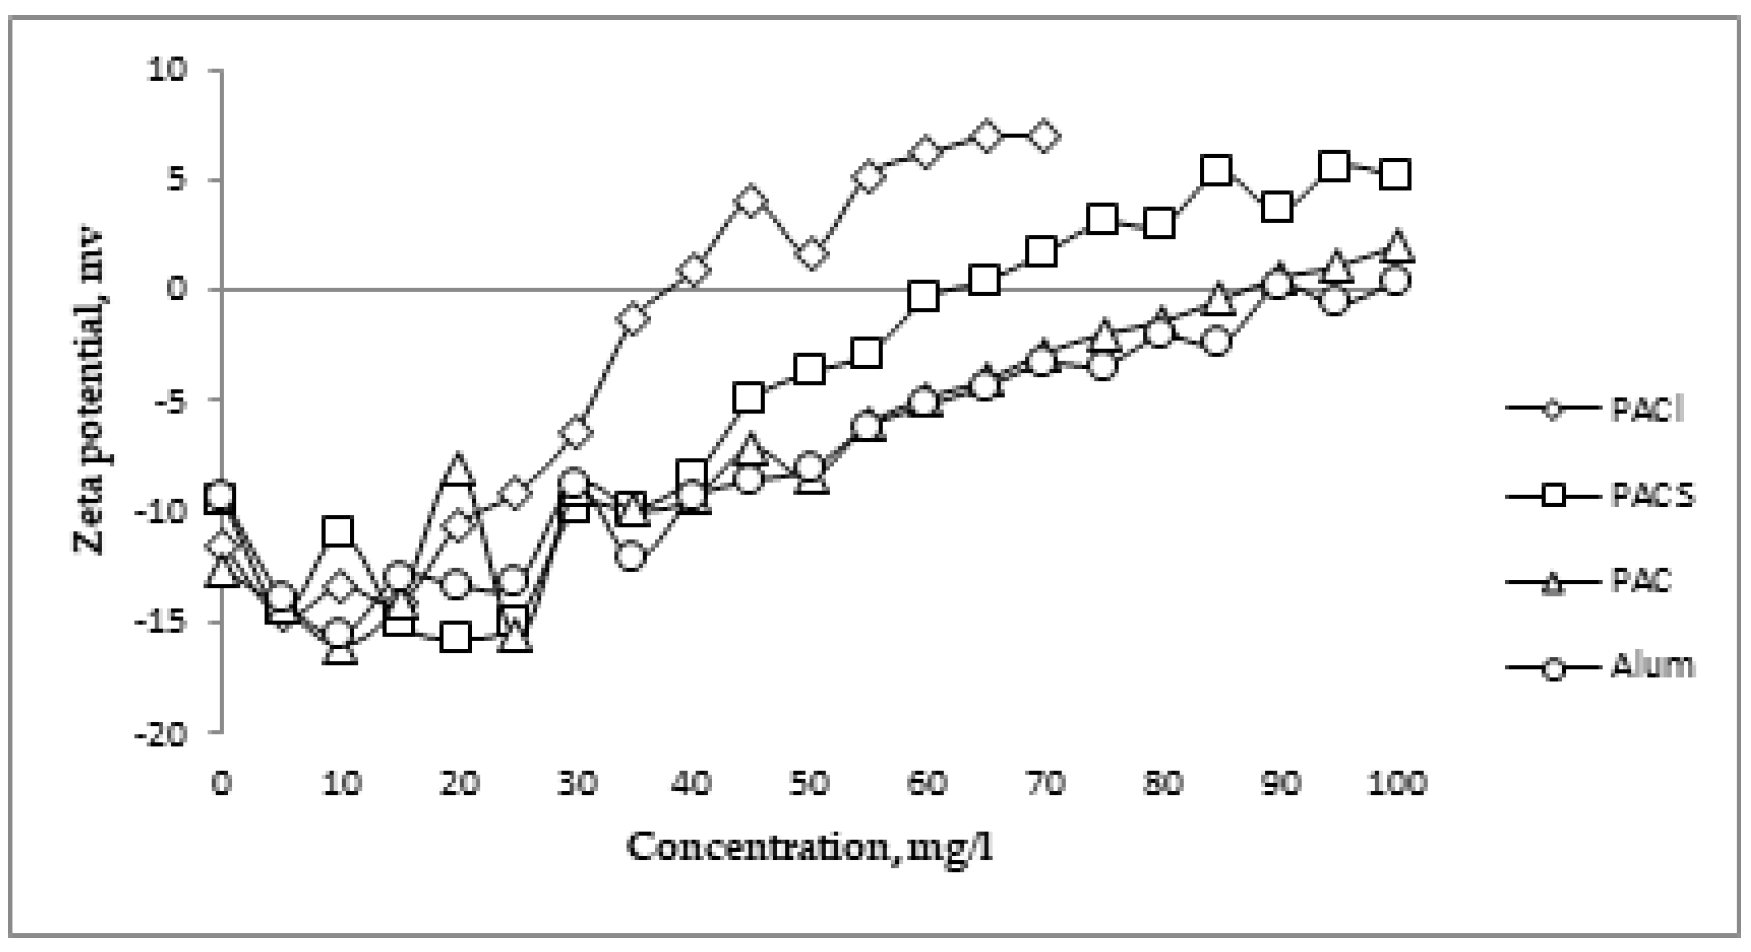
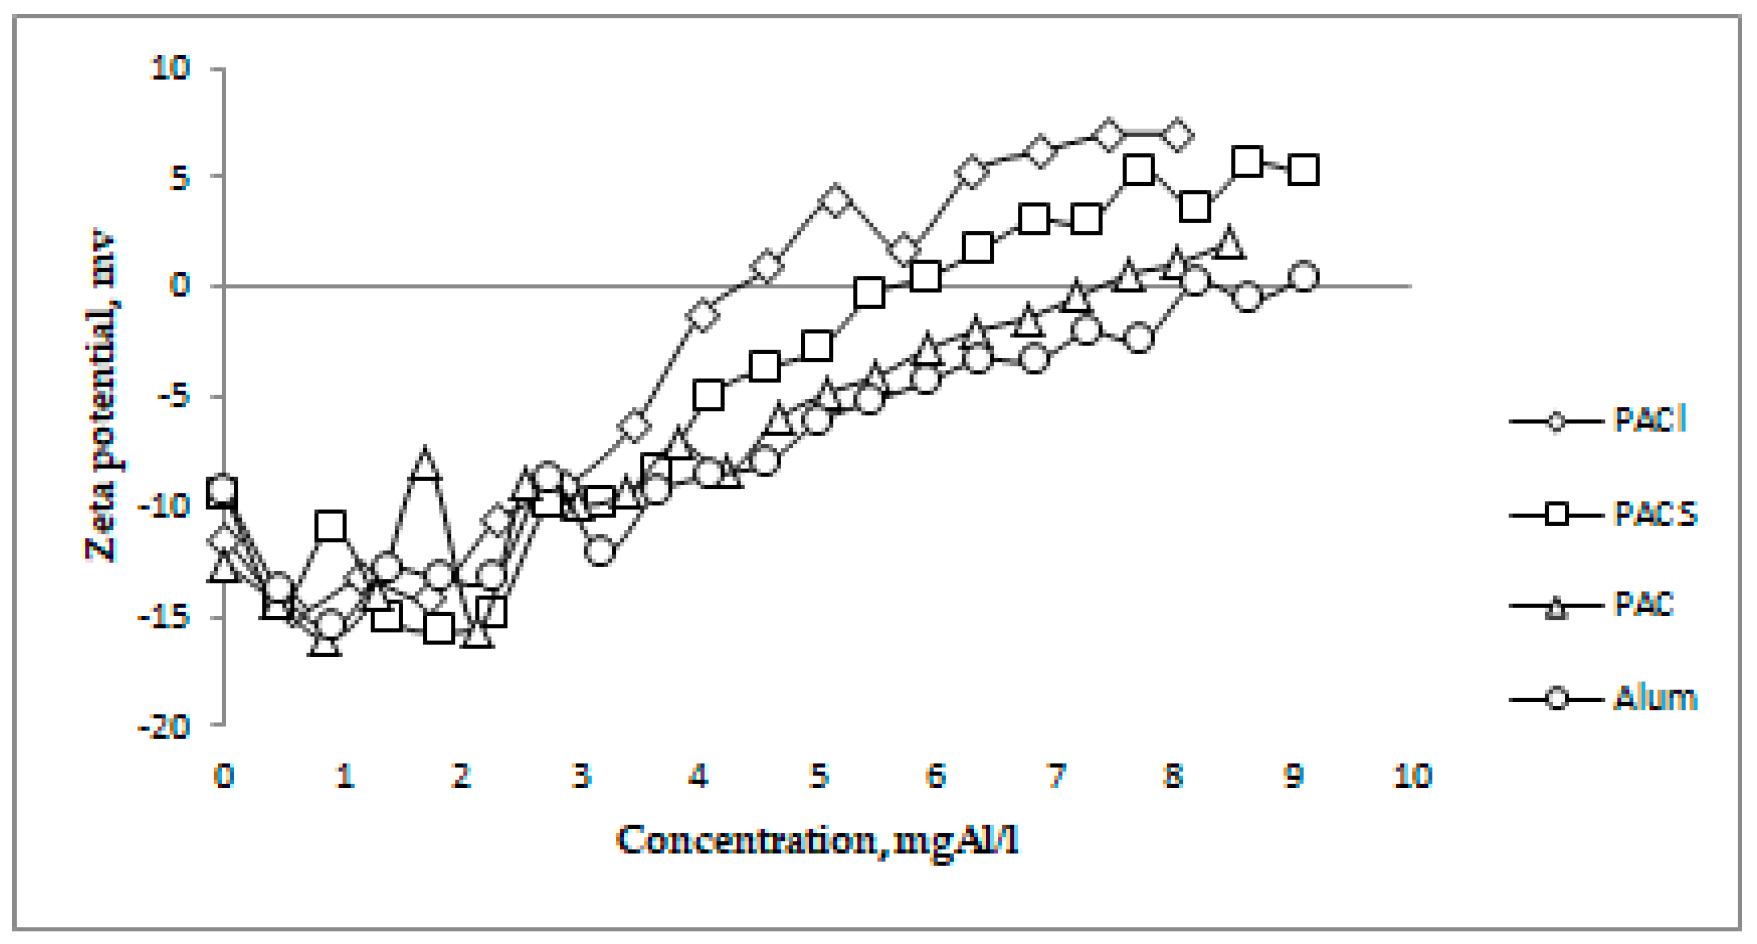
Figure 1 shows the change in the ZP value as a function of the dose of individual coagulants. Due to different concentrations of Al
3+ in selected coagulants, the relation between ZP and the given aluminum concentration is shown. This dependence is presented in
Figure 2. In both cases, IP was achieved the fastest in the case of PACl and the slowest in the case of Alum. In case of low-basic coagulants (PAC and Alum), the need to use a much higher dose of the coagulant, as well as aluminum, was demonstrated in order to achieve IP. The efficacy of coagulants was in order of: PACl (38 mg/L, 4.39 mgAl/L), PACS (62 mg/L, 5.64 mgAl/L), PAC (87 mg/L, 7.36 mgAl/L), Alum (98 mg/L, 8.92 mgAl/L).
Qualitative analysis of water after the coagulation process showed that the doses selected on the basis of the IP analysis resulted in the reduction of parameters to similar levels. This means that the ZP measurement is a precise, universal method and illustrates the actual changes taking place during coagulation. In case of Alum and PAC, the negative phenomenon of significant acidification of treated water was observed (pH drop from 7.95 to 6.48 for Alum, to 6.91 for PAC, and total alkalinity from 1.95 mval/L, respectively, to 1.01 and 1.40 mval/L). In addition to this, use of Alum resulted in drastic contamination of the treated water with residual aluminum (from 92.7 to 712.3 µg/L). Raw and post-coagulation water characteristics are shown in
Table 2.
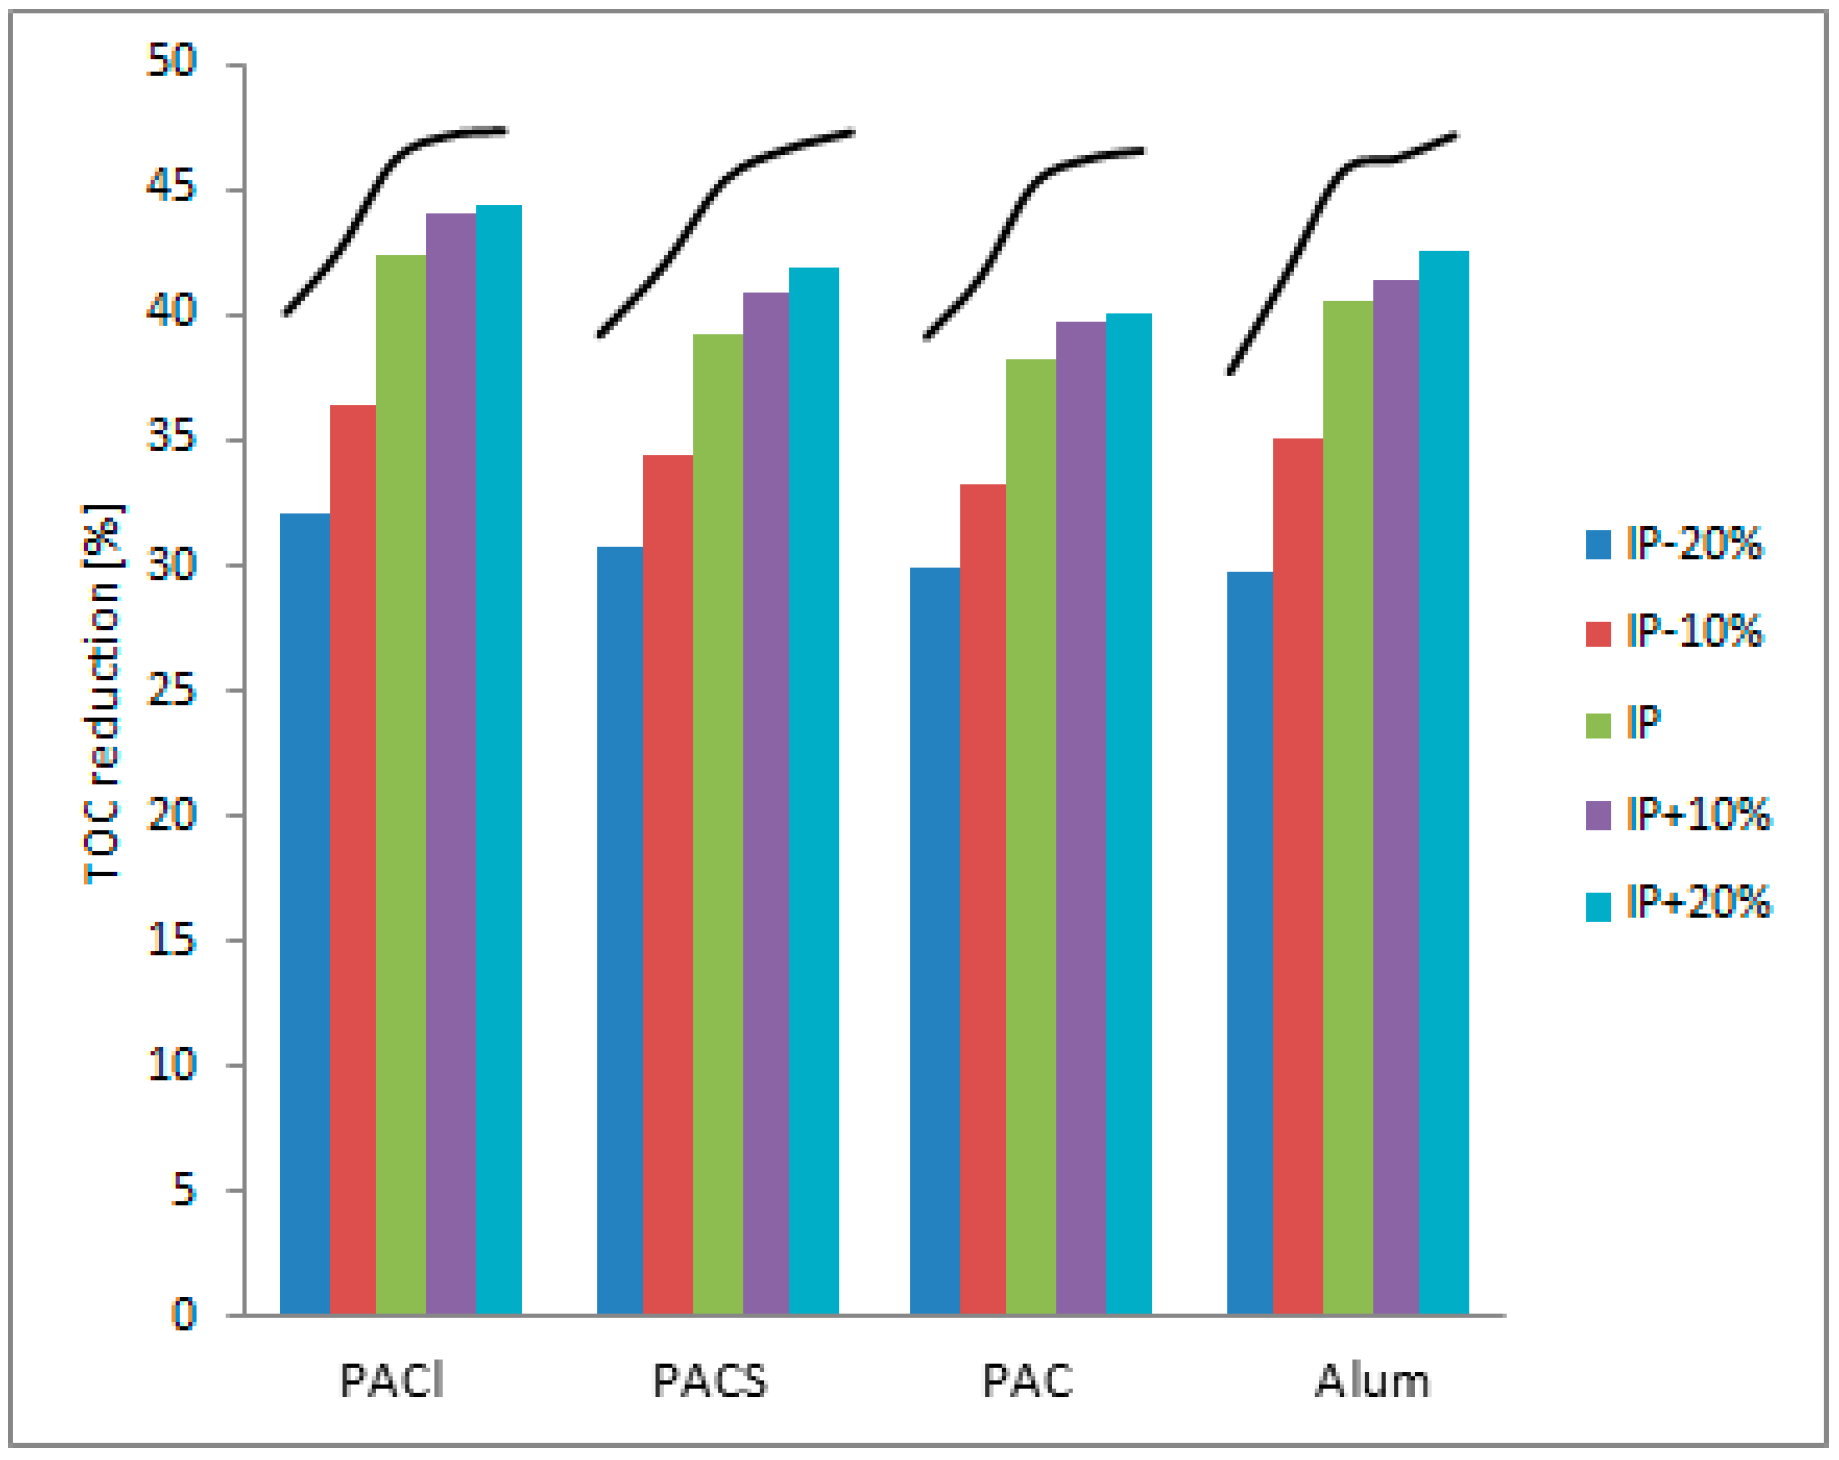
TOC reduction analysis was also made in an additional four doses of every coagulant used: 10% and 20% under and over IP dose. These doses were marked as IP − 20%, IP − 10%, IP + 10%, IP + 20%. Organic matter reduction was the most efficient in IP + 20% dose for every coagulant, which may be obvious. But more important is that, after achieving isoelectric point, TOC reduction decreases becoming less significant and the trendline became smoother. This phenomenon repeated in all studied cases, showing that ZP analysis gives a very precise coagulant dose prediction and is a great alternative to the traditional Jar test method. The TOC reduction chart, including trendline, is shown in
Figure 3.
5. Conclusions
This research confirms the validity of the zeta potential measurement in coagulation process optimization. By analyzing the isoelectric point of colloidal impurities, this method allows relatively quick and precise prediction of the most effective coagulant type and dose.
Despite differences resulting from the chemical structure, concentration, or work mechanism, the application of coagulant doses resulting from the IP analysis allowed for the achievement of similar values of turbidity, color, and organic matter reduction.
Coagulation efficiency drops above isoelectric point coagulant dose.
High-basic coagulants are more efficient in the charge neutralization process in relation to PAC and Alum.
Author Contributions
D.M. and I.Z. conceived and designed the experiments. Both authors performed the experiments, analyzed the data, and wrote the paper.
Acknowledgments
This study was supported by the Ministry of Science and Higher Education with grant designated for realization of the project “Implementation Ph. D” and with BKM/RIE-4/2018 grant.
Conflicts of Interest
The authors declare no conflict of interest. The founding sponsors had no role in the design of the study; in the collection, analyses, or interpretation of data; in the writing of the manuscript, and in the decision to publish the results.
References
- Mroczko, D.; Zimoch, I. Coagulation of pollutions occurring in surface waters during time of dynamic water flow. Ecol. Eng. 2018, 19, 15–22. [Google Scholar]
- Edney, D. Introduction to the Theory of the Streaming Current Meter; Application Note; Accurate Measurements NZ Ltd.: Auckland, New Zealand, 2005. [Google Scholar]
- Salopek, B.; Krasic, D.; Filipovic, S. Measurement and application of Zeta-Potential. Rudarsko-geolosko-naftni zbornik 1992, 4, 147–151. [Google Scholar]
- Ordaz-Diaz, L.A.; Valle-Cervantes, S.; Rodrigues-Rosales, J.; Bailon-Salas, A.M.; Madrid-Del Palacio, M.; Torres-Fraga, K.; De la Pena-Arellano, L.A. Zeta Potential as a Tool to Evaluate the Optimum Performance of a Coagulation-flocculation Process for Wastewater Internal Treatment for Recirculation in the Pulp and Paper Process. BioResources 2017, 12, 5953–5969. [Google Scholar] [CrossRef]
- Gumińska, J.; Kłos, M. Reliability of Ferronometry assay for aluminum speciation in pre-hydrolyzed coagulants. Architecture Civil Eng. Environ. 2013, 3, 77–81. [Google Scholar]
- Hu, C.; Liu, H.; Qu, J.; Wang, D.; Ru, J. Coagulation Behavior of Aluminum Salts in Eutrophic Water: Significance of Al13 Species and pH Control. Environ. Sci. Technol. 2006, 40, 325–331. [Google Scholar] [CrossRef] [PubMed]
| Disclaimer/Publisher’s Note: The statements, opinions and data contained in all publications are solely those of the individual author(s) and contributor(s) and not of MDPI and/or the editor(s). MDPI and/or the editor(s) disclaim responsibility for any injury to people or property resulting from any ideas, methods, instructions or products referred to in the content. |
© 2019 by the authors. Licensee MDPI, Basel, Switzerland. This article is an open access article distributed under the terms and conditions of the Creative Commons Attribution (CC BY) license (https://creativecommons.org/licenses/by/4.0/).

