1. Introduction
The deterioration of RC infrastructure, particularly from chloride attack, is a serious problem requiring periodic inspection. Near-infrared spectroscopy (NIR) was proposed [
1] for concrete salinity evaluation, but suffers from sunlight interference [
2] and needs 1D, contact measurement. We focused on non-destructive inspection using Kagawa University’s imaging 2D Fourier spectrometer (
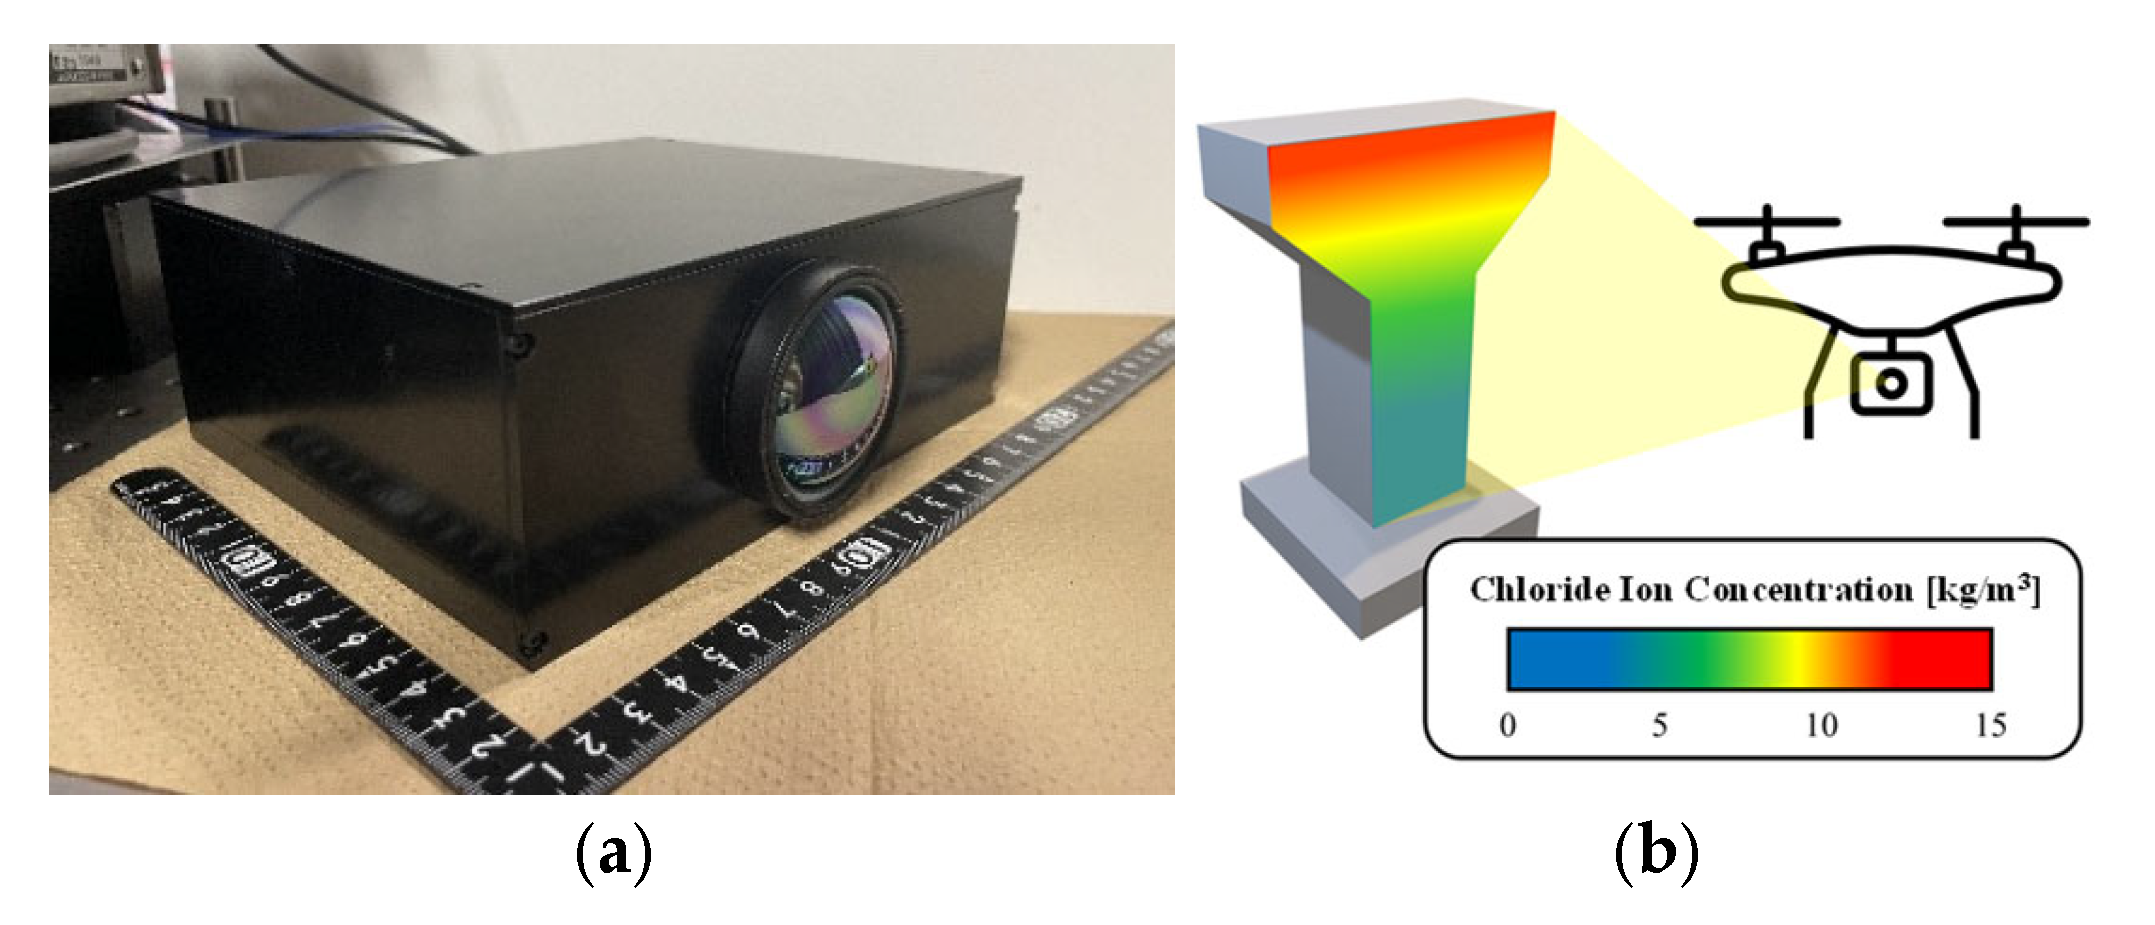
Figure 1a). This device acquires non-destructive, non-contact, 2D mid-infrared (MIR) spectra. Its vibration-resistant Ishimaru interferometer, unlike standard FT-IR, is suited for future remote drone applications (
Figure 1b). However, a method for detecting chlorides via MIR is currently unestablished. This study thus proposes a concrete salinity concentration evaluation method using mid-infrared spectroscopy.
2. Experimental Investigation
2.1. Ishimaru Spectrometer
The Ishimaru spectrometer acquires spectral characteristics by receiving thermal radiation. To enhance sensitivity, a temperature difference is needed. Thus, specimens were heated at 50 °C/60% humidity for about 24 h. Measurement began after reaching 45 °C, with a hot plate at 50 °C used for temperature maintenance (
Figure 2a).
Conditions were 4 accumulations at a distance of 620 mm. Relative intensity spectra were obtained using Spector Viewer (Nisshin Kikai Co., Ltd., Takamatsu, Kagawa Prefecture, Japan), and the average within the high-sensitivity 100 × 100 pixel area was used for analysis (
Figure 2b).
2.2. Specimens
In this experiment, cement paste specimens were tested to simplify the analysis of spectra. The mix proportions included a water/cement ratio (W/C) of 50% and ten levels (a) (b) of chloride ion concentration: 0, 1, 2, 3, 5, 7, 10, 12, 15, and 20 kg/m3. The mass of sodium chloride to be mixed into the cement paste was calculated from the target chloride ion concentration based on the molar mass of chloride ions and sodium chloride.
The cement paste was mixed for 5 min in a 1 L volume. It was then cast into cylindrical molds of 5 cm diameter and 10 cm height, filling them to a height of approximately 5 cm. After casting, stirring was performed twice within the molds at 5-min intervals to prevent bleeding. Curing was conducted for 10 days at room temperature (20 °C) with the molds covered with plastic wrap. After demolding, the specimens were stored in sealed bags to suppress the progression of carbonation.
2.3. Specimen Measurements
In this experiment, in addition to the Ishimaru spectrometer, measurements were also performed using an FT-IR spectrometer (Kagawa University, Kagawa, Japan) to validate the measurement results. The measurement locations were the surface and cross-section of the specimens. Specimen A1 was cut to enable examination of the internal spectra.
The analysis methods used in this experiment include visualization of trend changes using baseline correction, correlation analysis between peak wavelengths and chloride ion concentration, and validation of prediction accuracy using calibration curves. Using these methods, we investigated characteristic peaks changing with increasing chloride ion concentration within the 7000–14,000 nm range, standardized to the Ishimaru spectrometer for both instruments.
3. Results and Discussion
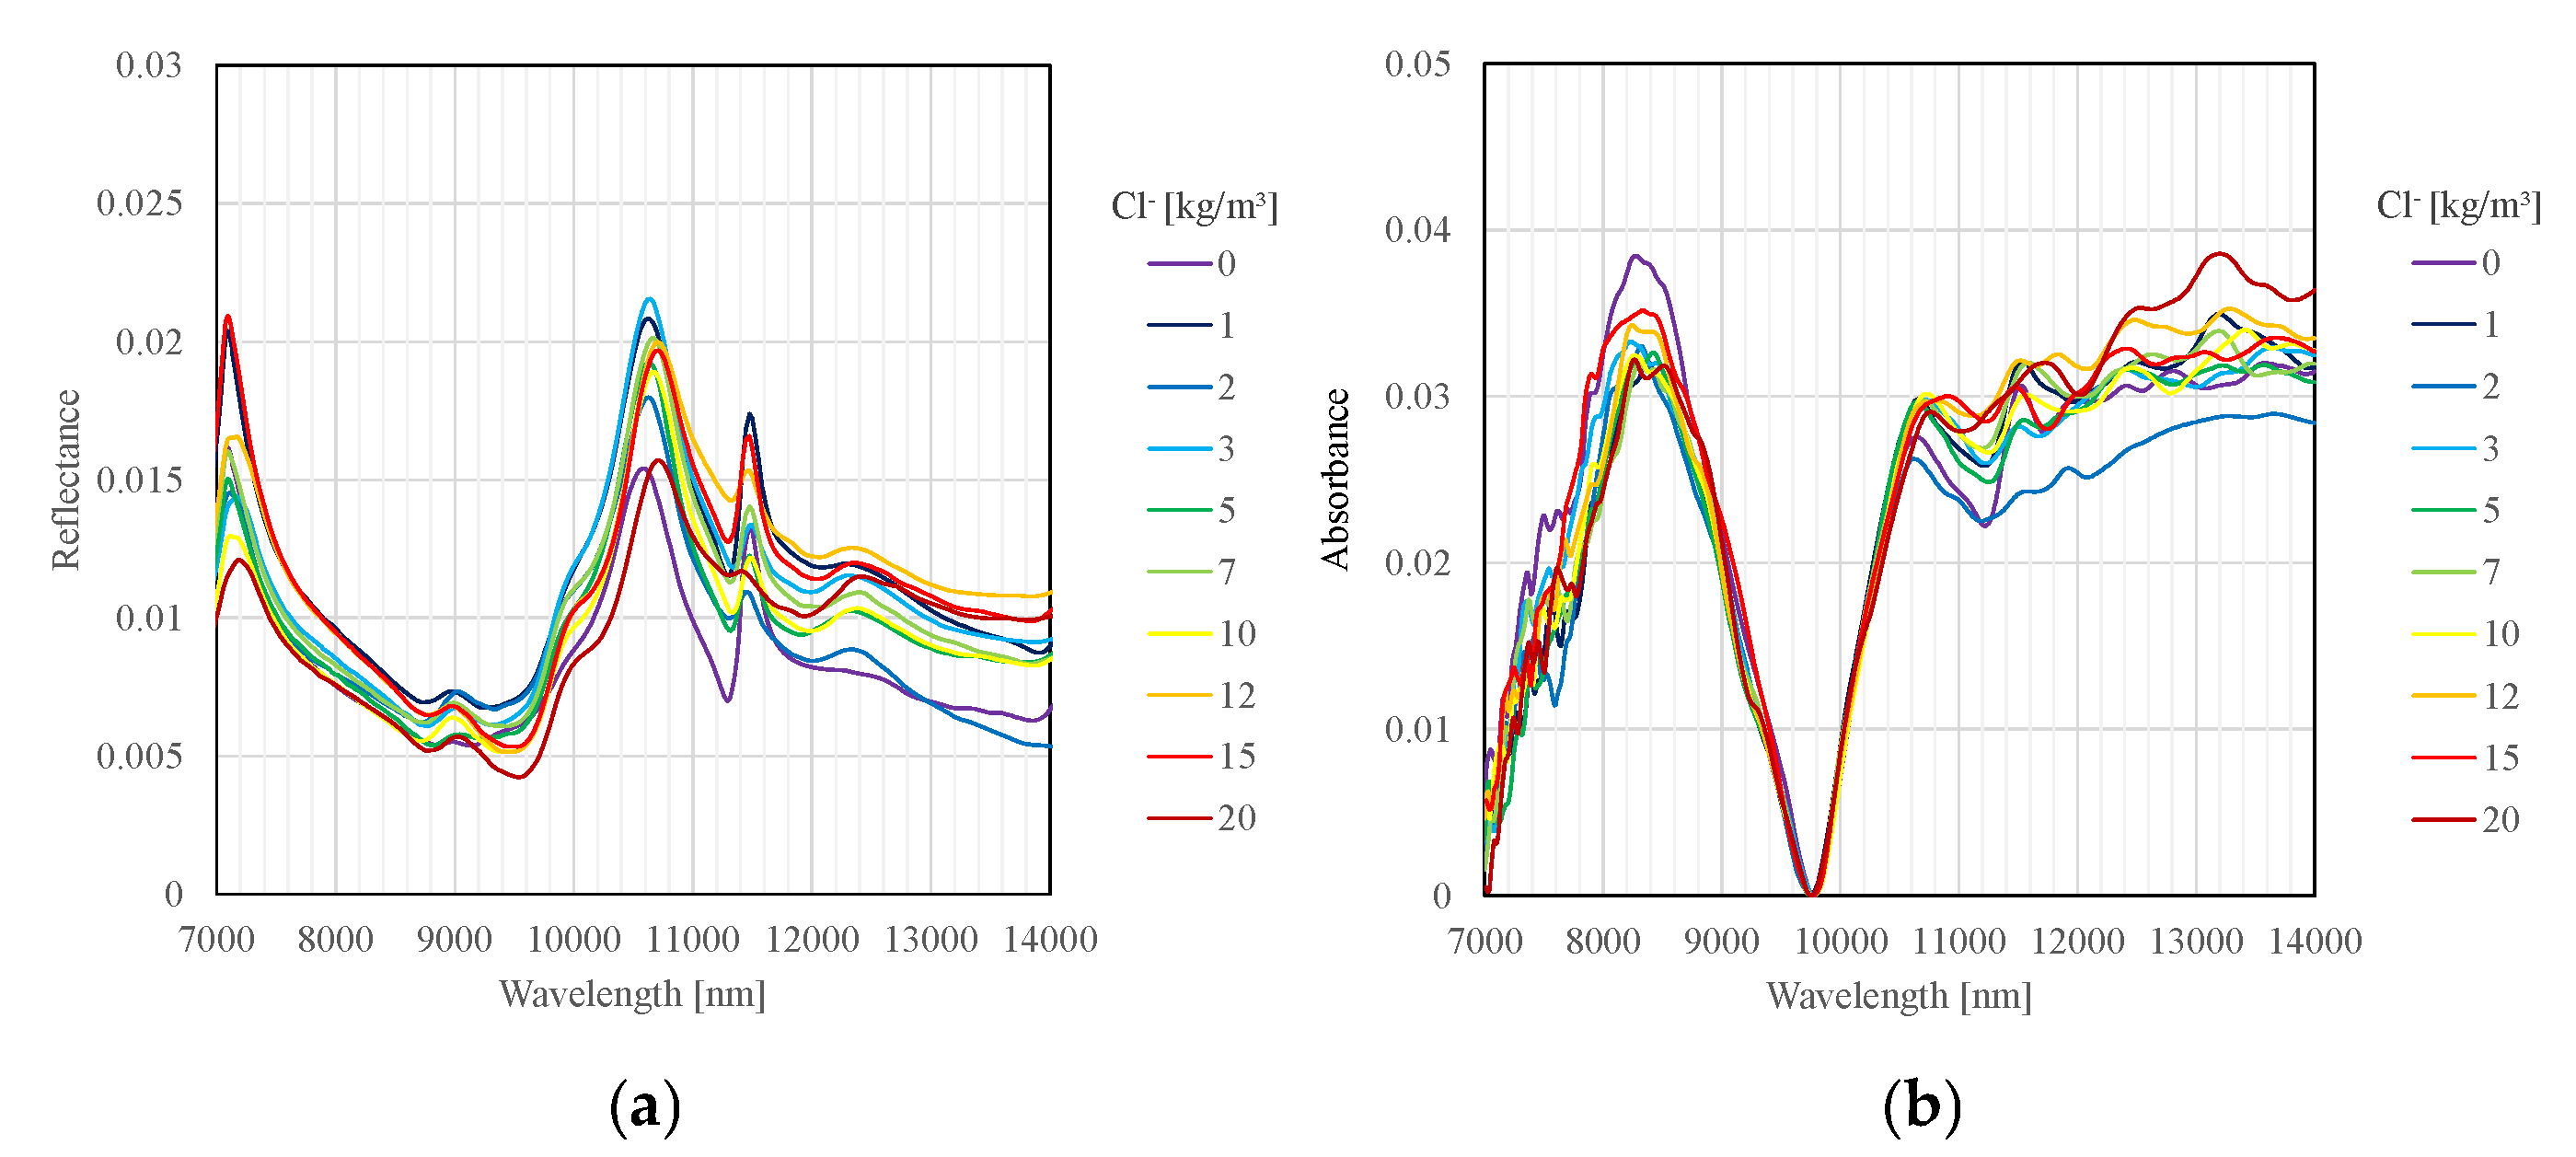
Figure 3a,b show the measurement results for the surface of specimen obtained using the FT-IR spectrometer and the Ishimaru spectrometer, respectively. It can be confirmed that the spectra obtained by the FT-IR spectrometer and the Ishimaru spectrometer show similarity. Furthermore, these results reveal that variation is observed in the peak wavelength around 10.6 μm in the surface measurement data. Conversely, no significant variation in peak wavelength is observed in the cross-section measurement data.
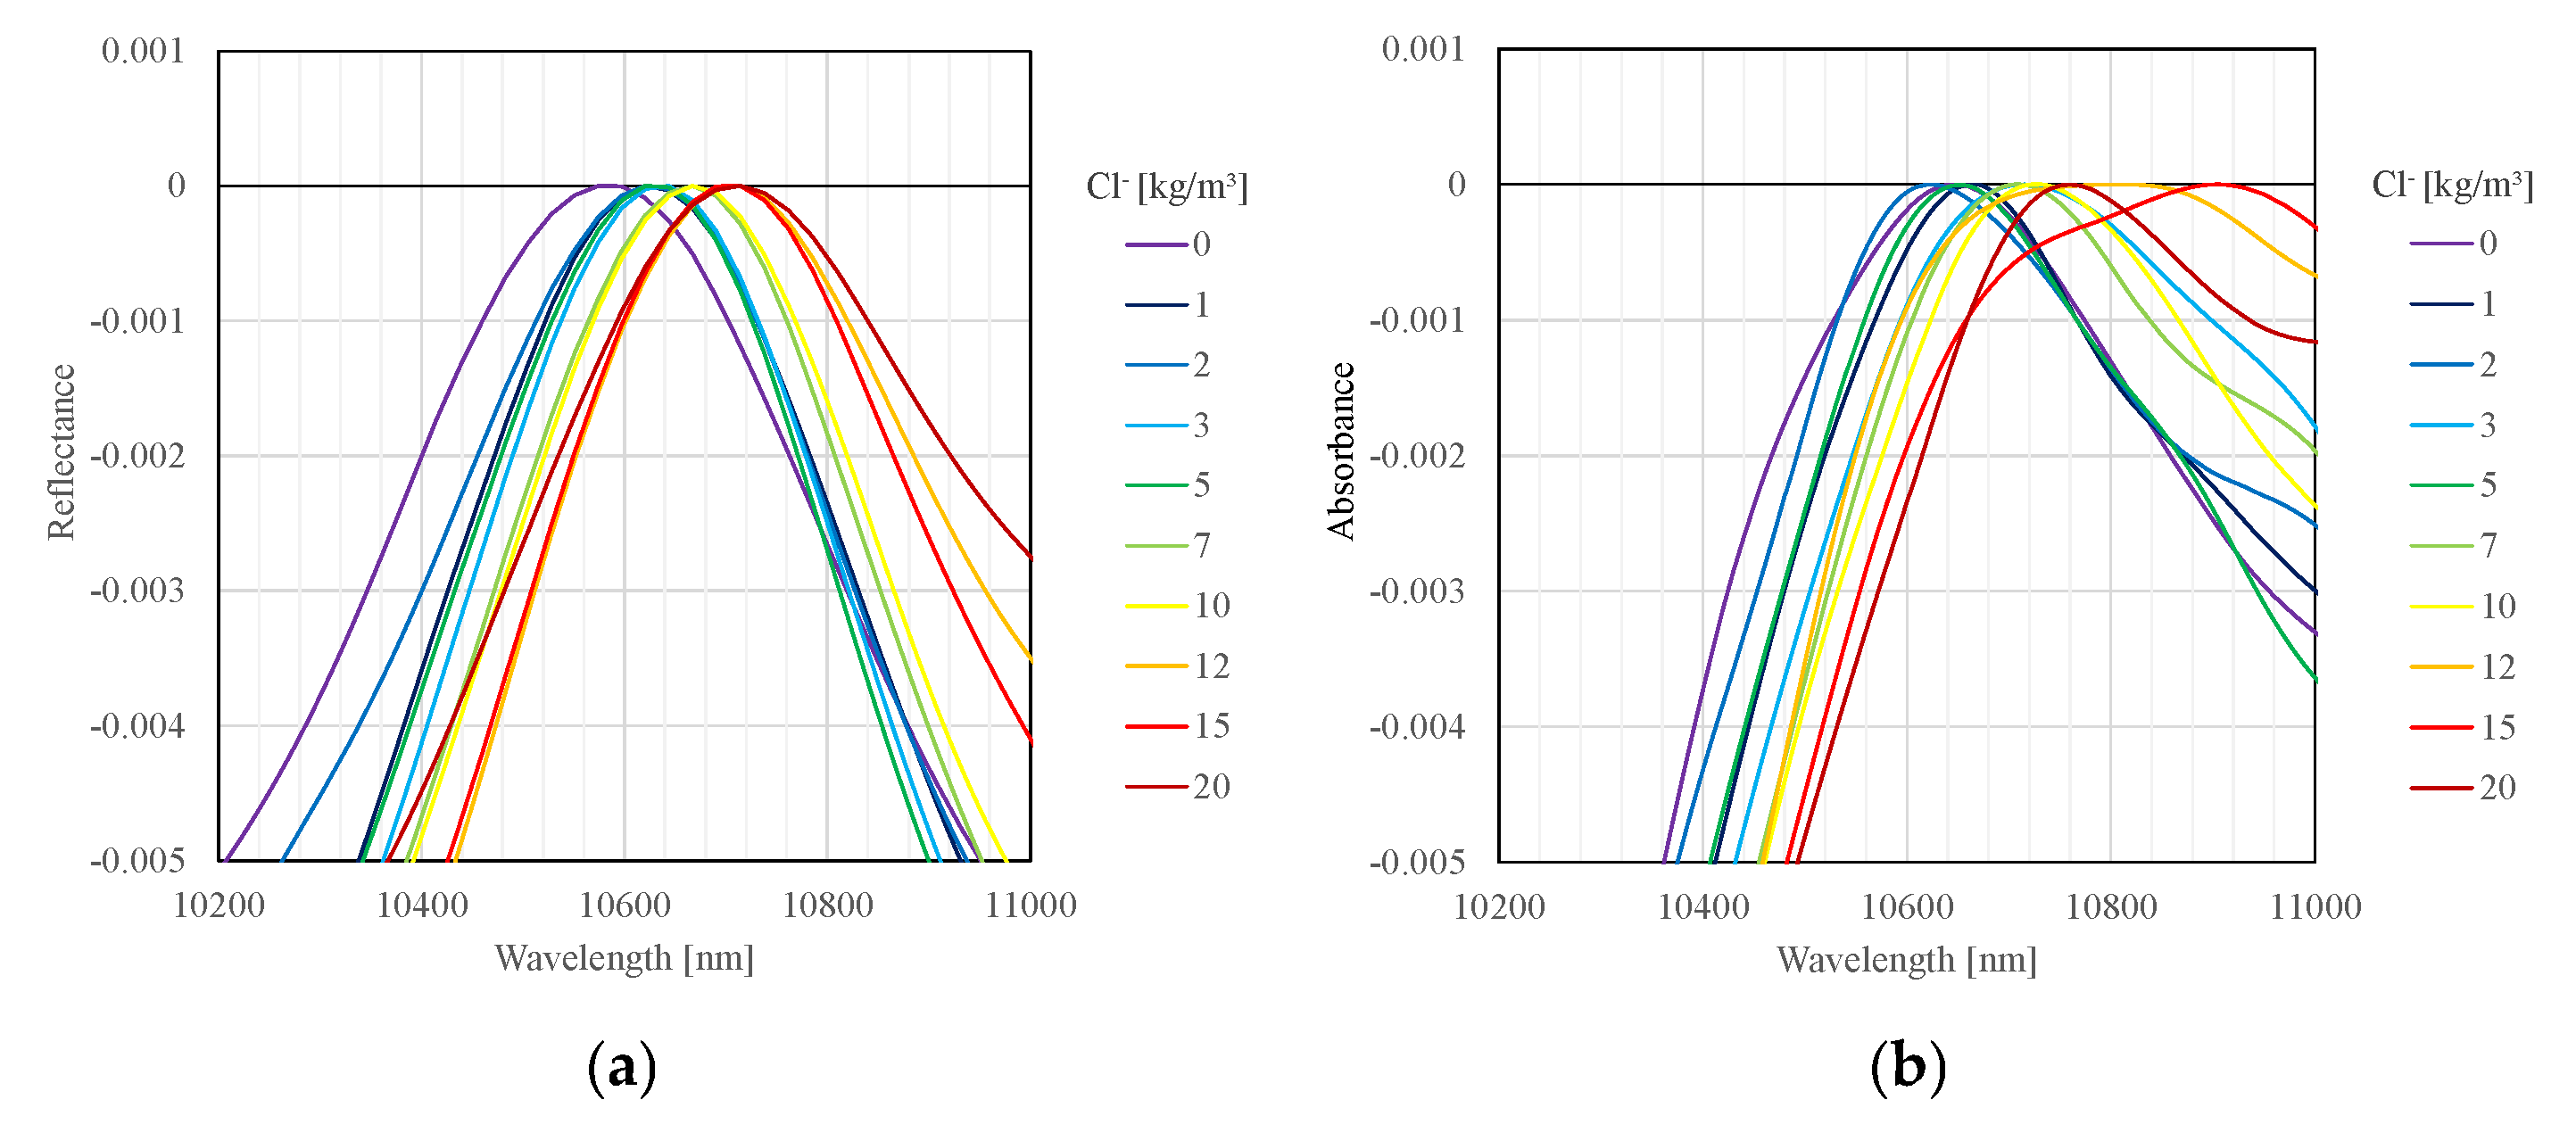
To visualize the variation in peak wavelength observed in the measurement results, the surface spectra of specimens were baseline-corrected using the maximum value within the range of 10–11 μm.
Figure 4a shows the baseline-corrected data obtained by the FT-IR spectrometer, and
Figure 4b shows that obtained by the Ishimaru spectrometer. From
Figure 4, a tendency for the peak around 10.6 μm to shift towards longer wavelengths with increasing chloride ion concentration can be observed. This tendency was similarly exhibited across the three specimens and with both types of measurement instruments, confirming the reproducibility within this experiment.
Furthermore, to quantify this tendency, correlation with chloride ion concentration was analyzed using the wavelength at which the maximum value occurs as the peak wavelength.
Figure 5a shows the results of the analysis of data obtained by the FT-IR spectrometer, and
Figure 5b shows those obtained by the Ishimaru spectrometer. It can be confirmed that the peak wavelength around 10.6 μm has a positive correlation with chloride ion concentration.
Finally, to investigate whether the chloride ion concentration of specimens can be predicted from this tendency, calibration curves were created using the peak wavelength at which correlation was confirmed as a variable. Prediction accuracy for unknown samples was validated by comparing predicted values and measured values. The calibration curve for the FT-IR spectrometer is shown in Equation 1, and that for the Ishimaru spectrometer is shown in Equation 2.
Figure 6a shows the prediction results from the FT-IR spectrometer, and
Figure 6b shows the prediction results from the Ishimaru spectrometer. Although with low accuracy, it can be confirmed that the concentration of chloride ions mixed into the cement paste specimens can be estimated using the calibration curve based on the peak wavelength around 10.6 µm as a variable.
To identify the factors behind the observed peak shift, peak identification was performed using the database by Horgnies et al. [
3]. As a result, the peak around the wavelength of 10.6 μm originates from the Si-O bonds of calcium–silicate hydrate (C-S-H). According to the study by Ping Yu et al. [
4], a tendency for the peak originating from the Si-O bonds of C-S-H to shift towards shorter wavelengths with a decrease in the Ca/Si ratio has been reported. Therefore, in this experiment, it is inferred that specimens with higher chloride ion concentrations had a higher surface Ca/Si ratio.
Next, we discuss the factors that led to the observed correlation between the peak wavelength and chloride ion concentration. According to the study by Nakamura et al. [
5], it has been reported that C-S-H has a high chloride ion adsorption capacity. Therefore, it is speculated that the adsorption of chloride ions in C-S-H may have influenced the peak wavelength around 10.6 μm.
4. Conclusions
This study analyzed the mid-infrared spectra of concrete using an imaging 2D Fourier spectrometer (The Ishimaru spectrometer, Kagawa University, Kagawa, Japan) to investigate the concentration evaluation. Findings confirmed that the peak around 10.6 μm correlated with chloride concentration, allowing for its estimation. Future challenges involve the application to external chloride attack, improvement of accuracy and 2D distribution evaluation, and elucidation of the underlying factors.


