1. Introduction
U-rib steel deck plates are widely adopted in structures such as long-span bridges in straits and urban expressways with stringent construction constraints due to their lightweight and short construction period. In recent years, several types of fatigue cracks caused by increased traffic of heavy vehicles have been reported in U-rib steel deck plates. Among these, cracks that propagate and penetrate from the root of the U-rib welded joint to the bead surface under wheel loads (hereinafter referred to as “bead penetration cracks”) have been frequently observed [
1].
Furthermore, fatigue cracks can be mitigated by early detection, but early detection at stages where no paint film cracking or rust formation occurs is difficult with visual inspections, which are generally performed. Non-destructive testing methods, such as ultrasonic testing and eddy current testing, can be used to detect cracks before coating cracking occurs. However, these methods often require the installation and removal of scaffolding for close inspection, and considering the vast number of weld lines to be inspected, they are not efficient for inspecting the entire weld line [
2].
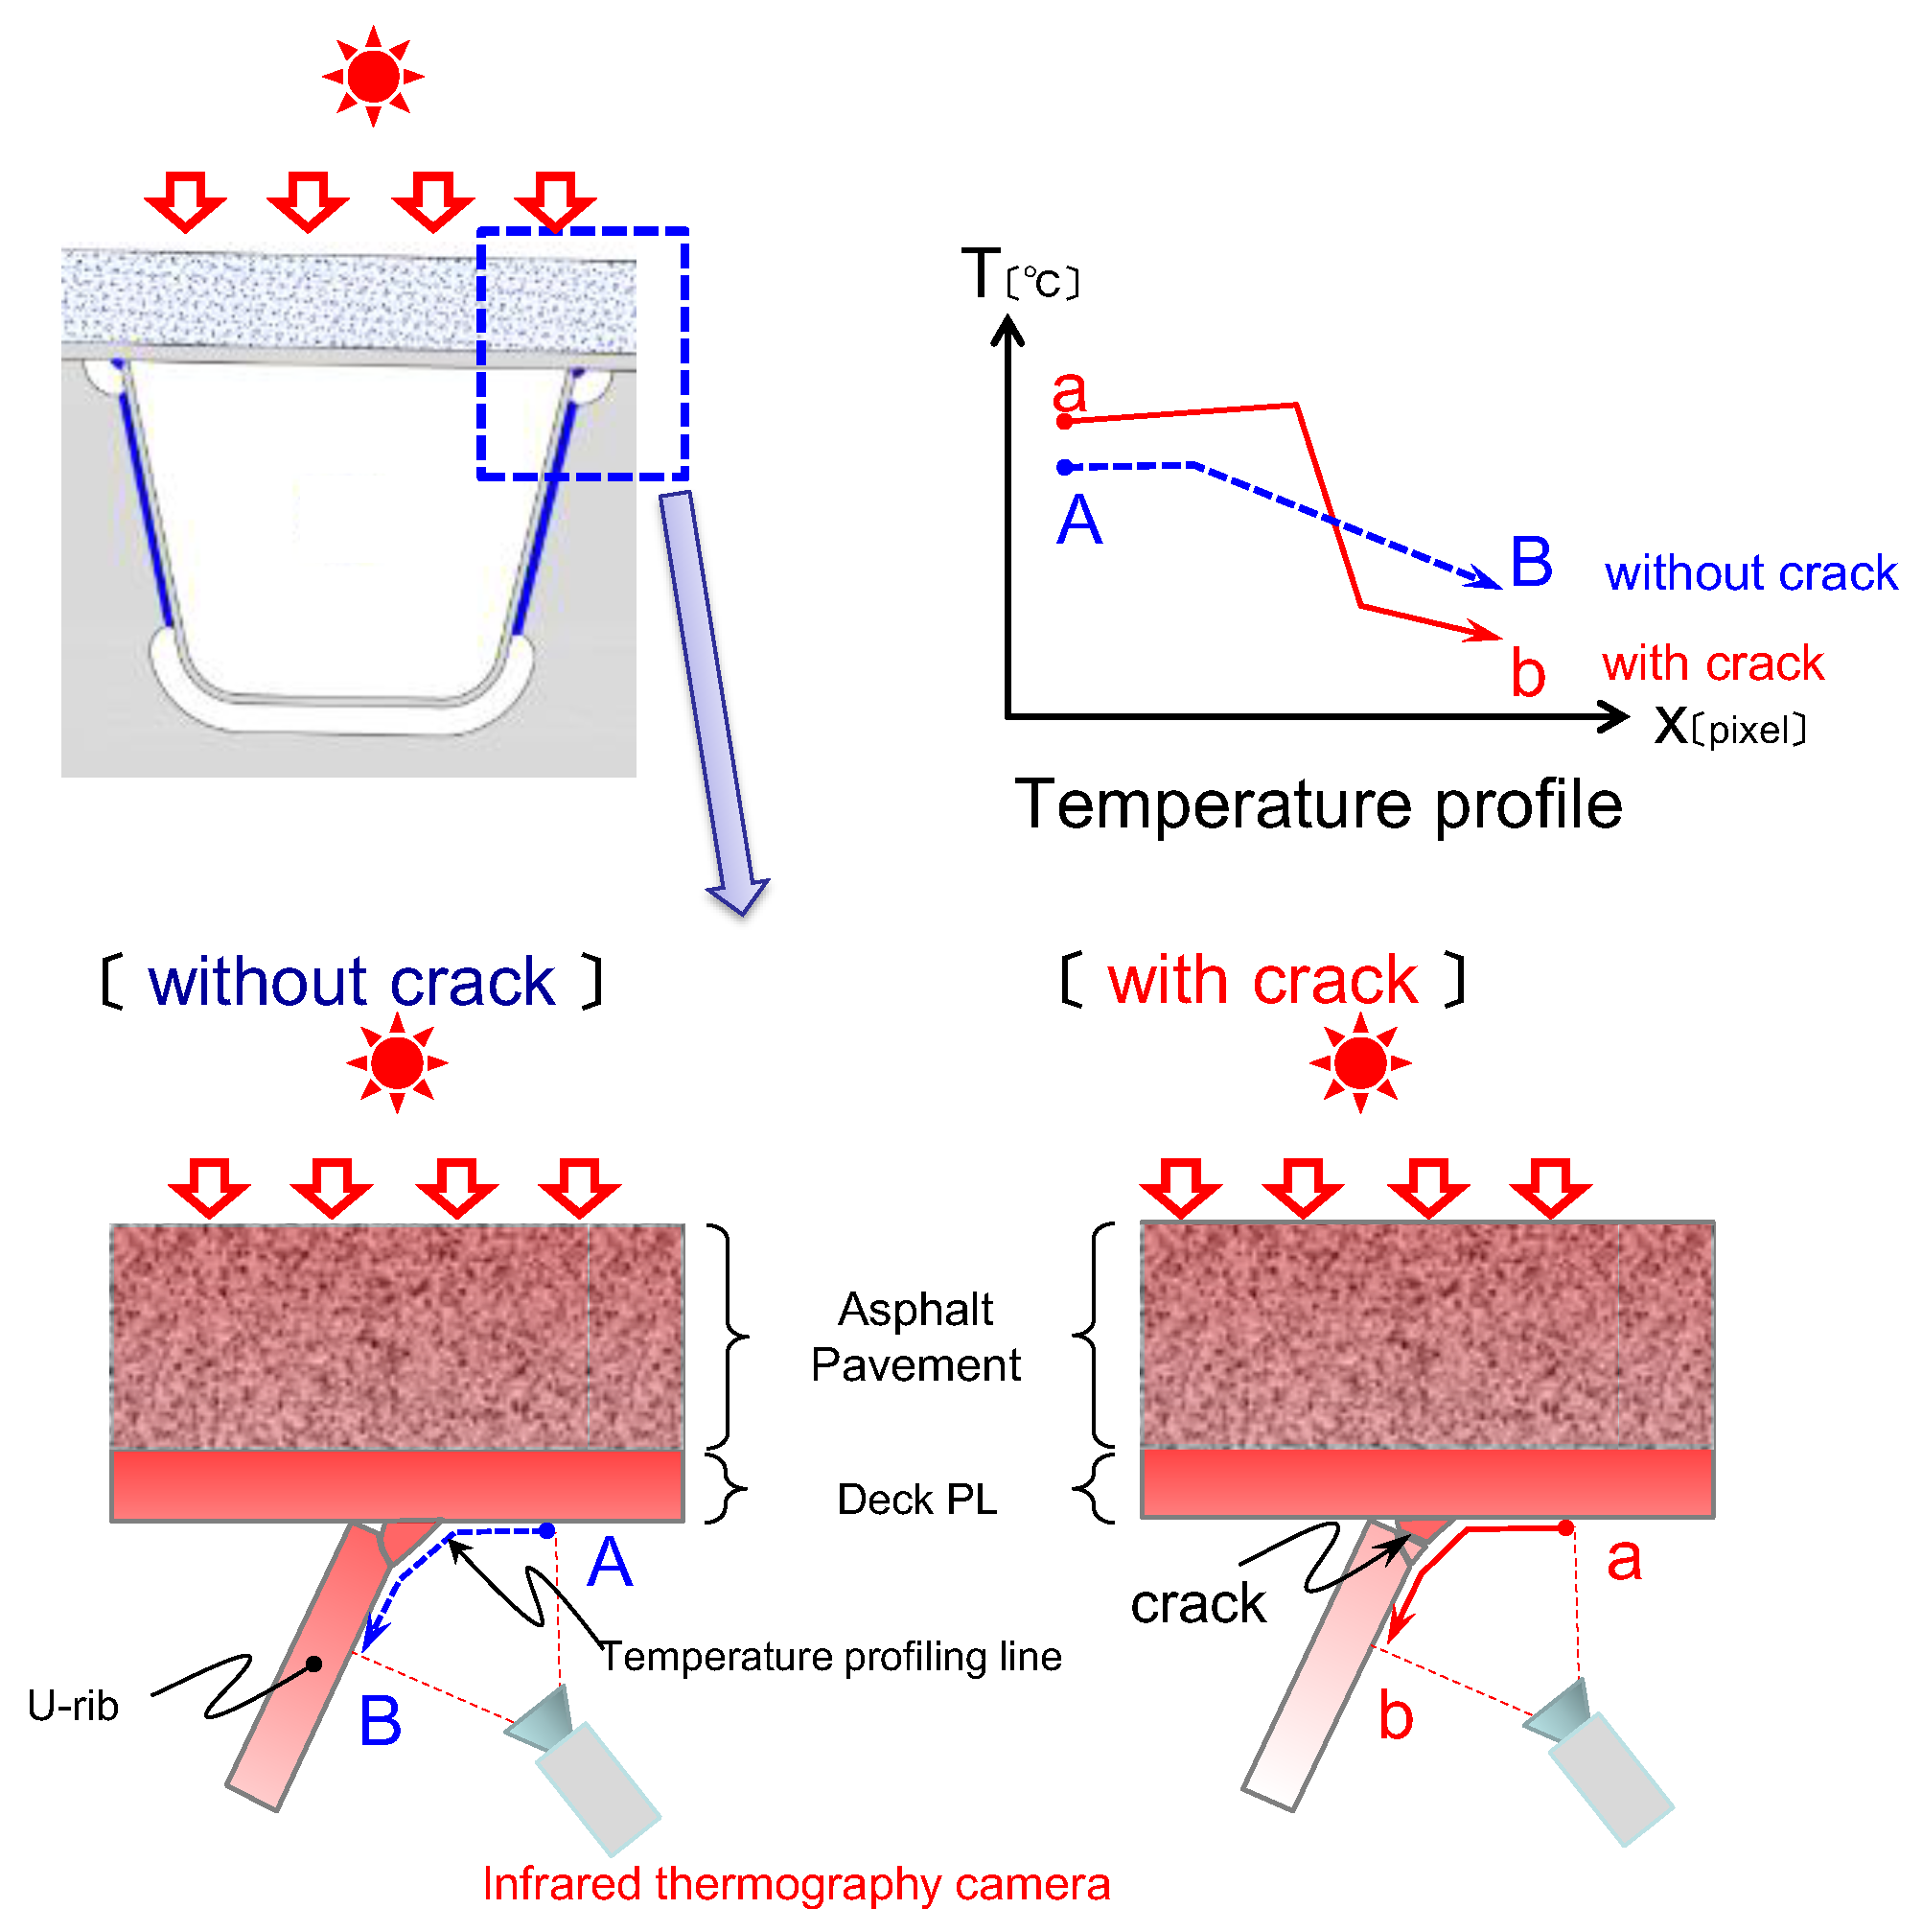
Honshu-Shikoku Bridge Expressway Company (hereinafter referred to as “HSBE”) has researched and developed a method for detecting bead penetration cracks using infrared thermography-based temperature distribution measurements (hereinafter referred to as the “T-gap method”) (see
Figure 1). The key feature of this method is that it can detect cracks non-destructively and from a distance at stages where no coating cracking has occurred. This method enables the measurement of the entire weld line by moving the camera while taking measurements [
3,
4].
The T-gap method is adopted practically by Honshu-Shikoku Bridges and other Japanese bridges; however, the method has never been applied to bridges outside Japan. A previous study showed that the detectable period is from March to November in Japan, with the period from March to September being preferable when the temperature difference between the deck plate and the U-rib is 0.7 °C or higher. However, the measurement period is based on results from bridge locations, Seto Inland Sea region, Japan [
5]. When applying this to regions with different climates, the measurement period must be set based on data such as solar altitude. Then, a test of the T-gap method in Denmark, which is located at a higher latitude than Japan, was planned to grasp its applicability.
2. Test Object
The test of the T-gap method was carried out on the New Little Belt Bridge, which is a suspension bridge located in Denmark. Since 2017, cracks have been observed on the orthotropic deck by visual inspection. The bridge owner is the Danish Road Directorate.
The Little Belt Suspension Bridge carries the E20 motorway over the crossing between the island of Funen and the mainland of Jutland, connecting east and west Denmark. The bridge was opened in 1970, and it carries three lanes of traffic in each direction. The average daily traffic number is around 100,000 vehicles, which is close to maximum capacity. The suspension bridge has a main span of 600 m and two side spans of 240 m for a total length of 1080 m. The approach spans have a total length of 620 m, giving a total length of 1700 m for the entire connection.
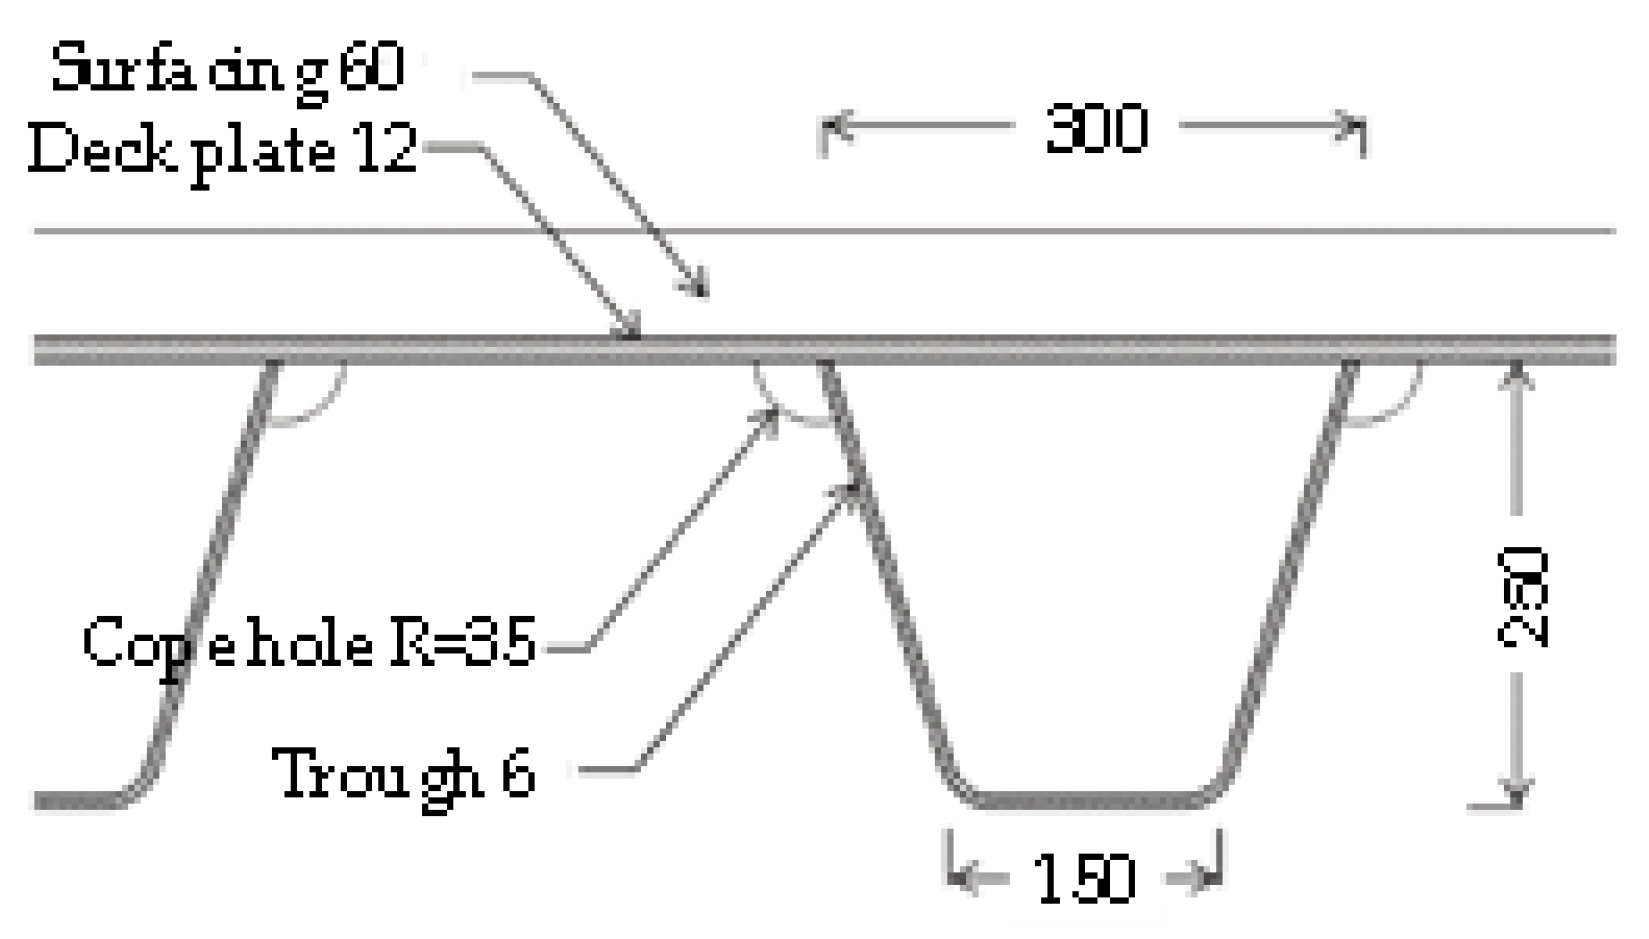
The orthotropic steel deck structure with closed troughs acts as the upper flange in the closed steel box girder. The troughs have a height of 250 mm, a thickness of 6 mm, a width at the deck of 300 mm, and a spacing of 600 mm (
Figure 2). Troughs are welded with a partial penetration butt weld with up to 2 mm root gap. The plated bulkheads have a spacing of typically 3.0 m, but the spacing can vary down to 1.0 m at site connections. There are R = 35 mm cope holes at the trough-to-deck weld.
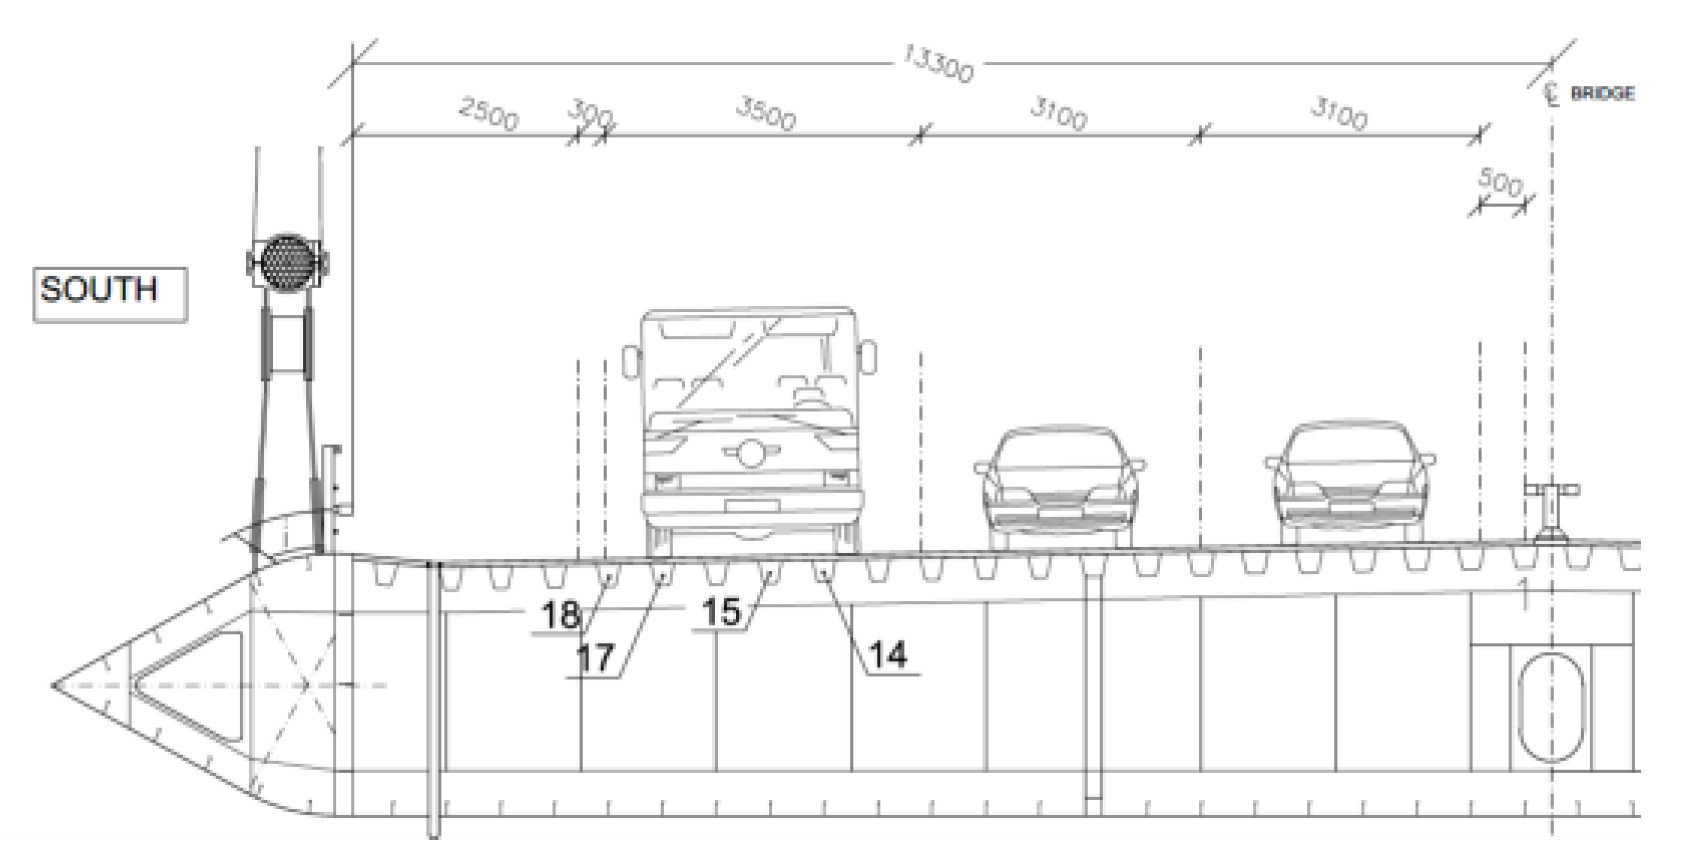
During a general visual routine inspection in the summer of 2017, indications of fatigue cracks in the orthotropic steel deck were first observed, and non-destructive testing (hereinafter referred to as “NDT”) inspections were carried out later in 2017. All crack indications were in the trough-to-deck plate welds of No. 14 and 17, which correspond to the typical wheel positions of heavy vehicles in the slow lane (
Figure 3). A total of 10 cracks were found. The cracks initiate at the weld root near the bulkhead cope hole and propagate through the weld bead to the face. Since 2017, a number of fatigue cracks, at approximately 160 locations, have been observed in orthotropic steel deck [
6].
3. Method and Conditions
Considering the locations of detected cracks in 2017, No. 14 and 17 of the bead lines were tested by the T-gap method in this test. The test uses the infrared thermography camera, a tripod, and a PC, which has the measuring system. The tripod is moved at intervals of 500 mm in the longitudinal direction while taking still images via the thermography camera. Specifications of the employed infrared camera are shown in
Table 1. The test was carried out in July 2024. After the test, the detected cracks were confirmed and compared using magnetic particle testing (MT).
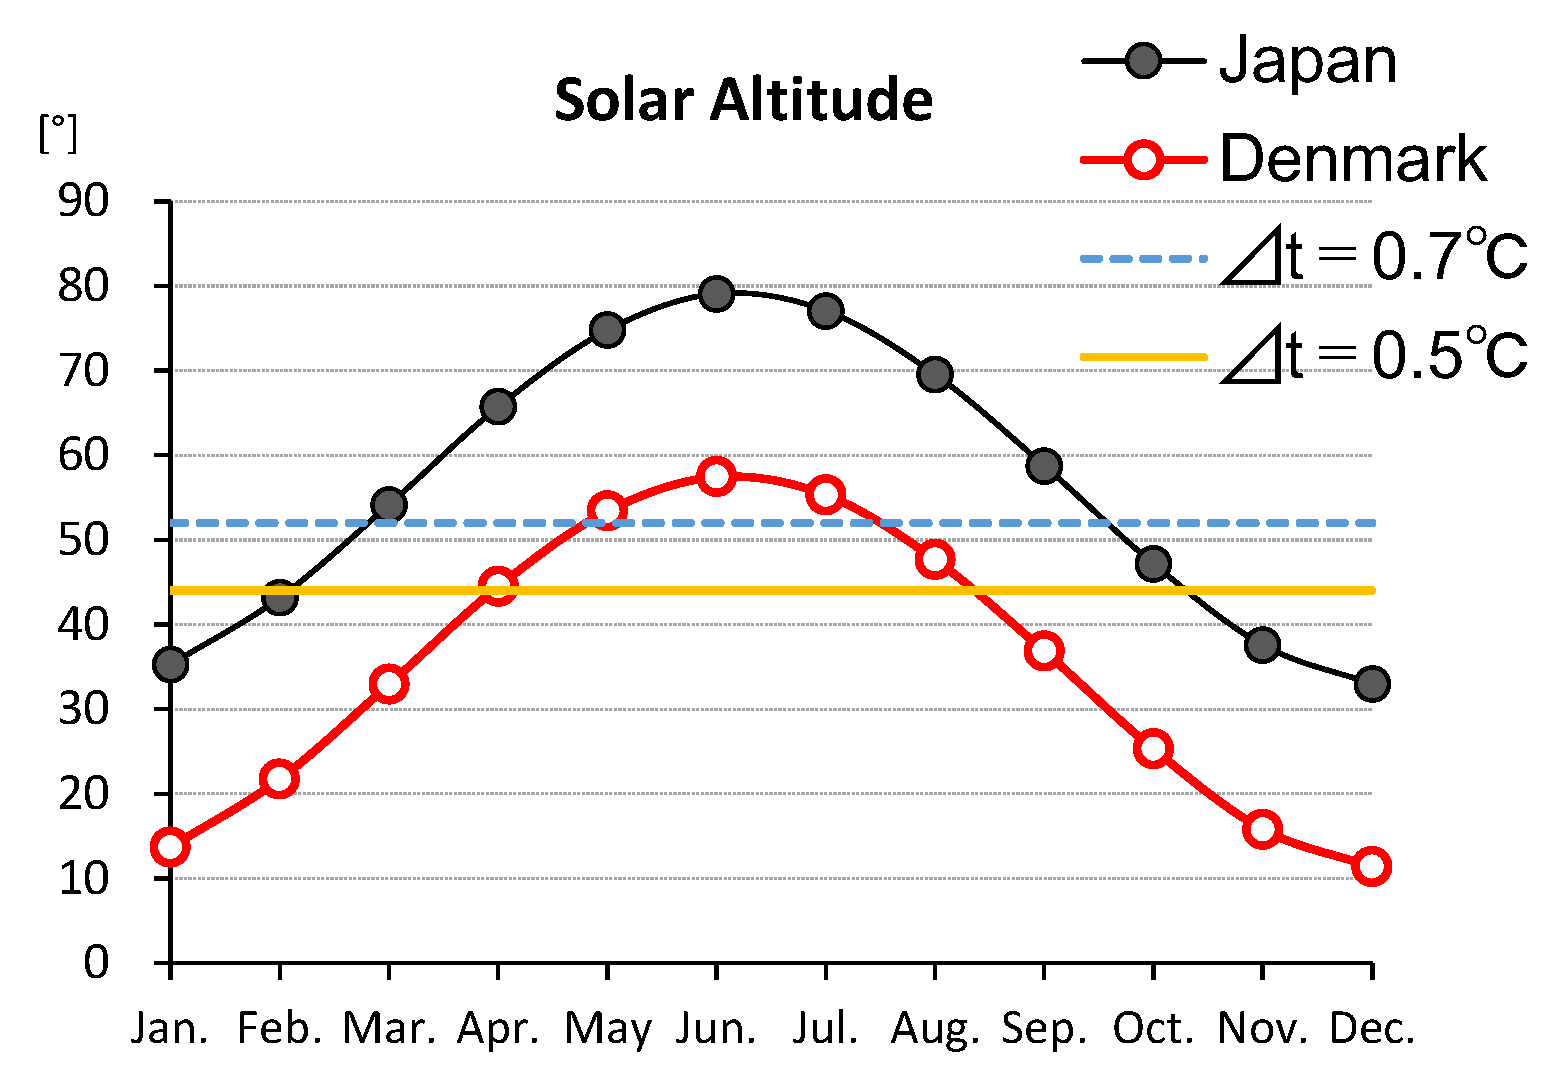
In order to detect cracks of approximately 40 mm, a temperature difference of more than 0.5 °C between the deck plate and the U-rib and 1 mm/Pixel shooting resolution are necessary [
5]. Furthermore, a temperature difference of more than 0.7 °C is desirable. This means that March to September is desirable in Japan to obtain the temperature difference of 0.7 °C.
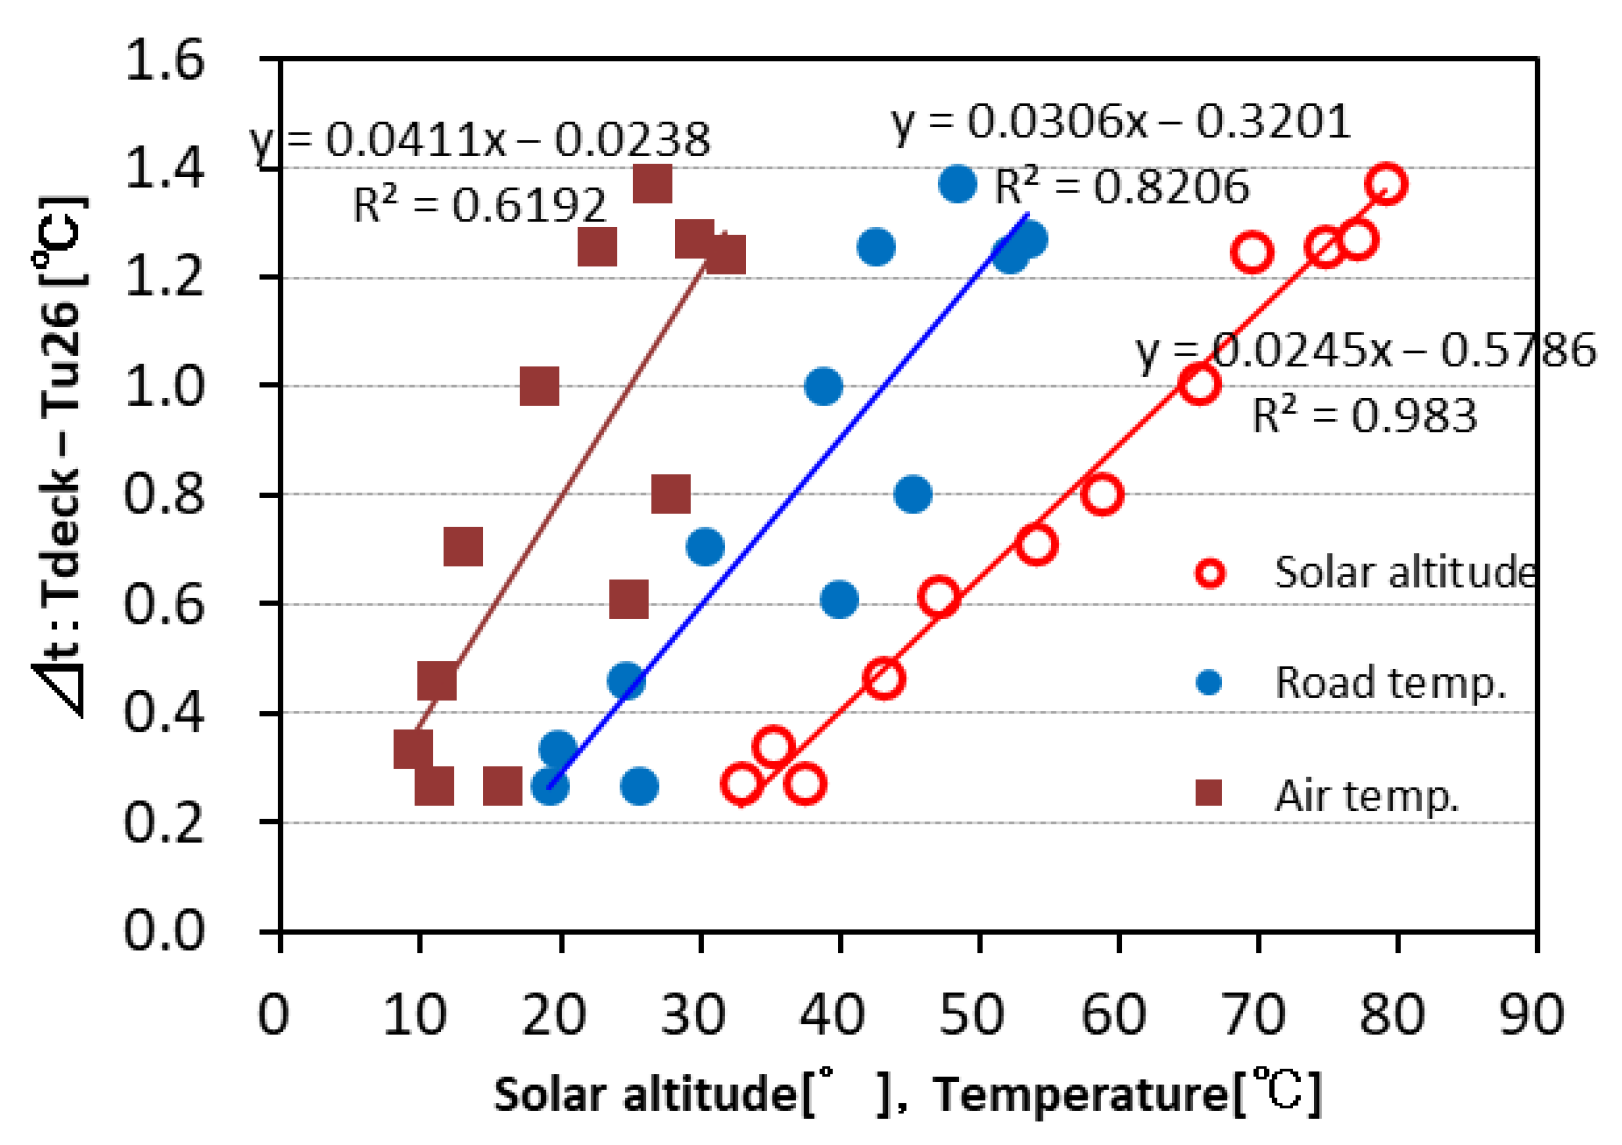
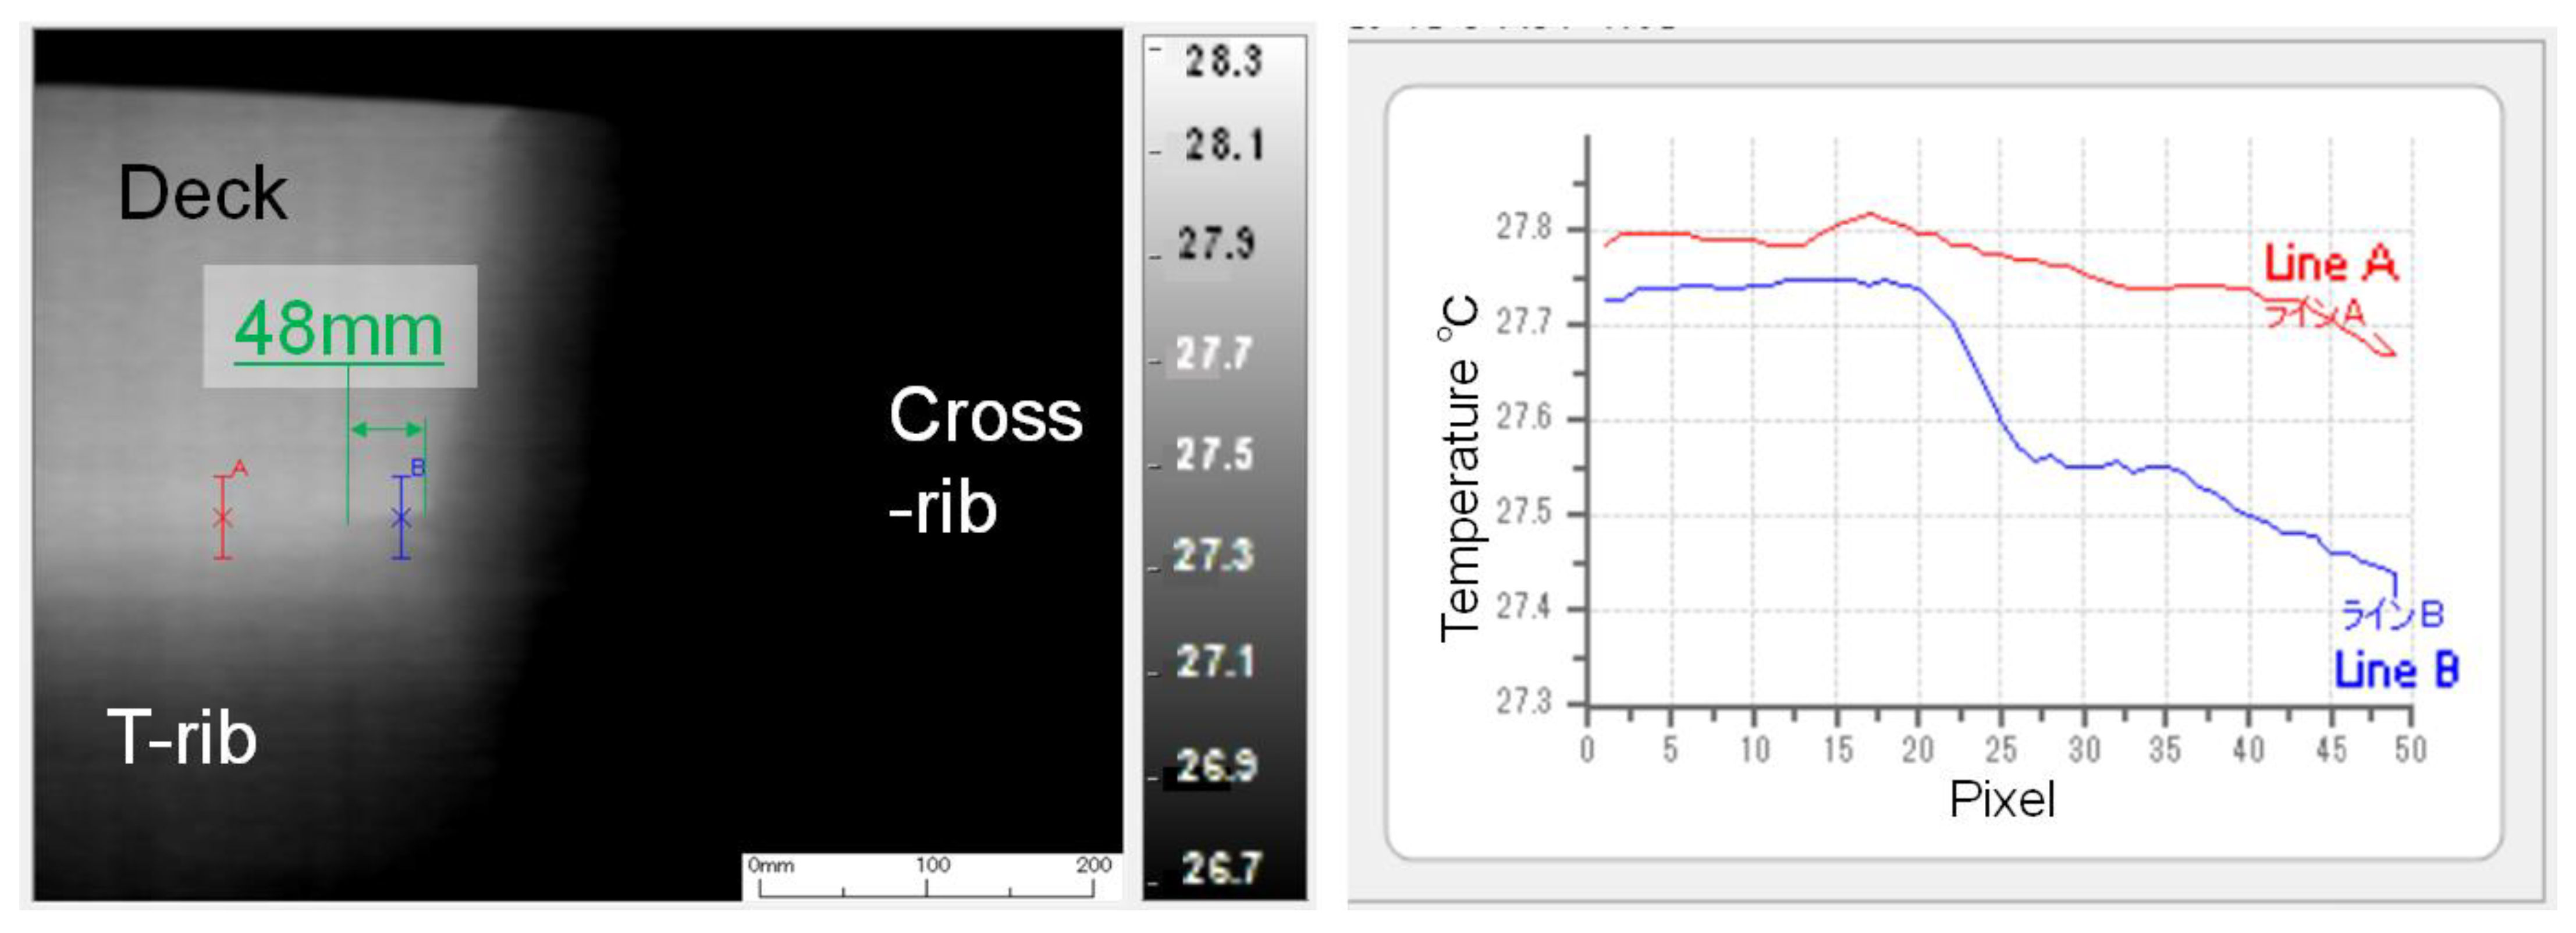
One of the crucial factors generating the temperature difference is the solar altitude. Among the road temperature, air temperature, and solar altitude, the solar altitude showed the highest correlation with the temperature difference of R2 = 0.983 (see
Figure 4).
Figure 5 shows the comparison of solar altitude in Japan and Denmark. Denmark has a lower solar altitude because Denmark is located in a higher-latitude area. Then, based on the desirable duration of March to September in Japan, May to August is desirable in Denmark.
4. Results
The test, three cracks were detected using the T-gap method. Results are shown in
Figure 6 and
Table 2. All detected cracks are located at the weld root near the bulkhead cope hole.
A more-than-0.5 °C temperature difference is necessary for the T-gap method, but the temperature difference was from about 0.15 to 0.33 °C in the test. Nevertheless, the T-gap method can accurately detect cracks, as confirmed by a comparison with MT results. This implies the possibility of changing the recommended value of the temperature gap. However, further testing and research are necessary.
Author Contributions
Conceptualization, H.K.; methodology, K.O. and Y.M.; software, Y.M.; validation, Y.M.; formal analysis, Y.M.; investigation, H.K., M.N., K.O. and Y.M.; resources, K.O. and Y.M.; data curation, K.O. and Y.M.; writing—original draft preparation, H.K.; writing—review and editing, H.K.; visualization, H.K.; supervision, M.N.; project administration, M.N.; funding acquisition, M.N. All authors have read and agreed to the published version of the manuscript.
Funding
This research received no external funding. The APC was funded by the Honshu-Shikoku Bridge Expressway Company Limited.
Institutional Review Board Statement
Not applicable.
Informed Consent Statement
Not applicable.
Data Availability Statement
No new data were created or analyzed in this study. Data sharing is not applicable to this article.
Acknowledgments
This research was conducted in collaboration with the Danish Road Directorate, and COWI A/S. Authors sincerely thank all involved for their generous support.
Conflicts of Interest
Authors Hiromasa Kobayashi and Masahiro Nishitani were employed by Honshu-Shikoku Bridge Expressway Co., Ltd. Authors Kazuki Ono and Yoshiaki Mizokami were employed by Honshi-Expressway Bridge Engineering Co., Ltd. Authors declare that the research was conducted in the absence of any commercial or financial relationships that could be construed as a potential conflict of interest.
References
- Japan Society of Civil Engineers. Fatigue of Orthotropic Steel Deck (2010 Rebooking); Maruzen Publishing: Tokyo, Japan, 2010; pp. 63–71. [Google Scholar]
- Mizokami, Y.; Okumura, A.; Oto, T.; Izumi, Y.; Sakagami, T. Development of automatic crack detection device for bead-penetrating crack in orthotropic steel deck by temperature gap method using infrared thermography. J. Struct. Eng. 2018, 64, 573–582. [Google Scholar]
- Izumi, Y.; Sakagami, T.; Mizokami, Y.; Moriyama, A.; Sannomiya, H. Detection and evaluation of underside crack by temperature gap method using infrared thermography. In Proceedings of the 71th Annual Conference of the Japan Society of Civil Engineers, Ehime, Japan, 5–7 September 2016; Volume VI-710, pp. 1419–1420. [Google Scholar]
- Uenishi, K.; Izumi, Y.; Sakagami, T.; Mizokami, Y.; Moriyama, A. Underside crack detection by temperature gap method using infrared thermography. In Proceedings of the 72th Annual Conference of the Japan Society of Civil Engineers, Fukushima, Japan, 6–8 September 2017; Volume IV-944, pp. 1887–1888. [Google Scholar]
- Mizokami, Y.; Kobayashi, Y.; Izumi, Y.; Sakagami, T. Remote NDT technique for through-weld crack in orthotropic steel deck by temperature gap measurement using infrared thermography. Struct. Eng. 2015, 22, 47–56. [Google Scholar]
- Sørensen, P.L.; Bitsch, N.; Præst, J. Experiences with repairs of fatigue cracks in an orthotropic steel deck, New Little Belt Bridge, Denmark. In Proceedings of the 12th International Conference on Bridge Maintenance, Safety and Management, Miami, FL, USA, 21–25 June 2024; pp. 2969–2976. [Google Scholar]
| Disclaimer/Publisher’s Note: The statements, opinions and data contained in all publications are solely those of the individual author(s) and contributor(s) and not of MDPI and/or the editor(s). MDPI and/or the editor(s) disclaim responsibility for any injury to people or property resulting from any ideas, methods, instructions or products referred to in the content. |
© 2025 by the authors. Licensee MDPI, Basel, Switzerland. This article is an open access article distributed under the terms and conditions of the Creative Commons Attribution (CC BY) license (https://creativecommons.org/licenses/by/4.0/).
