Proceeding Paper

Multimode Cavity Optomechanics †

1
School of Science and Technology, Physics Division, University of Camerino, I-62032 Camerino (MC), Italy
2
INFN, Sezione di Perugia, 06123 Perugia PG, Italy
3
CNR-INO, L.go Enrico Fermi 6, I-50125 Firenze, Italy
*
Authors to whom correspondence should be addressed.
Presented at the 11th Italian Quantum Information Science conference (IQIS2018), Catania, Italy, 17–20 September 2018.
Proceedings 2019, 12(1), 54; https://doi.org/10.3390/proceedings2019012054
Published: 12 November 2019
(This article belongs to the Proceedings of 11th Italian Quantum Information Science conference (IQIS2018))

Abstract

:
We study theoretically and experimentally the behavior of an optomechanical system where two vibrating dielectric membranes are placed inside a driven Fabry-Pérot cavity. We prove that multi–element systems of mechanical resonators are suitable for enhancing optomechanical performances, and we report a ∼2.47 gain in the optomechanical coupling strength of the membrane relative motion with respect to the single membrane case. With this configuration it is possible to enable cavity optomechanics in the strong single-photon coupling regime.

1. Introduction

Multi–element systems of micro/nano–mechanical resonators offer promising prospects for enhanced optomechanical performances [1,2,3,4,5,6,7,8] and coherent control [9,10]. We report on the first experimental characterization of the optical and optomechanical properties of a sandwich constituted of two parallel membranes within an optical cavity. We find that the optomechanical coupling strength of the two–membrane system is enhanced of a factor ∼2.47 with respect to the single membrane configuration.

2. Results

2.1. Theory

We consider the case of two different movable dielectric membranes placed inside a Fabry–Pérot cavity of length L, composed of two identical mirrors with electric field reflection and transmission coefficient r and t, respectively. The Fabry–Pérot cavity is driven by an external laser. The membranes can be modeled as dielectric slabs of thickness L m , j and index of refraction n j (where the index j = 1 , 2 distinguishes the parameters of the two membranes) with transmission and reflection coefficients r j and t j . The optical resonance frequencies correspond to the maxima of transmission of the whole cavity shown in Figure 1a). It is possible to calculate the mode frequency shift of the optomechanical system described above as a function of the positions of the membranes inside the Fabry–Pérot cavity:
δ ω = π c L H 2 π q 1 λ , 2 π q 2 λ
where H is a function describing the shift of the resonance frequency of the optomechanical cavity depending on the position of the two membranes q 1 and q 2 [8]. We show the mode frequency shift δ ω normalized to the free–spectral–range of the cavity, FSR = π c / L in Figure 1b), as a function of the membrane positions q 1 and q 2 normalized to the wavelength. We assumed the parameters of the experimental setup, i.e., λ = 1064 nm, R = 0.99994 , L = 90 mm, L m = 104 nm, and n = 2.17 . The optomechanical couplings strength G j is defined as the derivative of the optical mode frequencies with respect to the position of the j-th membrane q j :
G j = F S R λ H 2 π q ˜ 1 , 2 π q ˜ 2 q ˜ j ,
where q ˜ j = q j / λ is the scaled dimensionless position. In the case of a single membrane the single-photon optomechanical coupling has the same structure of Equation (2) and we get (halfway between a node and an antinode of the field) G sing max = F S R λ 4 R m . To study the enhancement of the coupling due to the presence of the second membrane, we compare the maximum derivative of the function H 2 π q ˜ 1 , 2 π q ˜ 2 with respect to 4 R m . In Figure 1b) we show the cavity mode frequency shifts, and superimposed the vector plot of the corresponding gradient field, which gives the values of the two couplings G 1 and G 2 . The largest optomechanical coupling is achieved simultaneously by the two membranes, and in this case G 1 = G 2 . At this point the cavity mode frequency is sensitive at first order only to the variation of the distance between the two membranes, q = q 2 q 1 , and is not sensitive to shifts of the CoM of the two membranes, Q. This implies that the coupling of the CoM is zero, G Q = 0 , while that of the relative coordinate is | G q | = | G j | [5]. From these considerations we obtain that:
| G j max | = 1 1 R m | G sing max |
.
In the case of R m = 0.4 , as in our experiment, the optomechanical coupling may increase up to a factor ∼2.72. Equation (3) is valid for values of R m not too close to one [7,8].

2.2. Estimation of the Optomechanical Coupling Strength
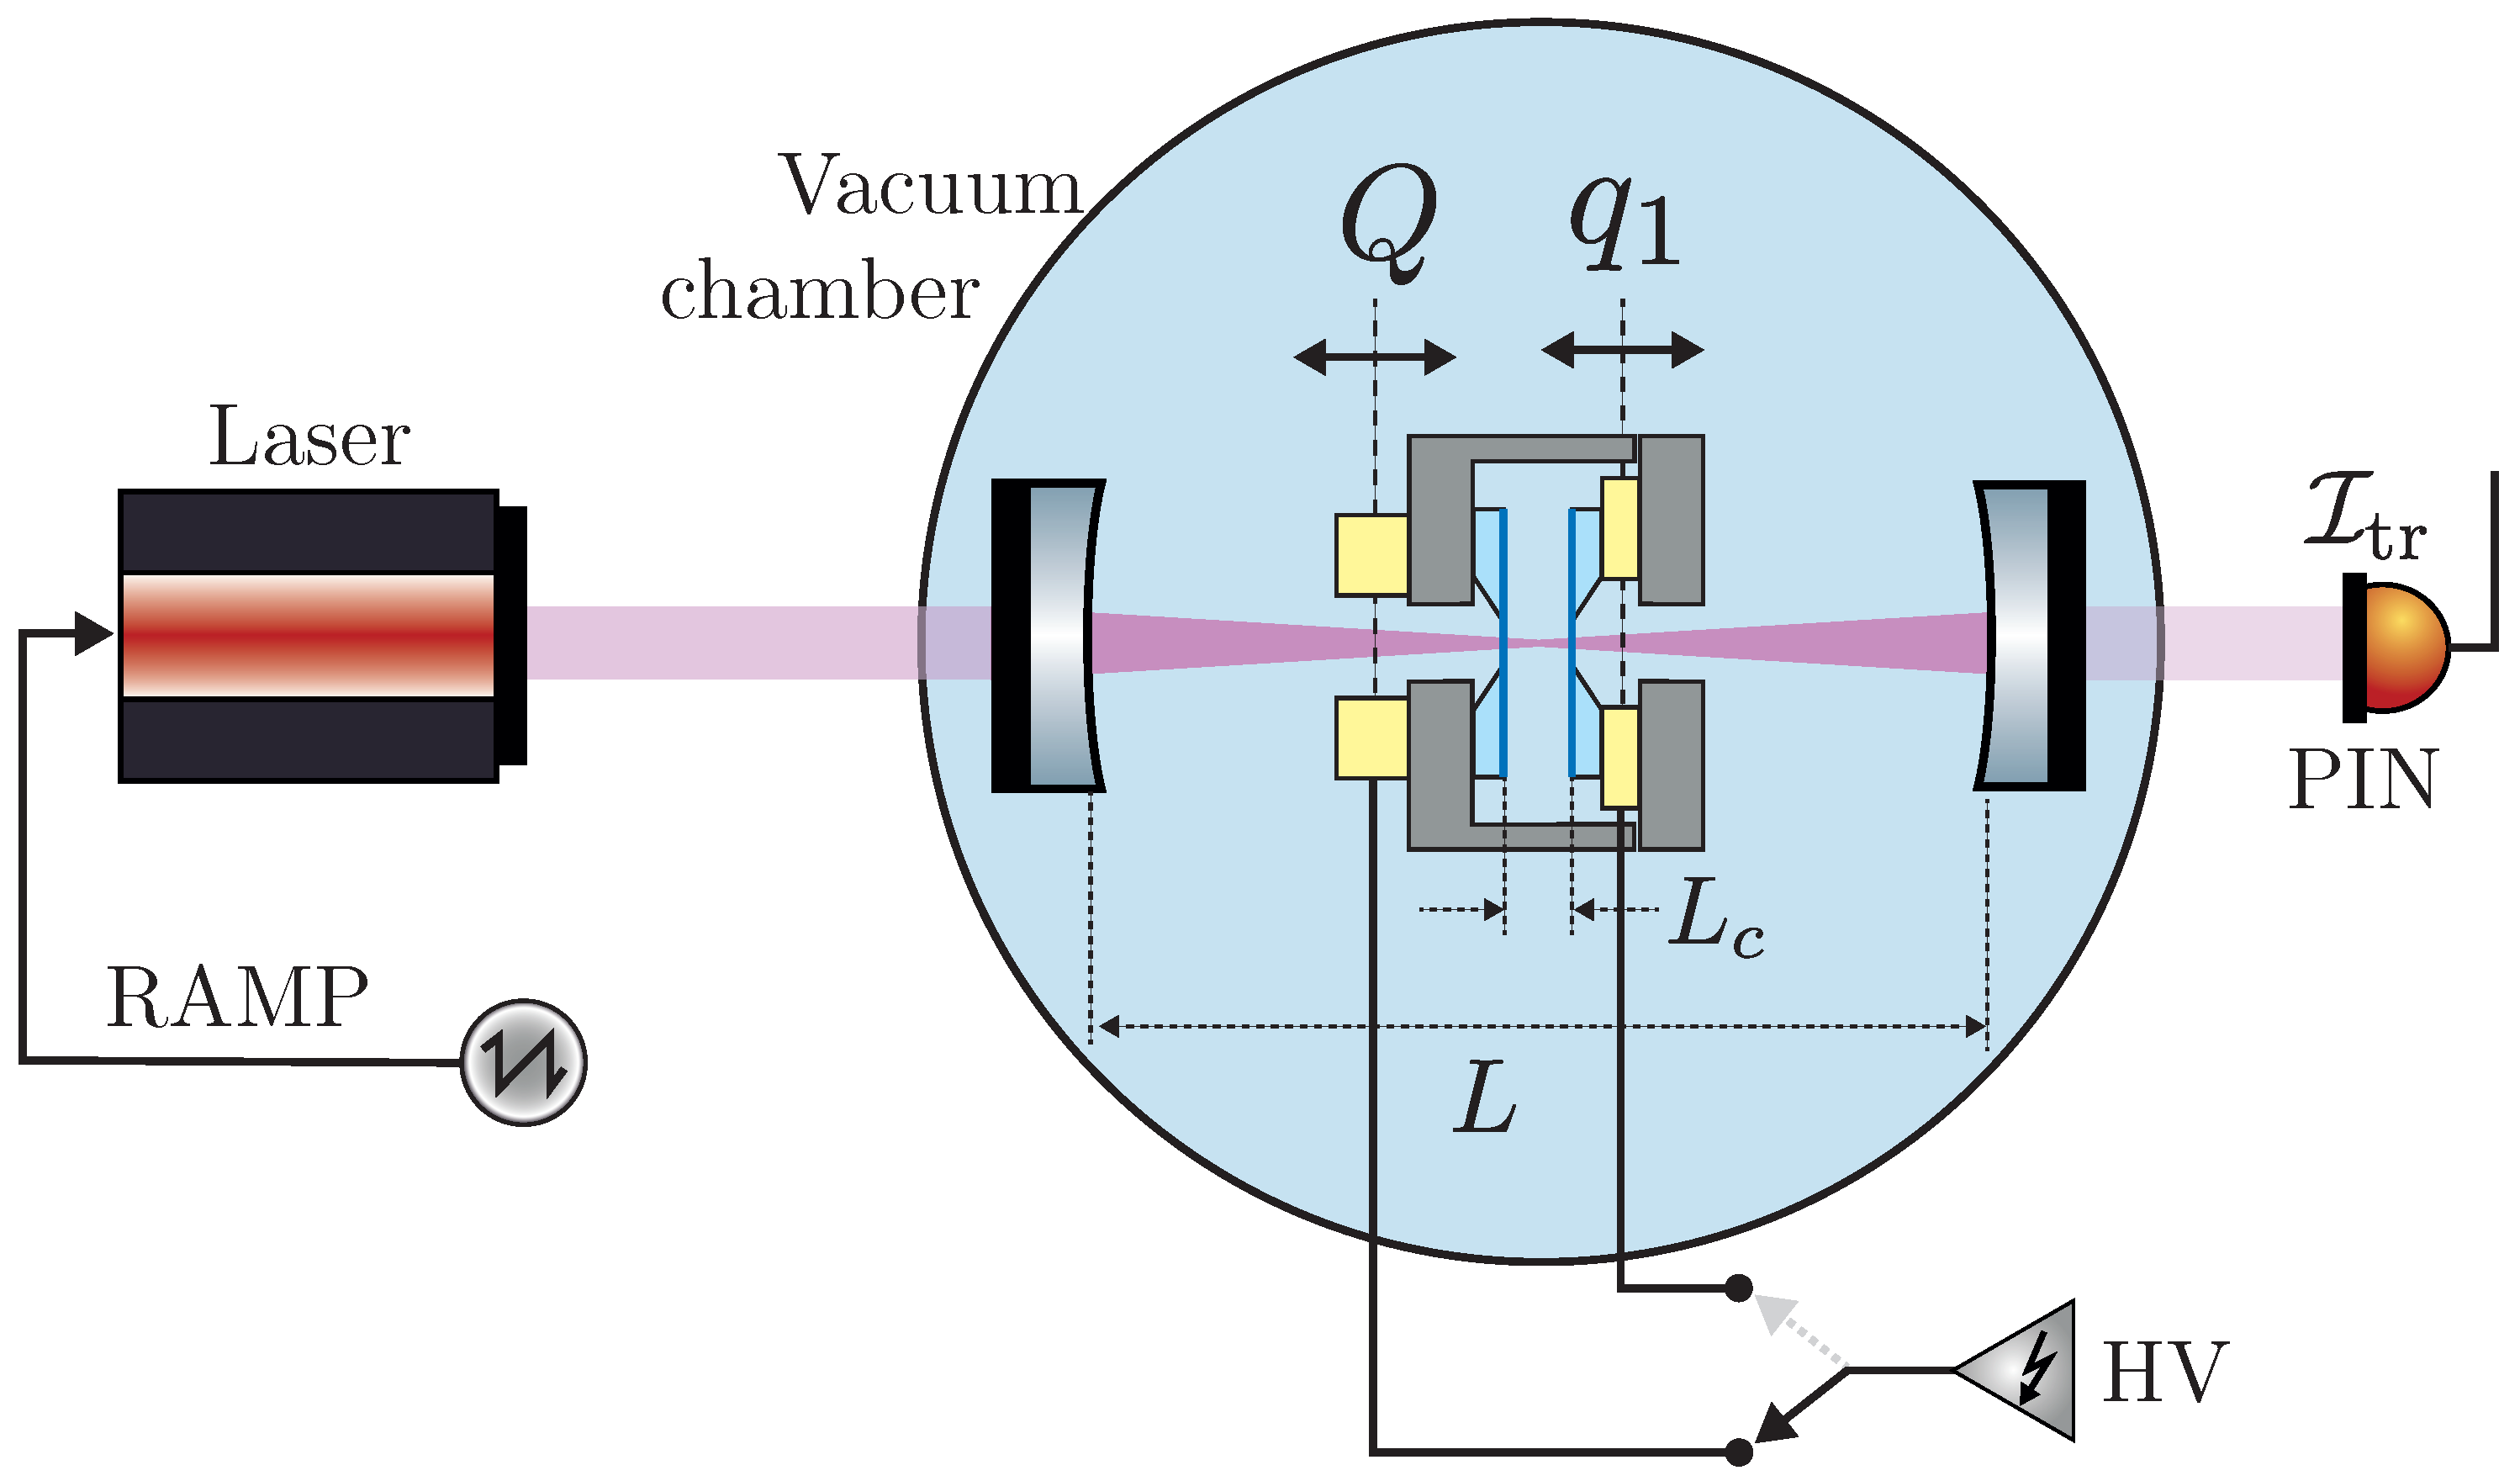
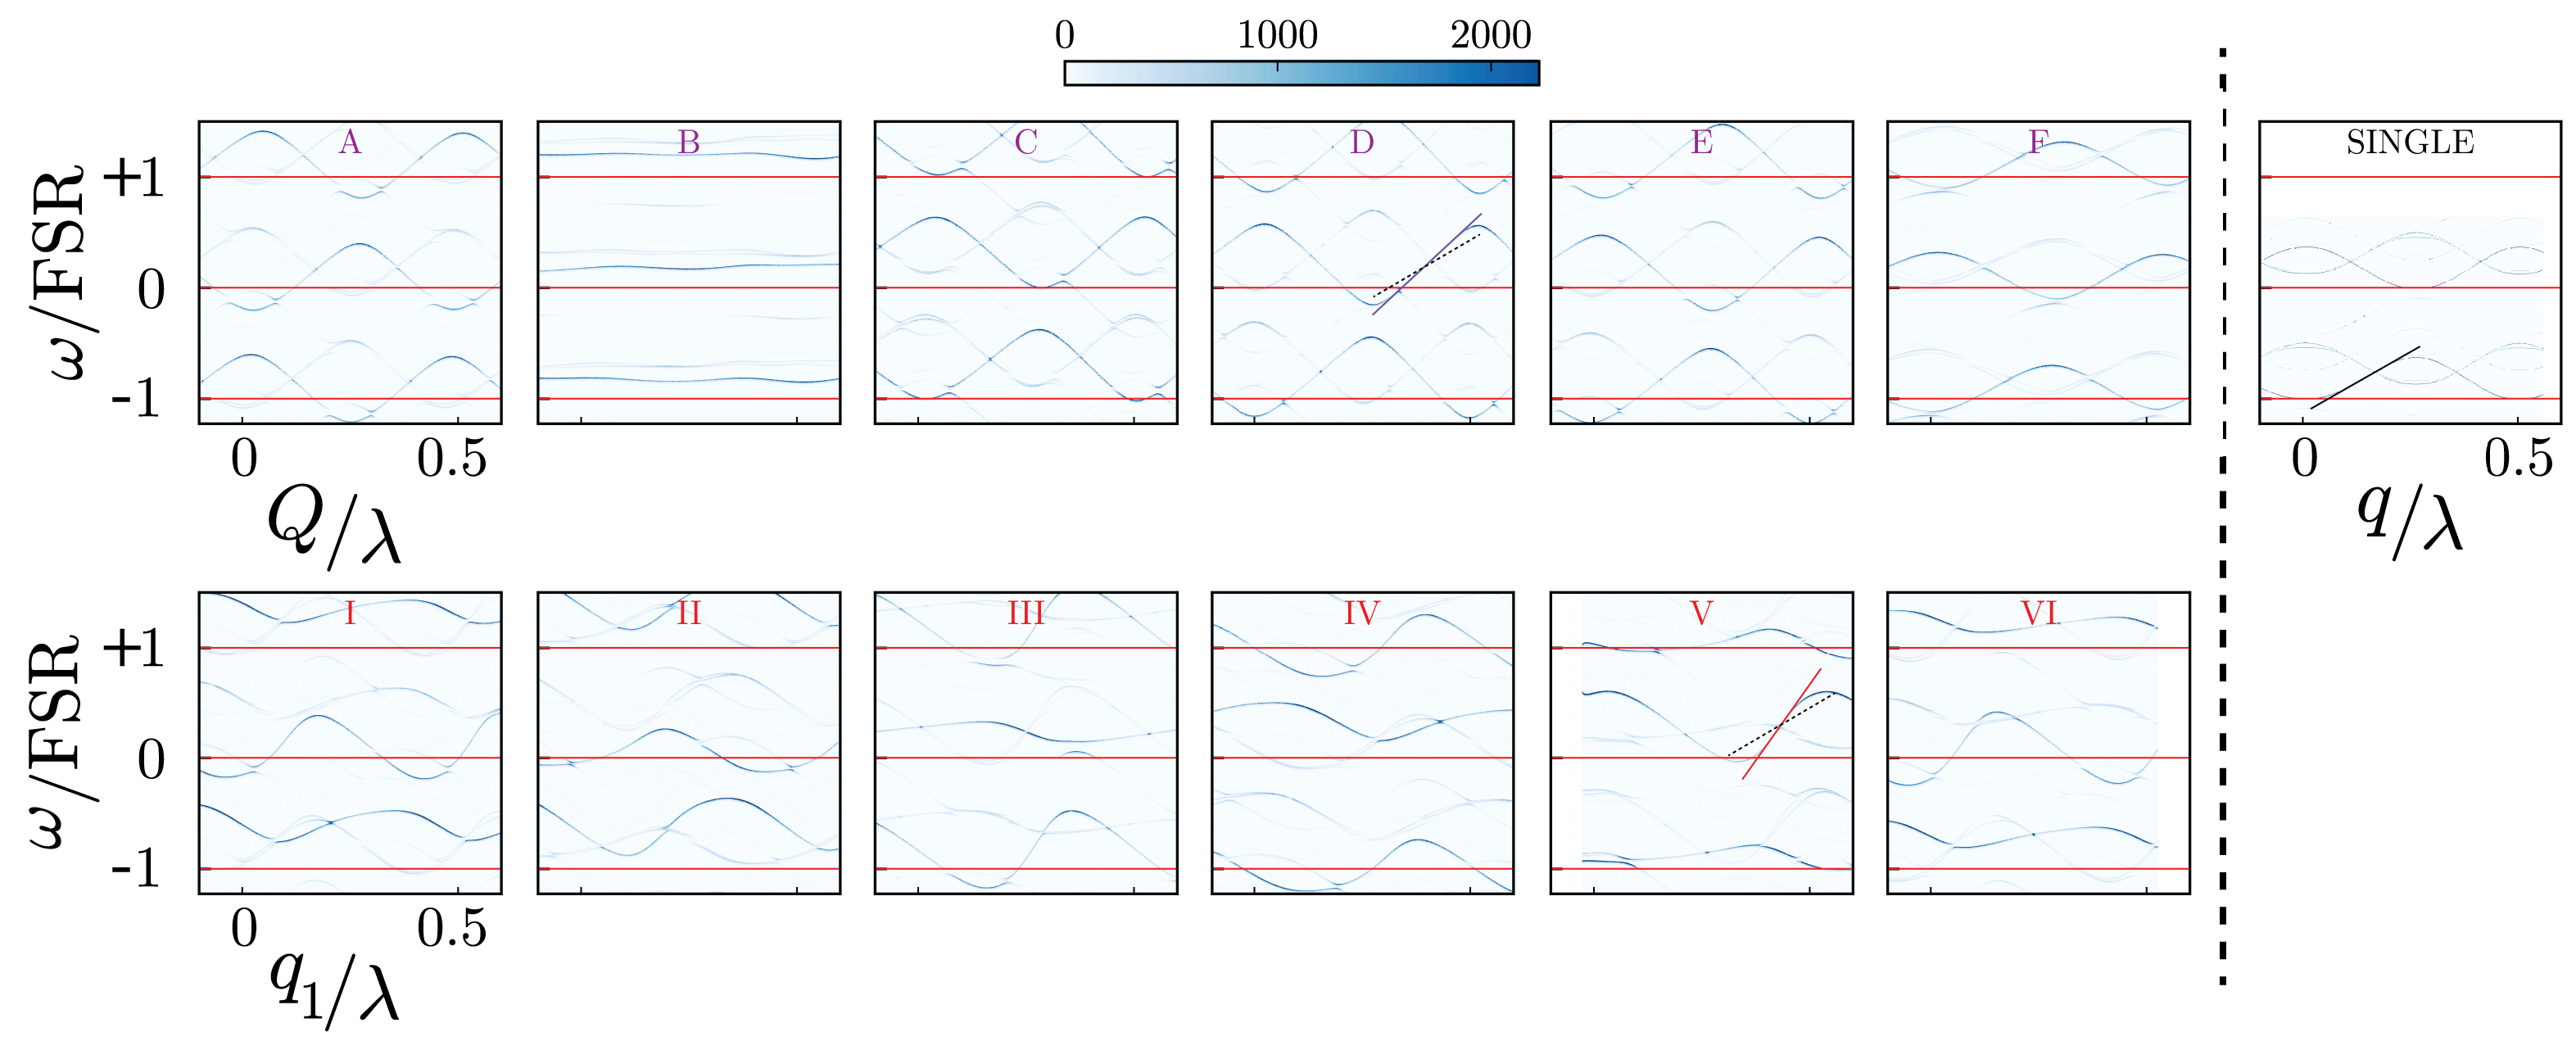
The membrane–sandwich we use in our experiment, is constituted of two low–stress SiN square membranes, with a side of 1 mm, and a thickness of 100 nm. One of the membranes is glued on a piezo, which scans the membrane–cavity length. The whole membrane–sandwich mount is attached to another piezo to displace in a controlled way the CoM of the two membranes. To estimate the optomechanical coupling strength achievable with our system, we inserted the membrane–sandwich in an optical cavity 90 mm–long [11,12] and we placed the optomechanical system in a vacuum chamber evacuated to 5 × 10 7 mbar as shown in Figure 2. We compare the frequency shift of the optomechanical cavity in the presence of the membrane–sandwich with the case of a single membrane inside shown in the top–right panel of Figure 3. The spectra of the cavity mode are reported in Figure 3. We detect the light of a 1064 nm laser transmitted by the optomechanical cavity while scanning the laser frequency for different positions of the membrane(s). The slope of the black lines represents the maximum achievable single membrane optomechanical strength G sing max 2 π × 3.47 MHz nm 1 . The other panels show the result for the two membranes case. Due to the design of the membrane sandwich, we can either vary the CoM, Q, for different values of the membrane distance q, or q 1 for different positions of q 2 . Figure 3 (panels A–F), reports the spectra obtained by scanning the CoM, Q, for different values of the membrane distance q, as indicated by the lines A–F in Figure 1b. The blue line on panel D corresponds to the blue circle in Figure 1b, and they indicate the highest coupling G Q max 2 π × 5.67 MHz nm 1 achieved in this case. It corresponds to an increase in the optomechanical strength of a factor ∼1.63 with respect to the single membrane case. In the panels I–VI, we report the spectra obtained by scanning the position q 1 for different positions of q 2 , as indicated by the lines I–VI in Figure 1b. The red line on panel V corresponds to the red circle in Figure 1b, and they show the highest achieved coupling G 1 max 2 π × 8.59 MHz nm 1 . In this case the optomechanical coupling strength increases by a factor ∼2.47 respect to the single membrane case.
Figure 2. Experimental setup for the measurements reported in Figure 3. The light of a laser at 1064 nm wavelength transmitted by an optical cavity of length L = 90 mm containing the membrane sandwich of thickness L m = 104 nm, and distance L c = 24 μ m at rest, is revealed by a PIN photodiode ( I tr N ), while the frequency is scanned by applying a ramp signal (RAMP) to the piezo control of the laser. The positions of the two membranes are controlled by applying high-voltage (HV) to the piezos, which move the CoM, Q, and the cavity length, q 1 .
Proceedings 12 00054 g002
Figure 3. Mode frequency shift normalized to the FSR as a function of the CoM, Q, normalized to the wavelength, for different values of the membrane sandwich length q (panels A–F) and indicated by the lines A–F in Figure 1b. Panel D shows the positions for the highest achievable coupling G Q max indicated by the solid blue line. The panels I–VI represents the mode frequency shift normalized to the FSR, as a function of the membrane position q 1 , normalized to the wavelength, for different values of the position q 2 . Panel V shows the highest achievable coupling G 1 max . For comparison the single membrane result is added as a dotted black line in panels V and D which represents the maximum achievable coupling G sing max , shown in the panel on the top right.
Proceedings 12 00054 g003

3. Conclusions

We studied the optomechanical behaviour of a driven Fabry–Pérot cavity containing a two-membrane sandwich. From the cavity–mode frequency shift as a function of the membrane positions, we derived a ∼2.47 gain in the optomechanical coupling strength with respect to the single-membrane case. Such a configuration has the potential to enable cavity optomechanics in the strong single-photon coupling regime [3,4,5].

Acknowledgments

P. Piergentili acknowledges support from the European Union’s Horizon 2020 Programme for Research and Innovation under grant agreement No. 722923 (Marie Curie ETN - OMT). We also acknowledge the support of the European Union Horizon 2020 Programme for Research and Innovation through the Project No. 732894 (FET Proactive HOT).

References

  1. Bhattacharya, M.; Meystre, P. Multiple membrane cavity optomechanics. Phys. Rev. A 2008, 78, 041801. [Google Scholar] [CrossRef]
  2. Hartmann, M.J.; Plenio, M.B. Steady State Entanglement in the Mechanical Vibrations of Two Dielectric Membranes. Phys. Rev. Lett. 2008, 101, 200503. [Google Scholar] [CrossRef]
  3. Xuereb, A.; Genes, C.; Dantan, A. Strong Coupling and Long-Range Collective Interactions in Optomechanical Arrays. Phys. Rev. Lett. 2012, 109, 223601. [Google Scholar] [CrossRef] [PubMed]
  4. Xuereb, A.; Genes, C.; Dantan, A. Collectively enhanced optomechanical coupling in periodic arrays of scatterers. Phys. Rev. A 2013, 88, 053803. [Google Scholar] [CrossRef]
  5. Li, J.; Xuereb, A.; Malossi, N.; Vitali, D. Cavity mode frequencies and strong optomechanical coupling in two-membrane cavity optomechanics. J. Opt. 2016, 18, 084001. [Google Scholar] [CrossRef]
  6. Nair, B.; Xuereb, A.; Dantan, A. Cavity optomechanics with arrays of thick dielectric membranes. Phys. Rev. A 2016, 94, 053812. [Google Scholar] [CrossRef]
  7. Li, J.; Li, G.; Zippilli, S.; Vitali, D.; Zhang, T. Enhanced entanglement of two different mechanical resonators via coherent feedback. Phys. Rev. A 2017, 95, 043819. [Google Scholar] [CrossRef]
  8. Piergentili, P.; Catalini, L.; Bawaj, M.; Zippilli, S.; Malossi, N.; Natali, R.; Vitali, D.; Di Giuseppe, G. Two-membrane cavity optomechanics. New J. Phys. 2018, 20, 101001. [Google Scholar] [CrossRef]
  9. Ludwig, M.; Marquardt, F. Quantum Many-Body Dynamics in Optomechanical Arrays. Phys. Rev. Lett. 2013, 111, 073603. [Google Scholar] [CrossRef] [PubMed]
  10. Weaver, M.J.; Buters, F.; Luna, F.; Eerkens, H.; Heeck, K.; de Man, S.; Bouwmeester, D. Coherent optomechanical state transfer between disparate mechanical resonators. Nat. Commun. 2017, 8, 824. [Google Scholar] [CrossRef] [PubMed]
  11. Rossi, M.; Kralj, N.; Zippilli, S.; Natali, R.; Borrielli, A.; Pandraud, G.; Serra, E.; Di Giuseppe, G.; Vitali, D. Enhancing Sideband Cooling by Feedback-Controlled Light. Phys. Rev. Lett. 2017, 119, 123603. [Google Scholar] [CrossRef] [PubMed]
  12. Kralj, N.; Rossi, M.; Zippilli, S.; Natali, R.; Borrielli, A.; Pandraud, G.; Serra, E.; Giuseppe, G.D.; Vitali, D. Enhancement of three-mode optomechanical interaction by feedback-controlled light. Quantum Sci. Technol. 2017, 2, 034014. [Google Scholar] [CrossRef]
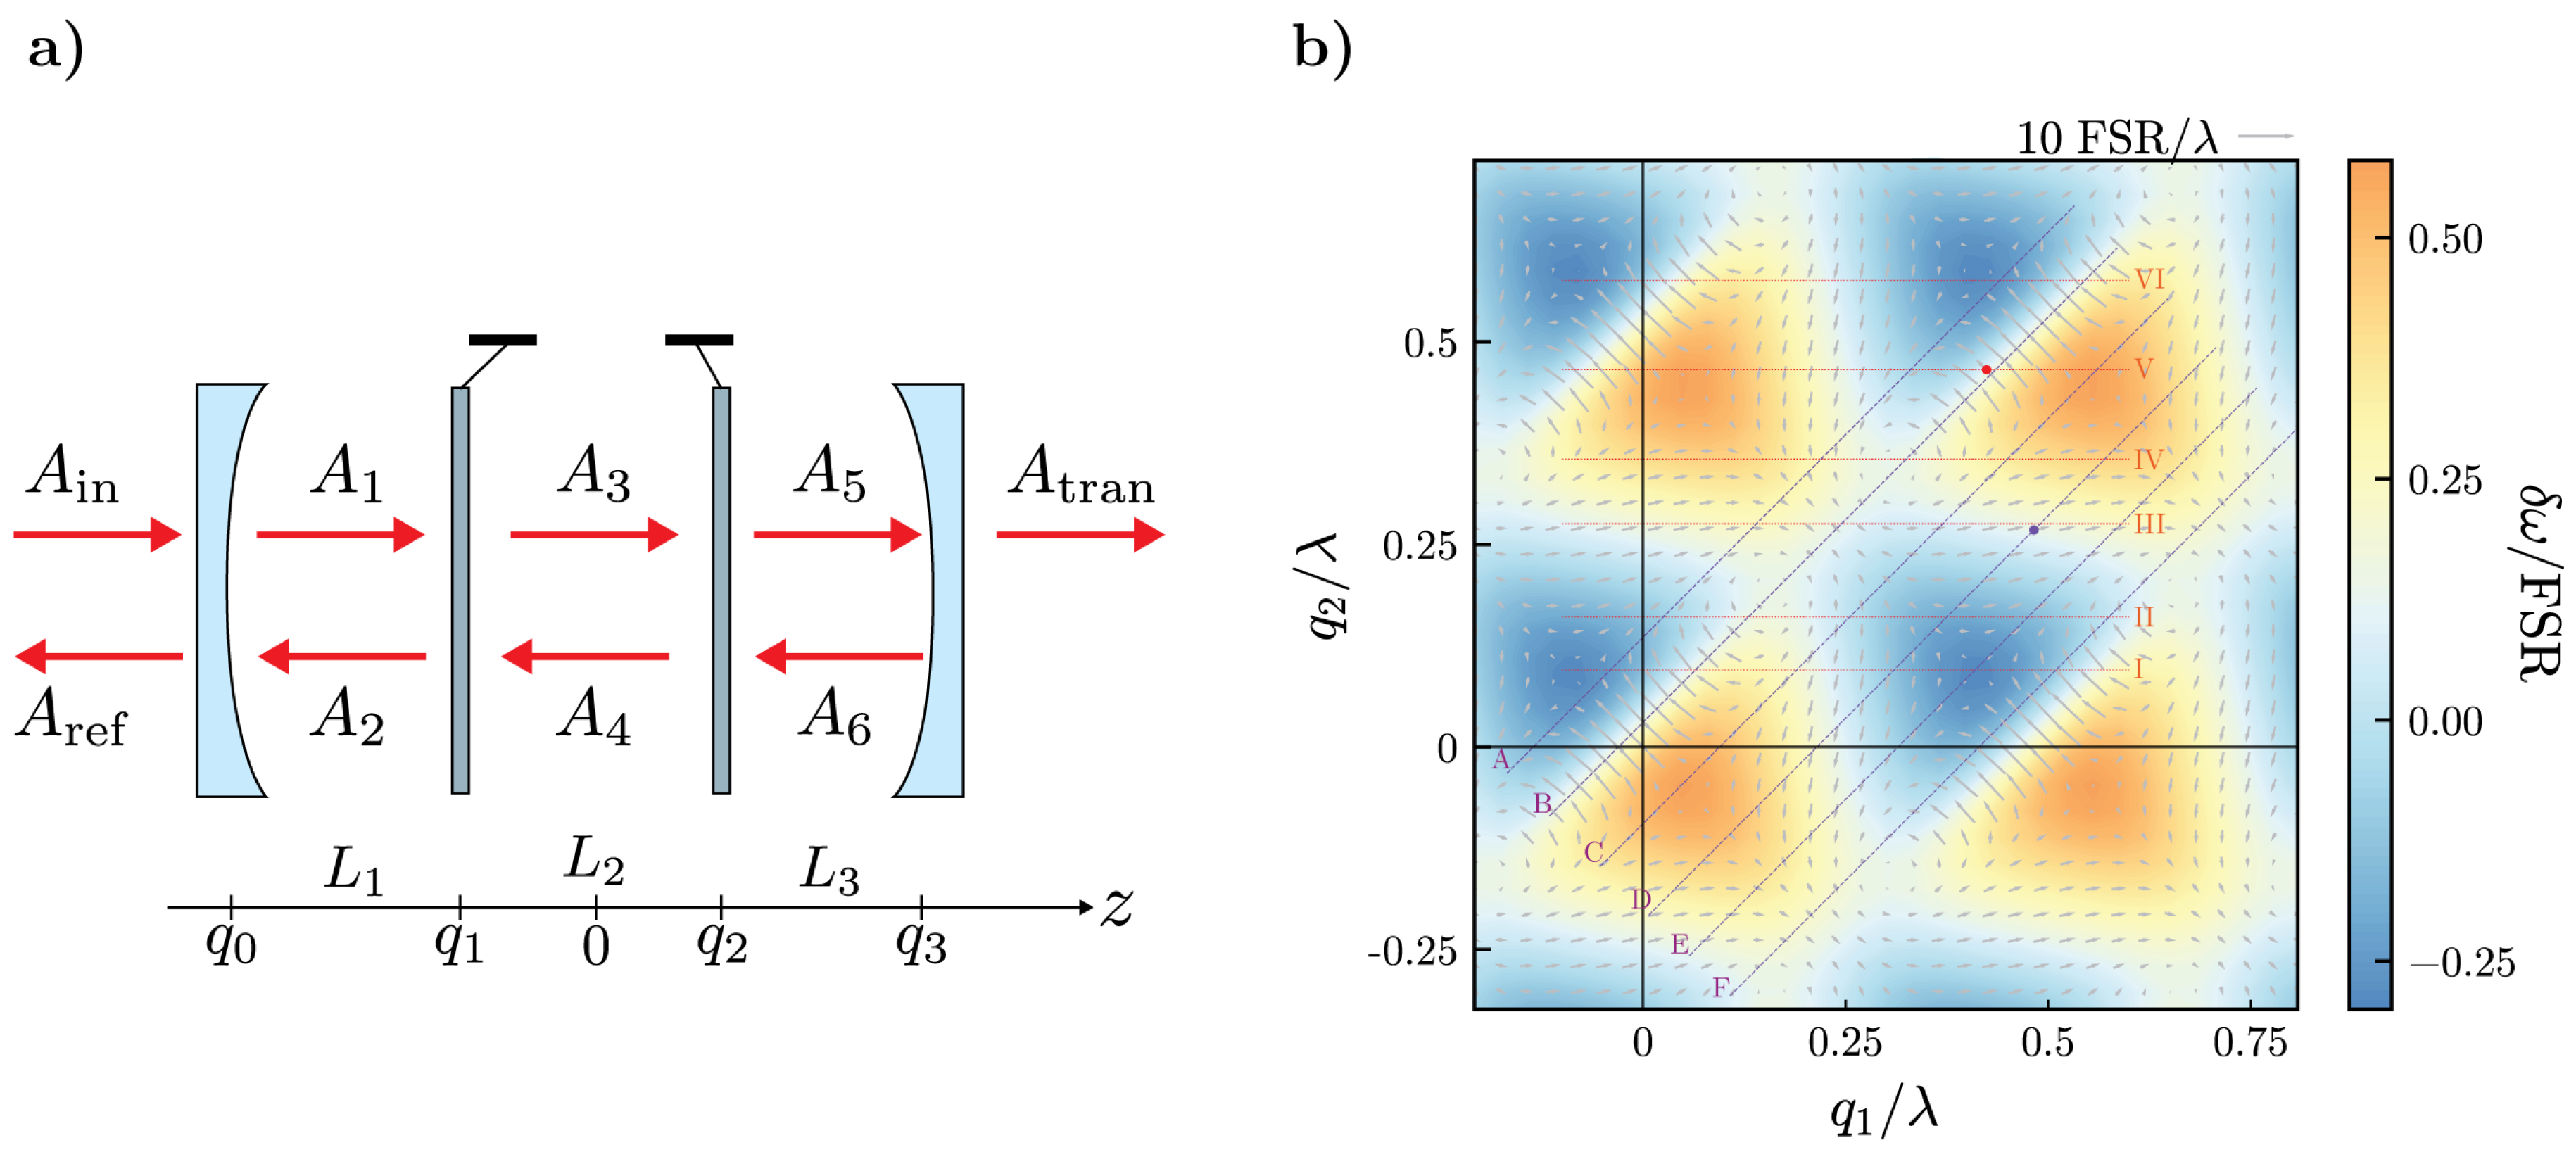
Figure 1. (a) Schematic diagram of the system. (b) Contour plot of the frequency shift function δ ω normalized to the free–spectral–range of the cavity, FSR = π c / L , as a function of the membrane positions q 1 and q 2 normalized to the wavelength, due to the presence of the two–membrane cavity. The parameters used for the numerical analysis are: λ = 1064 nm, R = 0.99994 , L = 90 mm, L m = 104 nm, and n = 2.17 . Superimposed the vector plot of the gradient field of the frequency shift, whose components give the two optomechanical couplings, with the unit indicated on the top–right of the panel. The oblique blue lines (A–F) and the horizontal red lines (I–VI) indicate the experimental spectra reported in Figure 3 (A–F). The red and blue dots represent the points where the optomechanical coupling was estimated.
Proceedings 12 00054 g001