Proceeding Paper

Openness in Businesses: A Case Study of Food Businesses in Thessaly †

by
Ioanna Grigoriou
,
Miltiadis Chalikias
and
Andreas Alexopoulos
*
Department of Accounting and Finance, University of West Attica, 122 44 Egaleo, Greece
*
Author to whom correspondence should be addressed.
Presented at the 11th International Conference on Information and Communication Technologies in Agriculture, Food & Environment, Samos, Greece, 17–20 October 2024.
Proceedings 2025, 117(1), 30; https://doi.org/10.3390/proceedings2025117030 (registering DOI)
Published: 22 May 2025

Abstract

:
The communication of organizations with the internal and external environment is one of the most important tools for the growth and development of both an organization and its employees over time. Considerable importance is attached to the way in which information is received and transmitted, as well as to the dissemination of knowledge. In the era of the 4th Industrial Revolution, e-government, and digital transformation, special communication skills and competences are required of everyone. Especially in the pandemic era, new and complex problems have emerged. Communication helps to overcome friction and disagreements and at the same time influences the performance of employees. Communication spreads knowledge directly and effectively through all hierarchical levels, so that all employees are involved in decision-making. One of the features of communication is openness, which refers to unrestricted access to information and knowledge for all stakeholders. This article presents the results of a study conducted among industrial food executives. The study presents the main factors that contribute to effective communication in organizations. The results are particularly important, and any use of the results will contribute significantly to improving communication in companies.

1. Introduction

Organizational communication, with the internal and the external environment, is one of the most essential tools for developing and evolving an organization and its people. March and Simon (2003) (as cited in Tosi, 2009) [1] highlight the importance of communication as one of the cohesive elements of organizations. According to them, communication can be treated as a message exchange process and as a dynamic system that includes two or more people who actively participate in a process.
This study’s purpose is to draw reliable and valid conclusions regarding the workforce’s communication in the food sector’s businesses in the era of digital transformation [2].
Openness refers to unlimited access to knowledge and information for all stakeholders. It is about collaborative management and decision-making, and is in complete contrast to decision-making by centralized management alone. This term is widely used in the theory of total quality management and by analogy in the new public management among other concepts such as accountability, efficiency, and lack of vertical hierarchy, which is a direct application of private sector management principles. Alternatively, the term extroversion could be used, but it does not include the internal environment of the organization [3,4].
Various statistical methods, such as factor analysis and regression analysis, were applied to analyze the data.

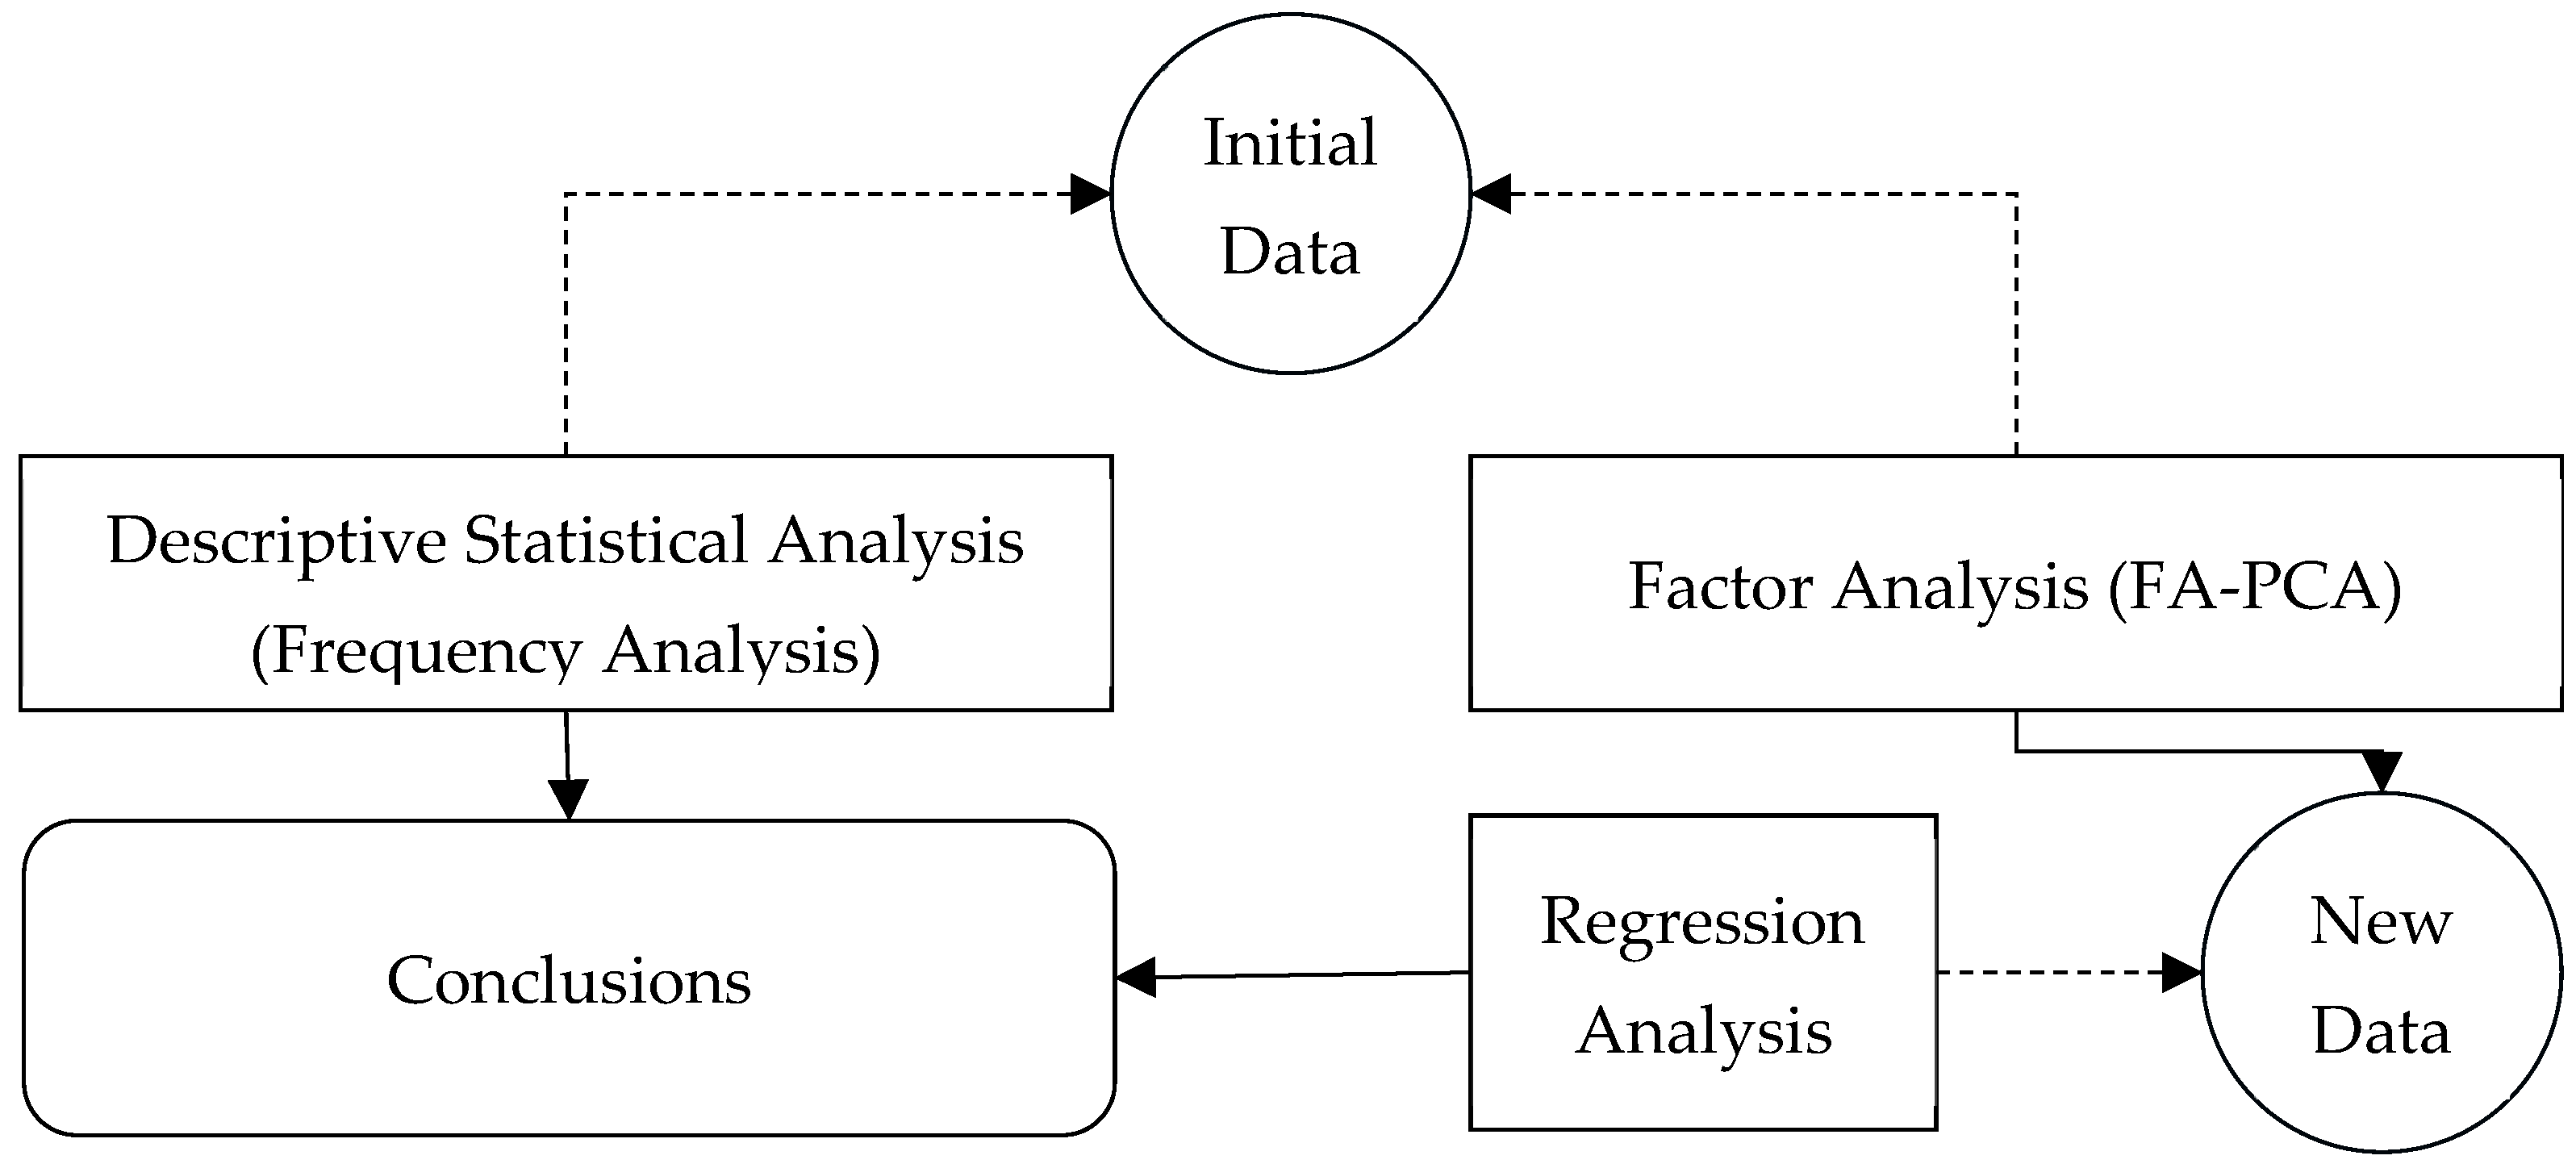
2. Sample and Methods

The data used in this paper come from a comprehensive questionnaire survey conducted of food businesses in the Region of Thessaly, Greece. Specifically, the questionnaire responses were meticulously coded, and a data set comprising 152 cases and 46 variables was formed. From the original data set, 7 variables relate to the demographic characteristics of the participants (such as gender, age group, and work location), while the remaining 39 variables relate to statements by participants about communication in their workplace (i.e., “The level of digital communication is satisfactory”, “Management listens carefully to staff”, etc.).
The participants’ statements were evaluated using a five-point Likert scale, a widely accepted method that ranges from “Strongly Disagree” to “Strongly Agree”. This scale was used to measure the degree of agreement or disagreement with each statement, providing a quantitative measure of the participants’ perceptions.
Thorough data preprocessing was conducted to ensure the purity and completeness of the data. This was followed by a statistical reliability test using Cronbach’s Alpha method [5]. Subsequently, a comprehensive statistical analysis of frequencies was performed for all variables.
Then, Principal Component Analysis (PCA) factor analysis [6] was applied to the 39 variables related to communication. This process formed a new data set that included the demographic variables and the factors that emerged from the factor analysis.
In this data set, correlations between factors resulting from factor analysis and demographic variables were tested using a combination of crosstabs and chi-square methods [7] (Figure 1).
Specifically, the factor analysis was applied to the data derived from the questions/statements of the questionnaire concerning communication (a total of 39 variables).
Before the factor analysis of the data, the Kaiser–Meyer–Olkin (KMO) and Bartlett’s test [8] was performed (Table 1).
Moreover, in the following Table 2 factor names are available:
The specific linear regression model is represented by the following equation. The linear regression model presented has FC06 as the dependent variable, representing the Motivation and Openness factor, and 34 independent variables (Q8 to Q46), representing various aspects of communication, technology, management, and information in the workplace.
The model is used to explain how these independent variables affect employee motivation and openness.
F C 06 = 2.576 + 0.138 · Q 8 0.063 · Q 9 + 0.22 · Q 10 + 0.144 · Q 11 + 0.169 · Q 12 0.17 · Q 13 0.141 · Q 14 0.46 · Q 15 0.001 · Q 16 0.044 · Q 17 0.062 · Q 18 + 0.089 · Q 19 + 0.073 · Q 20 0.048 · Q 21 0.072 · Q 22 0.203 · Q 23 + 0.066 · Q 24 + 0.182 · Q 25 + 0.145 · Q 26 0.14 · Q 28 0.011 · Q 29 + 0.038 · Q 30 + 0.125 · Q 31 0.064 · Q 32 0.088 · Q 33 + 0.137 · Q 34 + 0.309 · Q 35 + 0.08 · Q 36 + 0.051 · Q 37 + 0.039 · Q 38 0.026 · Q 40 + 0.319 · Q 46
The linear regression model is evaluated against specific indicators that show its power, accuracy, and significance. The first index is R, corresponding to the strength of the linear relationship between the dependent and independent variables. In this case, R = 0.741 indicates a relatively strong positive correlation between the variables, indicating that the model captures the relationship between the parameters accurately (Table 3).
The R-Square index (R2), which represents the percentage of the variance in the dependent variable explained by the model, is 0.55. This means that 55% of the variance in the dependent variable (FC06) can be explained by the model’s independent variables. Although the model explains a significant proportion of the variance, the remaining 45% remains unexplained, indicating that the model has a good fit but does not fully capture the variety of factors affecting FC06.
The Standard Error of the Estimate is 0.75599815; this value shows that although the model provides predictions with relative accuracy, there are still discrepancies between the predicted and actual values. This leaves room for improvement of the model.
ANOVA analysis shows that the F-statistic value is 4.54, which indicates that the model is statistically significant. The p-value (Sig.) is 0.00, meaning the result is statistically significant at the 5% significance level. This indicates that the independent variables as a whole explain a substantial proportion of the variance in the dependent variable.
Overall, the linear regression model appears to be quite robust as it can explain approximately 55% of the variance in the dependent variable (FC06). The value of the Adjusted R-Square (0.428) suggests that the model can be improved, but it still explains a significant proportion of the variance. The statistical significance of the model, as shown by the F-statistic and p-value, confirms the importance of the independent variables in explaining the variation in the dependent variable. However, the relatively high Standard Error of the Estimate shows that the model’s predictions have room for improvement. This can be performed either by choosing better independent variables or by revising the model to provide more accurate predictions. Despite this, the model has a good fit, instilling confidence in its application, and there is room for further improvements.
The F-value of 4.54 indicates that the model is statistically significant, i.e., that the independent variables as a whole explain a significant part of the variance in the dependent variable. This is also indicated by the p-value (Sig.), which is 0.00. This result indicates that the model is statistically significant at the 5% significance level.
The independent variables that have the strongest correlation with the dependent variable based on the results of the regression analysis are the following:
  • Q15: Management trusts me—This variable demonstrates the strongest negative correlation with the dependent variable, with a Beta coefficient = 0.458, and a statistically significant result (p = 0.000);
  • Q46: Conflicts within my address are handled through appropriate communication policies—This shows a strong positive correlation with the dependent variable (Beta = 0.307) and is also statistically significant (p = 0.000);
  • Q35: The guidance provided to me by management is satisfactory—This shows positive correlation with Beta = 0.309 and the result is statistically significant (p = 0.001);
  • Q10: The communication actions of top management make me identify with them—Shows positive correlation (Beta = 0.220) with a statistically significant result (p = 0.013);
  • Q23: There are barriers to communication—This variable shows a negative correlation (Beta = −0.202) and a statistically significant correlation (p = 0.007).
Furthermore, other independent variables that show statistically significant correlation, but with less effect, include the following:
  • Q12: Management is aware of the problems faced by staff (Beta = 0.169, p = 0.032);
  • Q13: Management listens attentively to staff (Beta = −0.170, p = 0.034);
  • Q11: The level of digital communication is satisfactory (Beta = 0.144, p = 0.039).
The results suggest that these variables play a significant role in shaping the dependent variable in both positive and negative directions.

3. Conclusions

The results of this research can be generalized to the whole food and dairy sector in the region of Thessaly. The positive finding that management is aware of staff problems and listens attentively demonstrates a culture of open communication and employee engagement [9,10]. This can foster trust, improve morale, and lead to more effective problem-solving. Moreover, satisfactory levels of digital communication indicate that the organization is leveraging technology to enhance communication and collaboration. It is worth noting that open communication and employee engagement can play a crucial role in sustainability initiatives. By involving employees in sustainability efforts, organizations can foster a sense of ownership, encourage innovation, and identify opportunities for improvement [11,12].
Finally, in collaboration with the Association of Industries of Thessaly and Central Greece, a study could be carried out involving executives and employees of food and beverage companies in the Region of Thessaly. Subsequently, a survey could be carried out among the top executives of these companies. Similarly, nationwide surveys could also be carried out in the sector with the cooperation of trade unions and the bodies representing industries and businesses.

Author Contributions

Conceptualization, I.G., M.C. and A.A.; methodology, M.C.; software, I.G.; validation, A.A. and M.C.; resources, I.G.; data curation, M.C.; writing—original draft preparation, I.G.; writing—review and editing, A.A.; supervision, M.C.; funding acquisition, A.A. All authors have read and agreed to the published version of the manuscript.

Funding

This research received no external funding.

Institutional Review Board Statement

Not applicable.

Informed Consent Statement

Not applicable.

Data Availability Statement

No new data were created in this study.

Conflicts of Interest

The authors declare no conflicts of interest.

Abbreviations

The following abbreviations are used in this manuscript:
PCAPrincipal Component Analysis
KMOKaiser–Meyer–Olkin
R2R-Square index

References

  1. Tosi, H. Theories of Organizations; SAGE Publications Ltd.: London, UK, 2009. [Google Scholar]
  2. Exarchou, V.A.; Aspridis, G.M.; Savvas, I.K.; Sirakoulis, K.; Garani, G. The impact of digital transformation on human resource management: A case study in higher education in Greece. Int. J. Res. Hum. Resour. Manag. 2024, 6, 24–32. [Google Scholar] [CrossRef]
  3. Kiełek-Rataj, E.; Wendołowska, A.; Kalus, A.; Czyżowska, D. Openness and Communication Effects on Relationship Satisfaction in Women Experiencing Infertility or Miscarriage: A Dyadic Approach. Int. J. Environ. Res. Public Health 2020, 17, 5721. [Google Scholar] [CrossRef] [PubMed]
  4. Boyle, M.P.; Gabel, R.M. “Openness and progress with communication and confidence have all gone hand in hand”: Reflections on the experience of transitioning between concealment and openness among adults who stutter. J. Fluen. Disord. 2020, 65, 105781. [Google Scholar] [CrossRef] [PubMed]
  5. Agbo, A.A. Cronbach’s Alpha: Review of Limitations and Associated Recommendations. J. Psychol. Afr. 2010, 20, 233–239. [Google Scholar] [CrossRef]
  6. Mooi, E.; Sarstedt, M.; Mooi-Reci, I. Principal Component and Factor Analysis. In Market Research: The Process, Data, and Methods Using Stata; Mooi, E., Sarstedt, M., Mooi-Reci, I., Eds.; Springer: Singapore, 2018; pp. 265–311. [Google Scholar] [CrossRef]
  7. Frude, N. Statistical Analysis I: Frequencies and Crosstabs. In A Guide to SPSS/PC+; Frude, N., Ed.; Macmillan Education: London, UK, 1993; pp. 72–90. [Google Scholar] [CrossRef]
  8. Yeomans, K.A.; Golder, P.A. The Guttman-Kaiser Criterion as a Predictor of the Number of Common Factors. J. R. Stat. Soc. Ser. Stat. 1982, 31, 221. [Google Scholar] [CrossRef]
  9. Tsitmideli, G.; Skordoulis, M.; Chalikias, M.; Sidiropoulos, G.; Papagrigoriou, A. Supervisors and subordinates relationship impact on job satisfaction and efficiency: The case of obstetric clinics in Greece. Priming Eff. Bus. Ethic Decis. Mak. 2016, 3, 1–12. [Google Scholar] [CrossRef]
  10. Drosos, D.; Chalikias, M.; Skordoulis, M.; Kalantonis, P.; Papagrigoriou, A. The strategic role of information technology in tourism: The case of global distribution systems. In Tourism, Culture and Heritage in a Smart Economy: Third International Conference IACuDiT, Athens; Springer International Publishing: Berlin/Heidelberg, Germany, 2016; pp. 207–219. [Google Scholar]
  11. Skordoulis, M.; Ntanos, S.; Kyriakopoulos, G.L.; Arabatzis, G.; Galatsidas, S.; Chalikias, M. Environmental innovation, open innovation dynamics and competitive advantage of medium and large-sized firms. J. Open Innov. Technol. Mark. Complex. 2020, 6, 195. [Google Scholar] [CrossRef]
  12. Delegkos, A.E.; Skordoulis, M.; Kalantonis, P.; Xanthopoulou, A. Integrated reporting and value relevance in the energy sector: The case of European listed firms. Energies 2022, 15, 8435. [Google Scholar] [CrossRef]
Figure 1. Methodological framework of statistical analysis.
Proceedings 117 00030 g001
Table 1. KMO and Bartlett’s Test.
KMO and Bartlett’s Test
Kaiser–Meyer–Olkin Measure of Sampling Adequacy 0.85
Bartlett’s Test of SphericityApprox. Chi-Square2170.11
df741.00
Sig.0.00
Table 2. Factor names.
1. Support and RecognitionFC01
2. Open and Digital CommunicationFC02
3. Trust and InformationFC03
4. Information Flow and BenchmarkingFC04
5. Effective CommunicationFC05
6. Motivation and OpennessFC06
7. Positive UpdatesFC07
8. Information and Digital CommunicationFC08
9. Transparency and Conflict ResolutionFC09
10. Technology and InformationFC10
11. Barriers and SupportFC11
12. Communication in Emergency SituationsFC12
Table 3. Model performance.
ModelRR SquareAdjusted R SquareStd. Error of the Estimate
10.7410.550.4280.75599815
ANOVA
Model Sum of SquaresDfMean SquareFSig.
1Regression82.9932.002.594.540.00
Residual68.01119.000.57
Total151.00151.00
Disclaimer/Publisher’s Note: The statements, opinions and data contained in all publications are solely those of the individual author(s) and contributor(s) and not of MDPI and/or the editor(s). MDPI and/or the editor(s) disclaim responsibility for any injury to people or property resulting from any ideas, methods, instructions or products referred to in the content.

