Proceeding Paper

HRM Practices and Their Impact on Job Satisfaction: Evidence from the Public Sector in Greece †

School of Economics and Management, Department of Business Organization and Management, International Hellenic University, 62124 Serres, Greece
*
Author to whom correspondence should be addressed.
Presented at the 1st International Conference on Public Administration 2024, Katerini, Greece, 31 May–1 June 2024.
Proceedings 2024, 111(1), 14; https://doi.org/10.3390/proceedings2024111014
Published: 10 March 2025
(This article belongs to the Proceedings of 1st International Conference on Public Administration 2024)

Abstract

:
The aim of this paper was to investigate human resource management (HRM) practices and their effects on the job satisfaction of public sector employees in Greece. More specifically, a survey was carried out via a structured questionnaire distributed to all the employees of the Regional Administration of Crete (Region of Crete), who were selected as research samples. The results of the survey showed a good level of job satisfaction, but a moderate level of satisfaction from the HRM practices of the organization. However, a strong correlation between HRM practices and job satisfaction was statistically proven. Furthermore, significant correlations were identified between specific demographic variables or certain occupational features and the levels of satisfaction from both the job and the HRM practices. In conclusion, the research suggested that there were areas that must be emphasized and problems to be addressed by the top management. These, among others, were the improvement of evaluation procedures, the promotion of fair treatment, and the better planning of development of human resources.

1. Introduction

Traditionally viewed as a cost burden, human resources (HRs) are now recognized as a strategic asset of critical importance for the success of any organization. As such, human resource management must be prepared to face challenges with readiness and flexibility. HRM encompasses the management of an organization’s human capital within a strategic framework aimed at achieving optimal performance, while ensuring employee satisfaction. Its policies and procedures include, among others, practices such as talent management, motivation, empowerment, and leadership. Essentially, these policies and systems define the roles and responsibilities of each employee in contributing to the achievement of desired results [1]. At its core, HRM revolves around maximizing organizational effectiveness by motivating and empowering its people. This can be achieved through a combination of strategies. These strategies include motivation; financial and non-financial incentives; positive work environment, coupled with policies for enhancing effectiveness; providing training and development; designing jobs with clear duties and responsibilities; evaluating performance; and offering guidance and support. Motivation combined with enhanced effectiveness form the cornerstone of HRM, leading to increased productivity and a competitive advantage for the organization. In essence, investing in HRM is equivalent to investing in the very success of the business.

2. Literature Review

Work plays a pivotal role in people’s lives which makes it crucial for organizations to maintain a satisfied workforce. Employee satisfaction is defined as the sense of self-motivation and fulfillment derived from one’s work, stemming from feelings of accomplishment and job performance [2]. Furthermore, professional satisfaction is additionally enhanced by the recognition and reward of employee achievements, which is inextricably linked to increased efficiency and a positive work environment. Moreover, flexibility plays a significant role in satisfaction in general [3]. Finally, organizational culture positively affects employees, highlighting the existence of a correlation between organizational culture on the one hand and commitment and performance on the other [4].
According to previous studies [5], additional factors that influence employee satisfaction include the following:
  • Work stress levels: Excessive work stress can negatively impact employee satisfaction and well-being.
  • Training and development opportunities: Providing employees with opportunities for professional growth and development can enhance their satisfaction and motivation.
  • Promotion and advancement opportunities: Employees who feel that they have the potential to advance within the organization are more likely to be satisfied with their jobs.
  • Safety and security: A safe and secure work environment is essential for employee satisfaction and well-being.
Research has shown that HR policies that focus on motivation and reward, empowerment, and communication have a significant impact on employee satisfaction [6]. Overall, it has been suggested that HRM practices and total quality management (TQM) highly affect employee satisfaction [7].
Beyond HRM practices, there are additional factors that influence employee work satisfaction. Many researchers argue that social and demographic characteristics, such as age, marital status, gender, family income, and education level [8,9] have a significant impact on employee work satisfaction.
Recently, the public sector has been slowly following the lead of the private sector in terms of HRM practices. The concept of New Public Management (NPM) has become increasingly important in the research community, despite the lack of a universally accepted definition. Broadly speaking, the theoretical framework describes NPM as a tool to improve the function of public organizations by adopting and relying on certain practices borrowed from the private sector. These practices, introduced in the 1990s, entail performance evaluation, decentralized budgeting, flexibility in the application of public budgeting, separation of responsibilities and services, downsizing of the public administration, and a results-based management culture, as well as the provision of quality services by public entities and the promotion of market principles [10,11].
In Greece, Law No. 3871/2010 was seen as the cornerstone for putting the principles of New Public Management into practice [12]. Public sector organizations in Greece, however, may face several HR challenges, including employee overload, inappropriate behavior, high levels of bureaucracy, and low productivity. These potential challenges are a result of factors such as stagnation in promotions and unexpected salary cuts. A report published by the OECD [13] in 2012 indicated that the HRM framework in the Greek public sector included legal provisions for the protection of employee rights. These included the practices of providing social security and pensions to employees, and the right to strike and form a union, as well as guarantees for long-term employment opportunities. Of course, the Greek public sector requires modernization and the adoption of HR practices and measures from the private sector [14]. According to KPMG [15], Greece ranks 55th globally and has been steadily improving in recent years. The OECD reports that Greece tends to outsource HR management to other government entities to a lesser extent than the OECD average. In terms of strategic HR management, Greece makes little to no use of this.
This paper explores the relationship between human resource management (HRM) practices and employee job satisfaction in the Greek public sector and more specifically, within the Region of Crete. It specifically examines the relation between HRM practices and job satisfaction, as well as the correlation between specific work characteristics and demographic factors with job satisfaction and satisfaction with HRM practices. More specifically, we examined the extent to which these characteristics influenced the overall level of employee satisfaction.
Delving deeper, this paper investigates the following key questions:
  • Does the level of HR satisfaction affect the level of job satisfaction?
  • Is the level of job satisfaction influenced by the participants’ work profiles?
  • Is the level of job satisfaction affected by the participants’ demographic characteristics?
  • Is the level of HR satisfaction influenced by the participants’ work profiles?
  • Is the level of HR satisfaction affected by the participants’ demographic characteristics?
We tried to answer these questions by providing empirical evidence concerning a Greek public organization.

3. Research Methodology

The survey was conducted in the Region of Crete, one of the 13 administrative regions of Greece. Located in the southern part of the country, the Region of Crete includes the island of Crete and smaller islands such as Gavdos, Chrissi, and Koufonisi, among others, and covers a total area of 8303 square kilometers. The capital of the region is Heraklion, where the Headquarter Services of the Regional Government are located. The Region is further divided into four administrative units: the regional units of Heraklion, Lasithi, Rethymno, and Chania.
For the purposes of this study, a structured questionnaire was developed based on a comprehensive literature review. All questionnaire items were measured using a five-point Likert scale. The questionnaire consisted of four parts, with 17 questions in total. It was distributed to all employees of the Region of Crete, a total population of 764 employees, with a response deadline of approximately two weeks. Data were collected from 5 December 2023 to 18 December 2023, resulting in a final sample of 116 responses. The research sample included a diverse range of participants, from all administrative units, and of both genders, reflecting a broad spectrum of age groups, educational backgrounds, marital status, and salary levels.

4. Results

The sample consisted of 116 employees from the Region of Crete. The specific demographic and working profile data are presented in Table 1 and Table 2:
Cronbach’s alpha coefficient was used to confirm the reliability and internal consistency for each individual question, as well as for the overall questionnaire. The results of the reliability analysis, conducted using IBM® SPSS® Statistics 29 statistical software, allowed the creation of seven grouping variables, as follows:
  • Factors of job satisfaction;
  • Total satisfaction/commitment;
  • HR programming factors;
  • Motivation practices;
  • Evaluation of productivity;
  • Program of training and personal development;
  • Employee involvement/participation.
Cronbach’s alpha values for the individual questions ranged from 0.787 to 0.890, while the overall Cronbach’s alpha value was 0.952. The factors for each constructed variable are presented in Table 3:
Two additional composite variables were derived from these variables, following an additional Cronbach’s alpha reliability test. The first variable named “job satisfaction” aggregated the factors of “factors of job satisfaction” and “total satisfaction/commitment”. The second variable named “satisfaction with HR practices”, aggregated the factors of “HR planning, motivation practices”, “evaluation of productivity”, “program of training and personal development”, and “employee involvement/participation”. These variables were subsequently used to investigate and answer the research questions.
As presented on Table 4, the factors with the highest levels of job satisfaction were “relationships with colleagues” (M = 4.21, SD = 0.75) and “relationships with supervisors” (M = 4.17, SD = 0.87).
Regarding the overall satisfaction and commitment (Table 5), it was found that the overall satisfaction level was more than adequate (M = 3.58, SD = 0.85), whereas the overall commitment was high (M = 4.35, SD = 0.66).
Furthermore, the results in Table 6 show that the HR department only investigated the needs of its personnel in a moderate extent (M = 3.01, SD = 1.05), while it was inadequate to predict the needs (M = 2.43, SD = 1.16) and actually hire qualified and suitable personnel (M = 2.91, SD = 1.13). In conclusion, the HR planning was limited, and improvements were required.
In the Table 7 it is shown that the most prevalent motivation practice was the effort to create/maintain a positive working atmosphere (M = 3.75, SD = 0.92).
Moreover, the participants reported that the evaluation procedure was moderately perceived as a process of improvement (M = 3.02, SD = 1.06) (Table 8).
Regarding the training programs (Table 9), they were provided to employees to a quite large extent (M = 3.73, SD = 0.88).
Finally, regarding employee involvement/participation levels, the analysis (Table 10) concluded that there was a sufficiently open communication between employees and supervisors (M = 3.78, SD = 0.94).
Regarding the overall level of the job satisfaction of employees in the Region of Crete (Table 11), it was sufficiently high (M = 3.63, SD = 0.57), while the overall satisfaction from the applied HR practices was lower (M = 3.19, SD = 0.73).
The distribution of the means of the grouping variables, in terms of working profile data and demographic data, are presented in Table 12 and Table 13.
Based on these results, it can be concluded that the highest levels of job satisfaction and satisfaction from the HRM practices were reported by the following:
  • Employees in the Headquarters Services (MJobSatisfaction = 3.82, MHRMpractices = 3.43);
  • New employees with 1–8 years of experience (MJobSatisfaction = 3.68, MHRMpractices = 3.36);
  • Those in managerial positions in terms of job satisfaction levels (MJobSatisfaction = 3.68) but not in terms of HRM practices satisfaction levels (M.O. HR = 3.20);
  • Employees in relatively small directorates of 6–9 people (MJobSatisfaction = 3.80, MHRMpractices = 3.45);
  • Employees with desire to maintain their job position, (MJobSatisfaction = 3.91, MHRMpractices = 3.50);
  • Those paid EUR 1001–1250 in terms of job satisfaction levels (MJobSatisfaction = 3.68) but those paid over EUR 1501 in terms of HRM practices satisfaction levels (MHRMpractices = 3.24);
  • Women in terms of work satisfaction levels (MJobSatisfaction = 3.64) but men in terms of HRM practices satisfaction levels (M.O. HR = 3.21);
  • Employees aged 36–45 (MJobSatisfaction = 3.87, MHRMpractices = 3.54);
  • Single employees (MJobSatisfaction = 3.78, MHRMpractices = 3.42);
  • Employees with a university degree (MJobSatisfaction = 3.78, MHRMpractices = 3.35).
Subsequently, a normality test was conducted to determine the appropriate method for conducting the correlation analysis. The results of the normality test showed that the sample did not follow the normal distribution (Table 14), as the skewness and Kurtosis values exceeded the demanded value range. Therefore, the Spearman’s rho correlation coefficient was chosen for this correlation analysis.
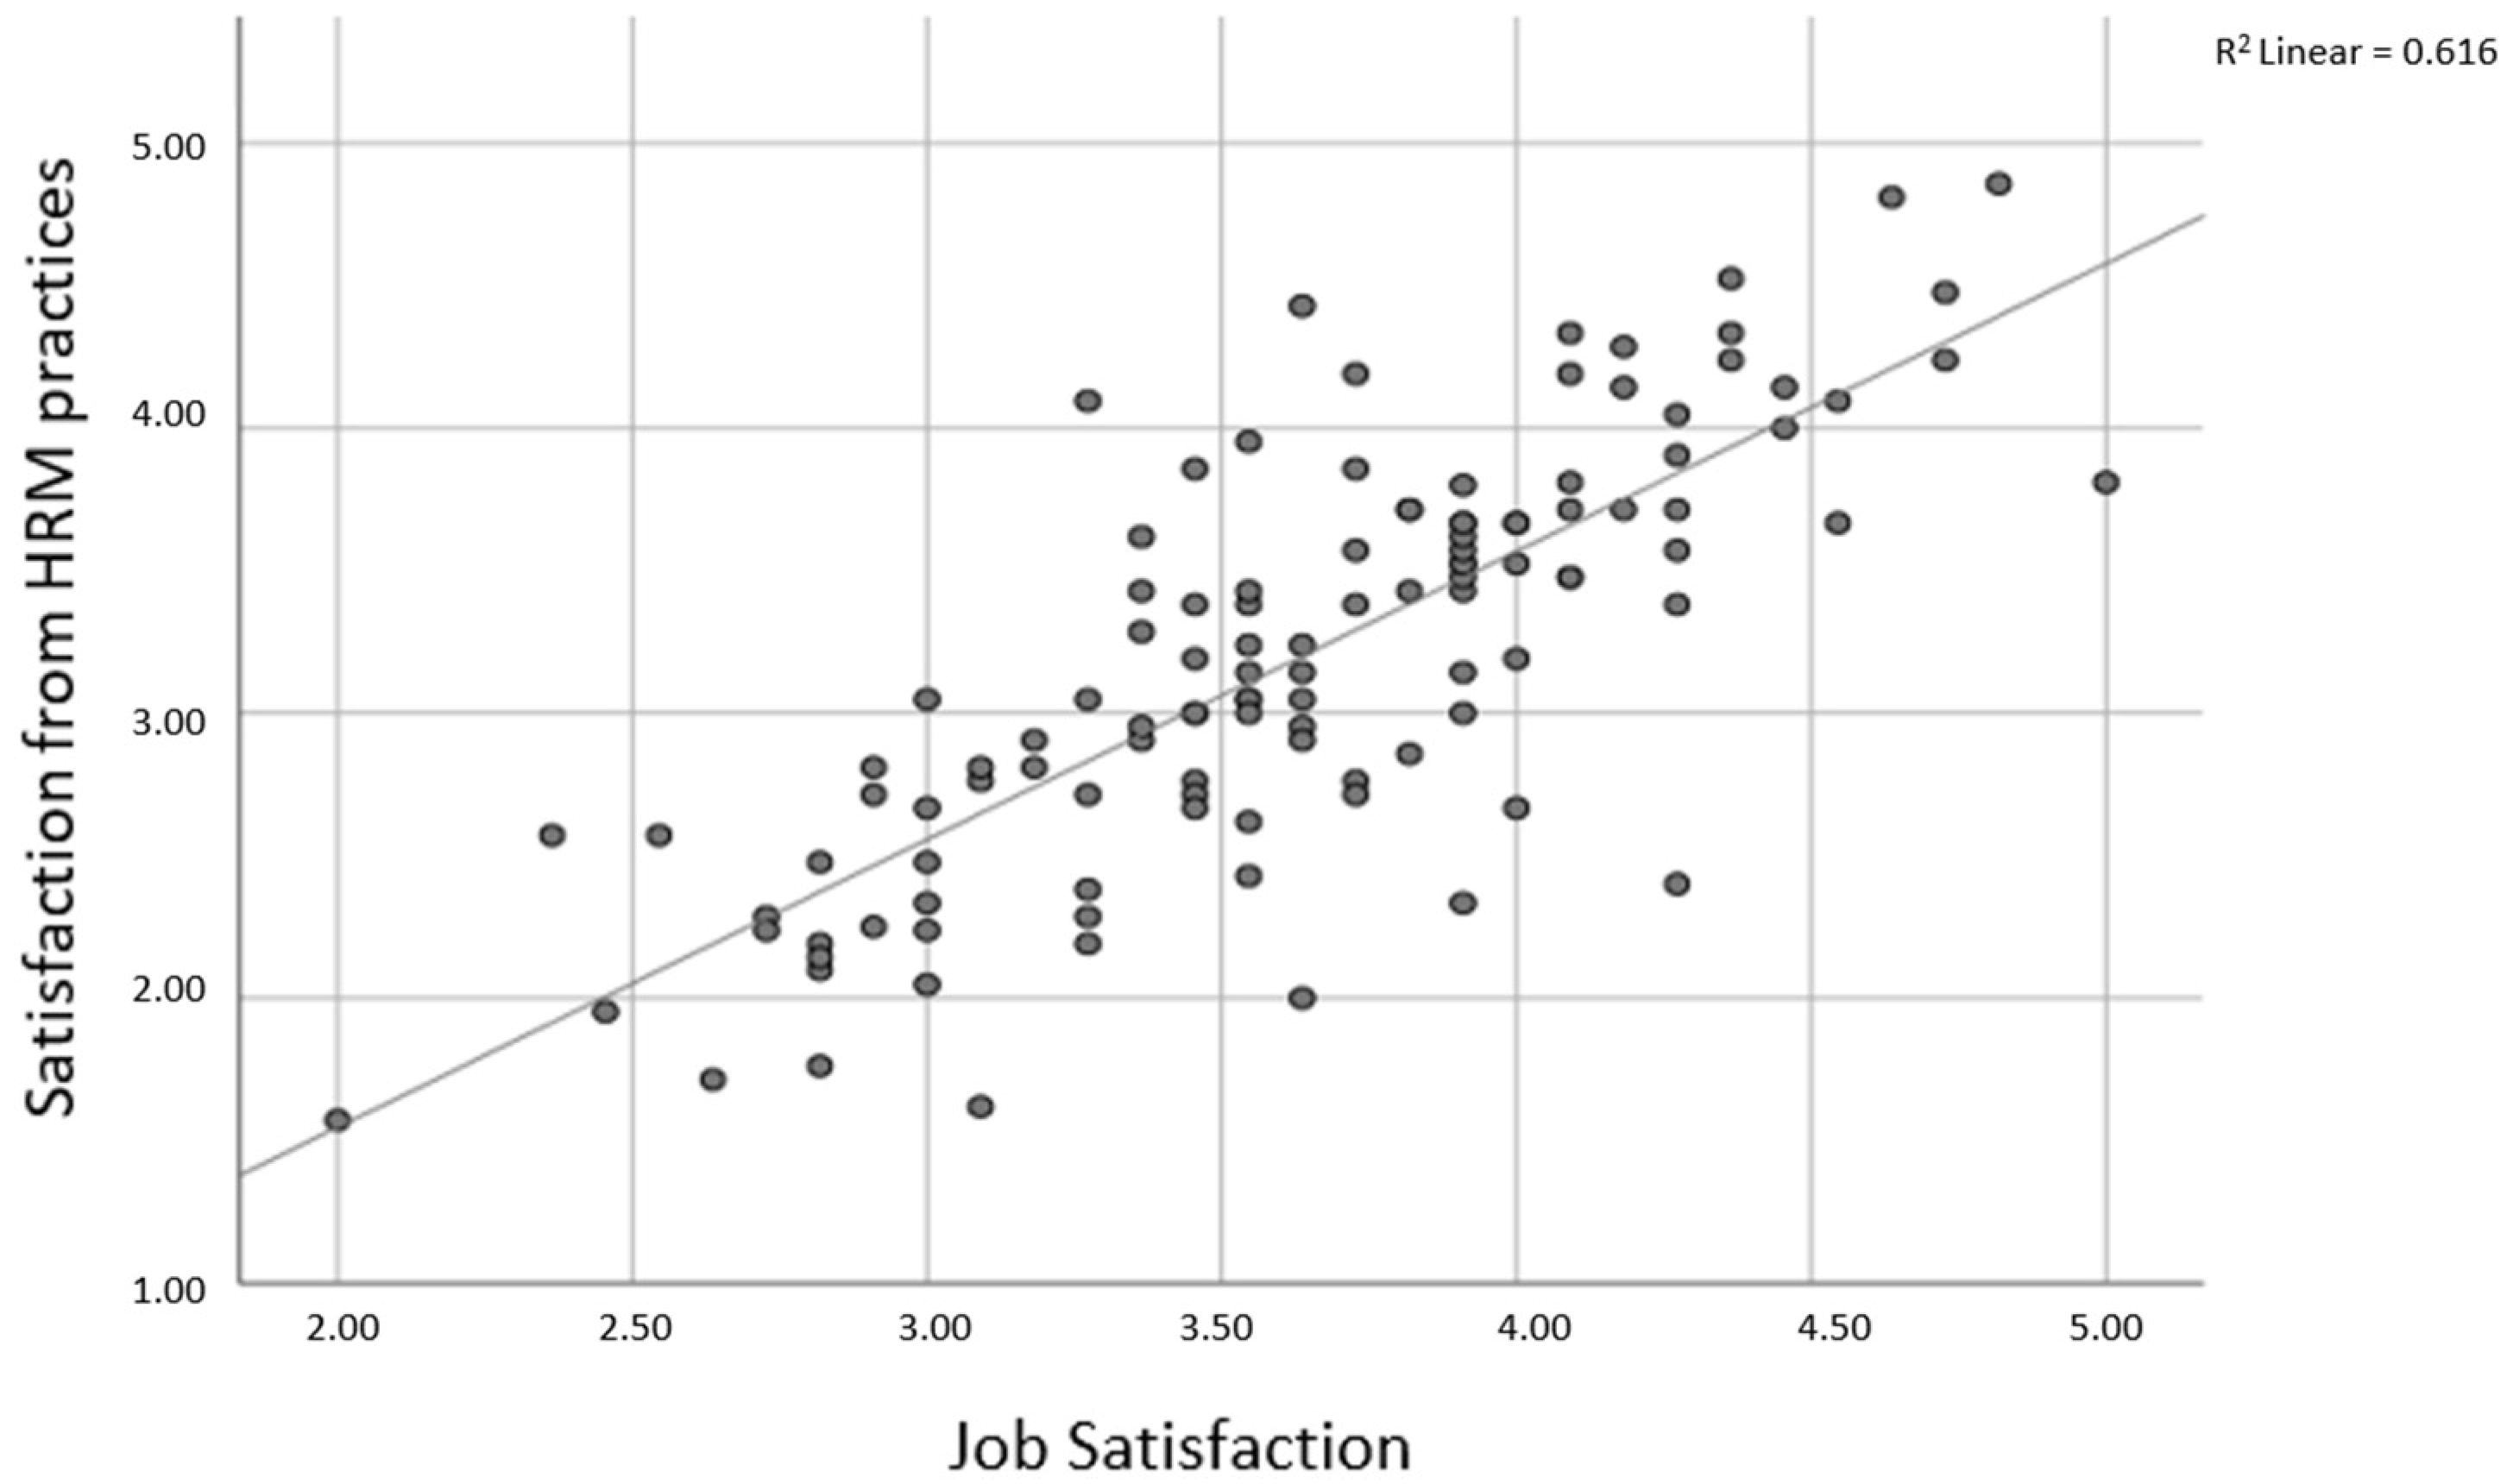
Regarding the first research hypothesis “Does the level of HR satisfaction affect the level of job satisfaction?”, the results in Table 15 indicate that there was a statistically significant correlation between the level of job satisfaction and the levels of satisfaction with HRM practices.
This is also obvious in Figure 1.
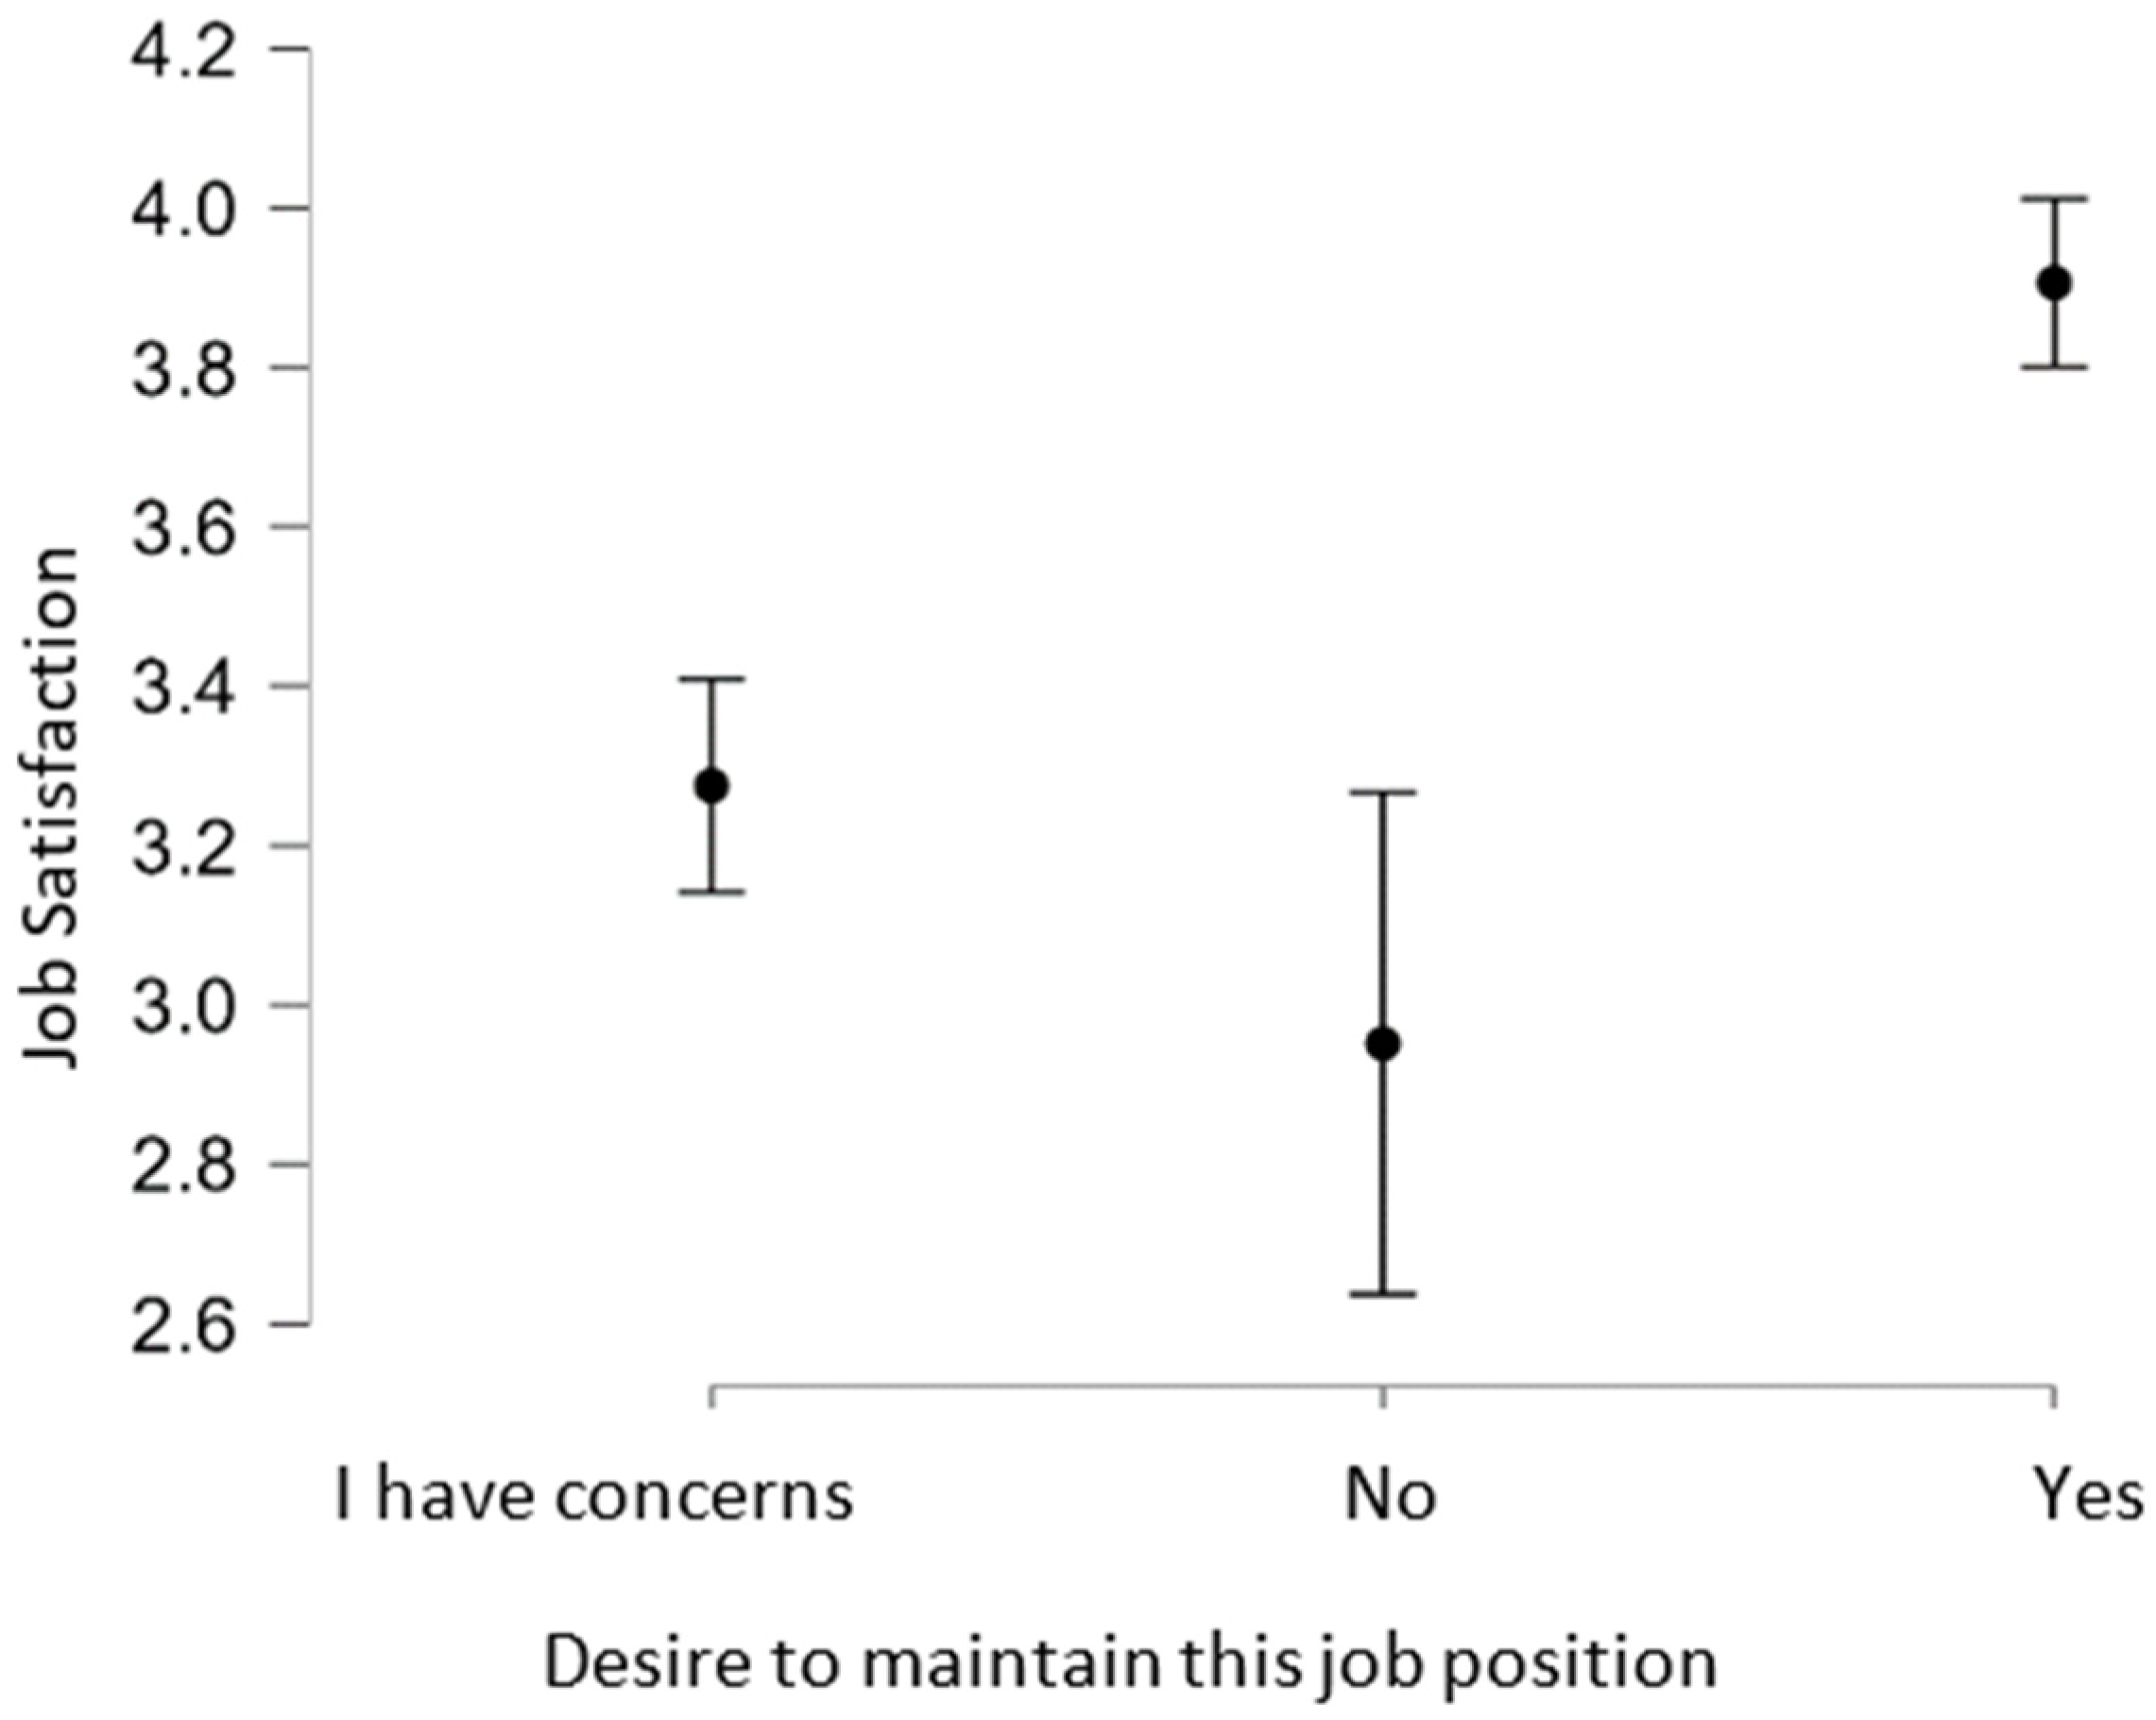
Examining the second research hypothesis “Is the level of job satisfaction influenced by the participants’ work profiles?” (Table 16) the level of job satisfaction was statistically significant in terms of the variable “desire to maintain the job position” (F = 37.220, Sig. = 0.000).
In Figure 2 the aforementioned results are visually presented.
Throughout the examination of the third research hypothesis “Is the level of job satisfaction affected by the participants’ demographic characteristics?” (Table 17) the level of job satisfaction was statistically significant only in terms of the variable “age” (F = 3.897, Sig. = 0.011).
In Figure 3 it is shown that participants aged 36–45 and more than 56 years reported higher job satisfaction.
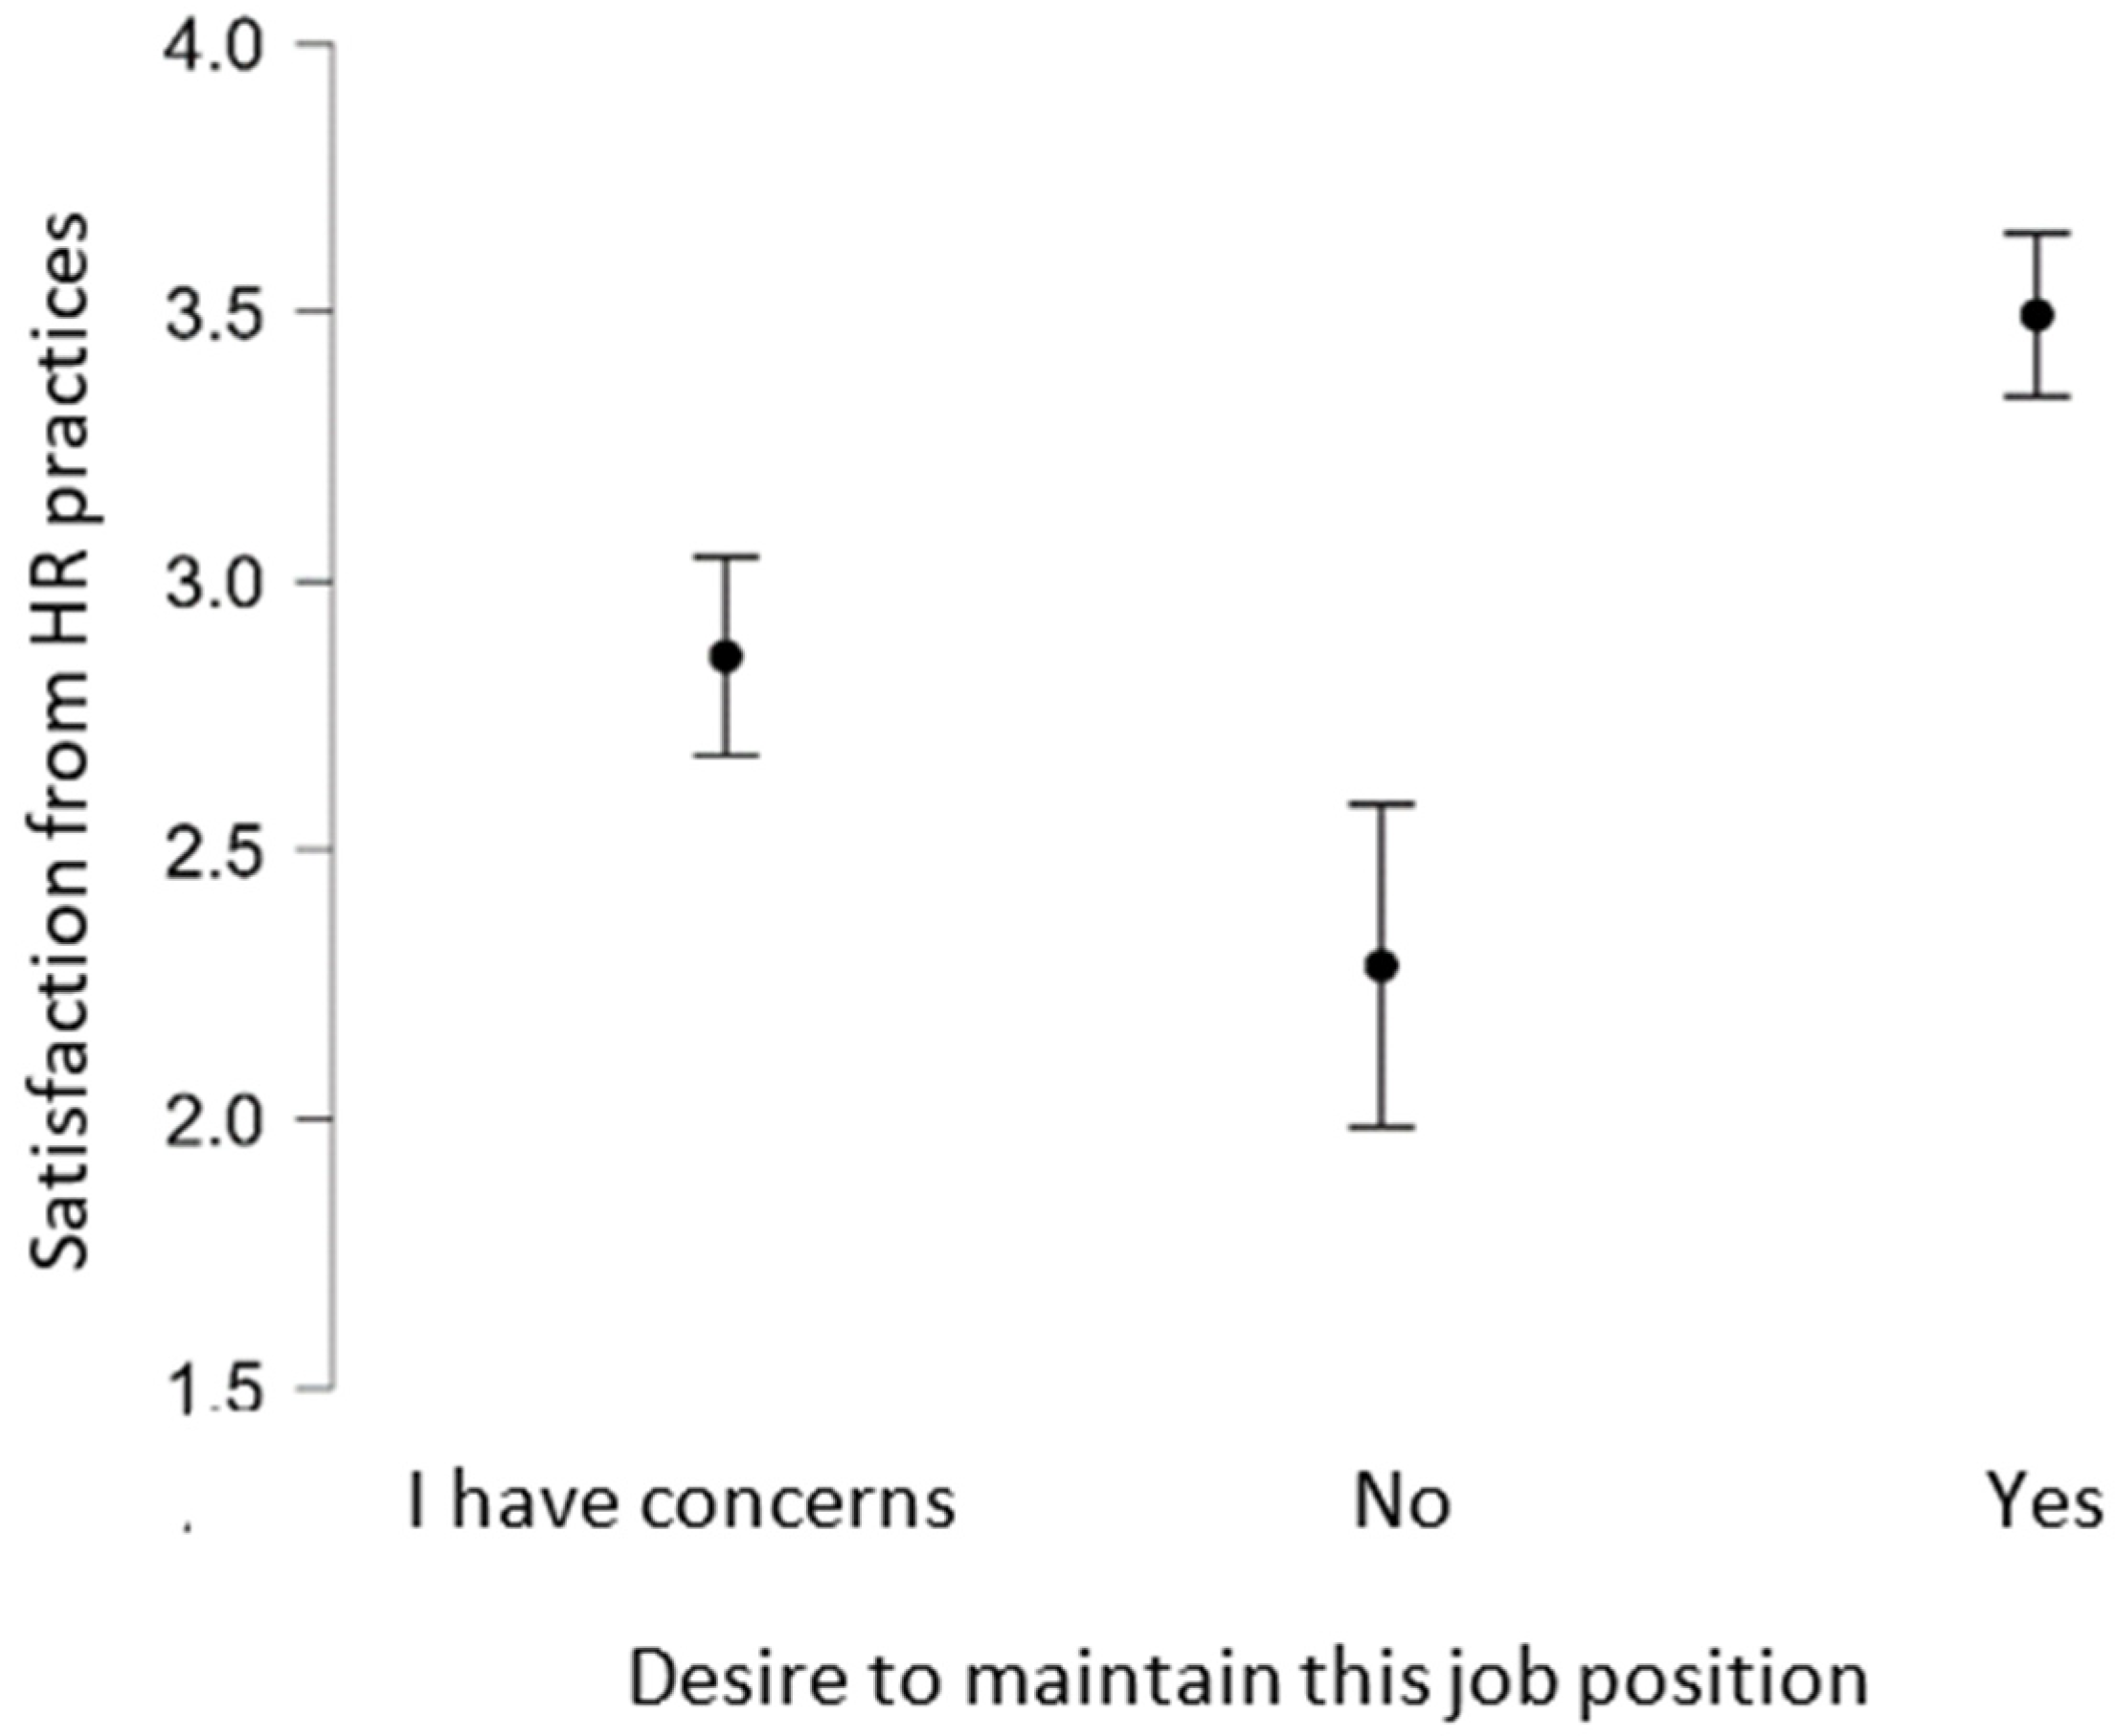
Regarding the fourth research hypothesis “Is the level of HR satisfaction influenced by the participants’ work profiles?” (Table 18), it was confirmed only in terms of the variable “desire to maintain their job position” (F = 25.726, Sig. = 0.000).
In addition to the above findings, Figure 4 shows that satisfaction with HR practices was influenced by the desire to maintain their job position. More specifically, the more positive the participants’ responses were about their desire to remain in their current job position, the higher their satisfaction with HR practices.
Regarding the fifth research hypothesis “Is the level of satisfaction with HR practices affected by the participants’ demographic characteristics?” (Table 19), it was not confirmed in this research.

5. Discussion

Job satisfaction is a critical issue with significant implications for both employees and organizations. The factors that influence job satisfaction, considering possible variations at the individual and collective levels, were investigated and the findings clearly demonstrate that the level of job satisfaction was significantly affected by the applied HRM practices. A direct correlation between satisfaction with HR practices and the average value of job satisfaction was confirmed. These results are in line with those of a number of notable researchers [16,17,18].
Further analysis of the statistical data revealed that relationships with colleagues and supervisors were among the most important factors in shaping job satisfaction for this survey sample, followed by the variables of the work environment/conditions, job security, and the balance between work and personal life. It is noteworthy that payment ranked last. The results of the empirical research also indicated that demographic and work-related factors had a clear influence on job satisfaction. Several studies document the impact of factors such as age, education, current work experience [19], gender, salary [20], and education level [21].
In this study, it was confirmed that the factors of “age” and the “desire to maintain job position” are of statistical significance. The factors of gender, salary, position of responsibility, education level, marital status, and number of colleagues were found to be statistically insignificant.

6. Conclusions

The role of HRM is recognized as crucial for the effectiveness and smooth operation of organizations. One of the most important issues in the implementation of HRM is the achievement of employee satisfaction. Factors that affected the level of job satisfaction include work stress, opportunities for training and development of staff, promotion and advancement of employees, and a sense of security at work. Particularly in the Greek public sector, it was widely acknowledged that there were significant dysfunctions in the exercise of leadership, while the Greek public sector often used incomplete performance appraisal processes in human resource decisions when compared to other OECD countries.
However, the situation has gradually changed, due particularly to the introduction of the law of the “Common Assessment Framework” and the change in the way public servants are assessed and promoted. This article investigates the relationship between HR and job satisfaction and illustrates the correlation between work characteristics and demographic factors that lead to job satisfaction.
The most significant finding of our research was the strong correlation between HR satisfaction and job satisfaction. Therefore, it can be safely concluded that a good HRM system undoubtedly affects employee satisfaction. With regards to other surveyed parameters, age appeared to affect job satisfaction.
Finally, in the case of the Region of Crete, although overall job satisfaction and satisfaction from the applied HRM practices was at a moderately satisfactory level, there were clearly areas for concern and further improvement.

Author Contributions

Conceptualization, M.M. and M.P.; methodology, M.M. and M.P.; software, M.M.; validation, M.M. and M.P.; formal analysis, M.M.; investigation, M.M. and M.P.; resources, M.M.; data curation, M.M.; writing—original draft preparation, M.M.; writing—review and editing, M.P.; visualization, M.M.; supervision, M.P.; project administration, M.P. All authors have read and agreed to the published version of the manuscript.

Funding

This research received no external funding.

Institutional Review Board Statement

Not applicable.

Informed Consent Statement

Informed consent was obtained from all subjects involved in the study.

Data Availability Statement

The data used to support the findings of this study are available and can be shared upon request from the corresponding author.

Acknowledgments

The authors are thankful to all the participants in this research and to the Region of Crete.

Conflicts of Interest

The authors declare no conflicts of interest.

References

  1. Ujma, M.; Ingram, T. Perception of ability-motivation-opportunity oriented HRM practices and organizational commitment: The role of task uncertainty. J. Entrep. Manag. Innov. 2019, 15, 139–162. [Google Scholar] [CrossRef]
  2. Aggarwal, A.; Sharma, D.; Vohra, P.; Sharma, S.; Sharma, V. Work environment and job satisfaction among employees. Int. J. Ιndian Psy. 2023, 11, 1247–1254. [Google Scholar]
  3. Ali, B.J.; Anwar, G. An empirical study of employees’ motivation and its influence job satisfaction. Int. J. Eng. Bus. Manag. 2021, 5, 21–30. [Google Scholar]
  4. Kim, W.H.; Ra, Y.A.; Park, J.G.; Kwon, B. Role of burnout on job level, job satisfaction, and task performance. Leadersh. Organ. Dev. J. 2017, 38, 630–645. [Google Scholar] [CrossRef]
  5. Abuhashesh, M.; Al-Dmour, R.; Masa’deh, R.E. Factors that affect employees job satisfaction and performance to increase customers’ satisfactions. J. Hum. Resour. Manag. Res. 2019, 2019, 354277. [Google Scholar] [CrossRef]
  6. Zardasht, P.; Omed, S.; Taha, S. Importance of HRM policies on employee job satisfaction. Black Sea J. Manag. Mark. 2020, 1, 49–57. [Google Scholar] [CrossRef]
  7. Mostafa, L.; Bisheer, S. Examining factors affecting employee’s job satisfaction under the practices of human resources management and total quality management. Case study of Egyptian petroleum company. Sci. J. Financ. Commer. Stud. Res. 2023, 4, 229–267. [Google Scholar] [CrossRef]
  8. Rabindarang, S.; Bing, K.W.; Yin, K.Y. The impact of demographic factors on organizational commitment in Technical and Vocational Education. Malays. J. Res. 2014, 2, 56–61. [Google Scholar]
  9. Zhou, L.L.; Zhang, S.E.; Liu, J.; Wang, H.N.; Liu, L.; Zhou, J.J.; Liu, B. demographic factors and job characteristics associated with burnout in Chinese female nurses during controlled COVID-19 period: A cross-sectional study. Front. Public Health 2022, 9, 757113. [Google Scholar] [CrossRef] [PubMed]
  10. Funck, E.K.; Karlsson, T.S. Twenty-five years of studying new public management in public administration: Accomplishments and limitations. Financ. Account. Manag. 2020, 36, 347–375. [Google Scholar] [CrossRef]
  11. Giovanis, N.; Chasiotou, A. Mergers in Higher Education Institutions, New Public Management and Corporate Governance: Some evidence from Greece. In Corporate Governance: An Interdisciplinary Outlook/Conference Proceedings; Karger, E., Kostyuk, A., Eds.; Virtus Interpress: Sumy, Ukraine, 2023; pp. 117–121. [Google Scholar]
  12. Giovanis, N.; Pantelidis, P.; Chasiotou, A.; Pazarskis, M. Corporate Governance and New Public Management in Greek Tax Authority: The COVID-19 experience. In Corporate Governance: An Interdisciplinary Outlook in the Wake of Pandemic/Conference Proceedings; Sylos Labini, S., Kostyuk, A., Govorun, D., Eds.; Virtus Interpress: Sumy, Ukraine, 2020; pp. 178–181. [Google Scholar]
  13. OECD Human Resources Management Country Profiles. Available online: https://web-archive.oecd.org/2014-01-27/219677-OECD%20HRM%20Profile%20-%20Greece.pdf (accessed on 1 December 2023).
  14. Papadopoulou, K. Comparison of HRM in industrial and in public sectors in Greece. Entrepreneurship 2021, 9, 68–87. [Google Scholar] [CrossRef]
  15. KPMG The Future of Government & Public Sector. Available online: https://kpmg.com/gr/en/home/insights/2022/04/the-future-of-government-and-public-sector.html (accessed on 13 December 2023).
  16. Khdour, N.; Al-Adwan, A.S.; Alsoud, A.; Al-Douri, J.A. Human resource management practices and total quality management in insurance companies: Evidence from Jordan. Probl. Perspect. Manag. 2021, 19, 432–444. [Google Scholar] [CrossRef]
  17. Rayhan, J. The impact of human resource management (HRM) practices on job satisfaction: An empirical study on selected small & medium sized enterprises in Bangladesh. Int. J. Res. Innov. Soc. Sci. 2022, 6, 376–387. [Google Scholar]
  18. Sypniewska, B.; Baran, M.; Kłos, M. Work engagement and employee satisfaction in the practice of sustainable human resource management–based on the study of Polish employees. Int. Entrep. Manag. J. 2023, 19, 1069–1100. [Google Scholar] [CrossRef]
  19. Sailaja, V.N.; Vaishnavi, M.; Sai, K.T. A Study on the impact of human resource management practices on employee performance. Acad. Mark. Stud. J. 2022, 26, 1–14. [Google Scholar]
  20. Mwansa, E.P.; Kapena, S. Teachers’ satisfaction regarding human resource management practices in Kitwe district. Int. J. Sci. Res. Eng. Trends 2022, 8, 110–114. [Google Scholar]
  21. Chatzopoulou, M.; Vlachvei, A.; Monovasilis, T. Employee’s motivation and satisfaction in light of economic recession: Evidence of Grevena prefecture-Greece. Procedia Econ. Financ. 2015, 24, 136–145. [Google Scholar] [CrossRef]
Figure 1. Scatter plot for job satisfaction/satisfaction with HRM practices.
Proceedings 111 00014 g001
Figure 2. Mean of variable of job Satisfaction/desire to maintain this job position.
Proceedings 111 00014 g002
Figure 3. Mean of variables of job satisfaction/age.
Proceedings 111 00014 g003
Figure 4. Mean of variable of satisfaction with HR practices/desire to maintain this job position.
Proceedings 111 00014 g004
Table 1. Sample presentation: demographic data.
Demographic Dataf%
GenderMale3227.4
Female8270.1
Age25–3521.7
36–452622.2
46–556253.0
Older than 562723.1
Marital statusSingle119.4
Married9177.8
Divorced119.4
Other43.4
Education levelSecondary education level86.8
University degree5244.4
Master’s degree5042.7
PhD degree76.0
Table 2. Sample presentation: working profile data.
Job/Working Profile Dataf%
Regional Unit (R.U.)R.U. of Heraklion3630.8
Headquarters Unit1916.2
R.U. of Lasithi1815.4
R.U. of Chania2622.2
R.U. of Rethymno1714.5
Years of work1–8 years4841.0
9–16 years2924.8
17–24 years2924.8
More than 25 years109.0
Managerial positionYes4336.8
No7362.4
Number of colleagues1–5 colleagues1613.7
6–9 colleagues2521.4
10–15 colleagues2319.7
16–20 colleagues1412.0
More than 21 colleagues3832.5
Desire to maintain their job positionYes7160.7
No119.4
I have some concerns3429.1
SalaryLess than EUR 1000 1512.8
EUR 1001–1250 5950.4
EUR 1251–1500 3832.5
More than EUR 1501 43.4
Table 3. Grouping of variables.
FactorsVariables
Environment/working conditionsFactors of job satisfaction
Position workload
Relevance of work to studies
Earnings/salary
Opportunity for personal development
Safety in the workplace and the job position
Flexibility in working hours
Relationships with colleagues
Relationships with supervisors
Total satisfactionTotal satisfaction/
commitment
Total commitment
Forecasting staffing needsHR planning
Eligibility of new personnel
Staff needs investigation
Additional benefits (bonuses, overtime, etc.).Motivation practices
Offering flexibility in permits, facility leaves, etc.
Satisfactory working environment (furniture, facilities)
Working atmosphere
Staff satisfaction investigation
Effective resolution of employees’ problems
Fair evaluation of performanceEvaluation of productivity
Evaluation based on job specifics
Evaluation is perceived as an improvement process
Training programs are providedProgram of training and
personal development
Employee support is provided
Training to new entrants is provided
Identification of employees’ educational needs
Development and/or career opportunities
Enhancing employee initiativeEmployee involvement/
participation
Participation in decisions affecting themselves
Encouragement to propose improvements
Open constant communication
Table 4. Descriptive statistics for the variable: factors of job satisfaction.
ResultsNot at AllTo a Small ExtentTo Some ExtentTo a Large ExtentVery MuchMeanS.D.
Factors of Job SatisfactionEnvironment/working conditions0.003.4028.2049.6017.903.830.76
Position workload14.51227.429.116.23.211.28
Relevance of work to studies7.71222.238.518.83.491.16
Earnings/salary5.125.641.921.45.12.960.95
Opportunity for personal development10.321.434.226.56.82.981.09
Safety in the workplace and the job position2.610.329.93521.43.631.02
Flexibility in working hours2.613.725.642.714.53.530.99
Relationships with
colleagues
0.001.714.544.438.54.210.75
Relationships with
supervisors
0.94.31241.940.24.170.87
Table 5. Descriptive statistics for the variable: total satisfaction/commitment.
ResultsNot at AllTo a Small ExtentTo Some ExtentTo a Large ExtentVery MuchMeanS.D.
Total Satisfaction/
Commitment
Total Satisfaction1.7636.842.7123.580.85
Total Commitment0.001.75.148.743.64.350.66
Table 6. Descriptive statistics for the variable: HR planning.
ResultsNot at AllTo a Small ExtentTo Some ExtentTo a Large ExtentVery MuchMeanS.D.
HR PlanningForecasting staffing needs28.222.229.915.43.42.431.16
Eligibility of new personnel14.517.935.923.96.82.911.13
Staff needs investigation10.318.834.231.64.33.011.05
Table 7. Descriptive statistics for the variable: motivation practices.
ResultsNot at AllTo a Small ExtentTo Some ExtentTo a Large ExtentVery MuchMeanS.D.
Motivation PracticesAdditional benefits (bonuses, overtime, etc.)8.521.433.327.48.53.061.09
Offering flexibility in permits, facility leaves, etc.0.910.331.641.914.53.590.89
Satisfactory working environment (furniture, facilities)1.76.825.652.1123.670.85
Working atmosphere1.77.723.946.219.73.750.92
Staff satisfaction investigation10.318.830.830.87.73.071.11
Effective resolution of employees’ problems7.715.434.230.811.13.221.09
Table 8. Descriptive statistics for the variable: evaluation of productivity.
ResultsNot at AllTo a Small ExtentTo Some ExtentTo a Large ExtentVery MuchMeanS.D.
Evaluation of ProductivityFair evaluation of performance15.414.538.528.22.62.881.07
Evaluation based on job specifics14.514.541.922.262.911.10
Evaluation is perceived as an improvement process11.115.439.327.463.021.06
Table 9. Descriptive statistics for the variable: program of training and personal development.
ResultsNot at AllTo a Small ExtentTo Some ExtentTo a Large ExtentVery MuchMeanS.D.
Program of Training and
Personal Development
Training programs are provided0.006.834.236.821.43.730.88
Employee support is provided5.112.838.531.611.13.311.01
Training to new entrants is provided7.723.935.927.43.42.950.99
Identification of employees’ educational needs7.718.833.329.110.33.161.09
Development and/or
career opportunities
17.921.437.617.14.32.681.10
Table 10. Descriptive statistics for the variable: employee involvement/participation.
ResultsNot at AllTo a Small ExtentTo Some ExtentTo a Large ExtentVery MuchMeanS.D.
Employee Involvement/ParticipationEnhancing employee initiative0.912.840.235.99.43.410.86
Participation in decisions affecting themselves5.118.832.536.863.200.99
Encouragement to propose improvements3.414.531.640.29.43.380.97
Open constant communication0.910.321.444.422.23.780.94
Table 11. Job satisfaction/satisfaction with HR practices.
Job SatisfactionSatisfaction with HR Practices
NValid116116
Missing11
Mean 3.63093.1944
Median 3.63103.1905
Std. deviation 0.56896073231
Minimum 21.57
Maximum 54.86
Percentiles253.27272.6871
503.6313.1905
754.00833.7
Table 12. Means of all variables/working profile data.
Participants’ Working Profile DataFactors of Job SatisfactionTotal Satisfaction/CommitmentHR Programming FactorsMotivation PracticesEvaluation of ProductivityProgram of Training and Personal DevelopmentEmployee Involvement/ParticipationJob SatisfactionSatisfaction with HR Practices
Regional Unit (R.U.)R.U. of Heraklion 3.533.922.843.33.013.193.603.603.18
Headquarters Unit3.774.032.983.653.253.393.823.823.43
R.U. of Lasithi3.544.062.483.22.943.163.633.633.07
R.U. of Chania3.523.962.93.512.723.153.603.603.22
R.U. of Rethymno3.453.912.573.322.752.873.533.533.05
Years of work1–8 years3.623.983.133.533.153.33.683.683.36
9–16 years3.613.912.693.292.943.083.663.663.14
17–24 years3.4442.433.362.753.033.543.543.07
More than 25 years3.473.952.433.152.433.163.553.552.95
Managerial positionYes3.64.062.633.32.873.323.683.683.19
No3.533.912.873.452.973.073.603.603.20
Number of colleagues1–5 colleagues3.653.752.583.122.943.053.663.663.02
6–9 colleagues3.74.243.073.623.253.383.803.803.45
10–15 colleagues3.714.112.93.533.123.293.783.783.33
16–20 colleagues3.43.822.833.332.573.233.483.483.14
More than 21 colleagues3.393.842.593.32.752.973.473.473.04
Desire to maintain this job positionYes3.844.233.133.643.283.493.913.913.50
No2.843.451.822.522.292.952.952.29
I have some concerns3.213.592.363.162.512.773.283.282.86
SalaryLess than EUR 1000 3.383.872.823.3733.043.473.473.18
EUR 1001–1250 3.633.912.863.4133.193.683.683.22
EUR 1251–1500 3.524.072.613.382.823.213.623.623.16
More than EUR 1501 3.534.253.083.382.752.83.663.663.24
Table 13. Means of all variables/demographic data.
Participants’ Demographic DataFactors of Job SatisfactionTotal Satisfaction/CommitmentHR Programming FactorsMotivation PracticesEvaluation of ProductivityProgram of Training and Personal DevelopmentEmployee Involvement/ParticipationJob SatisfactionSatisfaction with HR Practices
GenderMale3.504.002.653.402.983.213.543.213.59
Female3.573.962.833.372.943.173.403.193.64
Age18–240.000.000.000.000.000.000.000.000.00
25–352.833.502.502.832.832.802.882.792.95
36–453.834.043.323.673.333.423.813.543.87
46–553.443.832.673.322.813.063.323.093.51
Older than 563.634.242.573.342.853.203.413.143.74
Marital statusSingle3.724.053.173.433.233.523.603.423.78
Married3.543.982.743.392.953.153.423.183.62
Divorced3.504.133.173.422.922.953.943.303.61
Other3.553.732.673.402.553.073.253.073.58
Education levelBasic education level0.000.000.000.000.000.000.000.000.00
Secondary education level3.464.132.713.273.332.973.473.173.58
University degree3.714.072.993.593.053.283.543.353.78
Master’s degree3.463.862.643.262.763.083.333.073.53
PhD degree3.193.792.333.052.863.113.433.013.30
Table 14. Skewness and Kurtosis values: test.
VariablesSkewnessKurtosis
Job satisfaction0.2250.446
Satisfaction with HRM practices0.2250.446
Table 15. Correlation analysis.
Spearman’s RhoSatisfaction with HRM Practices
Job satisfactionCorrelation coefficient0.776
Sig. (2-tailed)0.000
Table 16. Analysis of variance in job satisfaction/working profile data.
Sum of SquaresdfMean SquareFSig.
Regional Unit (R.U.)Between groups0.88440.2210.6750.611
Within groups36.3441110.327
Total37.228115
Years of workBetween groups0.43730.1460.4440.722
Within groups36.7911120.328
Total37.228115
Managerial positionBetween groups0.210.20.6160.434
Within groups37.0281140.325
Total37.228115
Number of colleaguesBetween groups2.5240.632.0150.097
Within groups34.7081110.313
Total37.228115
Desire to maintain their job positionBetween groups14.78527.39237.2200.000
Within groups22.4431130.199
Total37.228115
SalaryBetween groups0.53330.1780.5420.654
Within groups36.6951120.328
Total37.228115
Table 17. Analysis of variance in job satisfaction/demographic data.
Sum of SquaresdfMean SquareFSig.
GenderBetween groups0.05910.0590.1790.673
Within groups36.2971110.327
Total36.355112
AgeBetween groups3.51831.1733.8970.011
Within groups33.711120.301
Total37.228115
Marital statusBetween groups0.26730.0890.2700.847
Within groups36.9611120.33
Total37.228115
Education levelBetween groups2.37630.7922.5450.060
Within groups34.8521120.311
Total37.228115
Table 18. Analysis of variance in satisfaction with HR practices/working profile data.
Sum of SquaresdfMean SquareFSig.
Regional Unit (R.U.)Between groups1.7440.4350.8050.524
Within groups59.9321110.54
Total61.671115
Years of workBetween groups2.42230.8071.5260.212
Within groups59.251120.529
Total61.671115
Managerial positionBetween groups0100.0010.977
Within groups61.6711140.541
Total61.671115
Number of colleagues Between groups3.53540.8841.6880.158
Within groups58.1361110.524
Total61.671115
Desire to maintain their job positionBetween groups19.29529.64725.7260.000
Within groups42.3761130.375
Total61.671115
SalaryBetween groups0.10430.0350.0630.979
Within groups61.5681120.55
Total61.671115
Table 19. Analysis of variance in satisfaction with HR practices/demographic data.
Sum of SquaresdfMean SquareFSig.
GenderWithin groups59.4211110.535
Total59.433112
AgeBetween groups3.9931.332.5820.057
Within groups57.6811120.515
Total61.671115
Marital statusBetween groups0.74430.2480.4560.714
Within groups60.9271120.544
Total61.671115
Education levelBetween groups2.17930.7261.3670.256
Within groups59.4921120.531
Total61.671115
Disclaimer/Publisher’s Note: The statements, opinions and data contained in all publications are solely those of the individual author(s) and contributor(s) and not of MDPI and/or the editor(s). MDPI and/or the editor(s) disclaim responsibility for any injury to people or property resulting from any ideas, methods, instructions or products referred to in the content.

