
Construction and Application of an Ecological Quality Evaluation System Based on a PIE-Engine †


Abstract
1. Introduction
2. Materials
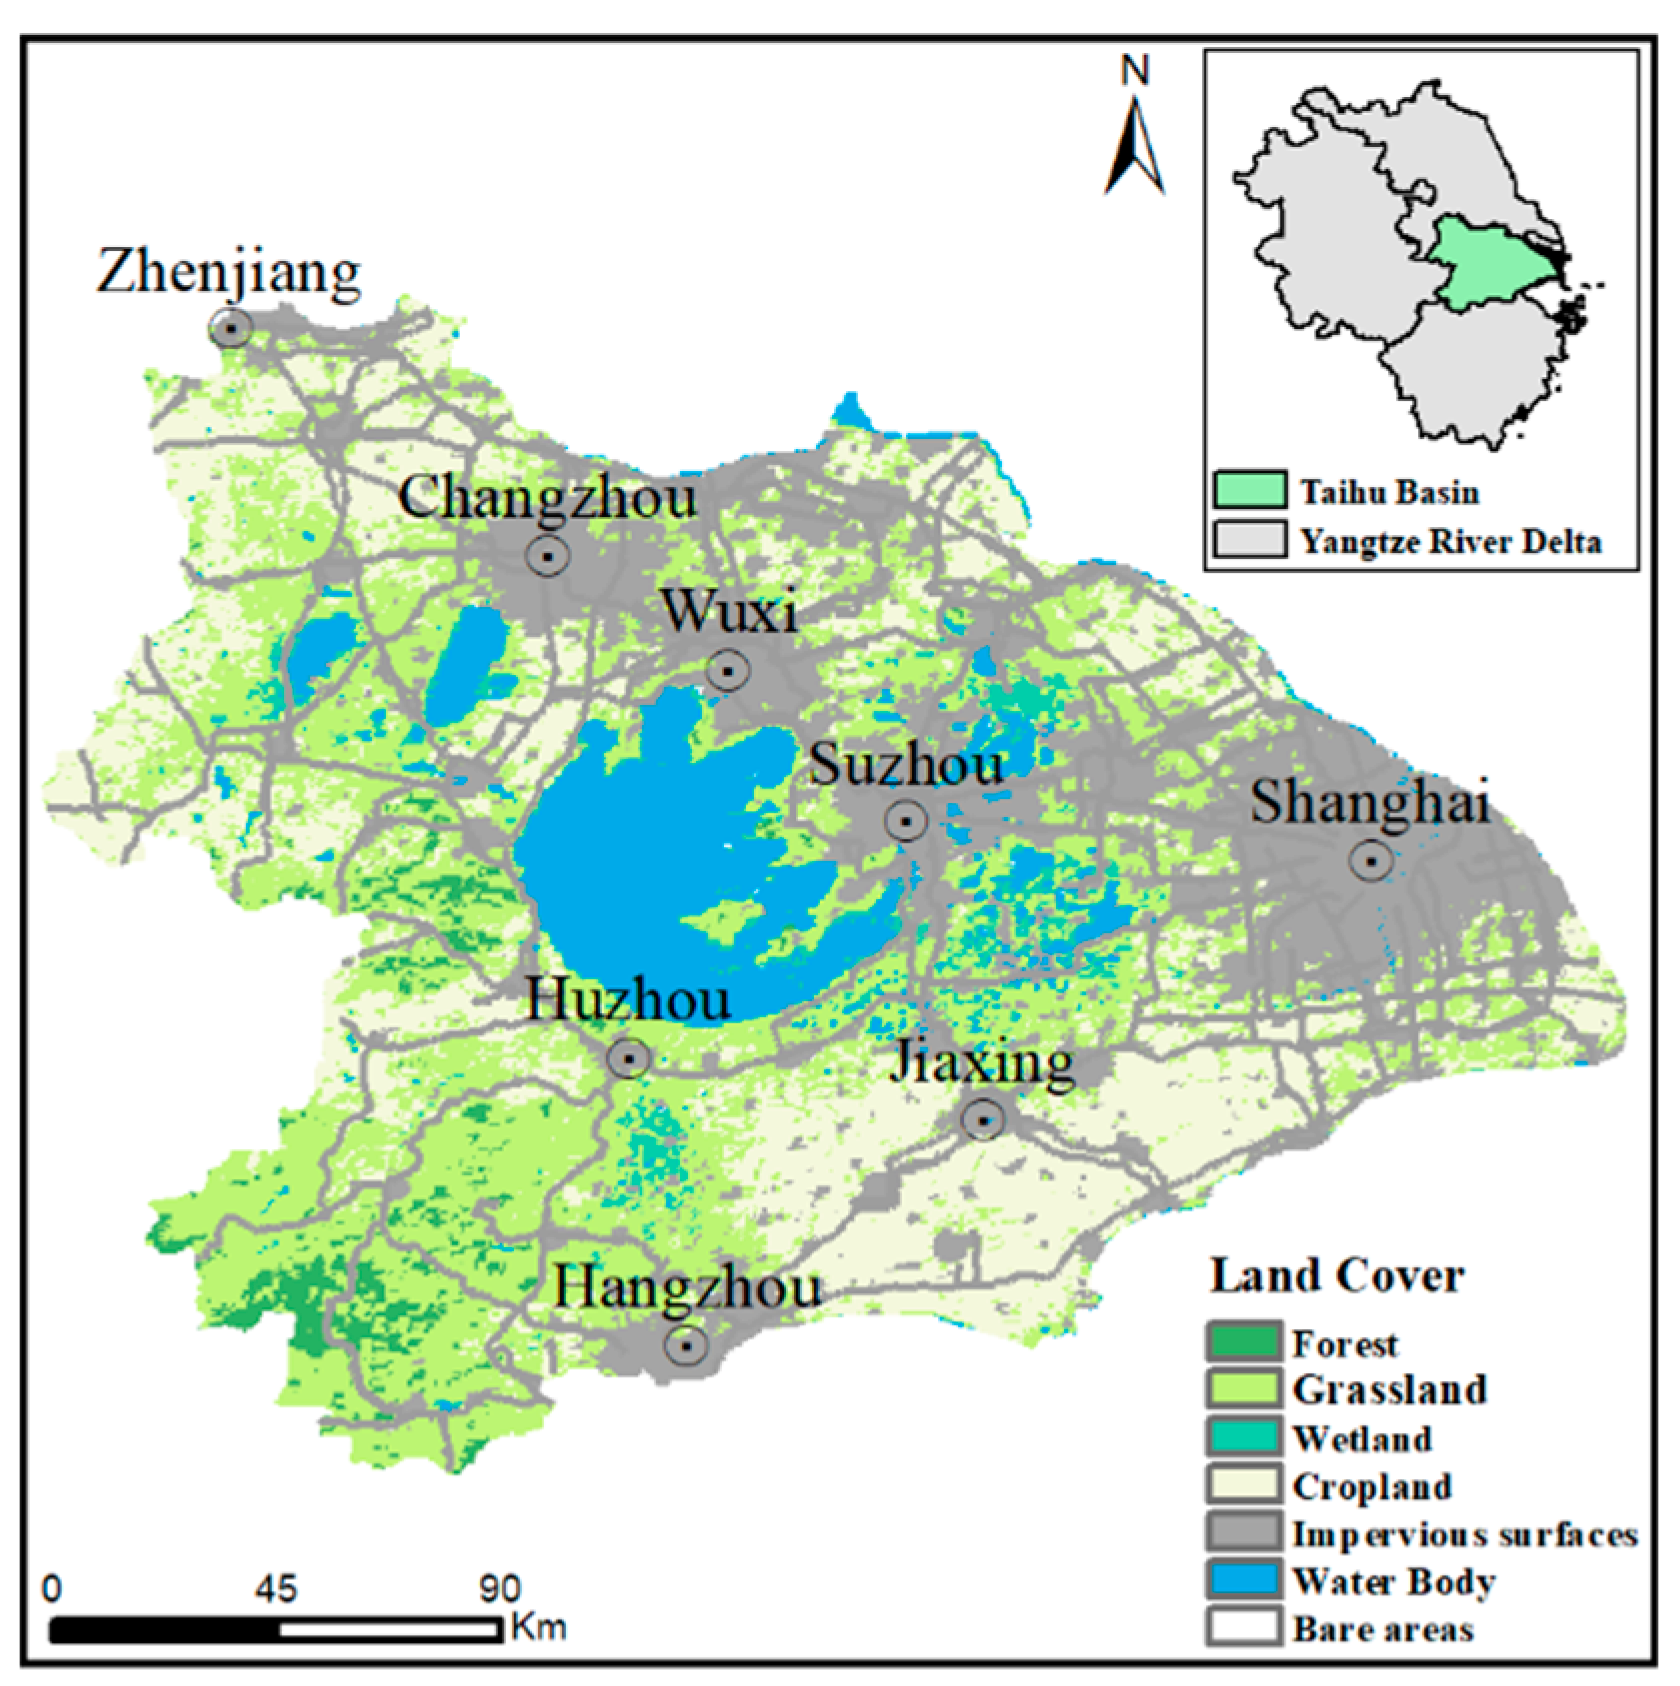
2.1. Study Area
2.2. Construction of the Remote Sensing Index of Ecological Quality
2.2.1. Ecological Function Index
2.2.2. Ecological Stability Index
2.2.3. Ecological Threat Index
3. Results and Discussion
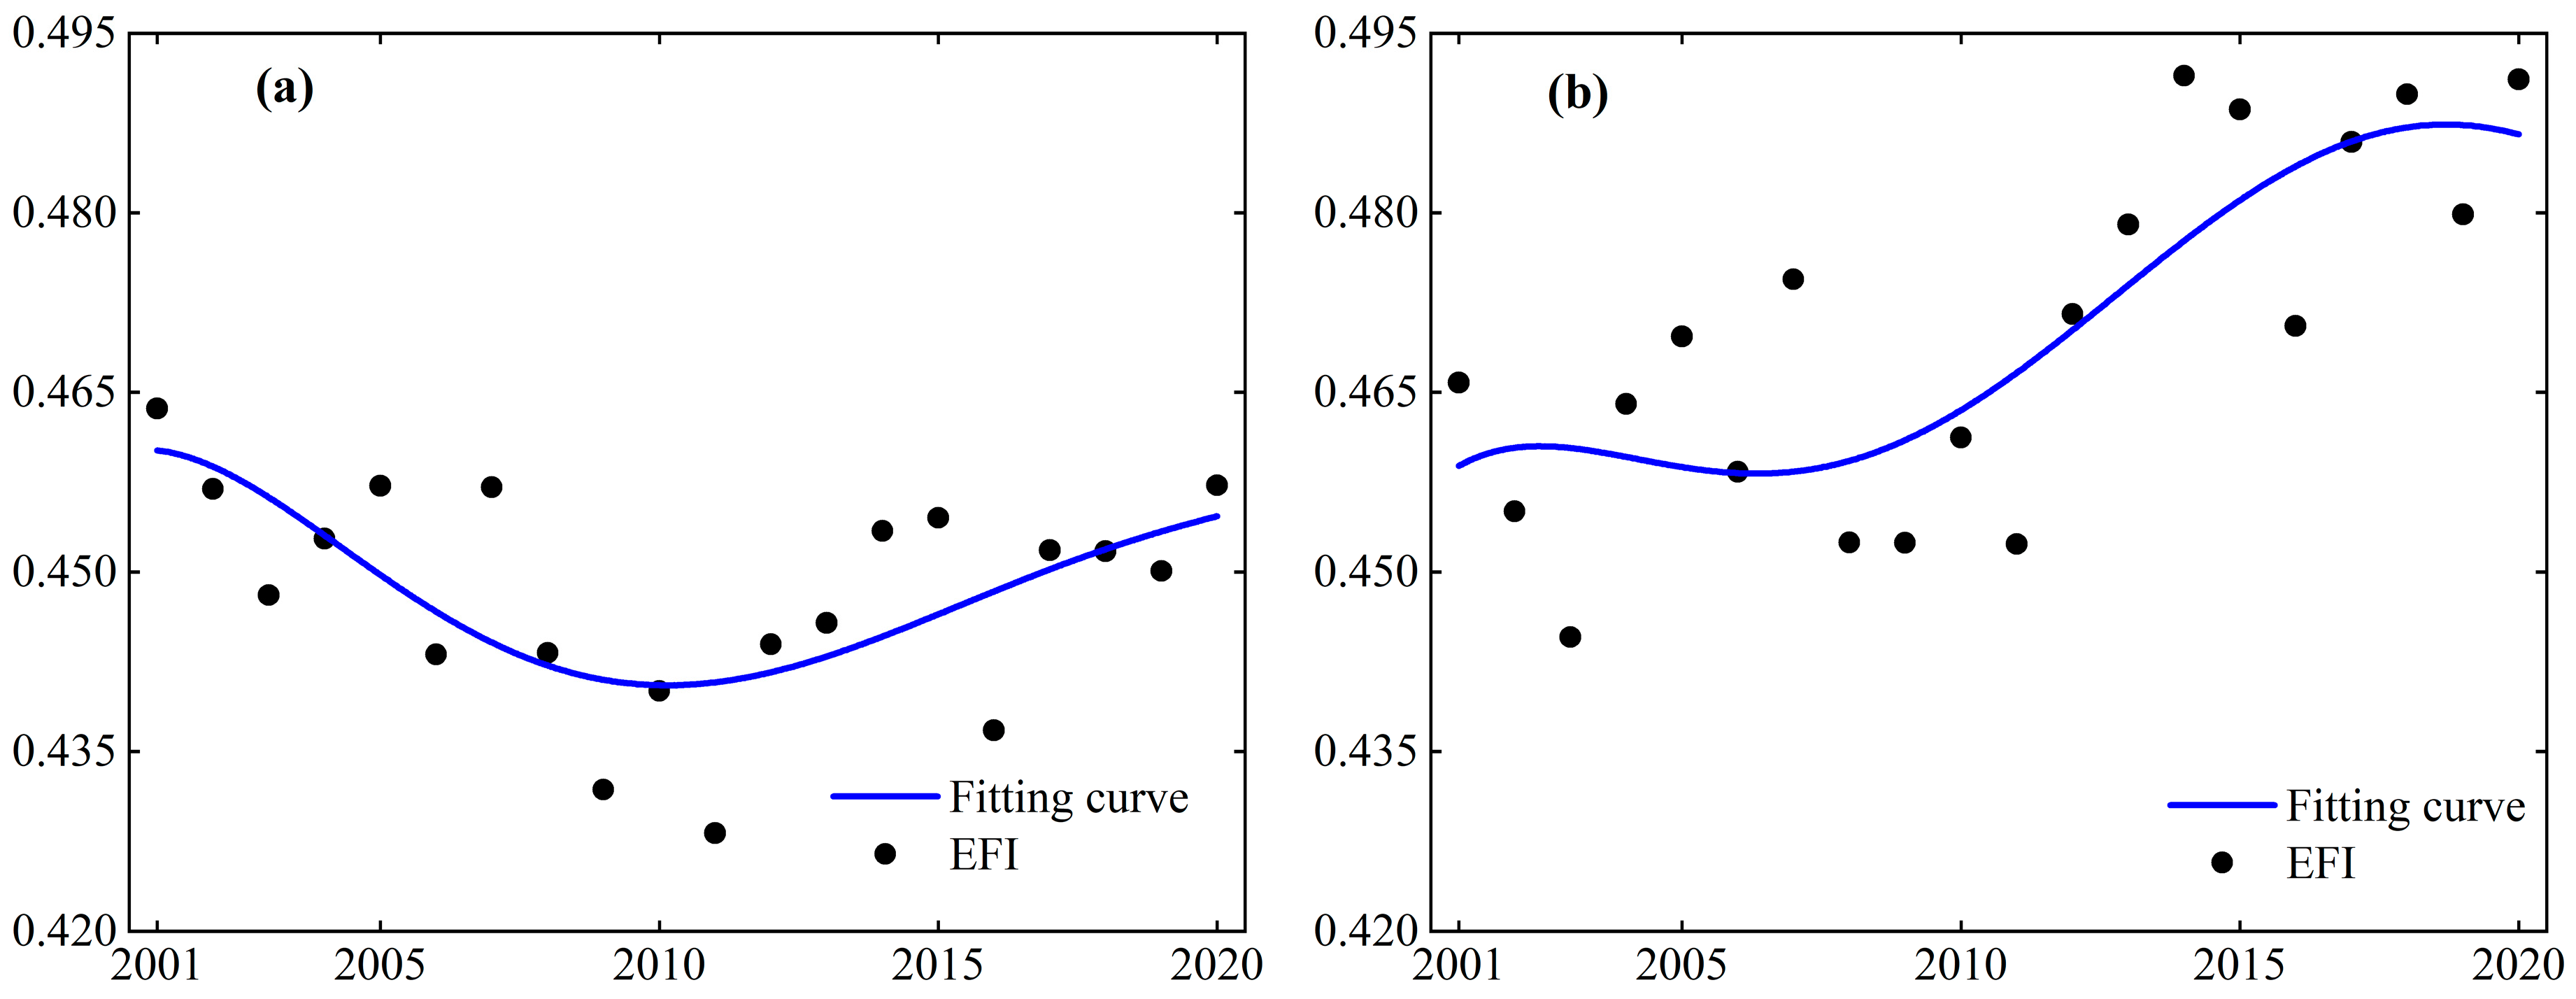
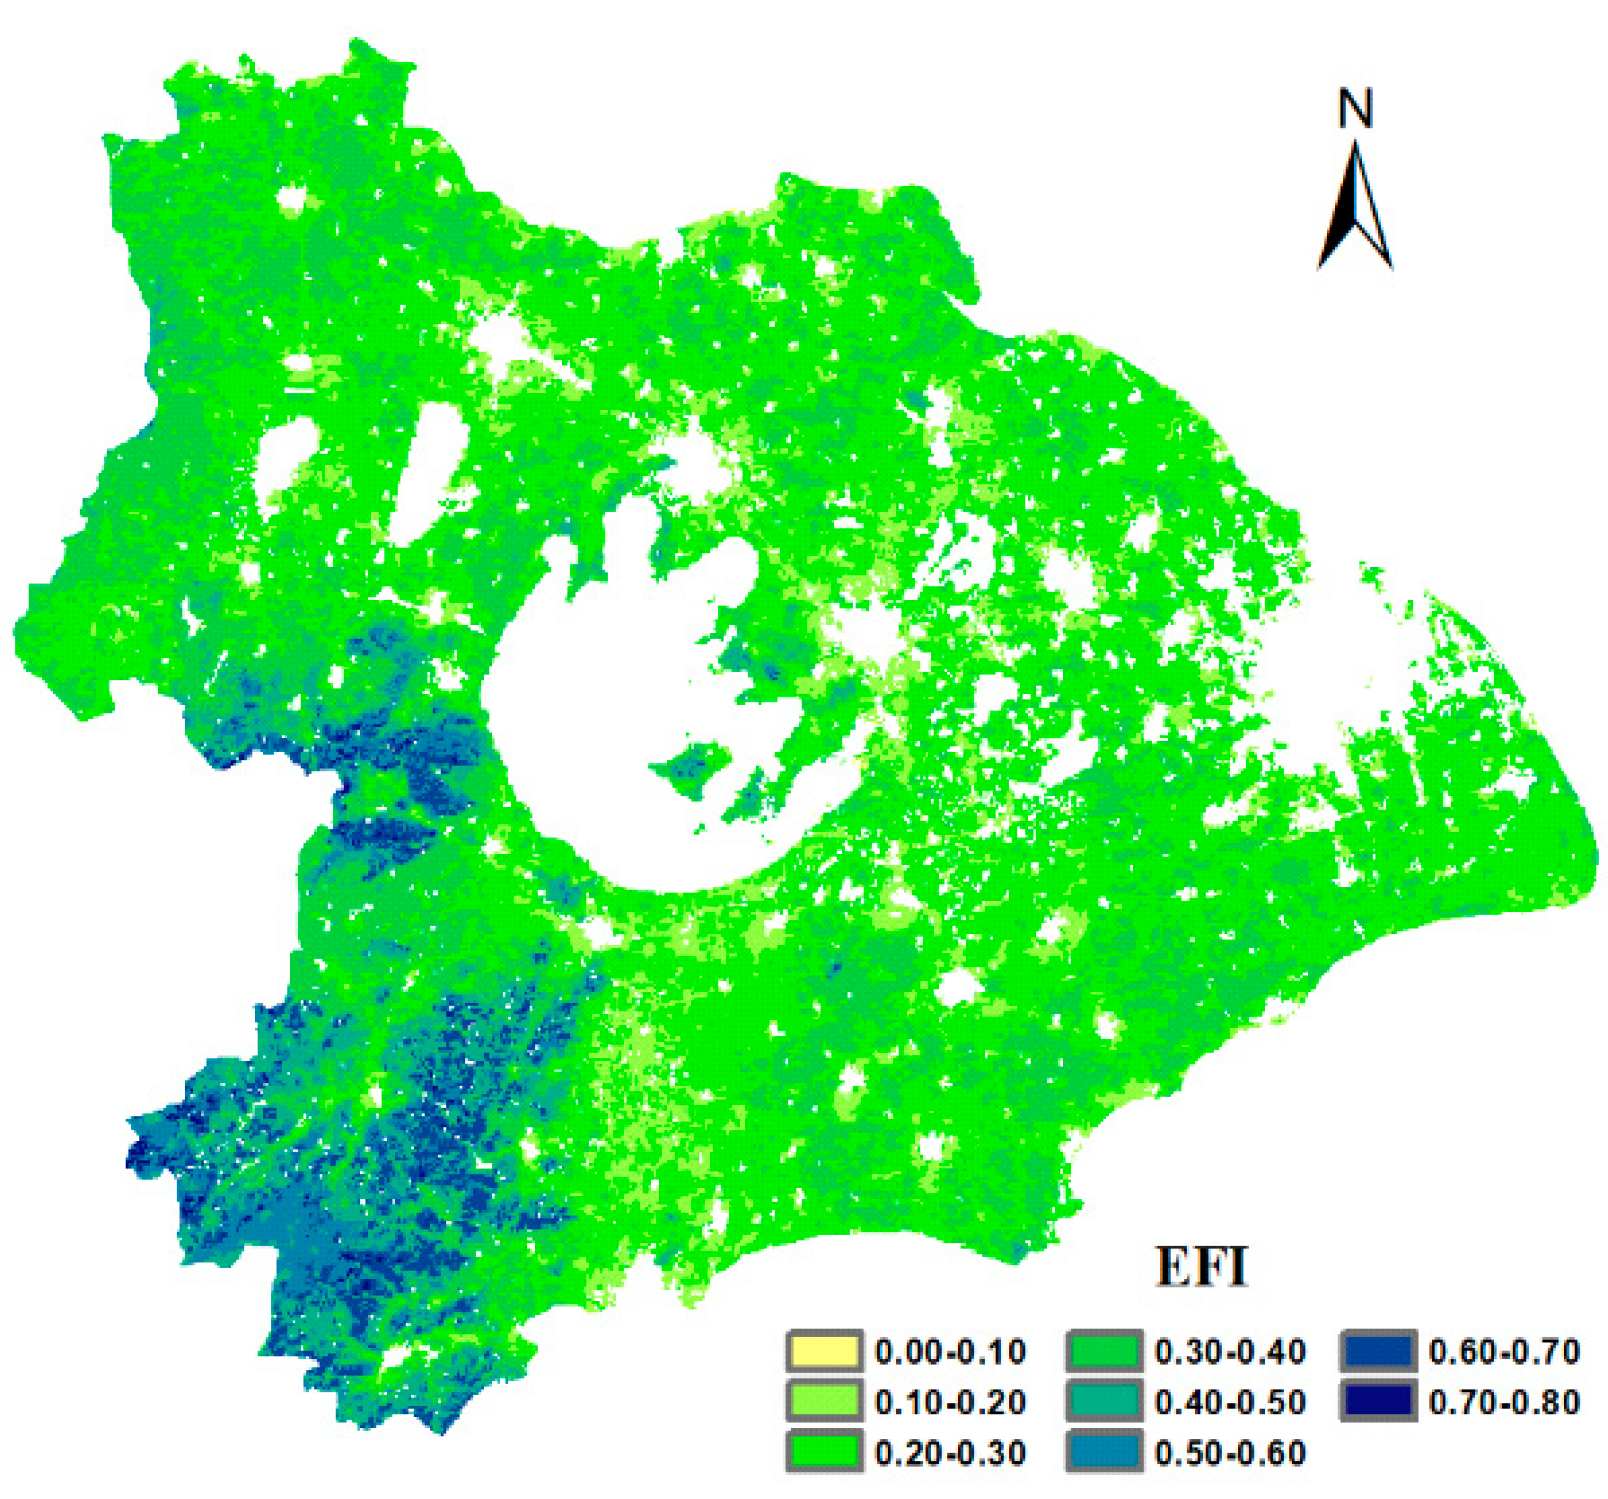
3.1. Spatiotemporal Variation in EFI in the Taihu Basin
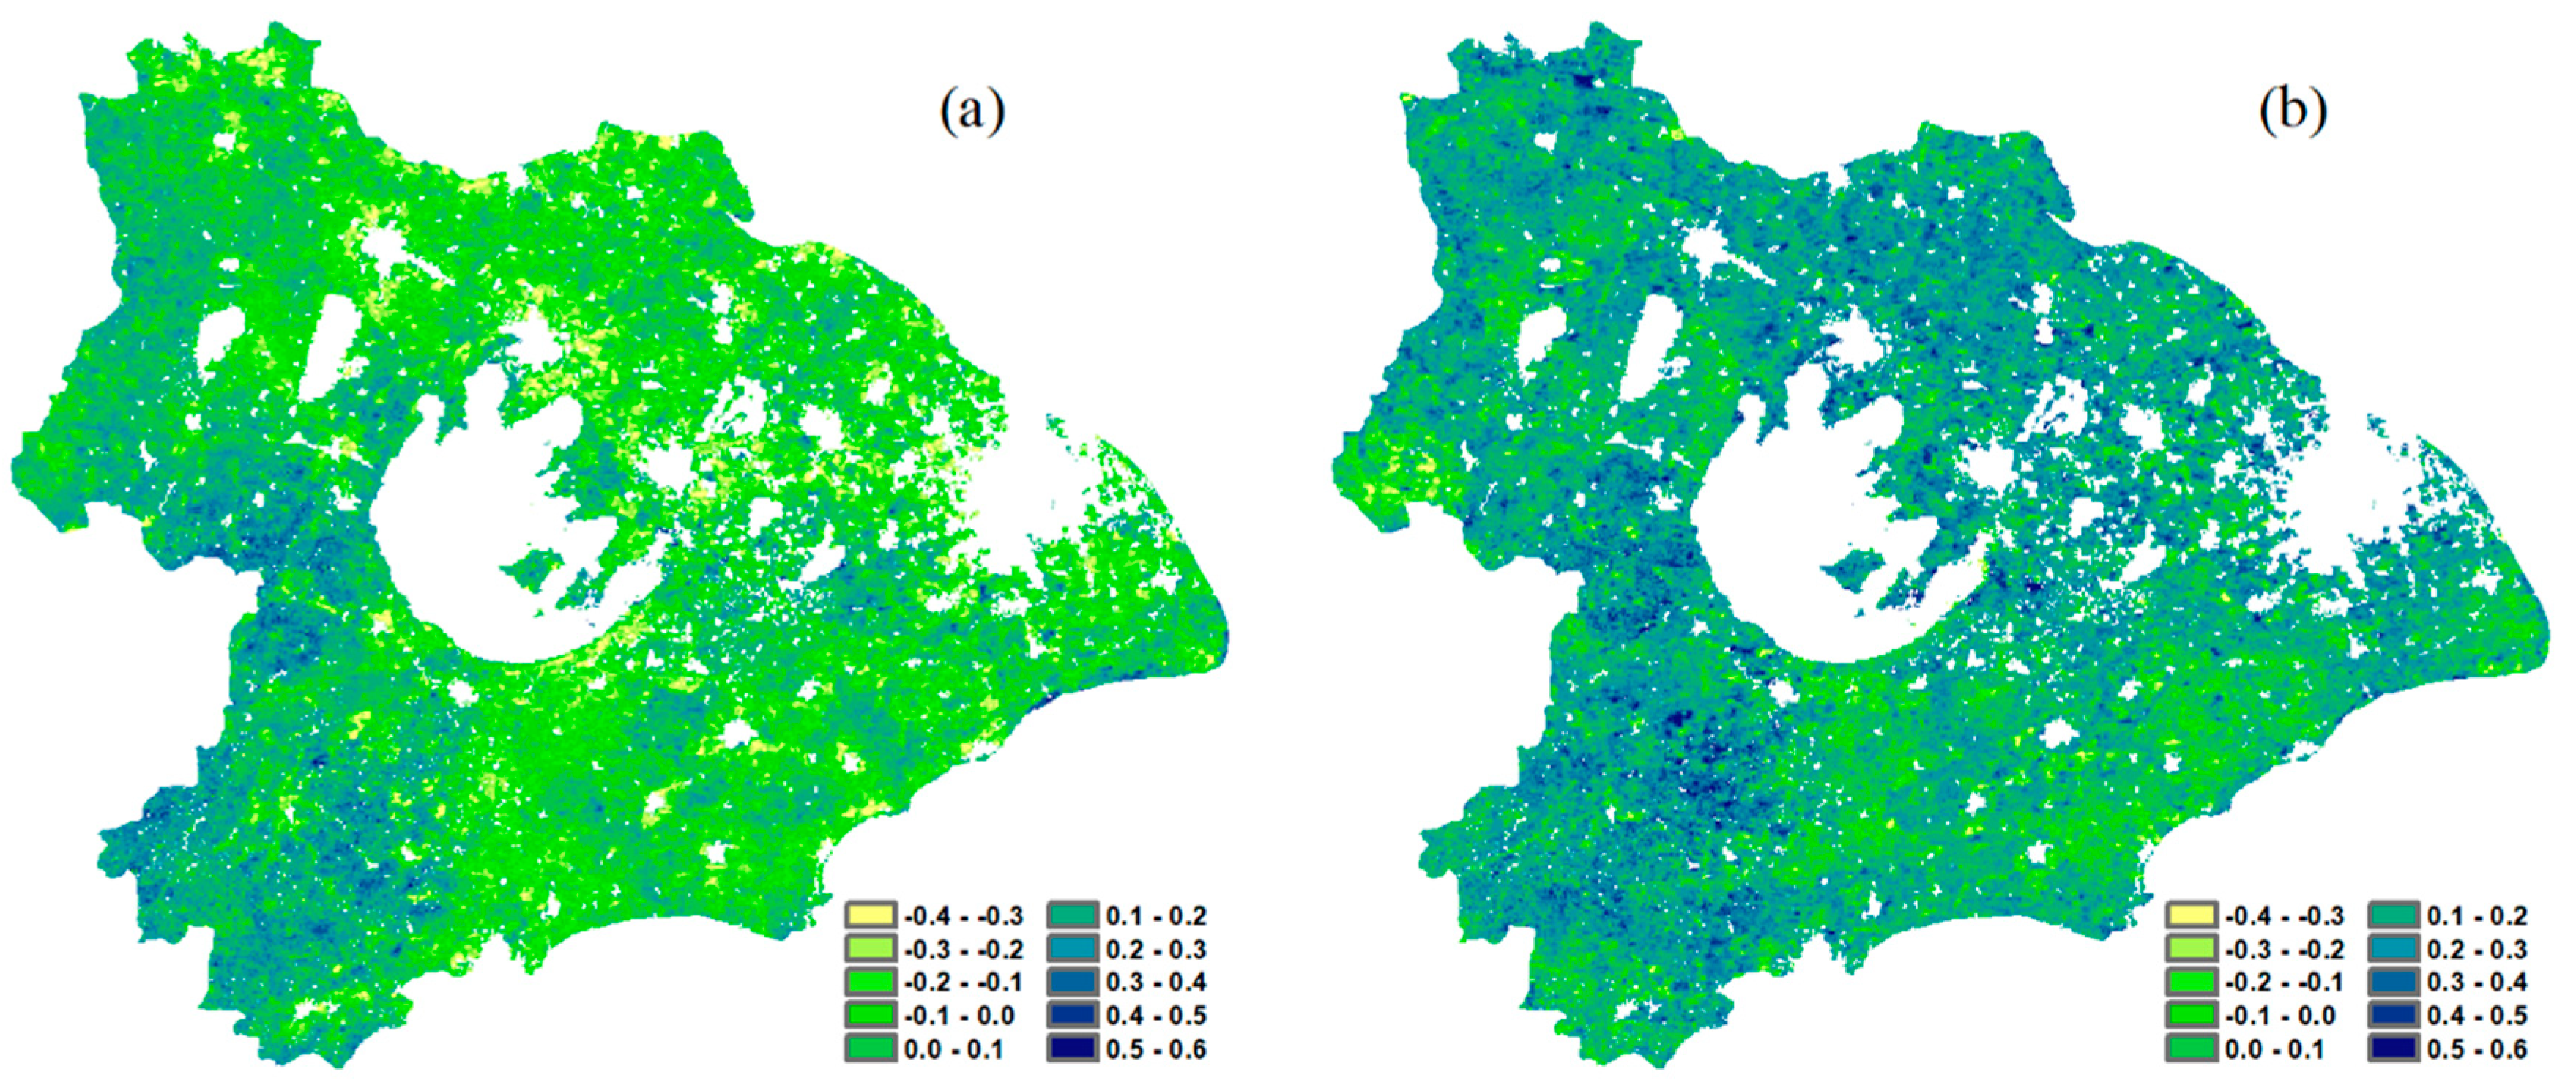
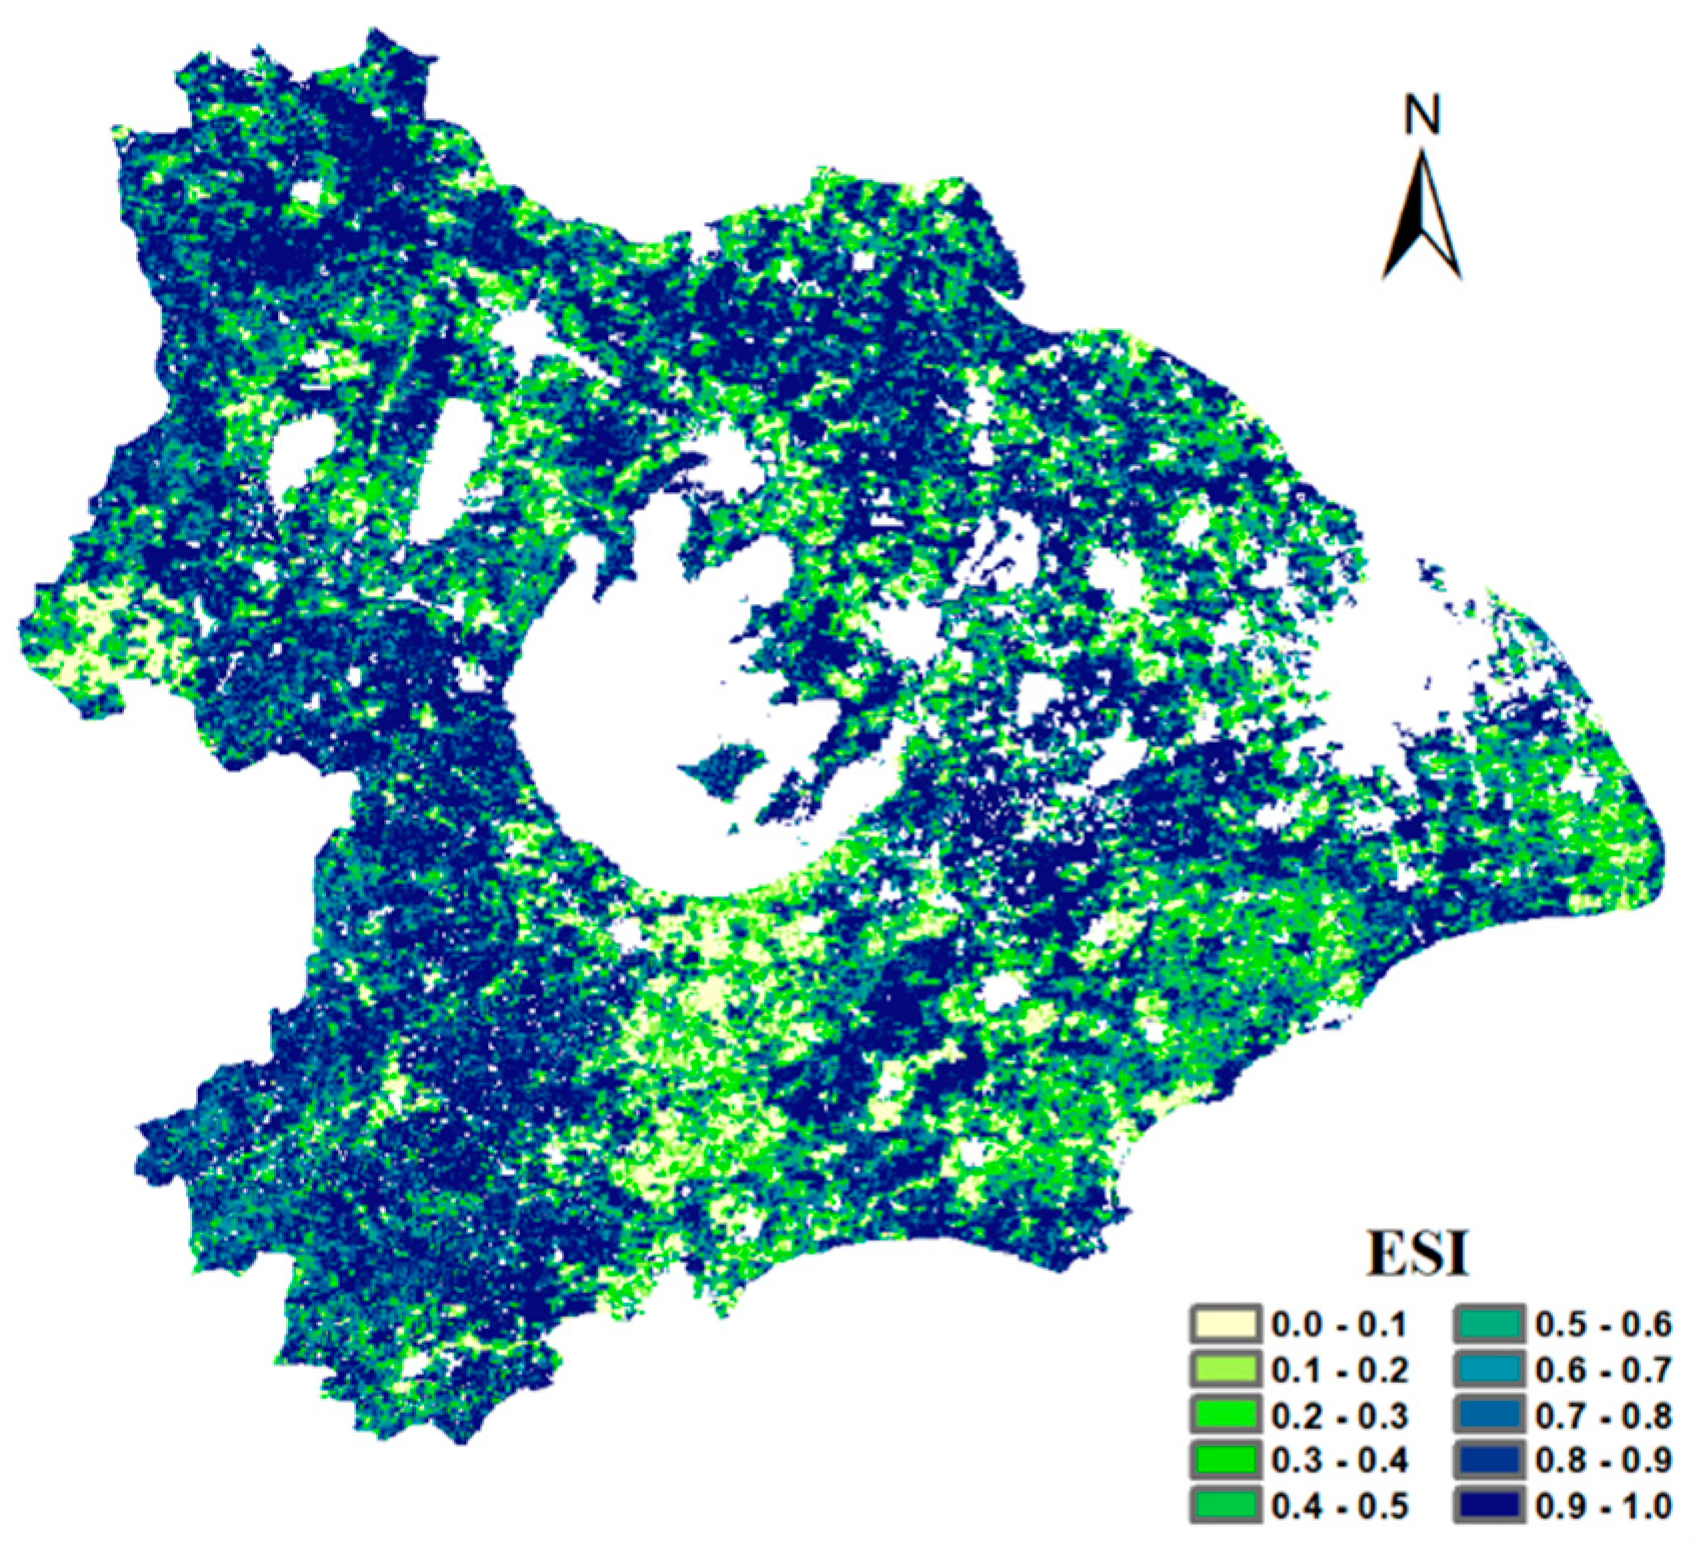
3.2. Spatiotemporal Variation in ESI in the Taihu Basin
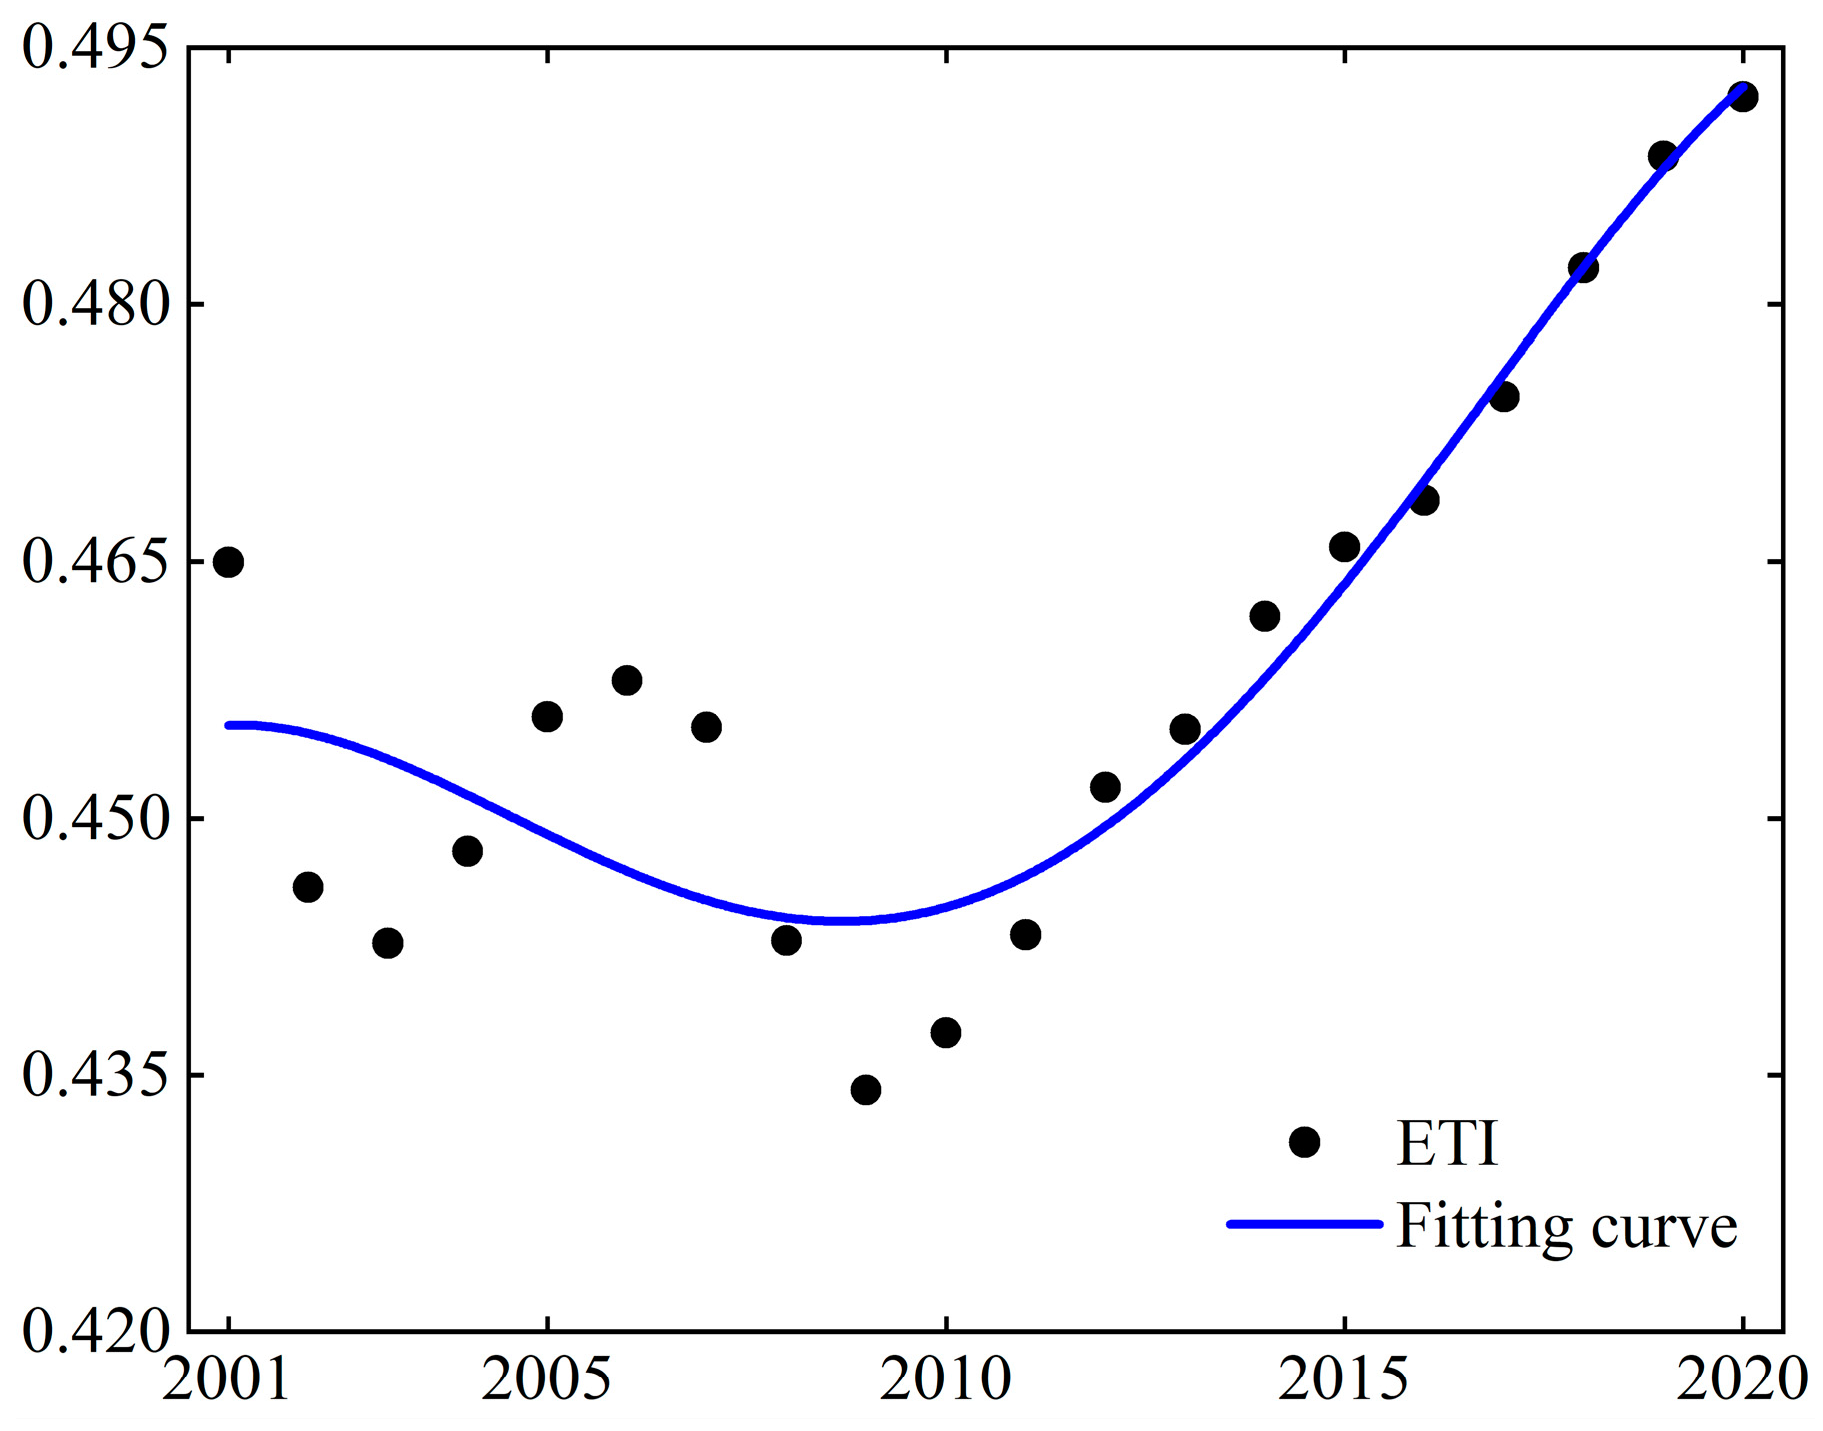
3.3. Change Analysis of ETI in the Taihu Basin
4. Conclusions
- (1)
- The overall average EFI of the Taihu Basin exhibited a trend of an initial decrease followed by an increase between 2001 and 2020. Significant spatial differences in EFI were observed, with the highest EFI appearing in the western and southwestern areas of the Taihu basin, characterized by forest and grassland cover, while the densely urbanized northeastern part of the basin exhibited relatively lower EFI values;
- (2)
- The mean ESI of the Taihu Basin exhibited a trend of initial decrease followed by an increase, with the rate of increase surpassing the rate of decrease. The ESI was higher in the southwest, while it was relatively lower in the southeastern, southern, and western regions;
- (3)
- The ETI of the Taihu Basin exhibited a fluctuating trend, initially decreasing and then increasing. The rate of increase was higher than the rate of decrease, indicating that the risk of ecosystem quality degradation is still rising. Land use change is the most important threat factor for habitat quality, with grassland reduction and urban expansion being the primary contributors to the increase in the ETI.
Author Contributions
Funding
Institutional Review Board Statement
Informed Consent Statement
Data Availability Statement
Conflicts of Interest
References
- Martinez-Haro, M.; Beiras, R.; Bellas, J.; CoelhonJ, P.; Lopes, I.; Marques, J.C. A review on the ecological quality status assessment in aquatic systems using community based indicators and ecotoxicological tools: What might be the added value of their combination? Ecol. Indic. 2015, 48, 8–16. [Google Scholar] [CrossRef]
- Das, S.; Pradhan, B.; Shit, P.K.; Alamri, A.M. Assessment of Wetland Ecosystem Health Using the Pressure–State–Response (PSR) Model: A Case Study of Mursidabad District of West Bengal (India). Sustainability 2020, 12, 5932. [Google Scholar] [CrossRef]
- Costanza, R. Ecosystem health and ecological engineering. Ecol. Eng. 2012, 45, 24–29. [Google Scholar] [CrossRef]
- Xu, H.Q. A remote sensing urban ecological index and its application. Acta. Ecol. Sin. 2013, 33, 7853–7862. [Google Scholar]
- Gao, J.X.; Wan, H.W.; Wang, Y.C.; Hou, P.; Shi, P.R.; Sun, C.X. New framework for large-scale ecological quality evaluation and application research using remote sensing data. Natl. Remote Sen. Bull. 2023, 27, 2860–2872. [Google Scholar] [CrossRef]
- Liu, H.; Liao, T.; Wang, Y.; Qian, X.; Liu, X.; Li, C. Fine-grained wetland classification for national wetland reserves using multi-source remote sensing data and Pixel Information Expert Engine (PIE-Engine). GIsci. Remote Sens 2023, 60, 2286746. [Google Scholar] [CrossRef]
- Liu, S.L.; Liu, L.M.; Wu, X.; Hou, X.Y.; Zhao, S.; Liu, G.H. Quantitative evaluation of human activity intensity on the regional ecologic-al impact studies. Acta. Ecol. Sin. 2018, 38, 6797–6809. [Google Scholar]
Disclaimer/Publisher’s Note: The statements, opinions and data contained in all publications are solely those of the individual author(s) and contributor(s) and not of MDPI and/or the editor(s). MDPI and/or the editor(s) disclaim responsibility for any injury to people or property resulting from any ideas, methods, instructions or products referred to in the content. |
© 2024 by the authors. Licensee MDPI, Basel, Switzerland. This article is an open access article distributed under the terms and conditions of the Creative Commons Attribution (CC BY) license (https://creativecommons.org/licenses/by/4.0/).
Share and Cite
Li, P.; Ye, C.; Li, L.; Jiang, J. Construction and Application of an Ecological Quality Evaluation System Based on a PIE-Engine. Proceedings 2024, 110, 9. https://doi.org/10.3390/proceedings2024110009
Li P, Ye C, Li L, Jiang J. Construction and Application of an Ecological Quality Evaluation System Based on a PIE-Engine. Proceedings. 2024; 110(1):9. https://doi.org/10.3390/proceedings2024110009
Chicago/Turabian StyleLi, Pengdu, Cuiheng Ye, Lei Li, and Jie Jiang. 2024. "Construction and Application of an Ecological Quality Evaluation System Based on a PIE-Engine" Proceedings 110, no. 1: 9. https://doi.org/10.3390/proceedings2024110009
APA StyleLi, P., Ye, C., Li, L., & Jiang, J. (2024). Construction and Application of an Ecological Quality Evaluation System Based on a PIE-Engine. Proceedings, 110(1), 9. https://doi.org/10.3390/proceedings2024110009