
Spatiotemporal Analysis of Carbon Emissions and Uptake Changes from Land-Use in the Yangtze River Delta Region †


Abstract
1. Introduction
2. Materials
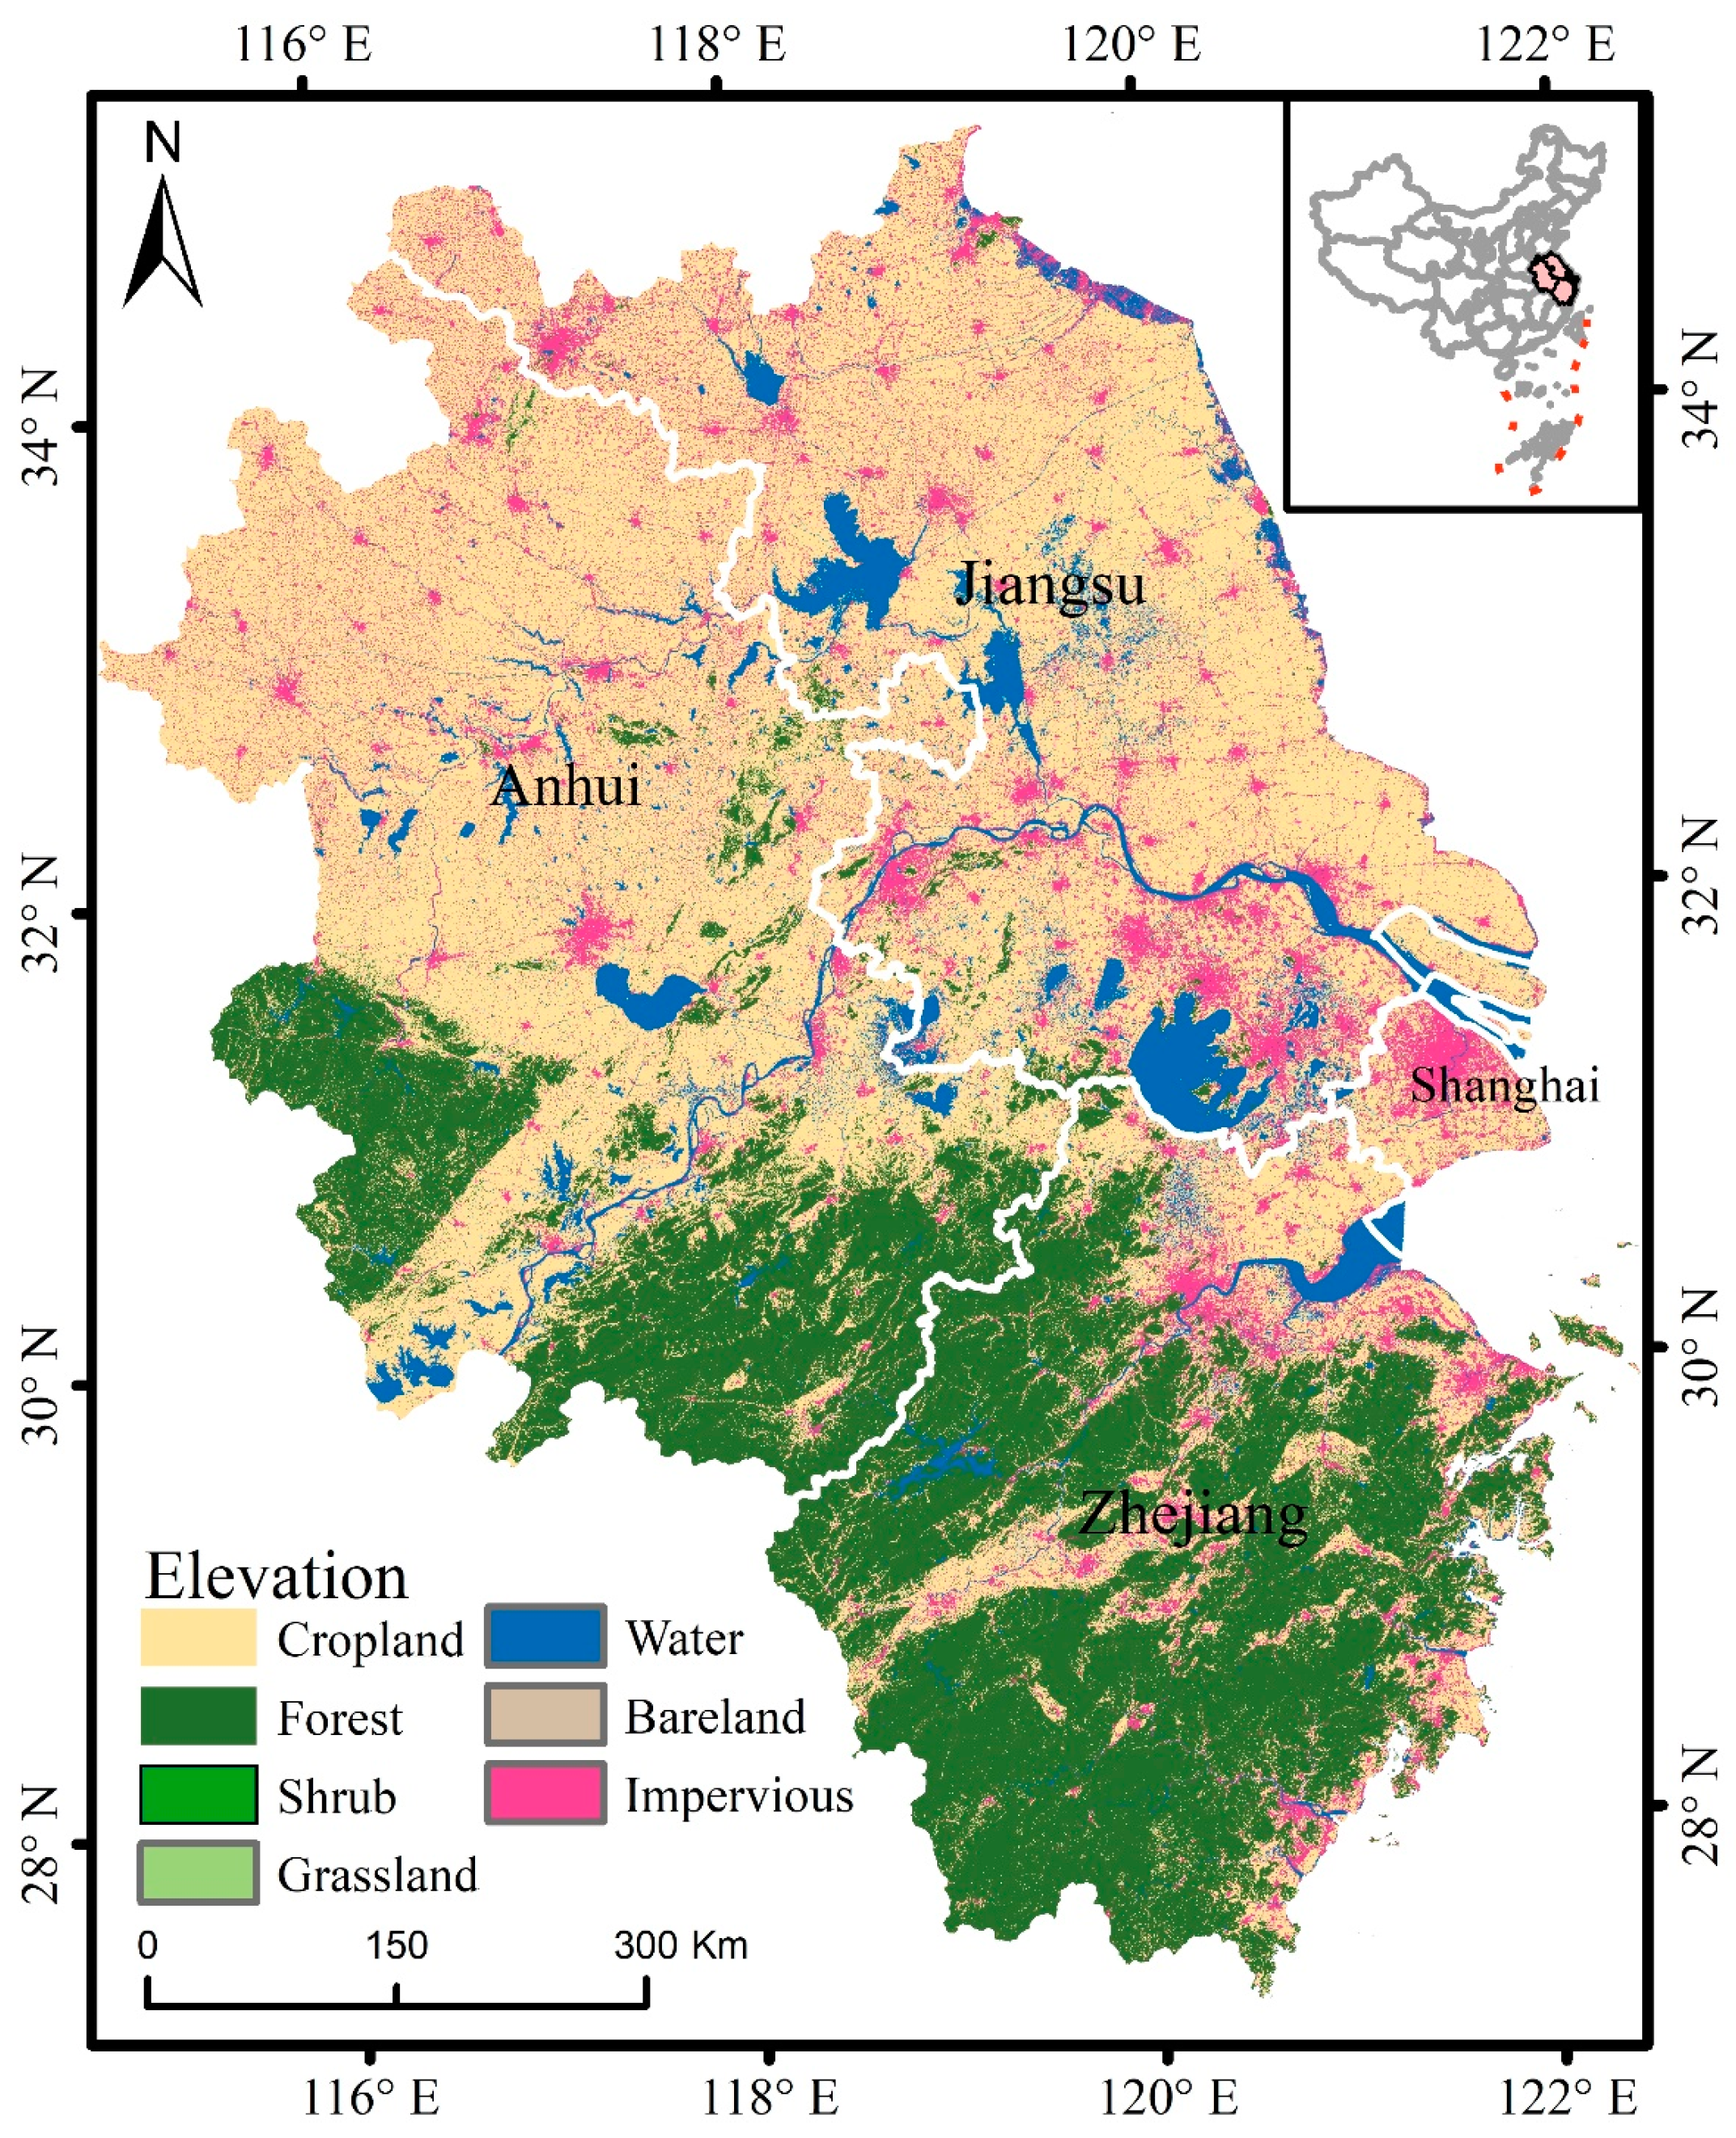
2.1. Area of Study
2.2. Land Cover and Energy Consumption Data
3. Methods
3.1. Carbon Emissions Calculation Model
3.2. LMDI Factor Decomposition Method
4. Results
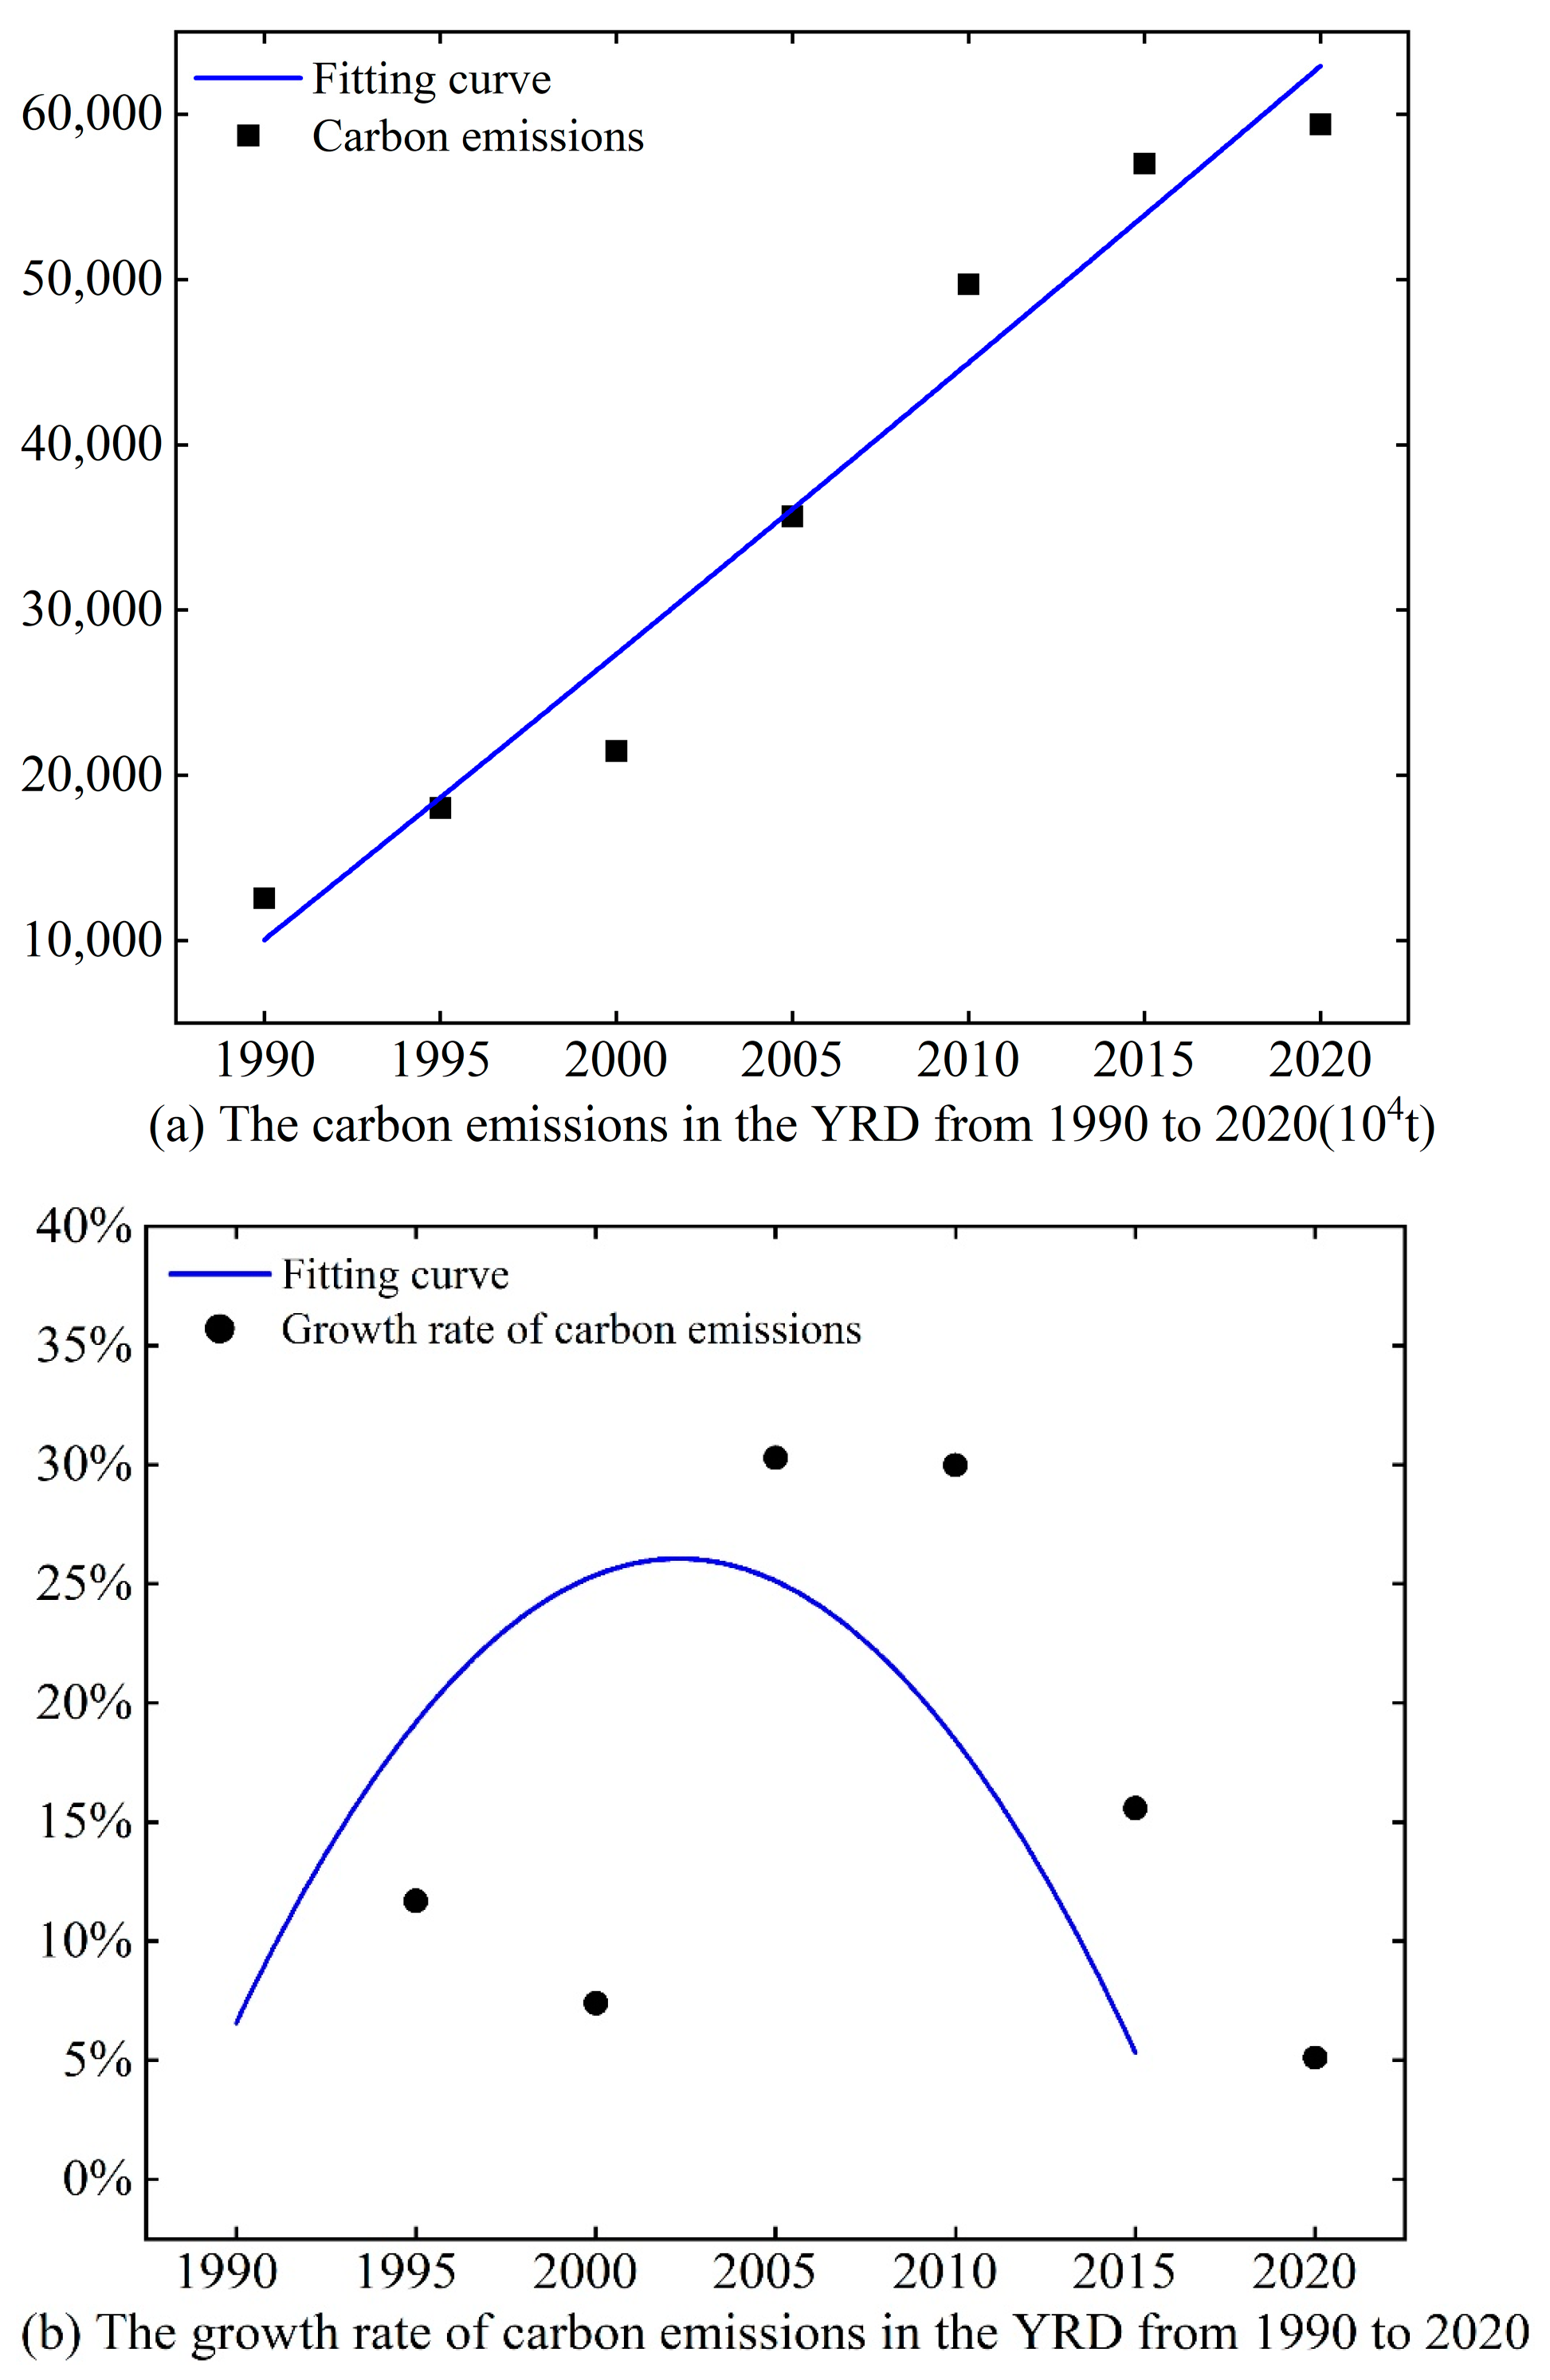
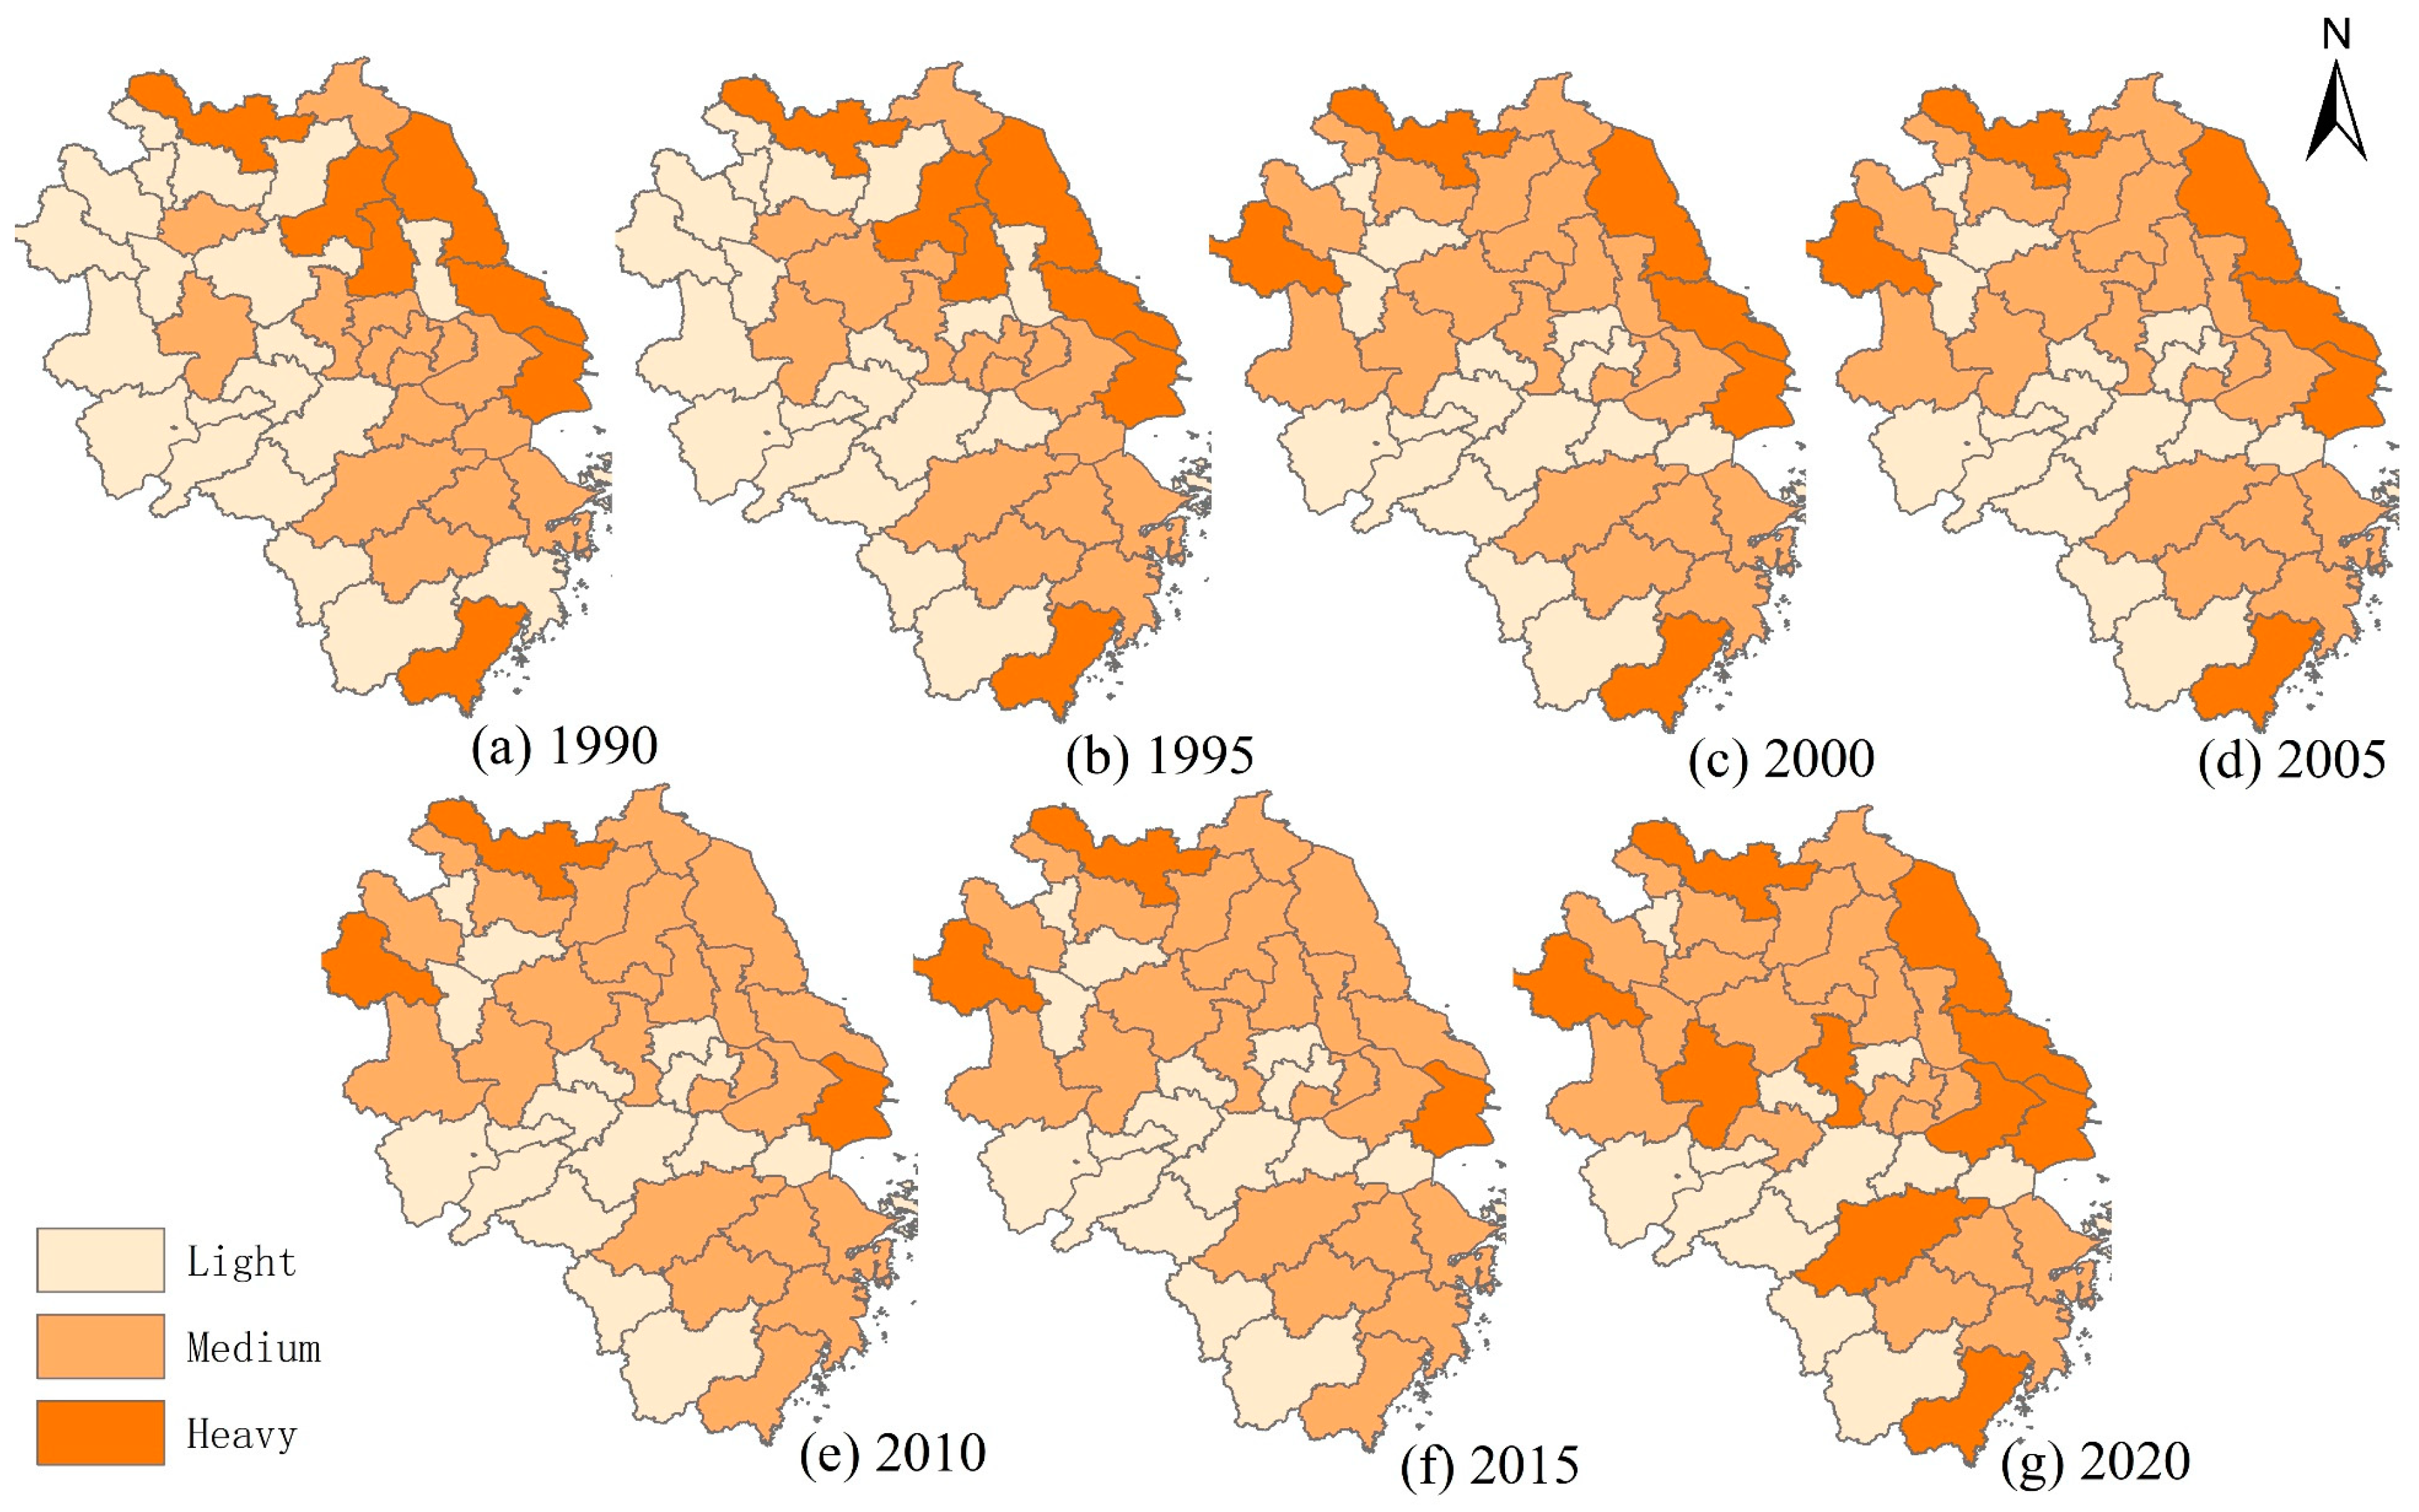
4.1. Analysis of Carbon Emissions in Spatial and Temporal
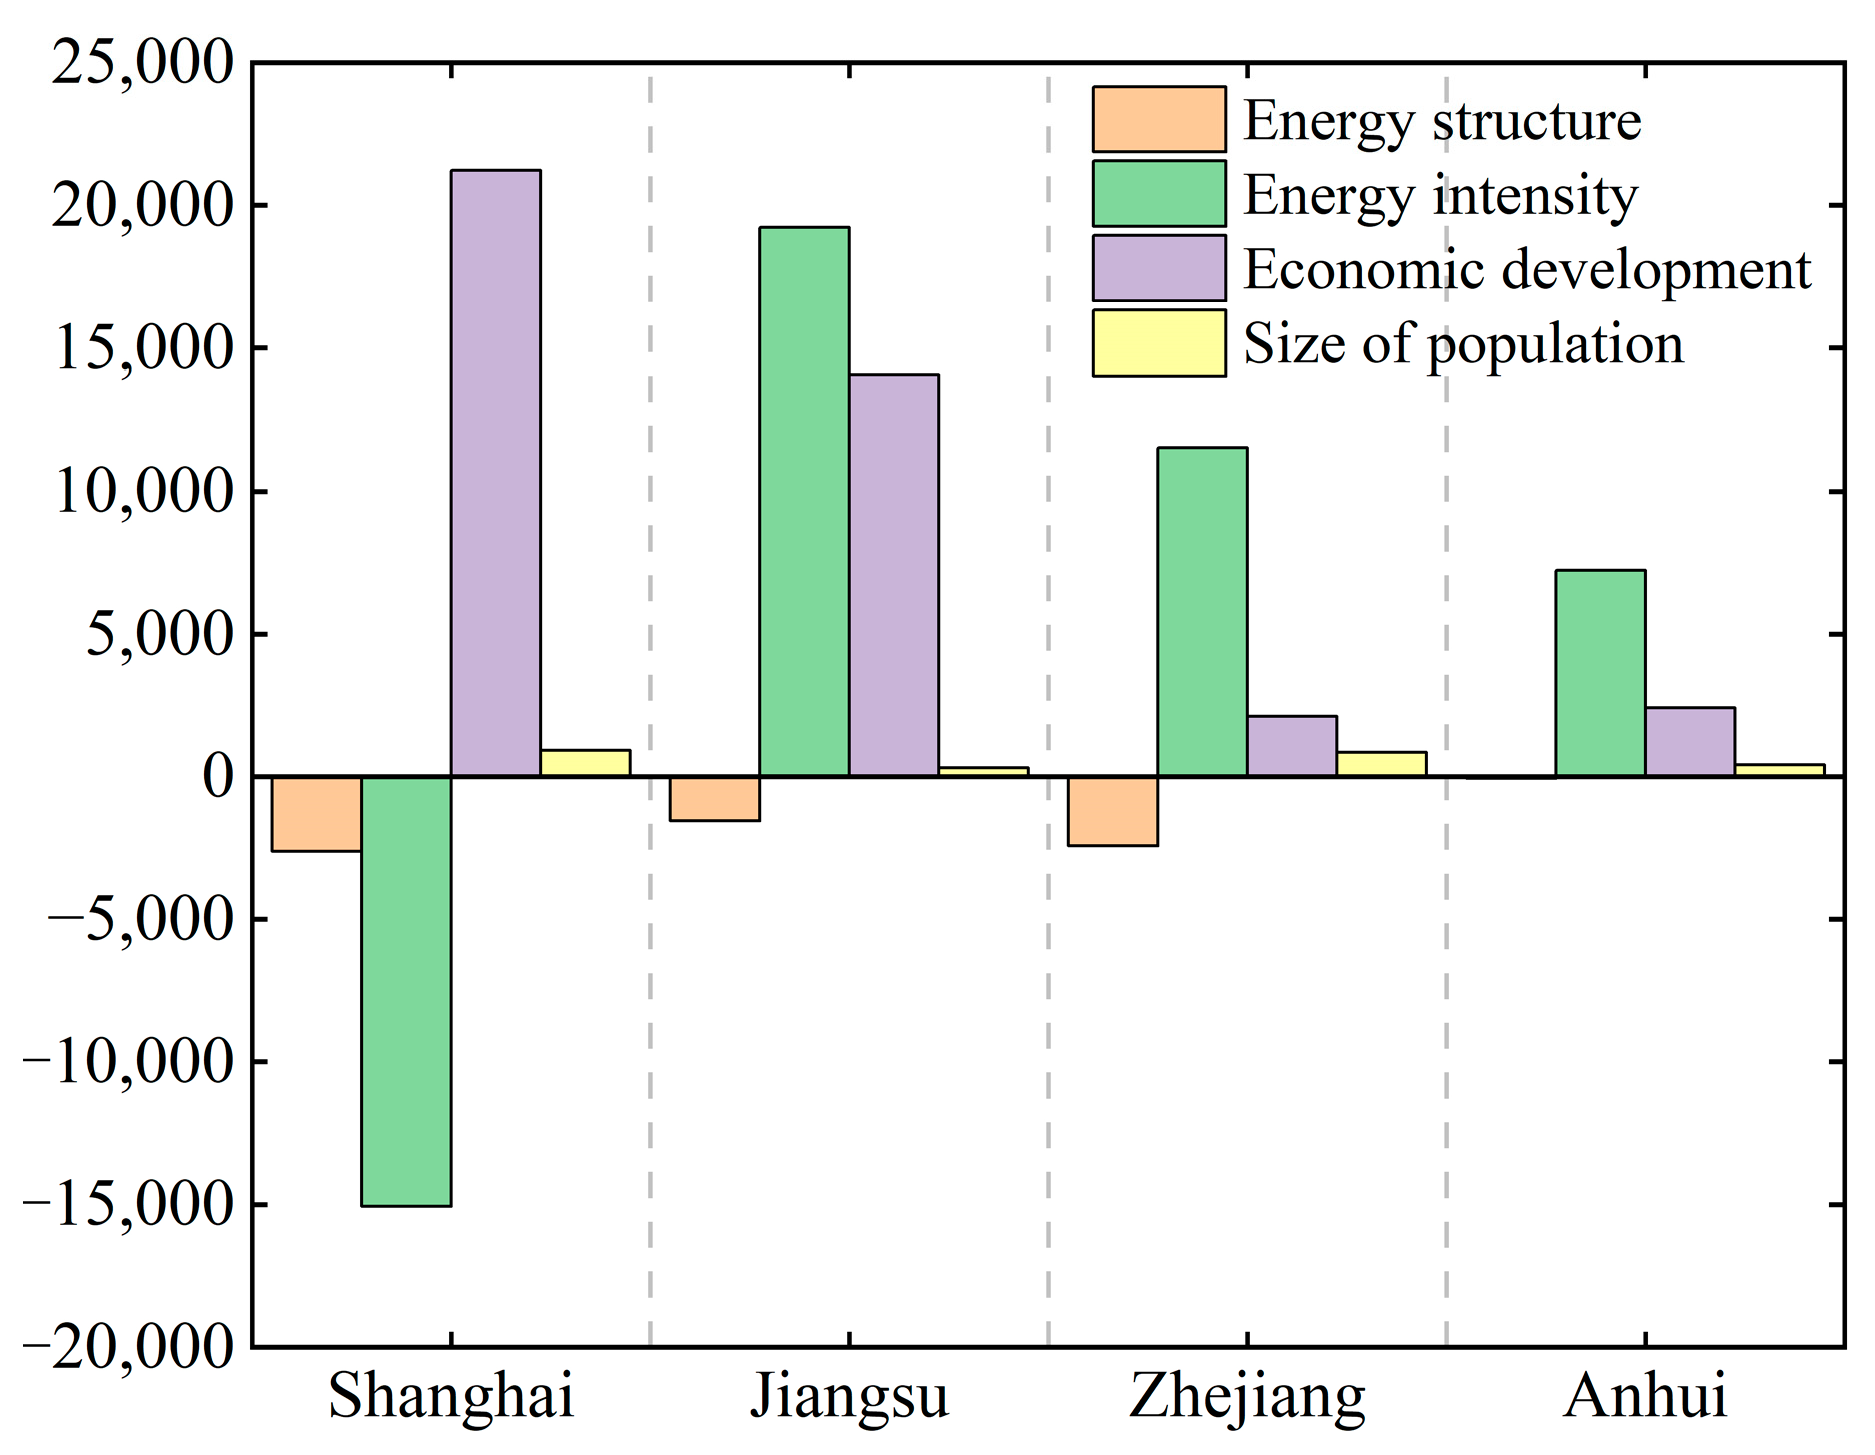
4.2. Analysis of Carbon Emission Impact Factors
5. Conclusions
Author Contributions
Funding
Institutional Review Board Statement
Informed Consent Statement
Data Availability Statement
Conflicts of Interest
References
- Rong, T.; Zhang, P.; Zhu, H. Spatial correlation evolution and prediction scenario of land use carbon emissions in China. Ecol. Inform. 2022, 71, 101802. [Google Scholar] [CrossRef]
- Zhao, N.; Zhou, L.; Zhuang, J. Integration analysis of the carbon sources and sinks in terrestrial ecosystems China. Acta Ecol. Sin. 2021, 41, 7648–7658. [Google Scholar]
- Feng, J.; Zhang, S.; Wang, T. Analysis of inter-provincial land use carbon emissions and its influencing factors in China. Stat. Decis. 2019, 35, 141–145. [Google Scholar]
- Wei, Y.R.; Chen, S.L. Spatial correlation and carbon balance zoning of land use carbon emissions in Fu Jian Province. Acta Ecol. Sin. 2021, 41, 5814–5824. [Google Scholar]
- Wang, K.L.; Zhang, F.Q.; Xu, R.Y.; Miao, Z.; Cheng, Y.H.; Sun, H.P. Spatiotemporal pattern evolution and influencing factors of green innovation efficiency: A China’s city level analysis. Ecol. Indic. 2023, 146, 109901. [Google Scholar] [CrossRef]
- Yu, Z.; Chen, L.; Tong, H.; Chen, L.G.; Zhang, T.; Li, L.; Yuan, L.; Xiao, J.; Wu, R.; Bai, L.F.; et al. Spatial correlations of land-use carbon emissions in the Yangtze River Delta region: A perspective from social network analysis. Ecol. Indic. 2022, 142, 109147. [Google Scholar] [CrossRef]
- Yang, J.; Huang, X. The 30 m annual land cover and its dynamics in China from 1990 to 2019. Earth Syst. Sci. Data 2021, 13, 3907–3925. [Google Scholar] [CrossRef]
- Hu, H.Z. China Energy Statistics Yearbook China Energy Statistics Yearbook 2022; China Statistics Press: Beijing, China, 2022. [Google Scholar]
- Li, Z.; Cao, T.; Sun, Z. Spatial-Temporal Pattern and Driving Factors of Carbon Emission Intensity of Main Crops in Henan Province. Sustainability 2022, 14, 16569. [Google Scholar] [CrossRef]
- Sun, Z.Y.; Deng, M.X.; Li, D.D.; Sun, Y. Characteristics and driving factors of carbon emissions in China. J. Environ. Plan. Manag. 2024, 67, 967–992. [Google Scholar] [CrossRef]

| Category | Carbon Emission Factor |
|---|---|
| Cropland | 0.420 |
| Woodland | −0.578 |
| Shrubland | −0.578 |
| Grassland | −0.021 |
| Waterbody | −0.252 |
| Bareland | −0.005 |
| Impervious surfaces | 0.000 |
| Wetland | −0.252 |
| Category | Standard Coal Conversion Factor | Carbon Emission Factor |
|---|---|---|
| Coal | 0.713 | 0.756 |
| Coke | 0.971 | 0.855 |
| Oil | 1.428 | 0.586 |
| Crude Oil | 1.429 | 0.586 |
| Gasoline | 1.471 | 0.554 |
| Kerosene | 1.471 | 0.571 |
| Diesel | 1.457 | 0.592 |
| Fuel Oil | 1.429 | 0.619 |
| Liquefied petroleum gas | 1.714 | 0.504 |
| Natural gas | 1.214 | 0.448 |
| Electricity | 0.404 | 0.794 |
| 1990 | 1995 | 2000 | 2005 | 2010 | 2015 | 2020 | |
|---|---|---|---|---|---|---|---|
| Cropland | 86,765.53 | 85,063.51 | 83,224.90 | 80,461.13 | 78,071.33 | 76,855.16 | 76,586.24 |
| Woodland | −62,261.96 | −62,945.80 | −62,493.49 | −63,074.18 | −63,191.67 | −61,437.02 | −60,706.99 |
| Shrubland | −9.58 | −6.94 | −7.21 | −5.71 | −4.30 | −3.65 | −3.46 |
| Grassland | −8.81 | −5.08 | −3.88 | −3.30 | −3.46 | −2.26 | −1.19 |
| Waterbody | −5885.02 | −5712.55 | −5998.92 | −6355.48 | −6371.17 | −6305.04 | −5874.06 |
| Bareland | −1.38 | −0.25 | −0.10 | −0.05 | −0.03 | −0.02 | −0.02 |
| Impervious surface | 1,236,321.97 | 1,785,655.55 | 2,133,395.73 | 3,555,596.63 | 4,962,517.45 | 5,692,017.14 | 5,930,218.51 |
| Wetland | −0.64 | −0.14 | −0.05 | −0.02 | 0.00 | 0.00 | 0.00 |
Disclaimer/Publisher’s Note: The statements, opinions and data contained in all publications are solely those of the individual author(s) and contributor(s) and not of MDPI and/or the editor(s). MDPI and/or the editor(s) disclaim responsibility for any injury to people or property resulting from any ideas, methods, instructions or products referred to in the content. |
© 2024 by the authors. Licensee MDPI, Basel, Switzerland. This article is an open access article distributed under the terms and conditions of the Creative Commons Attribution (CC BY) license (https://creativecommons.org/licenses/by/4.0/).
Share and Cite
Ye, C.; Jiang, J.; Jin, Y. Spatiotemporal Analysis of Carbon Emissions and Uptake Changes from Land-Use in the Yangtze River Delta Region. Proceedings 2024, 110, 6. https://doi.org/10.3390/proceedings2024110006
Ye C, Jiang J, Jin Y. Spatiotemporal Analysis of Carbon Emissions and Uptake Changes from Land-Use in the Yangtze River Delta Region. Proceedings. 2024; 110(1):6. https://doi.org/10.3390/proceedings2024110006
Chicago/Turabian StyleYe, Cuiheng, Jie Jiang, and Yan Jin. 2024. "Spatiotemporal Analysis of Carbon Emissions and Uptake Changes from Land-Use in the Yangtze River Delta Region" Proceedings 110, no. 1: 6. https://doi.org/10.3390/proceedings2024110006
APA StyleYe, C., Jiang, J., & Jin, Y. (2024). Spatiotemporal Analysis of Carbon Emissions and Uptake Changes from Land-Use in the Yangtze River Delta Region. Proceedings, 110(1), 6. https://doi.org/10.3390/proceedings2024110006