
Detecting Polder Water Surface Dynamics Using Multi-Source Remote Sensing Data †


Abstract
1. Introduction
2. Study Region and Data Set
2.1. Region of Interest
2.2. Sentinel-2
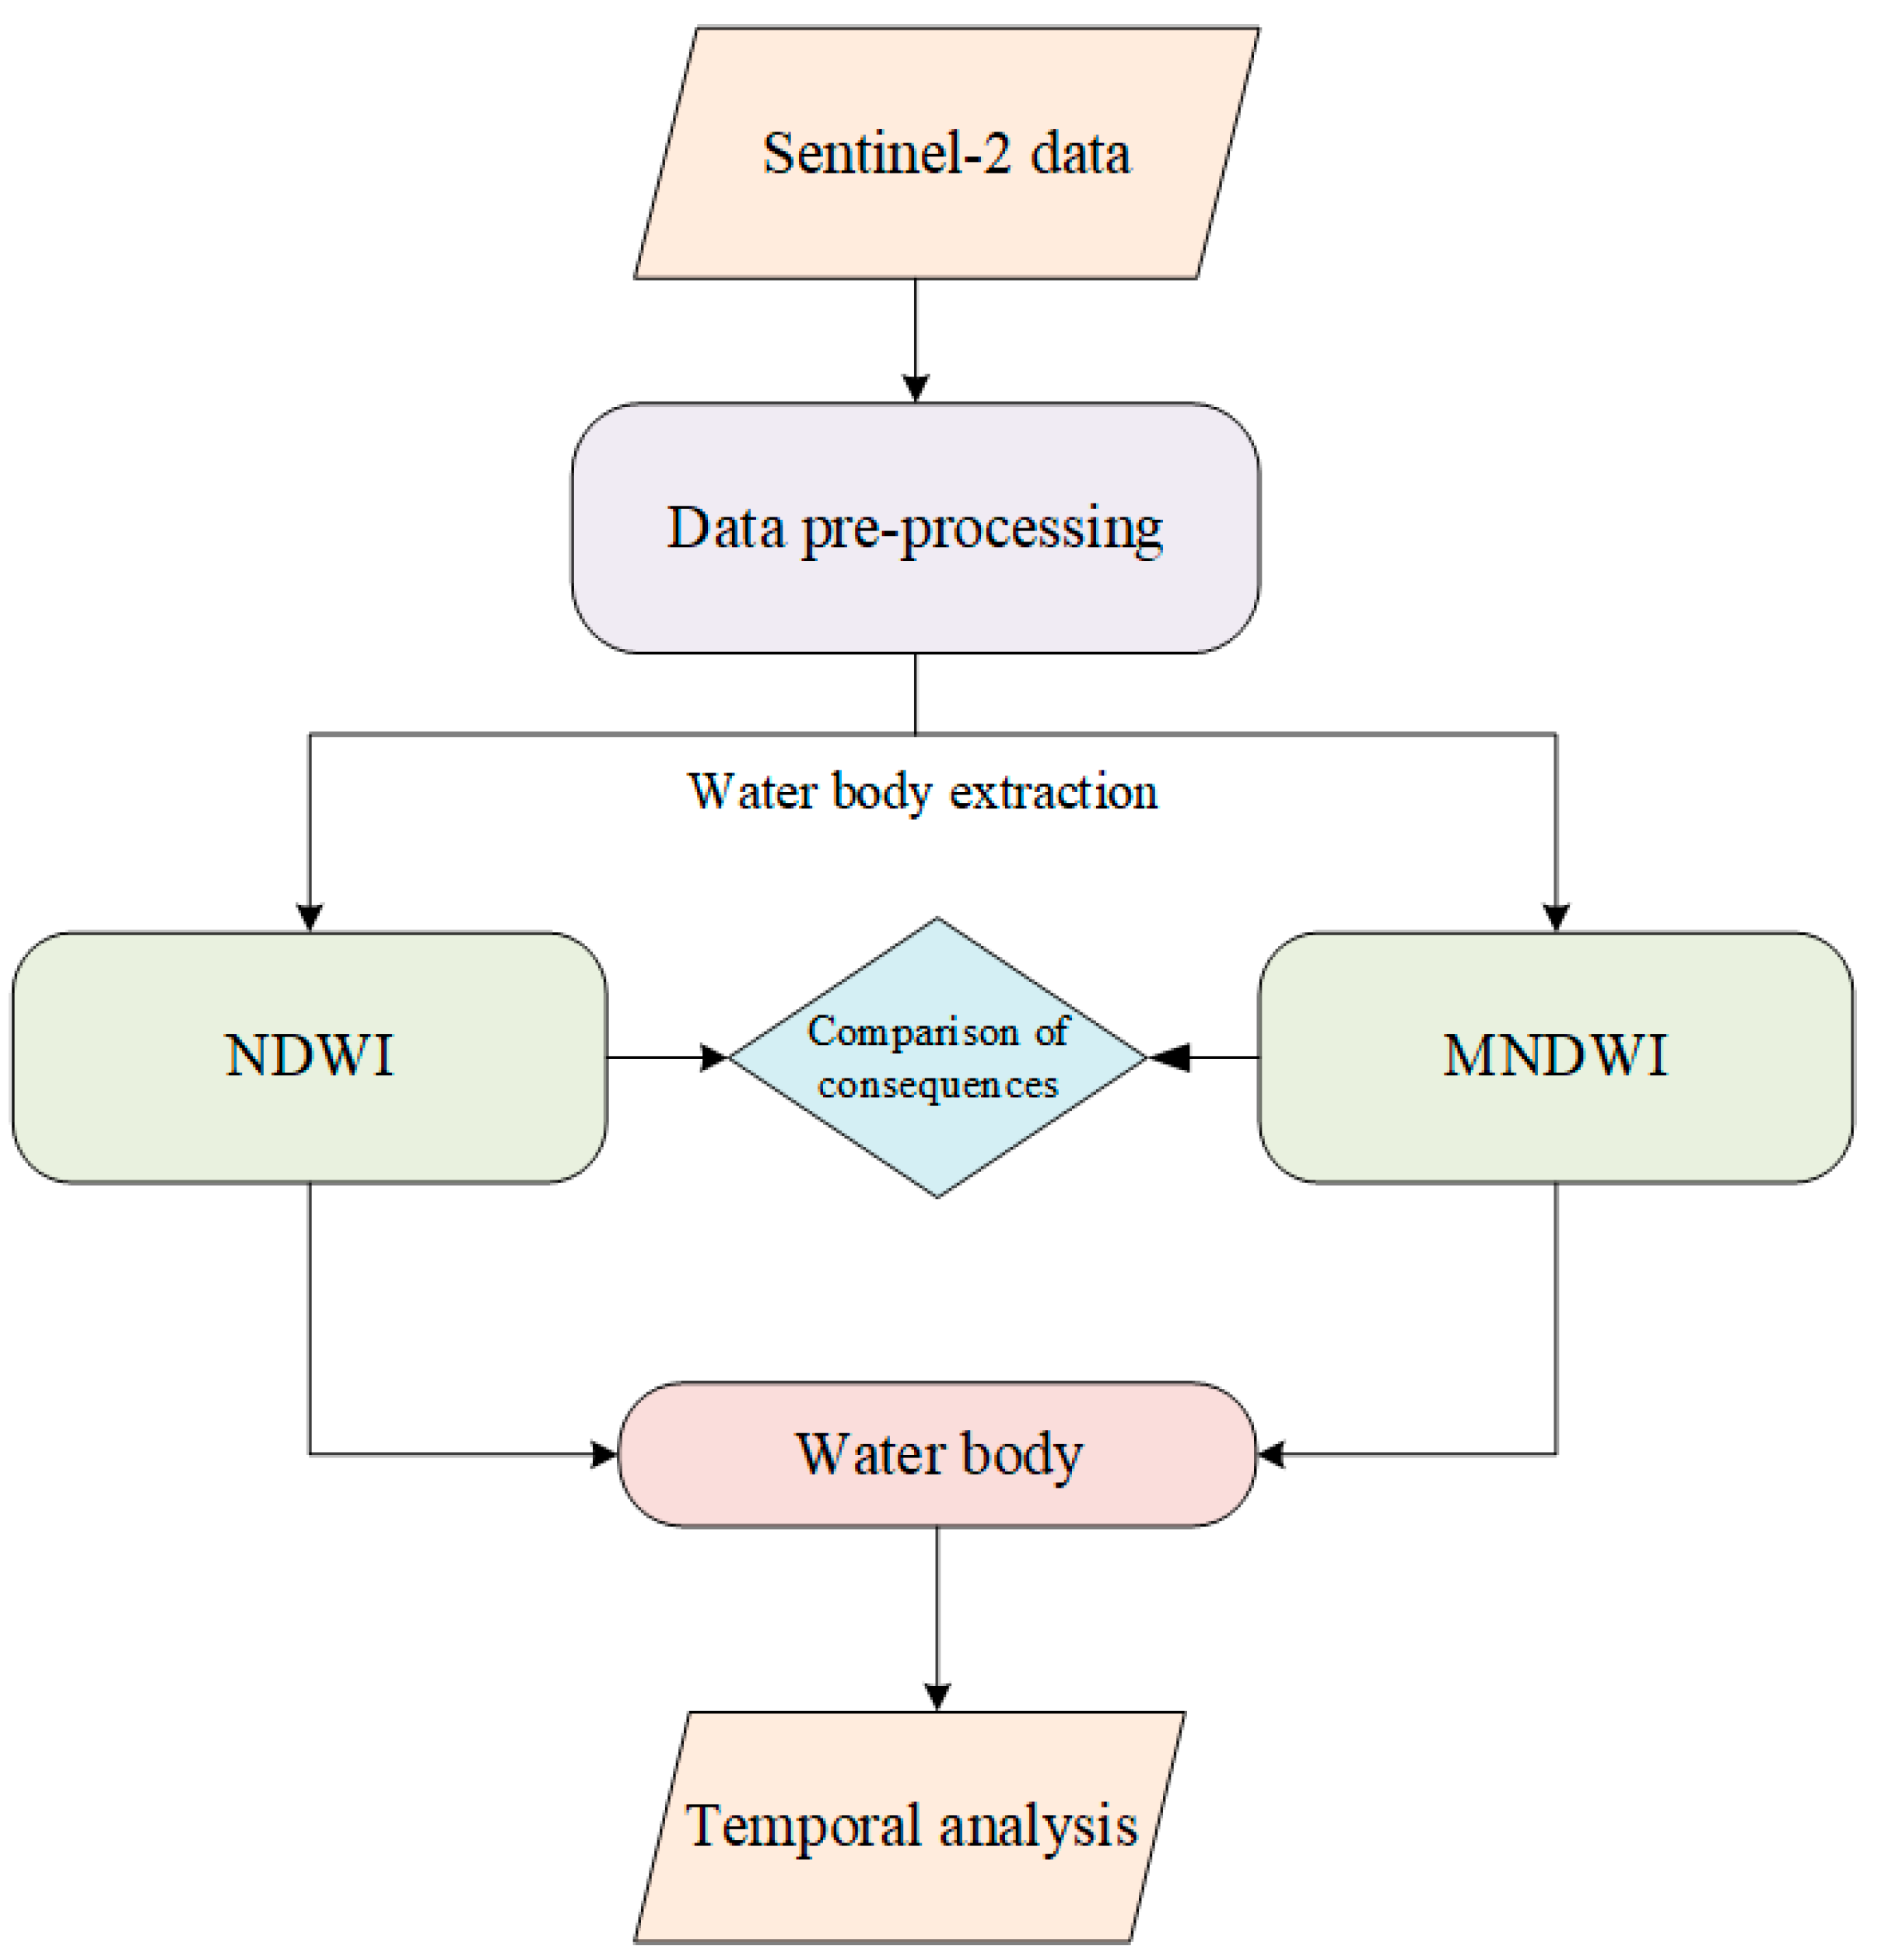
3. Methodology
4. Results
Water Body Extraction and Analysis
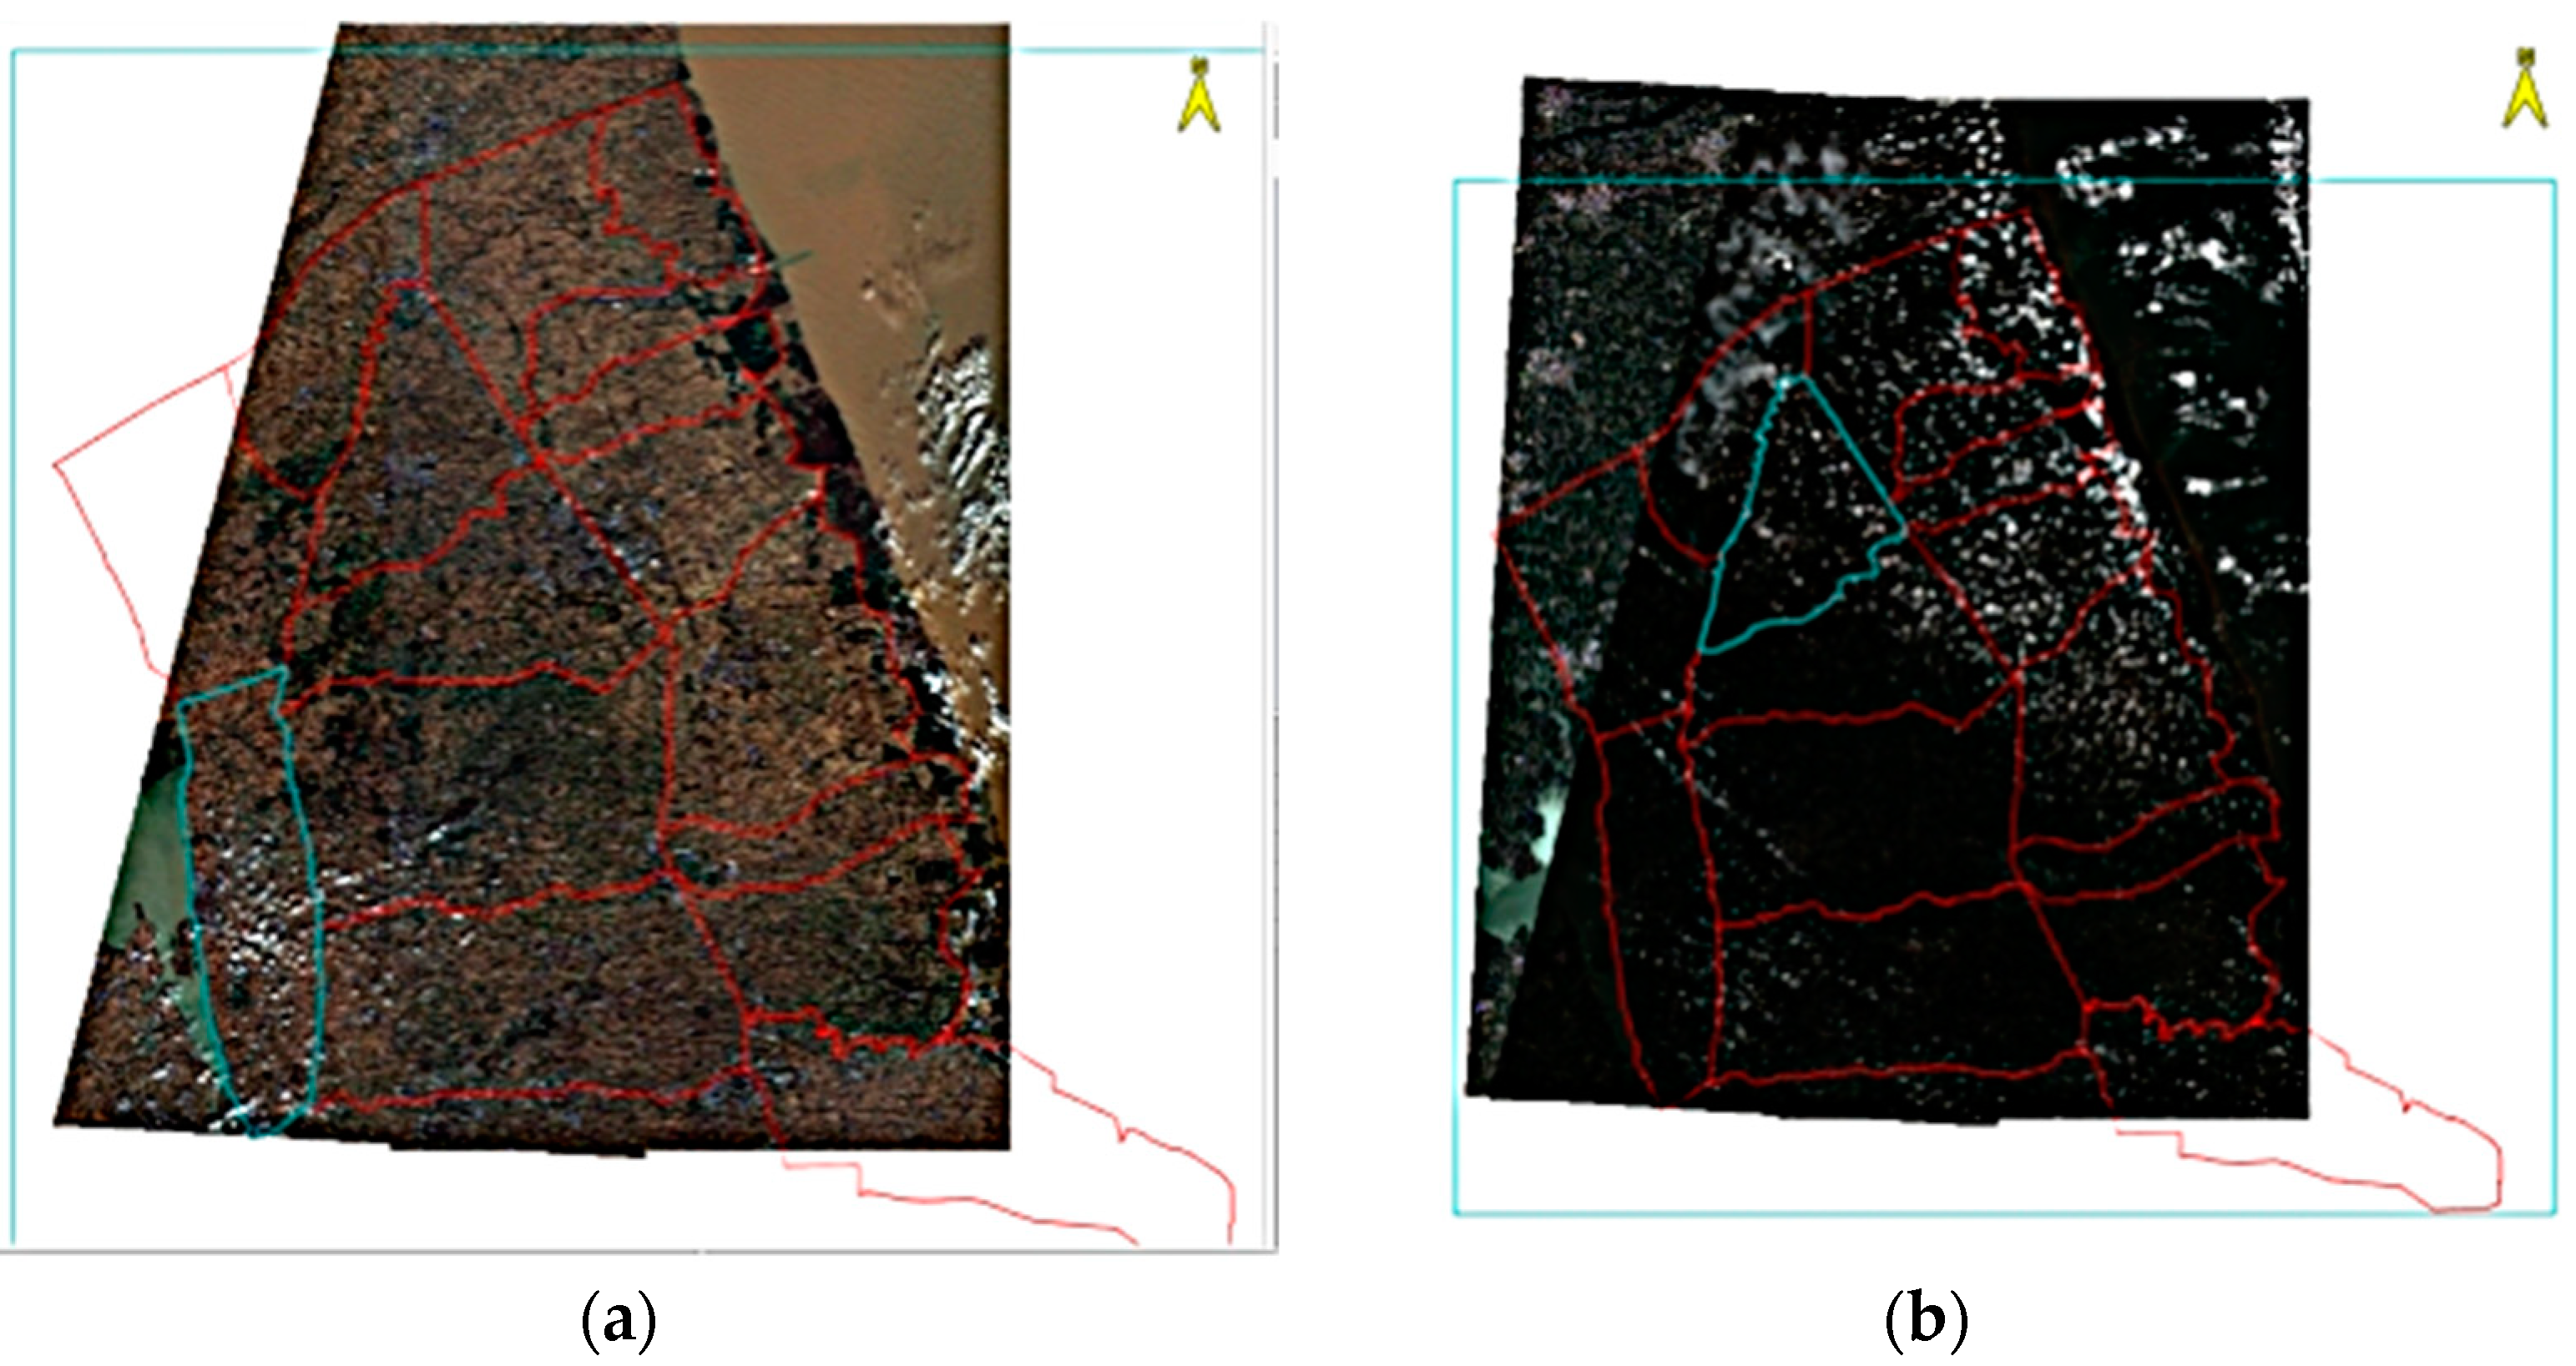
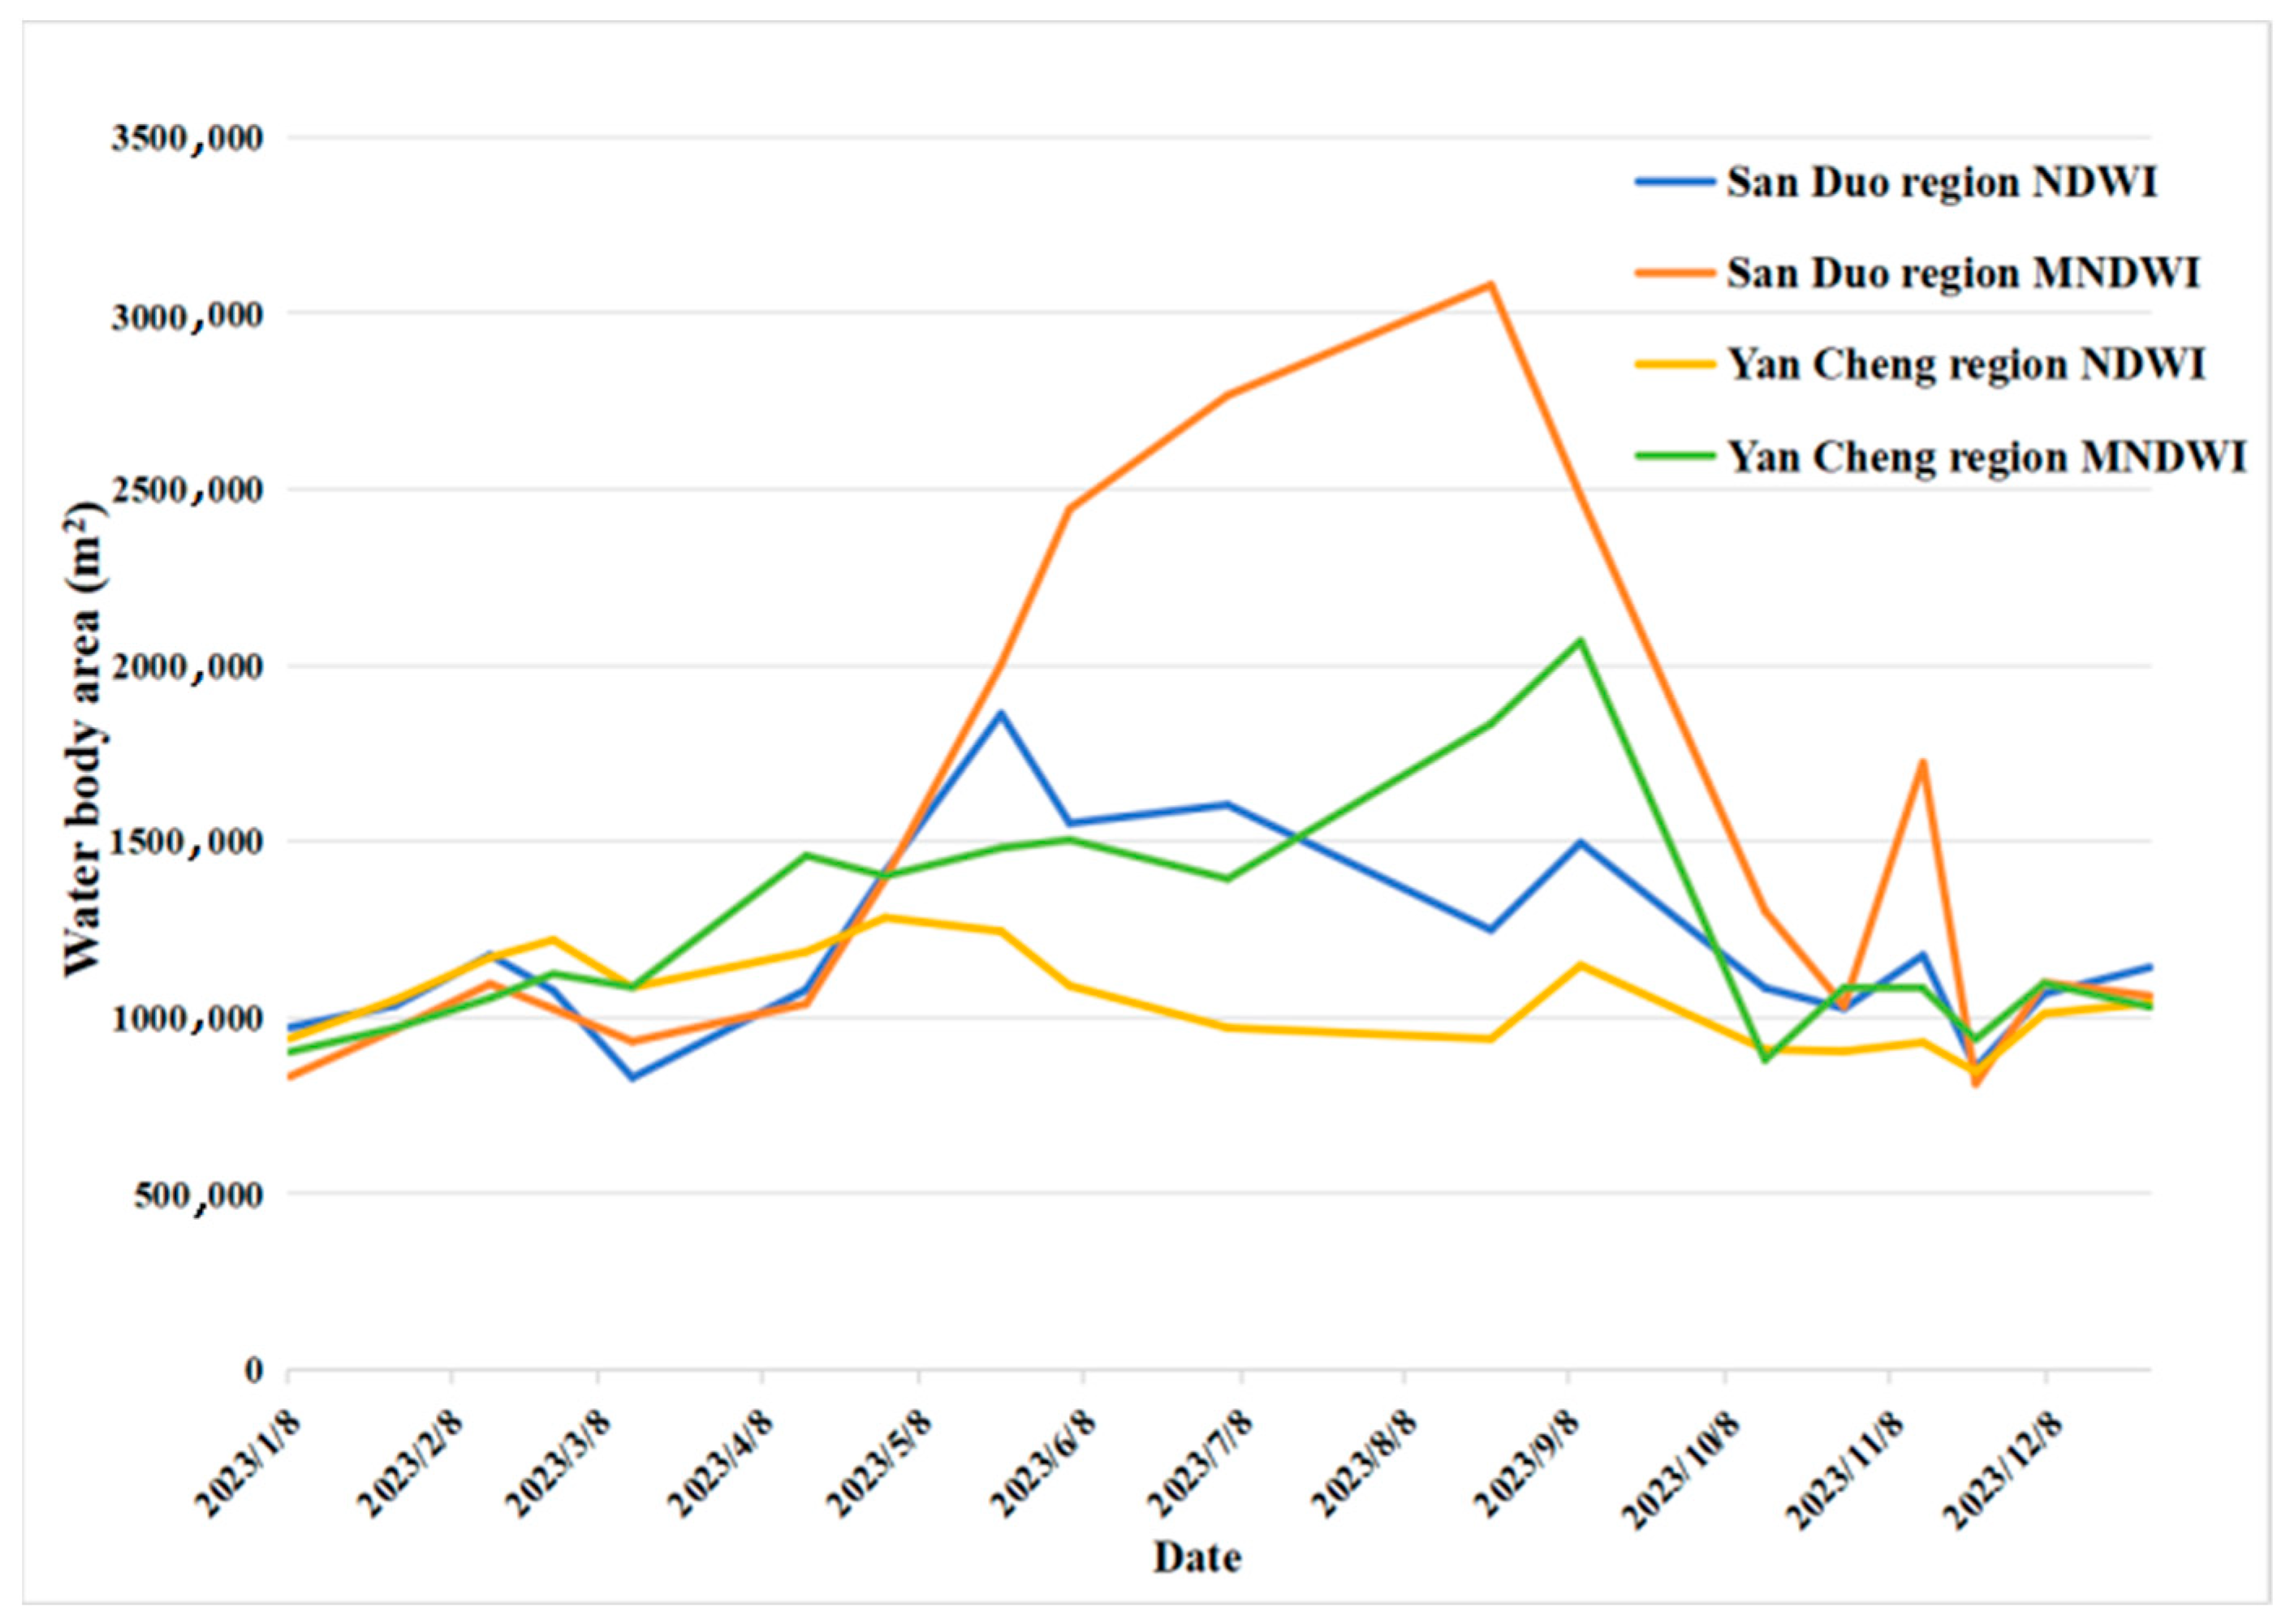
- Abnormal increase in MNDWI value on 14 November in the San Duo region by studying the remote sensing image of the Lixiahe region on 14 November, it can be observed that the San Duo region is heavily cloud-covered, with more than half of the area covered by clouds. Consequently, the MNDWI index of this area is significantly elevated, and the NDWI index also shows an upward trend.
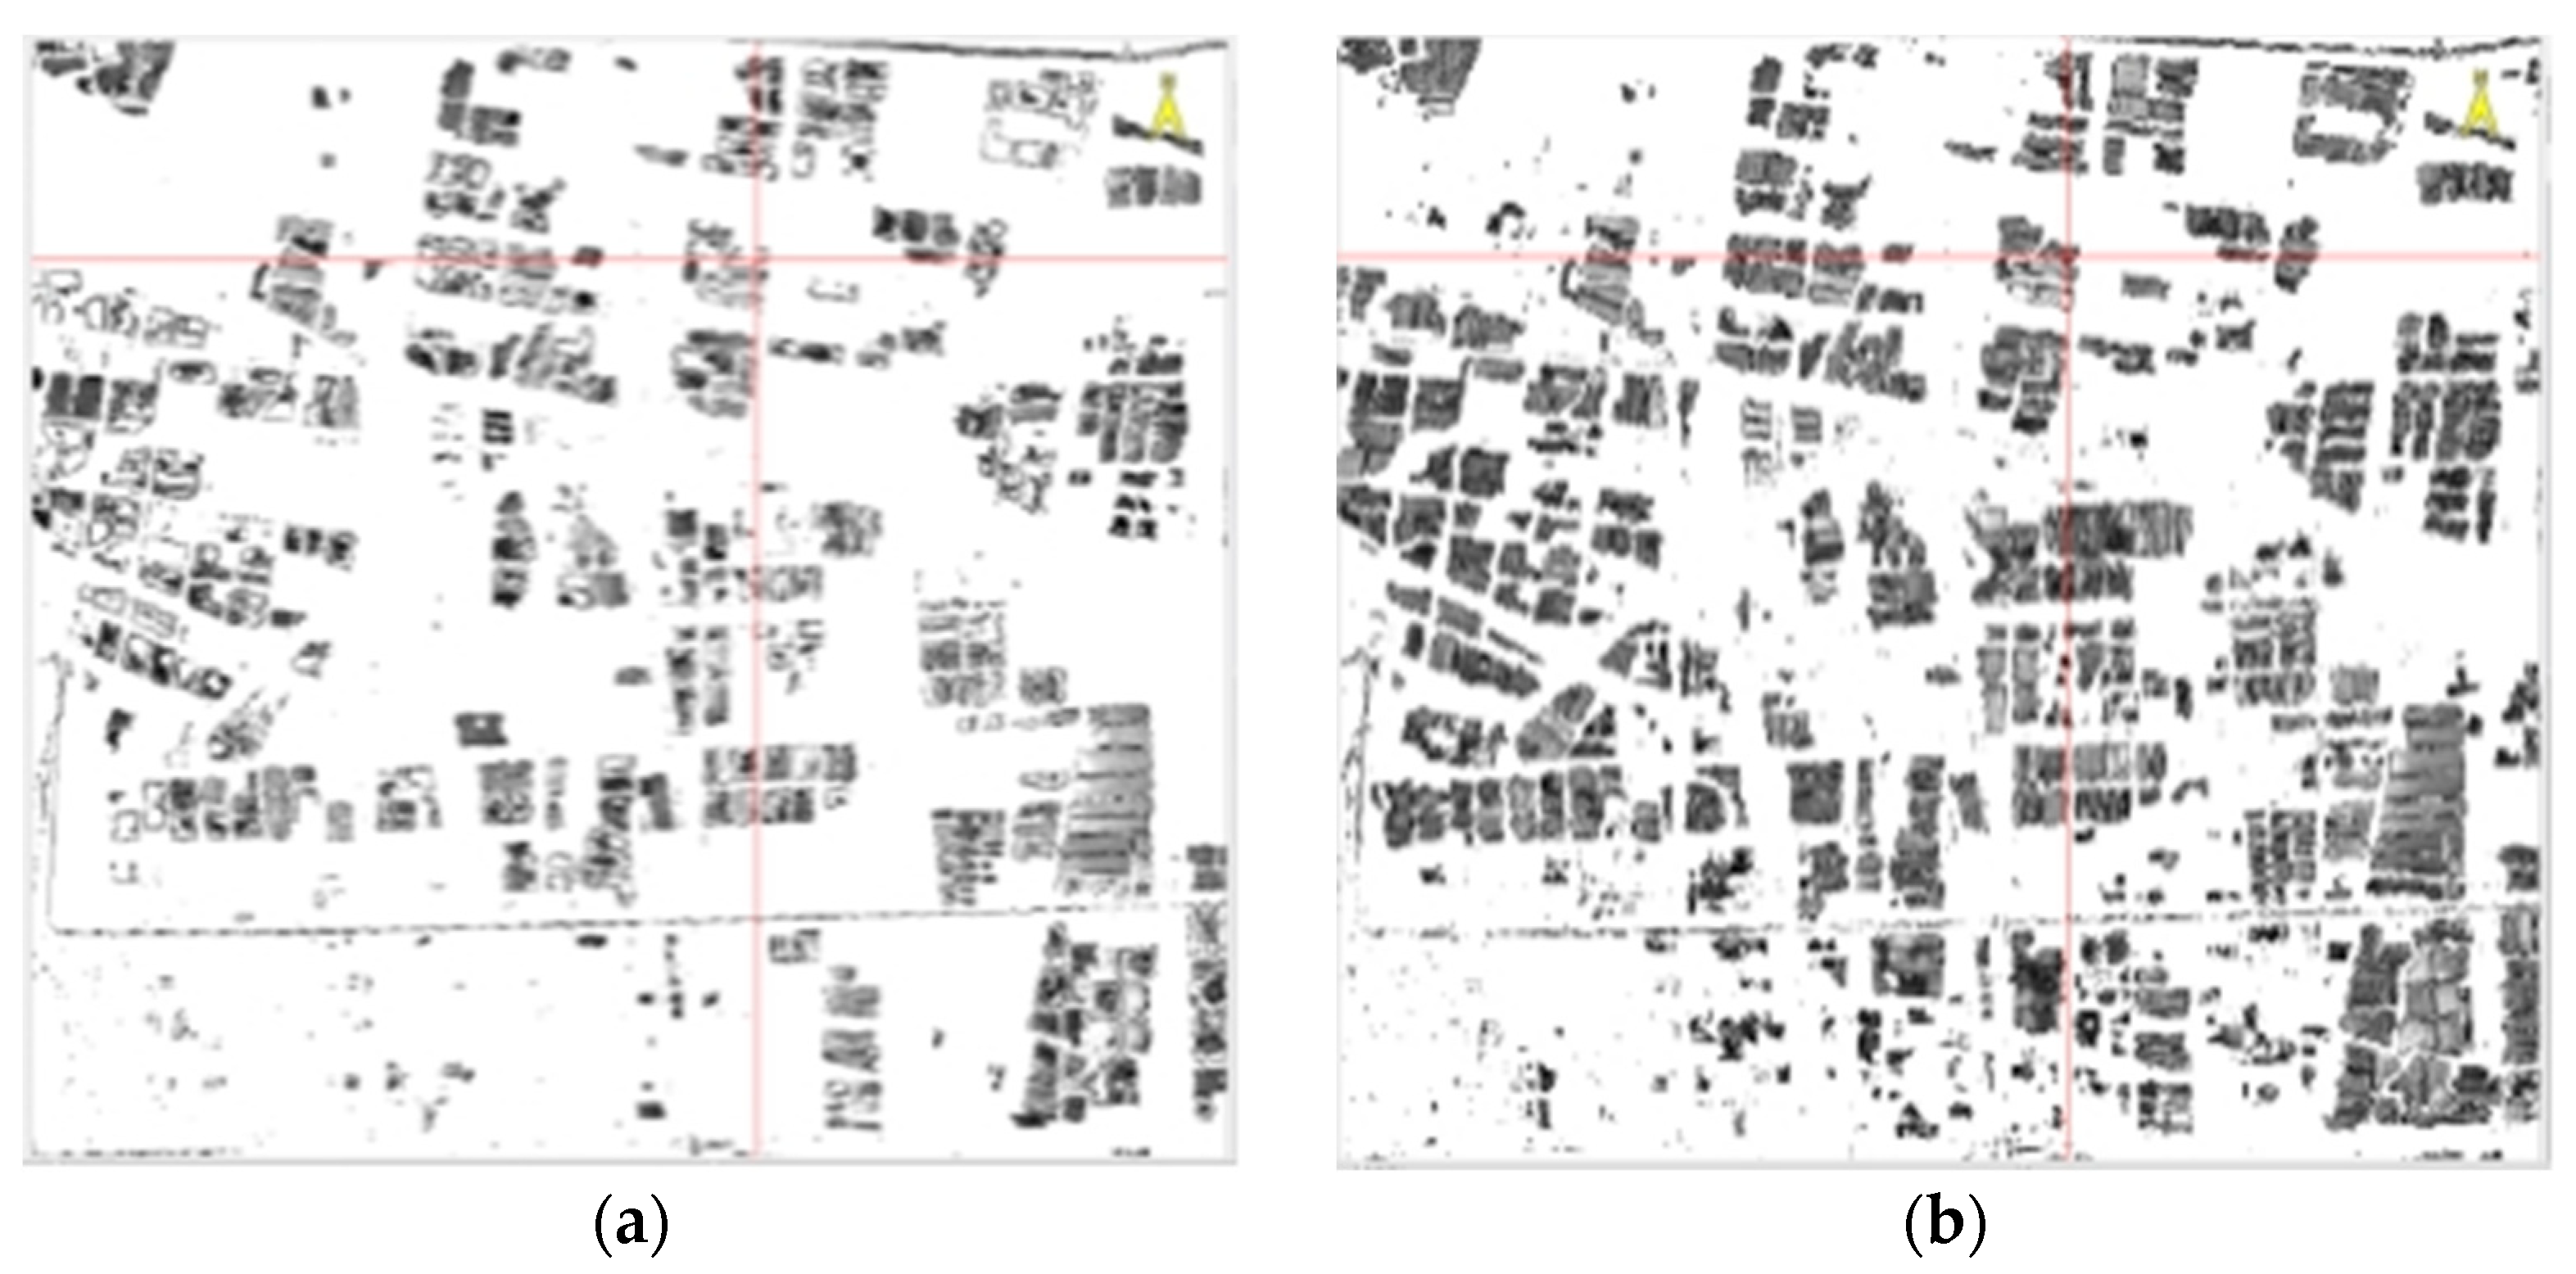
- Inconsistent trend from June to August. From 23 May to 24 August, the water body area change curve obtained by the MNDWI method shows a significant upward trend, while the curve obtained by the NDWI method shows a significant downward trend. Analyzing the remote sensing images from 15 June and 5 July as examples, as shown in Figure 5, it can be seen that vegetation in these images has noticeably increased compared to the image from 14 November. Analyzing the principles of the two water extraction methods, NDWI extracts water body information by suppressing vegetation and highlighting water, whereas MNDWI enhances the contrast between water and buildings to extract water body information. Further analysis of the water body extraction results during the research process reveals that in Figure 6, in the vicinity of vegetation, the MNDWI index averaged 0.11 and the NDWI index averaged −0.1. This indicates that the suppression effect of the MNDWI method on vegetation is significantly inferior to that of the NDWI method. Therefore, in images with dense vegetation, the MNDWI method may mistakenly extract some vegetation as water bodies, leading to an abnormal upward trend in the water body area change curve.
5. Conclusions
Author Contributions
Funding
Institutional Review Board Statement
Informed Consent Statement
Data Availability Statement
Conflicts of Interest
References
- Ren, Y.-X.; Lin, Q.; Li, M.-J.; Zhou, Q. Study on water body extraction in complex regions based on Sentinel-2. Geospat. Inf. 2018, 12, 149. [Google Scholar]
- McFeeters, S.K. The use of the Normalized Difference Water Index (NDWI) in the delineation of open water features. Int. J. Remote Sens. 1996, 17, 1425–1432. [Google Scholar] [CrossRef]
- Xu, H.Q. A study on information extraction of water body with the modified normalized difference water index (MNDWI). J. Remote Sens. 2005, 9, 589–595. [Google Scholar]
- Mo, W.H.; Sun, H.; Zhong, S.Q.; Huang, Y.L.; He, L. Research on the CIWI model and its application. Remote Sens. Inf. 2007, 22, 104. [Google Scholar]
- Yan, P.; Zhang, Y.J.; Zhang, Y. A study on information extraction of water system in semi-arid regions with the enhanced water index (EWI) and GIS based noise remove techniques. Remote Sens. Inf. 2007, 22, 62–67. [Google Scholar]
- Cao, R.L.; Li, C.J.; Liu, L.Y.; Wang, J.-H.; Yan, G.-J. Extracting Miyun reservoir’s water area and monitoring its change based on a revised normalized different water index. Sci. Surv. Mapp. 2008, 33, 158–160. [Google Scholar]
- Shen, Z.F.; Xia, L.G.; Li, J.L.; Luo, J.C.; Hu, X.D. Automatic and high-precision extraction of rivers from remotely sensed images with Gaussian normalized water index. J. Image Graph. 2013, 18, 421–428. [Google Scholar]
- Feyisa, G.L.; Meilby, H.; Fensholt, R.; Proud, S. Automated Water Extraction Index: A new technique for surface water mapping using Landsat imagery. Remote Sens. Environ. 2014, 140, 23–35. [Google Scholar] [CrossRef]
- Zhou, Y.; Xie, G.L.; Wang, S.X.; Wang, F.; Wang, F. Information extraction of thin rivers around built-up lands with false NDWI. J. Geo-Inf. Sci. 2014, 16, 102–107. [Google Scholar]
- Chen, W.; Ding, J.; Li, Y.; Niu, Z. Water extraction method based on domestic GF-1 remote sensing images. Resour. Sci. 2015, 37, 1166–1172. [Google Scholar]
- Jiang, B.T.; Ma, L.; Cai, L. Remote Sensing Image Fusion Technology; Science Press: Beijing, China, 2019. [Google Scholar]
- Li, D.; Wu, B.S.; Chen, B.W.; Xue, Y.; Zhang, Y. Review of water body information extraction based on satellite remote sensing. J. Tsinghua Univ. (Sci. Technol.) 2020, 60, 147–161. [Google Scholar]


| Number | Name | Number | Name |
|---|---|---|---|
| 1 | Qin Tong region | 9 | Kua Tao region |
| 2 | Xing Hua region | 10 | Yun Mian River region |
| 3 | San Duo region | 11 | Li Min River region |
| 4 | Jian Hu region | 12 | Xi Chao River region |
| 5 | She Yang Town region | 13 | Da Feng region |
| 6 | Yan Cheng region | 14 | Chuan Dong Port region |
| 7 | Fu Ning region | 15 | Dong Tai region |
| 8 | She Yang Riverbank region | 16 | Nan Tong region |
Disclaimer/Publisher’s Note: The statements, opinions and data contained in all publications are solely those of the individual author(s) and contributor(s) and not of MDPI and/or the editor(s). MDPI and/or the editor(s) disclaim responsibility for any injury to people or property resulting from any ideas, methods, instructions or products referred to in the content. |
© 2024 by the authors. Licensee MDPI, Basel, Switzerland. This article is an open access article distributed under the terms and conditions of the Creative Commons Attribution (CC BY) license (https://creativecommons.org/licenses/by/4.0/).
Share and Cite
Yu, H.; Zhu, D.; Wan, S.; Jiang, Y.; Lu, C.; Zhang, R.; Jia, Y. Detecting Polder Water Surface Dynamics Using Multi-Source Remote Sensing Data. Proceedings 2024, 110, 19. https://doi.org/10.3390/proceedings2024110019
Yu H, Zhu D, Wan S, Jiang Y, Lu C, Zhang R, Jia Y. Detecting Polder Water Surface Dynamics Using Multi-Source Remote Sensing Data. Proceedings. 2024; 110(1):19. https://doi.org/10.3390/proceedings2024110019
Chicago/Turabian StyleYu, Heng, Dawei Zhu, Sicheng Wan, Yuting Jiang, Chao Lu, Rui Zhang, and Yan Jia. 2024. "Detecting Polder Water Surface Dynamics Using Multi-Source Remote Sensing Data" Proceedings 110, no. 1: 19. https://doi.org/10.3390/proceedings2024110019
APA StyleYu, H., Zhu, D., Wan, S., Jiang, Y., Lu, C., Zhang, R., & Jia, Y. (2024). Detecting Polder Water Surface Dynamics Using Multi-Source Remote Sensing Data. Proceedings, 110(1), 19. https://doi.org/10.3390/proceedings2024110019