Abstract
The paper concerns a study developed on the largest enclosed park in Europe, in the town of Monza, perceived and returned in a series of icon-maps through the use of social twitter and instagram in a specific time frame. The aim is to investigate the contribution provided by social data through mobile phone network considered as a tool to describe a temporary event, and to describe the shape of a town that does not physically exist but can be drowned always in a different way depending on several variable data.
1. Introduction
Traces on a map
In the first years of the 2000th the diffusion of mobile phones network data inaugurated a research season full of new possibilities for data collections, as a new challenge to implement traditional urban data set. The observation of individual mobile traces or aggregated ones offered the first occasion to be considered as a source on the habits of citizens for example in term of mobility.
The great potential of data coming from mobile was mainly commented for their capability to capture temporary traces of population, their localization, their density, as a sort of support of other traditional data source. Data where studied mainly with the help of tracking technologies, to study mobility; also to study autonomous shapes patter related to single citizen; also to study land use density [].
But the diffusion that social media had since 2004 offered a new challenge in studying citizens’ habits, a new ground for studying and analyzing the behavior of society, its ways of communication and creative expression, offering a new possibility to transform it in a new image or shape. The amount of data contained in social networks relates to data freely and consciously released, if not published, by heterogeneous subjects during daily use of places and events in a city and becomes part of a common heritage. From this time mapping data from mobile phones becomes non only tracing a point but tracing it with according to a specific meaning,
The birth of socials at Harvard University, then Stanford, and later to Columbia and Yale University, could not predict that the pervasiveness of the medium and the later social success would be considered as a tool for developing communication policies, marketing, social analysis, policy making, democratic participation, open consultation.
The most popular platforms censored in recent studies relates to ever-expanding users []: Facebook: 600 million users worldwide, relational activities based on sharing photos, videos, posts in bulletin boards, private messages and groups, average ages 26–34; Netlog: 74 million worldwide users, relational activity based on sharing webpages, music playlists, videos, blogs and join groups called ‘clan’, average age of 14–24; Badoo: 113 million, closely related to geo-localization themes or meetings based on the location of the participants, average age 18 to 30 years; Twitter: 300 million users in the world, photo or video related messaging activities and hashtags, average age of 35; instagram: 500 million users around the world, image-related messaging related activity, hashtags. Even more impressive is the monthly access to these socials in terms of millions of population. See in Figure 1: monthly access to socials in 2014.
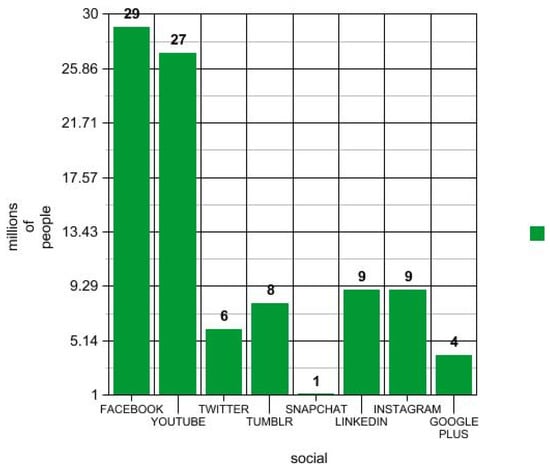
Figure 1.
Monthly access to social networks: millions of accesses per social. Source CREMIT: Mapping social networks.
Citizen as Social Tracers
From the digitization of physical structures and their extension through social apps in the cultural sphere, the mapping of behaviors associated with cultural events or temporary participation is short. Attention to mapping the physiology of events first of all is in terms of mobility and it takes place from the 1940s when technology evolutions in the acquisition and management of information data spurs the dissemination of geographic information.
Satellite Detection Systems have developed in parallel with the advanced quantum geography bases and the ability of statistical analysis to process large amounts of data.
With US liberatory to data accesses released in 2000, spatial information enters into major-scale decision-making. Data becomes widespread and accessible by making it possible for users to participate in shared maps creation.
Contemporary to Lynch’s mental maps sensitivity to open data, data sharing, collective participation, grows together with the creation of maps consciously created by community mappers, as the result of voluntary community planning.
In this context, the use of data offered by the smartphone becomes the perfect tool for creating new communities where shared new images and maps mirror a new urban dynamism but not only: the possibility to capture meaning of messages, keywords, published images, gives the opportunity to select more meaning if compared to simple traces left by a phone in a field; the mapping of the social phenomenon becomes immediately realizable.
The spread of GIS makes the participatory dimension more and more real and the development of its applications is oriented towards the inclusion of the data by offering the possibility of a sort of mapping oriented towards a widespread use of personal devices.
The acronym PPGIS is coined Oriented to a public use of GIS: something that can influence public policies. The geographer Sieber [] defines for the first time the citizen as sensor or as an user who voluntarily provides geographic information on platforms of various kinds, including social.
In its analysis, it looks at the innovations that makes possible to create tools for coding space coordinates, 2 and 3D visuals, static and dynamic, reaching the theme of crowd mapping with the inclusion of whole community of mappers to see their contribution into a drawing that is growing in size and detail, as in the case of Open Street Map.
The physical space of our society is the real support for creating new maps with their own nature, rules and form. Within this space creativity becomes the medium through which subjects interact, creating an exchange space with own morphological characteristics and creativity [].
The themes raised by the configuration of this new environment are both topological and sociological and take on complex and varied forms of representation. While in the history of communication media have always been read as completely autonomous subjects compared to space and with no link to it, social media birth, offered with geolocation a new mode of interpretation of the data and its possible use.
Geolocalization makes the perception of the communication space permeated by the geographic data and the event related to it more tangible to be read.
The space of Geolocated communication and web space increases the knowledge of the environmental dimension. In addition, the ability to view the Geolocated data network reveals the complexity of relationships that are formed within the social network between users, users and a place, between a place and an event and back [].
2. Materials and Methods
In this chapter, we refer to the social dimension of the space by describing the connections across it and linking them to a place, that represent a new virtual space; this representation is a model obtained from the interaction of social tools in a given physical and temporary space linked to an event At a later time, the short history of these new maps show that models can detach themselves from the territory that generated them assuming autonomous and classifiable forms.
This last topic refers to, for example, to the studies of Bin Jiang and Yufan Miao in relation to the definition of “natural cities” []. The term refers to clustered events formalized by the use of certain social indifferent to content.
In this study the resulting geography, set on triangulation between geographically distant users, provides a powerful tool to develop new insight into the evolution of real cities and can act as a good real city proxy, in the sense of understanding the underlying interactions, globally.
The representations of these networks do not necessarily create space, but certainly contexts, where the media can be referred to as the environment and web users the network of its inhabitants.
At present, half of the world’s population uses social media with an exponential increase in the possibility of fruition in the coordinates of the network of sites and events. The diversification offered by the interaction with the social network makes the presence of culture in everyday communication accessible by large masses; the mapping of these masses provides specific and autonomous geographies within the webinvolving users who probably would never have access to or dialogue with specific cultural institutions.
The Event in the Park
In this chapter we consider the variables that pertain to social manifestations during a major event, in the days preceding and following it, to get the specific reflection of this paper: [] the object is the is a representation of a mapping that describes first of all the ability of the subject to be a subject generator of data, a subject that rationalizes and describes spatial experience, and the data.
On March the 25th Monza’s park hosted the visit of Pope Francesco as you see in Figure 2. The popularity reached by the nicknamed Pope Francis is at the height of his mandate, reinforced by a series of manifestations of proximity to the humble population.
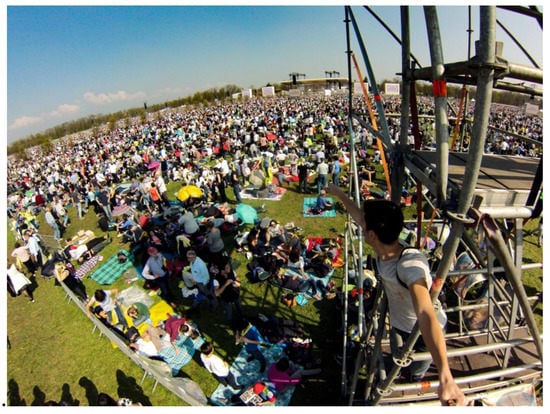
Figure 2.
Solemn celebration of Pope Francis at Monza Park, picture from Instagram.
The visit to the lands of Ambrogio provides for a very tight calendar of meetings whose culmination is represented by mass in front of one million faithful in the Monza Park.
The organization provides for a participation first guided by celebration through the parishes of the diocese and then left to the inscription of the single whose result is the presence of about one million users. The celebration takes place in the space of the park’s ancient racecourse, set up for the occasion with an 80 m long celebration altar and about 16 maxi screens distributed in fully enclosed and subdivided space.
Monza Park has a varying usage in relation to the seasons and the days of the week, with the prevalence of leisure users in the week and linked to the presence of exceptional periodic events: formula one, Grand Prix of Italy, etc.
At the announcement of the event a device for collecting Geolocated tweet messages has been set on the previous and subsequent days; an Arch Gis desktop software application was used for the collection, with a timed tweet collection feature in a window of about 5 days running on the event.
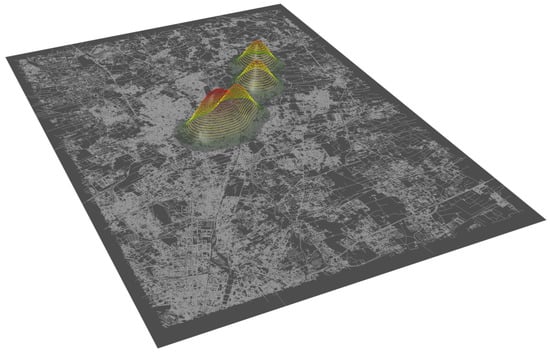

Figure 3.
Tweets mapping dated 23rd March.
A special web application was created by applying a filter to the tweets stream considering messages in the extents of the Lombard region that includes in the hashtag text such as: Pope, Pope, Papst, Monza Park, Mass, Pope Francis. The system has provided the possibility of viewing the map with the help of an Info Summary widget to monitor the count of tweets displayed, which can also be read by the content as an open database.
At the end of the mapping process, the system allows a dynamic view associated with an automated timer as well as the ability to download data collection files. Starting from this collection, it was preferred to proceed to a map view as a stand-alone object tied to a 3D view to highlight the dynamism of intensity not only chromatic but volumetrically readable.
The procedure is therefore summarized as follows: selecting and downloading georeferenced tweet data in the Monza area; partition of data by date of interest (23–27 March); Import data in 3D moderation environment (rhino + grasshopper) []; overlapping data on base map of the selected area; algorithmic display generation for every single day: the surface overlaid on the map is molded based on tweet density, the gradient of color varies according to the amount of tweet compared to the maximum daily.
The demonstration of the map shows a growing fruition in the days prior to the manifestations and characterizing the territorial sphere in a clear way. The crown of the municipalities involved showed greater sensitivity in the areas north of the affected area with a clear growth by approaching the pre-set date.
The south end of the city was affected by a series of hashtags that were partially connected to the city of Milano, where several other events took place on the same day.
Further selections of the data was made from the csv-derived from GIS, related to the topics discussed.
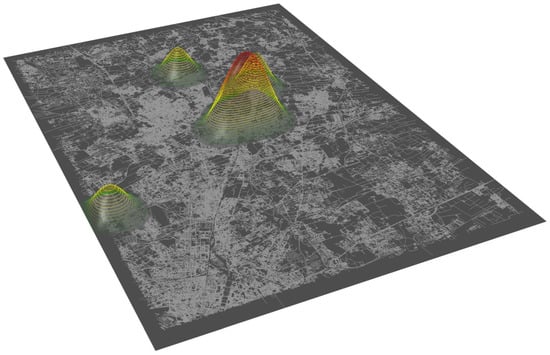

Figure 4.
Tweets mapping dated 24rd March.
Reading messages within the socials has shown intolerance towards preparation of the event on the days preceding it due to the growing temporary infrastructure in preparation of the date. (I and II days) The day of the event reveals fierce exchanges between communities of neighboring territories oriented towards slow mobility to the site. In the following days, messages of human solidarity combined with reduced percentages of impatient messages in relation to the excessive crowding of users during the event’s dissolution and transport to places of origin.
The use of instagam was monitored through a survey based on a word search and geolocation with a later survey after the event. More than 6000 signals with geocoded content were collected. The monitoring is a curve in exponential growth in the vicinity of the event that has transformed from ordinary to extraordinary a public space; the tweets reveal a progressive state of public acceptance of the changes that were growing in the park starting from a negative one. The representations of instagram have dashed different situations related to each presence seen in public space and have been commented. Social hastagh in instagram created for the visit are over 100; the visualization of the images is mostly related to the exceptional context leaving the pope subject to a visualization equal to 10% of the images found. 20% of the images refer to the user placed in the environment during the path and the final destination. The size of the crowd is represented in most icons. The perception of the space that emerges from the images is subsidiary to the events that surpass it.
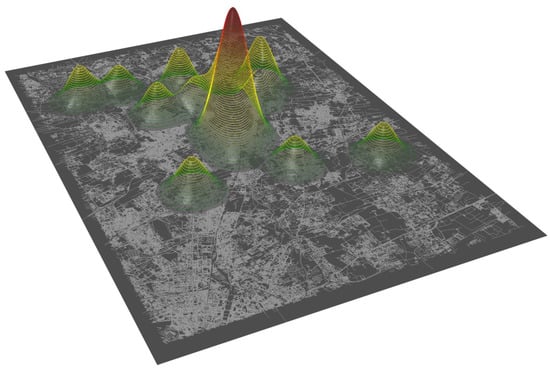

Figure 5.
Tweets mapping dated 25th March.
3. Discussion and Conclusions
The representation of the event by the social in quantitative and iconographic terms requires further insight into the enjoyment of the manifestations of free culture on the territory; in these maps we could consider creativity as a tool for data processing aimed at planning strategies of social and sharing forms, diffusion of culture, participation.
Obviously, we are talking about a subjective geography. The relation in a group, it is formed around an event or not, produces geographic data on purpose.
When we talk about a group we consider its singularity in the sense both of heterogeneity of data producers than homogeneity as could be classed the case of the audience arrived at the event in the park.
In any case these data that we can reach with or without consciousness of mass, are a great tribute to the construction of a new geography as interesting as official one.
In any occasion a new map can be organized with new voluntary source of information according to new areas and query giving a great aid to official and more traditional data sets.
These considerations oblige to organize new strategies for accessing data with fast tool (as in the case we organized) and fast form of explaining data, matching together, with file ready to be used in their huge dimension. In these cases only images and representation can return both analysis and design process in a short time.
Some raising question are: considering the huge quantity of data we can meet in our social attitude, how can we develop a guideline for scientific survey of them?
Does the age factor of social users affects the analysis of real situations?
When official geographic information is lacking can be these data offer a strong support to official geographic ones, considering them as important as the first?
Is it possible to elaborate a web environment where all the social data can be shared to be user in a global scale?
This papers only start a long series of questions starting from a little experience.
Author Contributions
Cecilia Bolognesi conceived and designed the experiments; she performed the experiments, collected GIS and CSV datas Instagram images also for the representation and wrote the whole paper; Andrea Galli prepared 3D maps;. Authorship must be limited to those who have contributed substantially to the work reported.
Conflicts of Interest
The authors declare no conflict of interest.
References
- Pucci, P.; Manfredini, F.; Tagliolato, P. Why should we interpret Mobile Practices. In Mapping Urban Practices; Springer Science & Business Media: New York, NY, USA; Dordrecht, The Netherlands; London, UK, 2014; p. 14. ISBN 978-3-319-14832-8. [Google Scholar]
- CREMIT, Centro Ricerche Sul’educazione ai Media, Mappatura dei Social Network. Available online: http://www.cremit.it/mappatura-dei-social-network/ (accessed on July 2017).
- Sieber, R. Public Participation Geographic Information Systems: A Literature Review and Framework. Ann. Assoc. Am. Geogr. 2006. [Google Scholar] [CrossRef]
- Colombo, F. Il Potere Socievole: Storia e Critica Dei Social Media; Bruno Mondadori: Milano, Italy, 2013; ISBN 9788861596559. [Google Scholar]
- Resch, B. People as sensors and collective sensing—Contextual observations complementing geo-sensor network measurements. In Progress in Location-Based Services; Krisp, J.M., Ed.; Springer: Berlin, Germany, 2013; pp. 391–406. [Google Scholar]
- Jiang, B.; Miao, Y. The Evolution of Natural Cities from the Perspective of Location-Based Social Media; Department of Technology and Built Environment, Division of Geomatics, University of Gävle: Gävle, Sweden, 2013. [Google Scholar]
- Sui, D.Z.; Elwood, S.; Goodchild, M. Crowdsourcing Geographic Knowledge: Volunteered Geographic Information; Springer Science & Business Media: New York, NY, USA; Dordrecht, The Netherlands; London, UK, 2012. [Google Scholar]
- Tedeschi, A. AAD Algorithms-Aided Design: Parametric Strategies Using Grasshopper; Le Penseur, Edition: Potenza, Italy, 2014; ISBN 978-88-95315-30-0. [Google Scholar]
© 2017 by the authors. Licensee MDPI, Basel, Switzerland. This article is an open access article distributed under the terms and conditions of the Creative Commons Attribution (CC BY) license (https://creativecommons.org/licenses/by/4.0/).