Proceeding Paper

Microscale Gas Chromatography with Microsensor Array Detection: Challenges and Prospects †

1
Department of Chemistry, University of Michigan, Ann Arbor, MI, USA
2
Department of Environment Health Science, University of Michigan, Ann Arbor, MI, USA
3
Department of Mechanical Engineering, University of Michigan, Ann Arbor, MI, USA
4
Targeted Compound Monitoring, Dayton, OH, USA
*
Author to whom correspondence should be addressed.
Presented at the Eurosensors 2017 Conference, Paris, France, 3–6 September 2017.
Proceedings 2017, 1(4), 633; https://doi.org/10.3390/proceedings1040633
Published: 16 August 2017
(This article belongs to the Proceedings of Proceedings of Eurosensors 2017, Paris, France, 3–6 September 2017)

Abstract

:
The capability to analyze complex mixtures of airborne volatile organic compounds (VOCs) at low concentrations; in situ; has implications for environmental monitoring; worker exposure assessment; biomedical diagnostics; and population security. Since standalone microsensor arrays lack this capability; upstream separation of mixture components; often preceded by preconcentration; is required. Although significant advances have been made via MEMS technologies in the development of microscale gas chromatographic (μGC) systems; many challenges remain. This presentation will review selected aspects of the state-of-the-art in μGC for VOC mixture analysis. Here; we emphasize our progress toward a wearable μGC prototype.

1. Introduction

Research and development on microscale gas chromatographic (µGC) systems for analyzing mixtures of volatile organic compounds (VOCs) conducted over the past few decades has produced some significant advances in component device designs, system integration strategies, and performance [1,2,3]. Yet, early projections of inexpensive, pocket-sized instrumentation capable of autonomous, quantitative analysis of airborne VOC mixtures remain unrealized.
Below, we describe our recent efforts to develop and optimize the performance of a wearable μGC prototype designed for monitoring personal exposures of workers to VOCs in industrial environments, where allowable concentrations are generally in the high-ppb to high-ppm (v/v) range. We refer to this instrument as a personal exposure monitoring microsystem (PEMM). Building on results obtained with a predecessor bench-top μGC that uses similar components [4], a preliminary report on the PEMM was presented last year (Eurosensors 2016) [5]. In this article, we present the very latest results of testing that highlight the capabilities of the PEMM μGC prototype to autonomously measure personal exposures to fairly complex VOC mixtures in near-real time.
Figure 1a shows a block diagram of the fluidic/analytical subsystem of the PEMM, and Figure 1b–e show images of the key MEMS components and the packaged prototype mounted on the belt of an individual. The battery-powered PEMM measures 20 × 15 × 9 cm, weighs 2.1 kg, has an on-board helium canister, embedded microcontrollers, and 3-D printed packaging. Other features include: a passive pre-trap comprising a short section of PDMS wall-coated capillary that removes less volatile interferences; a dual-adsorbent micropreconcentrator-focuser (µPCF) that quantitatively captures (and releases) VOCs with vapor pressures in the range of ~0.03 to 13 kPa from sample volumes of ~5 to 30 mL [6]; a split-flow injection option for sharpening injection bands; a μcolumn chip (μSC) with a 6-m-long PDMS-coated channel; and an array of chemiresistors (μCR) coated with different thiolate-monolayer protected Au nanoparticles (MPN) that yields partially selective responses from which patterns can be derived and used to recognize the specific VOCs.

2. Materials and Methods

MPNs (3.5–5 nm core diam.) were made from n-octanethiol (C8), isooctyl-3-mercapto- propionate (EOE), methyl-6-mercaptohexanoate (HME) and 6-phenoxy-hexane-1-thiol (OPH), and were synthesized in-house. Carbopack X (C-X, 240 m2/g), Carbopack B (C-B, 100 m2/g) adsorbents (Supelco, Bellefonte, PA, USA) were sieved to ~200 µm, PDMS (OV-1) was obtained from Ohio Valley Specialty Co., (Marietta, OH, USA), and a He canister (95 mL, 4.0 cm × 13 cm, 2500 psi) and regulator were from Leland (South Plainfield, NJ, USA). Fluidic ports on all MEMS devices accept 250 µm i.d. deactivated, fused-silica interconnecting capillaries that were affixed with epoxy. All devices were mounted on, and wire-bonded to, individual printed circuit boards.
The DRIE-Si μPCF chip (Figure 1c) has two ~5 µL cavities separated 150 μm o.d. pillars and loaded with 2.0 mg C-B and 2.3 mg C-X, respectively. A 200-μm thick anodically bonded Pyrex plate seals the cavities/channels. A Ti/Pt resistive heater and RTD were patterned onto the backside.
The DRIE-Si µSC channel (6 m × 250 µm × 140 µm) has DRIE slots between each spiral segment and around the chip periphery for thermal isolation. Three back-side Ti/Pt meander-line heaters could be operated independently for “zone heating” [7], but for this study were connected and operated in parallel. A PDMS film (0.2 μm) was statically coated and cross-linked in situ.
The µCR array chip has a linear series of Cr/Au (30/300 nm) interdigital electrodes in a single row on a Pyrex substrate. Each µCR contains 27 electrode pairs, 5 µm wide, with 4 µm gaps, and 210 µm overlap. The back-side Ti/Pt heater and RTD were not used in this study. The Si lid has a 150 (h) × 350 µm (w) DRIE channel down the center. MPNs were drop-cast from solution to create (non-uniform) multilayer films with baseline resistances <10 MΩ. Only 4 µCRs were used per analysis. The lid was held to the substrate with double-sided tape and further sealed with epoxy.
All MEMS devices, mini-valves, mini-pump and supporting electronic/fluidic hardware are assembled in a minimum volume, some with 3-D printed mounting brackets and enclosures. Small fans facilitate scheduled cooling. Two embedded microcontrollers provide for event scheduling, data acquisition, and active temperature control. A low-power mini-computer provides a remote link for optional real-time capture of system status and data via a custom, web-based GUI.
Test atmospheres of the 17- and 5-VOC mixtures (see below) were generated in Flex-foil bags. Samples were collected and analyzed automatically by the PEMM after downloading the operating parameters. Additional testing entailed measuring vapors emitted from a liquid mixture in a heated beaker within a ventilated enclosure with an open front panel. Reference data for all tests were collected by GC-FID.

3. Results and Discussion

Figure 2a shows one of the four μCR chromatograms produced with the PEMM in <5 min (60 s sample, 105 s separation/detection, 120 s re-set) from a static test atmosphere containing a mixture of 17 VOCs. We have also performed analyses of a 21-VOC mixture with similar resolution (not shown). The chromatographic resolution for the C8 and HME sensors was similar to that shown (EOE sensor), while that for OPH sensor was somewhat lower due to tailing. We used a 2:1 split injection, which improved the resolution of compounds 1–9 by >50% (vs. splitless injection), but, characteristically, resulted in a 67% loss in sensitivity. In spite of this, LODs were <200 ppb for all sensors assuming a 5 mL sample volume. Although TCE and C7 overlap, their response patterns were sufficiently different to resolve them by principal component analysis (PCA) (Figure 2b). The same is true of overlapping peaks 4 and 5 (MIBK and TOL). This illustrates the value of using the sensor array for detection. To extend this concept further, we divided the entire chromatogram(s) into a series of three retention time “windows” each containing several compounds (dotted lines in Figure 2a). Compounds 1–9 were assigned to the first window (15–60 s). The corresponding PCA plot in Figure 2c, derived from the array response patterns, shows that the most compounds could be identified readily by PCA (i.e., without retention time). For the two pairs of compounds with similar response patterns (i.e., MBK + BAC and TCE + TOL), combining retention time with the PCA results led to unequivocal identification. Similar results were obtained for other windows. The windowing approach simplifies the analysis by limiting the number of compounds (and patterns) in the calibration library under consideration.
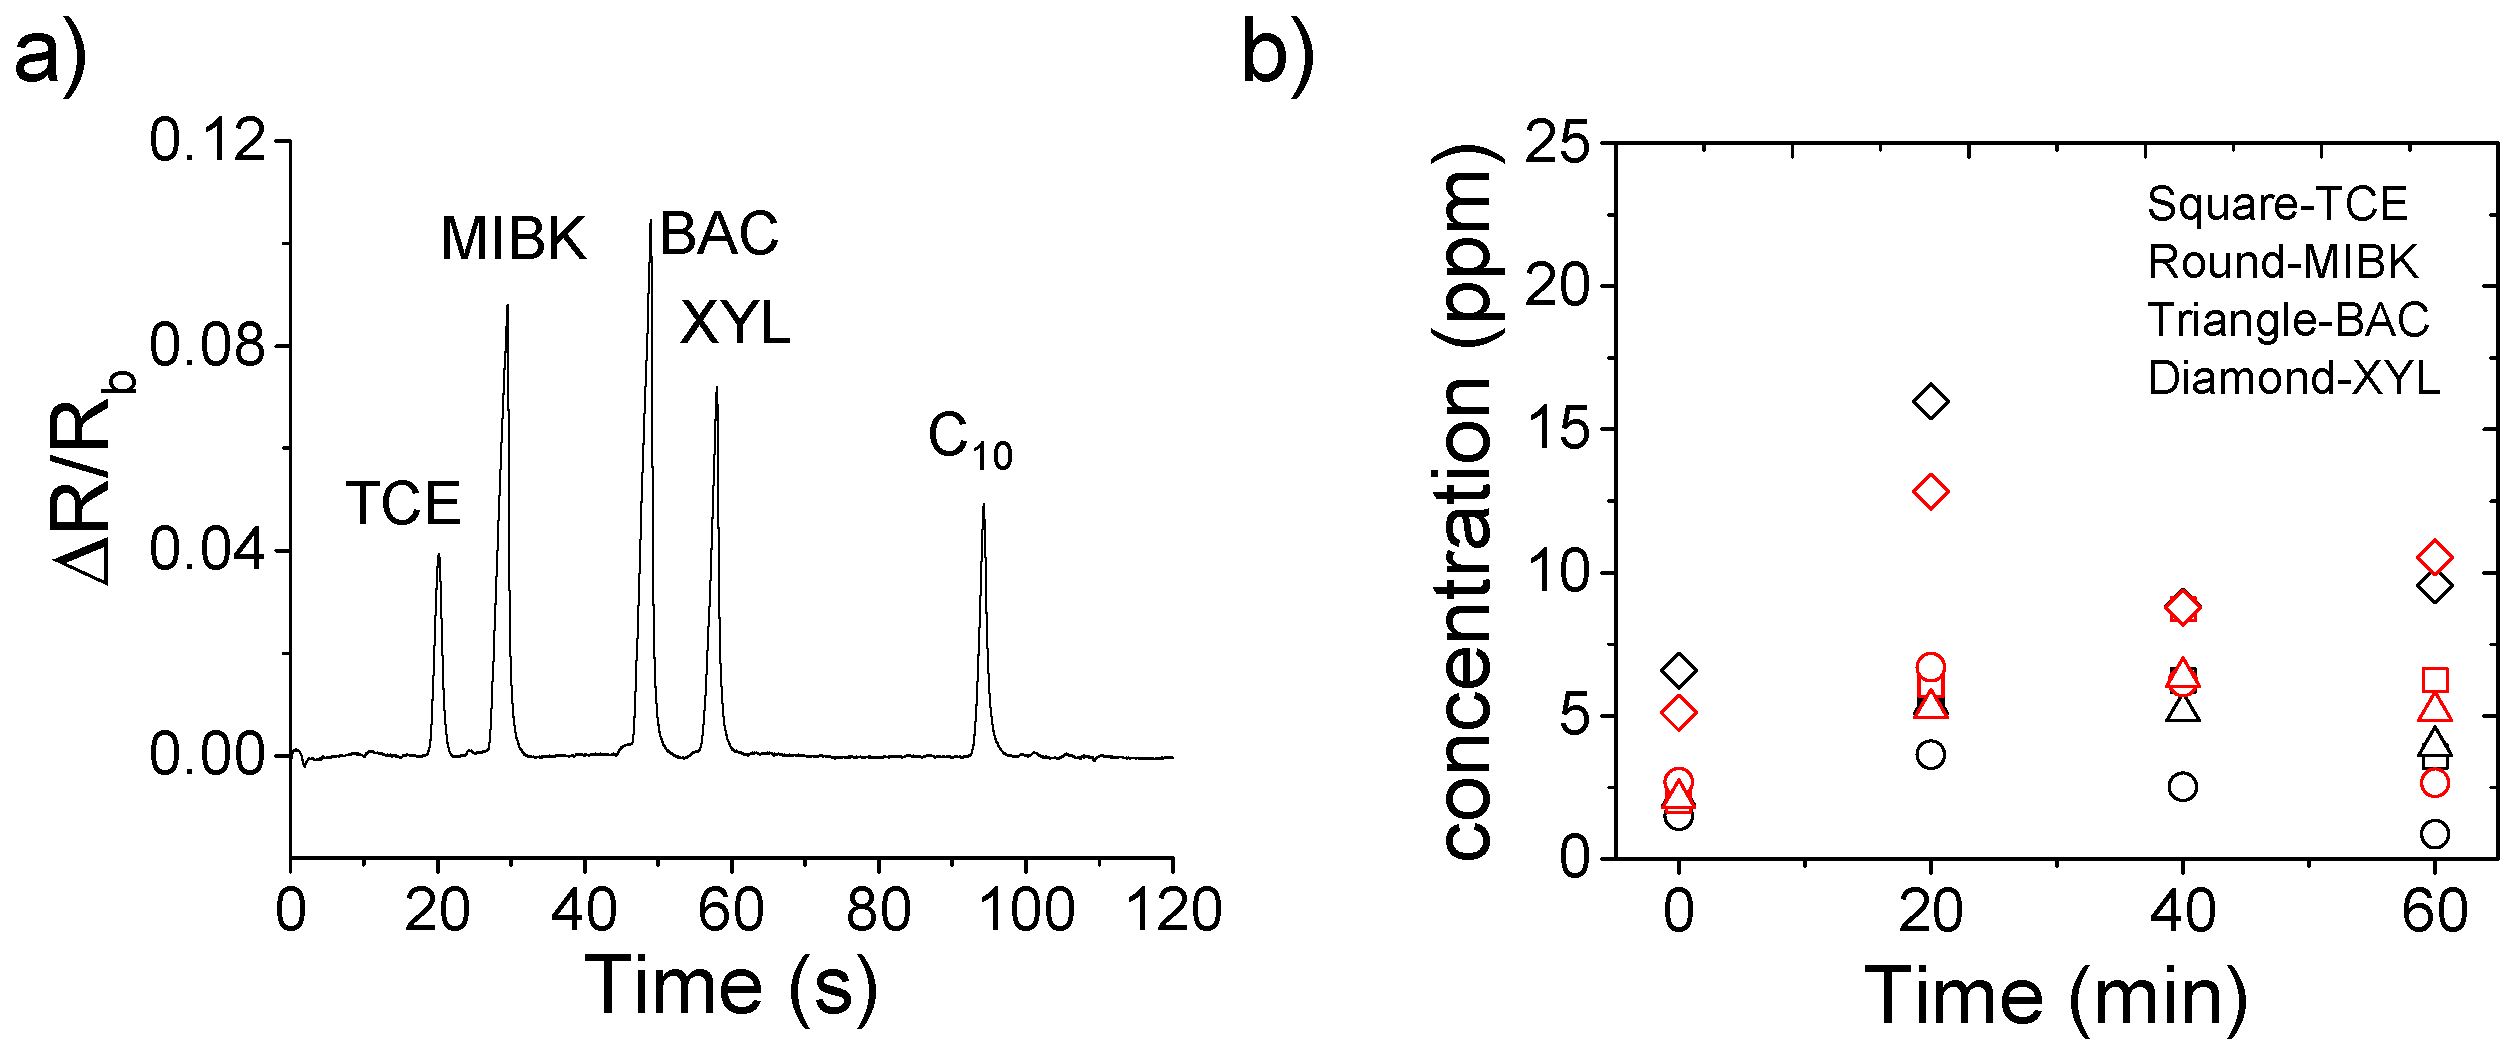
Figure 3 shows results obtained from the PEMM while worn on a belt (Figure 1e) during efforts to optimize conditions for full-scale “field” testing. A liquid mixture of 5 VOCs was placed in a beaker on a hot-plate stirrer in the ventilated enclosure. Vapor concentrations were varied over a range of relatively low levels. The instrument was programmed to run autonomously through 12, 5-min sampling/analytical cycles (60 min). Figure 3a shows a representative chromatogram. Figure 3b shows selected results from the PEMM and from the reference GC-FID, indicating excellent agreement in estimated concentrations for all vapors over the course of the test. On-going efforts are concerned with demonstrating continuous operation for 8 h and verifying the performance of the PEMM for more complex mixtures under a wide range of exposure conditions.

Acknowledgments

Technical assistance: J. Bryant-Genevier, W. Collin, K. Sholten, C. Zhang, S. Buggaveeti, K. Kurabayashi. Funding: NIOSH-CDC Grant R01-OH010297.

Conflicts of Interest

The authors declare no conflict of interest. The funding sponsor had no role in: the study design; data collection, analyses, or interpretation; manuscript writing, or the decision to publish the results.

References

  1. Lu, C.J.; Steinecker, W.H.; Tian, W.C.; Agah, M.; Potkay, J.A.; Chan, H.K.; Sacks, R.D.; Wise, K.D.; Pang, S.; Zellers, E.T. First-generation hybrid MEMS gas chromatograph. Lab Chip 2005, 5, 1123–1131. [Google Scholar] [CrossRef] [PubMed]
  2. Lewis, P.R.; Manginell, R.P.; Adkins, D.R.; Kottenstette, R.J.; Wheeler, D.R.; Sokolowski, S.S.; Trudell, D.E.; Bymes, J.E.; Okandan, M.; Bauer, J.M.; et al. Recent advancements in the gas-phase µChem Lab. IEEE Sens. J. 2006, 6, 784–795. [Google Scholar]
  3. Akbar, M.; Restaino, M.; Agah, M. Chip-scale gas chromatography: From injection through detection. Microsyst. Nanoeng. 2015, 1, 15039–15046. [Google Scholar] [CrossRef]
  4. Wang, J.; Bryant-Genevier, J.; Nuñovero, N.; Zhan, C.; Kraay, B.; Scholten, K.; Zhang, C.; Buggaveeti, S.; Nidetz, R.; Zellers, E.T. Compact prototype microfabricated gas chromatographic analyzer for autonomous determinations of VOC mixtures at typical workplace concentrations. under review.
  5. Wang, J.; Nuñovero, N.; Lin, Z.; Nidetz, R.; Buggaveeti, S.; Zhan, C.; Kurabayashi, K.; Steinecker, W.; Zellers, E.T. Wearable MEMS GC for multi-vapor determinations. Procedia Eng. 2016, 168, 1398–1401. [Google Scholar] [CrossRef]
  6. Bryant-Genevier, J.; Zellers, E.T. Toward a microfabricated preconcentrator-focuser for a wearable μGC. J. Chrom. A. 2015, 1422, 299–309. [Google Scholar] [CrossRef] [PubMed]
  7. Lin, Z.; Nuñovero, N.; Wang, J.; Nidetz, R.; Buggaveeti, S.; Kurabayashi, K.; Zellers, E.T. A zone-heated gas chromatographic microcolumn: Energy efficiency. Sens. Actuators B Chem. accepted for publication. [CrossRef]
Figure 1. (a) PEMM fluidic layout; (bd) μcolumn; µPCF; μCR array; (e) belt-mounted PEMM.
Proceedings 01 00633 g001
Figure 2. (a) 17-VOC chromatogram from the EOE sensor of the PEMM; (b) Response patterns and PCA plot for TCE and C7 (overlapping peaks 2, 3); (c) PCA plot of cmpds in the 1st retention time window (15–60 s). Conditions: ~100 ppm of each VOC; 1-min sample @5 mL/min; µPCF: 225 °C; 2:1 split injection (6:3 mL/min); temp. program: 50 s at 30 °C; 50 °C/min to 125 °C; 16 s hold. Peak assignments: 1, benzene, BEN; 2, trichloroethylene, TCE; 3, n-heptane, C7; 4, 4-methyl-2-pentanone, MIBK; 5, toluene, TOL; 6, 2-hexanone, MBK; 7, butyl acetate, BAC; 8, ethylbenzene, ETB; 9, m-xylene, XYL; 10, 3-heptanone; 11, n-nonane; 12, α-pinene; 13, cumene; 14, propylbenzene; 15, trimethylbenzene; 16, n-decane, C10; 17, d-limonene.
Proceedings 01 00633 g002
Figure 3. Results from 60 min of autonomous operation of the belt-mounted PEMM in measuring air concentrations of 5 VOCs from a heated/stirred beaker; (a) representative chromatogram from the EOE sensor; (b) comparison of concentrations from the belt-mounted PEMM (red symbols) and the reference GC-FID (black symbols) for 4 of the 5 VOCs (C10 omitted). Only 4 of the 12 continuously collected data sets are shown.
Proceedings 01 00633 g003
Publisher’s Note: MDPI stays neutral with regard to jurisdictional claims in published maps and institutional affiliations.