2. Experimental
This work is focused on the production of millimeter disks of Terfenol-D (diameter 6 mm, thickness 1 mm) whose in-plane properties (microstructural and magnetic) were measured. Four series of disks were prepared. They were either cut from commercial centimeter monocrystalline Terfenol-D rods and cast polycrystalline ingots, or sintered from commercial powders (0–38 µm diameter). We used two hot press techniques at 1075 °C based on conventional heating and SPS (Spark Plasma Sintering), respectively. Magnetic in-plane characterizations were performed using a vibrating sample magnetometer with 360° angular excursion, radial saturation magnetostriction strain were measured at 2 T with the capacitance method, optical metallography, SEM observations and density measurements were performed.
3. Results
Differences in structural appearance for the four disks series are shown in
Figure 1. On
Figure 1a, optical metallography revealed the surface of cut single-crystal disks. Samples are generally twinned exhibiting a fine lamellar structure with twin boundaries, being the result of a dendritic growth [
3]. Θ-2Θ X-ray diffraction (not shown here) indicates that the normal disk direction is [112] which is the natural Terfenol-D growth direction.
Figure 1b shows results for a disk cut from cast polycristalline alloy. It reveals a polycristalline structure consisting in a mixture of [112]-oriented grains and randomly-oriented grains.
Figure 1c,d show cross-sectional SEM pictures of sintered samples. Unlike the first two series, hot-pressed powder materials are not dense compare to bulk. Density measurements indicate 70% of the theoretical density with an average porosity size of ~10 µm for conventional annealing (
Figure 1c) and 90% and ~2 µm for SPS (
Figure 1d).
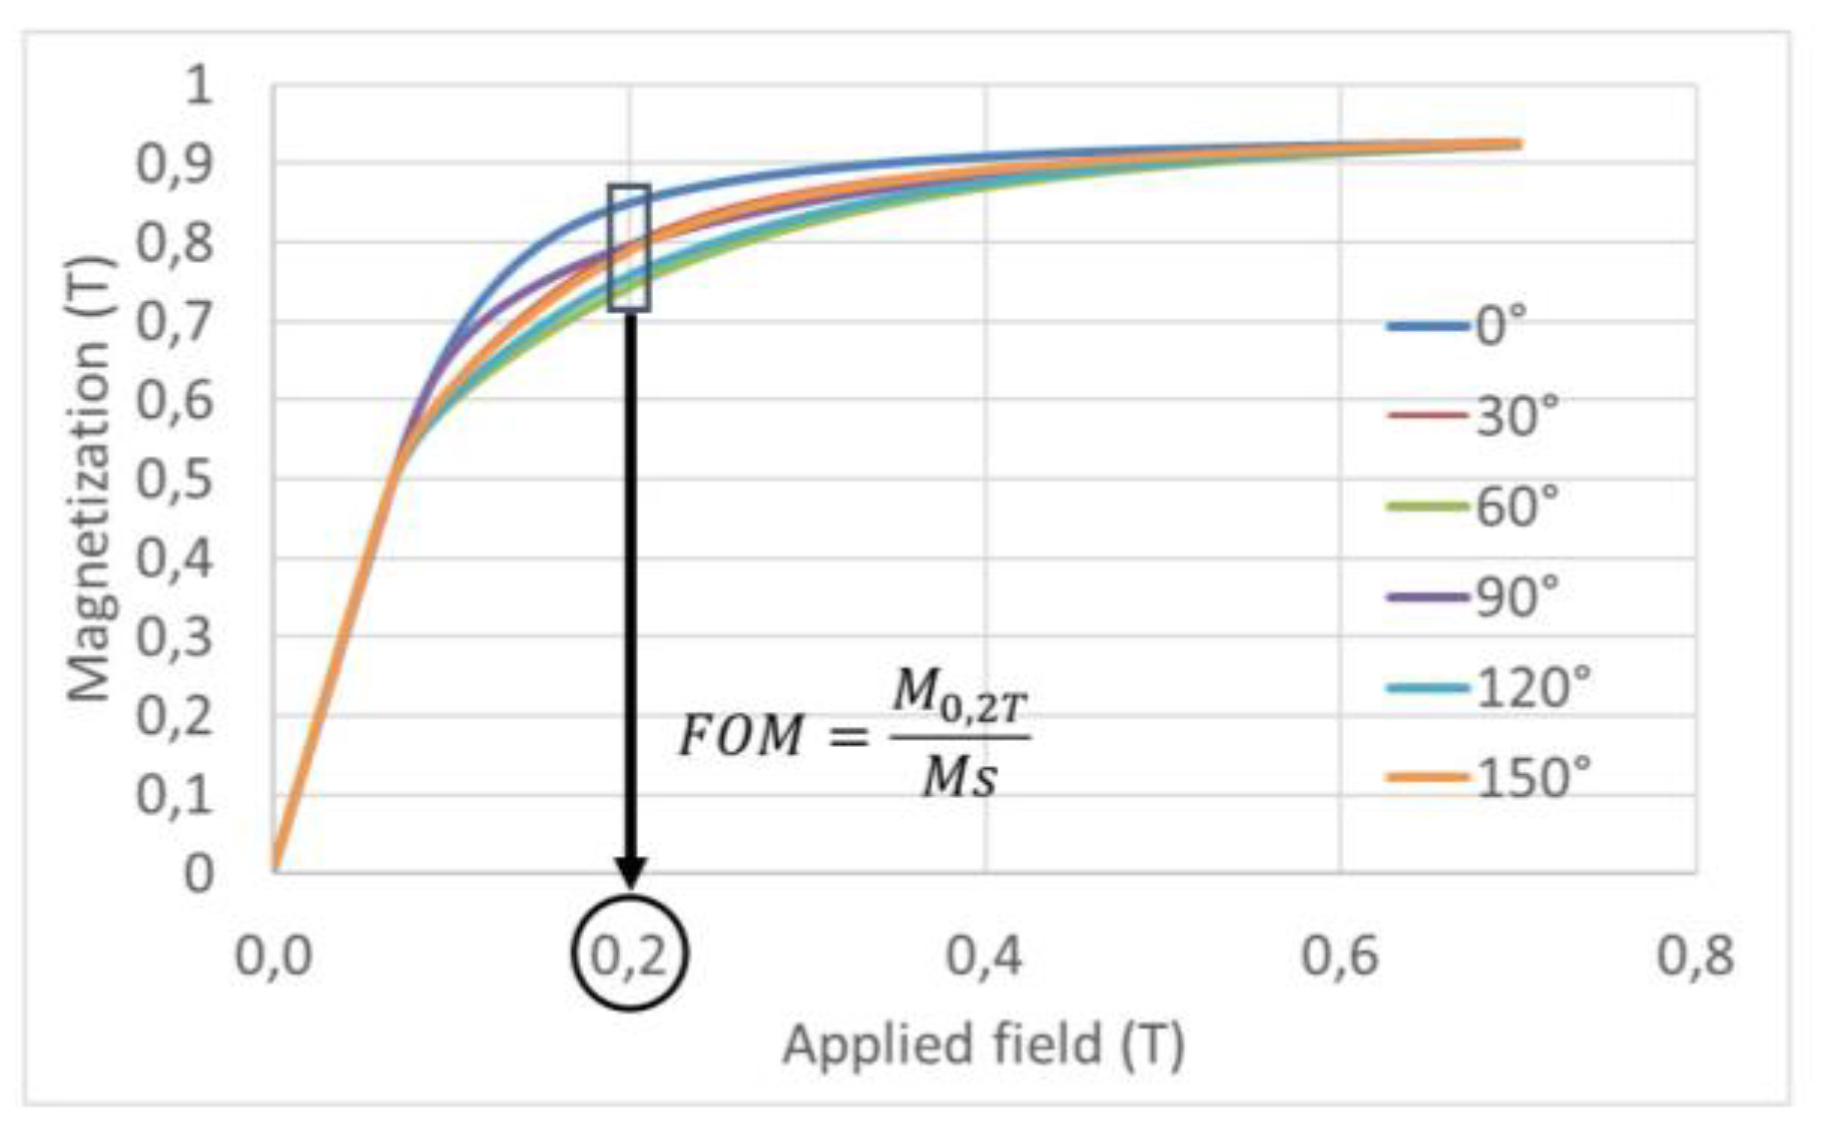
Figure 2 shows typical in-plane hysteresis loops of single crystal disks with different applied magnetic field azimuthal angle. We observe that the approach to saturation depends on the angle which reveals the magnetocrystalline anisotropy of the sample. To make comparing series of samples easier, we introduce two reduced quantities defined from hysteresis loops: the magnetization squareness ratio at 0.2T (
SQR0.2T) and the anisotropy ratio
k.
SQR0.2T reflects the ease with which the material saturates for a given applied field angle. The values close to unity correspond to easy axes and the values far from unity to hard axes. The ratio k is used to quantify the degree of anisotropy of the samples.
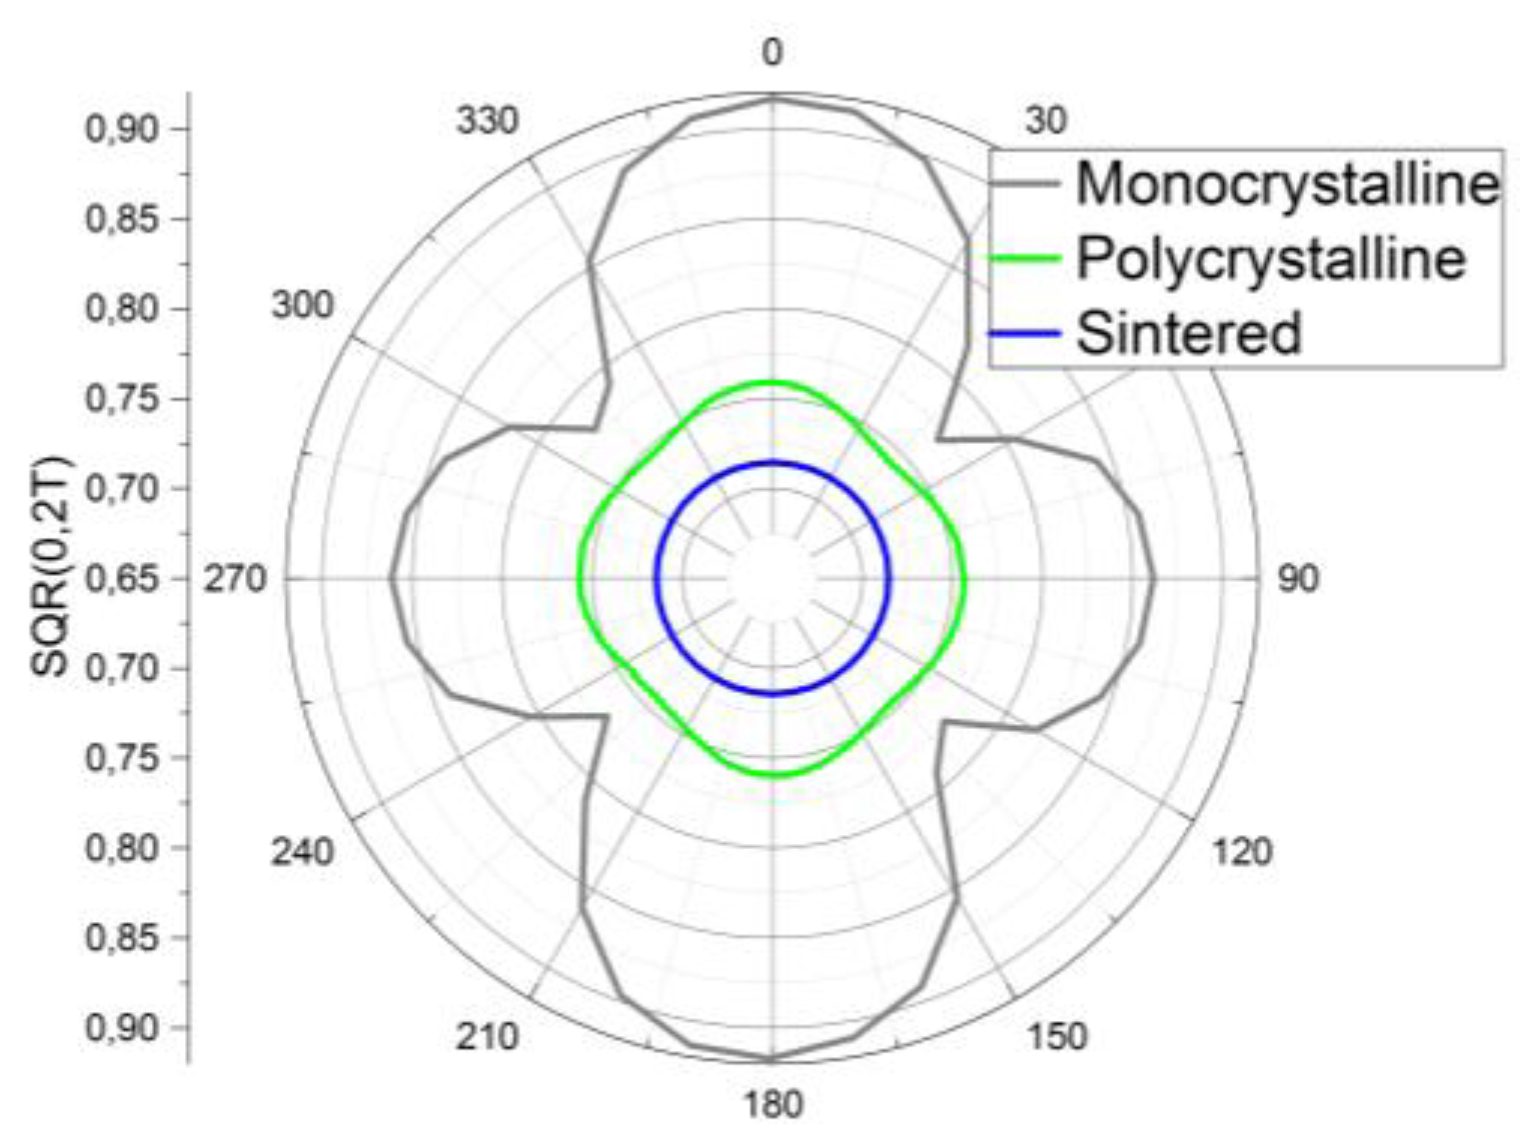
Typical polar plots with
SQR0.2T are shown in
Figure 3 for monocrystalline, polycrystalline and sintered samples. For disks cut from single crystals, one can identify expected easy axes at 0° and 90° and hard axis at 39° and 129°. This is consistent with the [112] orientation of the samples. For disks cut from cast materials, variation of
SQR0.2T over the angle is weaker indicating lowered anisotropy which is consistent with the observation of partially disoriented grains. Finally, results for hot-pressed powder materials are circular (isotropic) which is expected for randomly distributed grains. Lower radii for polycristalline and sintered samples indicate higher driving fields to reach the saturation due to internal demagnetizing fields (grain boundaries and porosity).
Figure 4 illustrates the dependence of
λsat with
k and reveals three groups of materials: first group on top gathers monocrystalline samples which have both largest anisotropy and magnetostriction. However, a significant disparity was found between disks resulting in a broad dispersion [
4]. Second group (middle) corresponds to polycrystalline samples with intermediate
k and
λsat values. Third group represents sintered samples with
k = 1. The line delimiting groups 2 and 3 corresponds to 3/5 of the saturation magnetostriction of perfect single-crystal considering an ideal random distribution of grains. Polycrystalline samples are above this line because of the presence of residual [112]-oriented grains. Sintered samples are below this line because of traces of oxidation which strongly impinge saturation magnetization and magnetostriction.
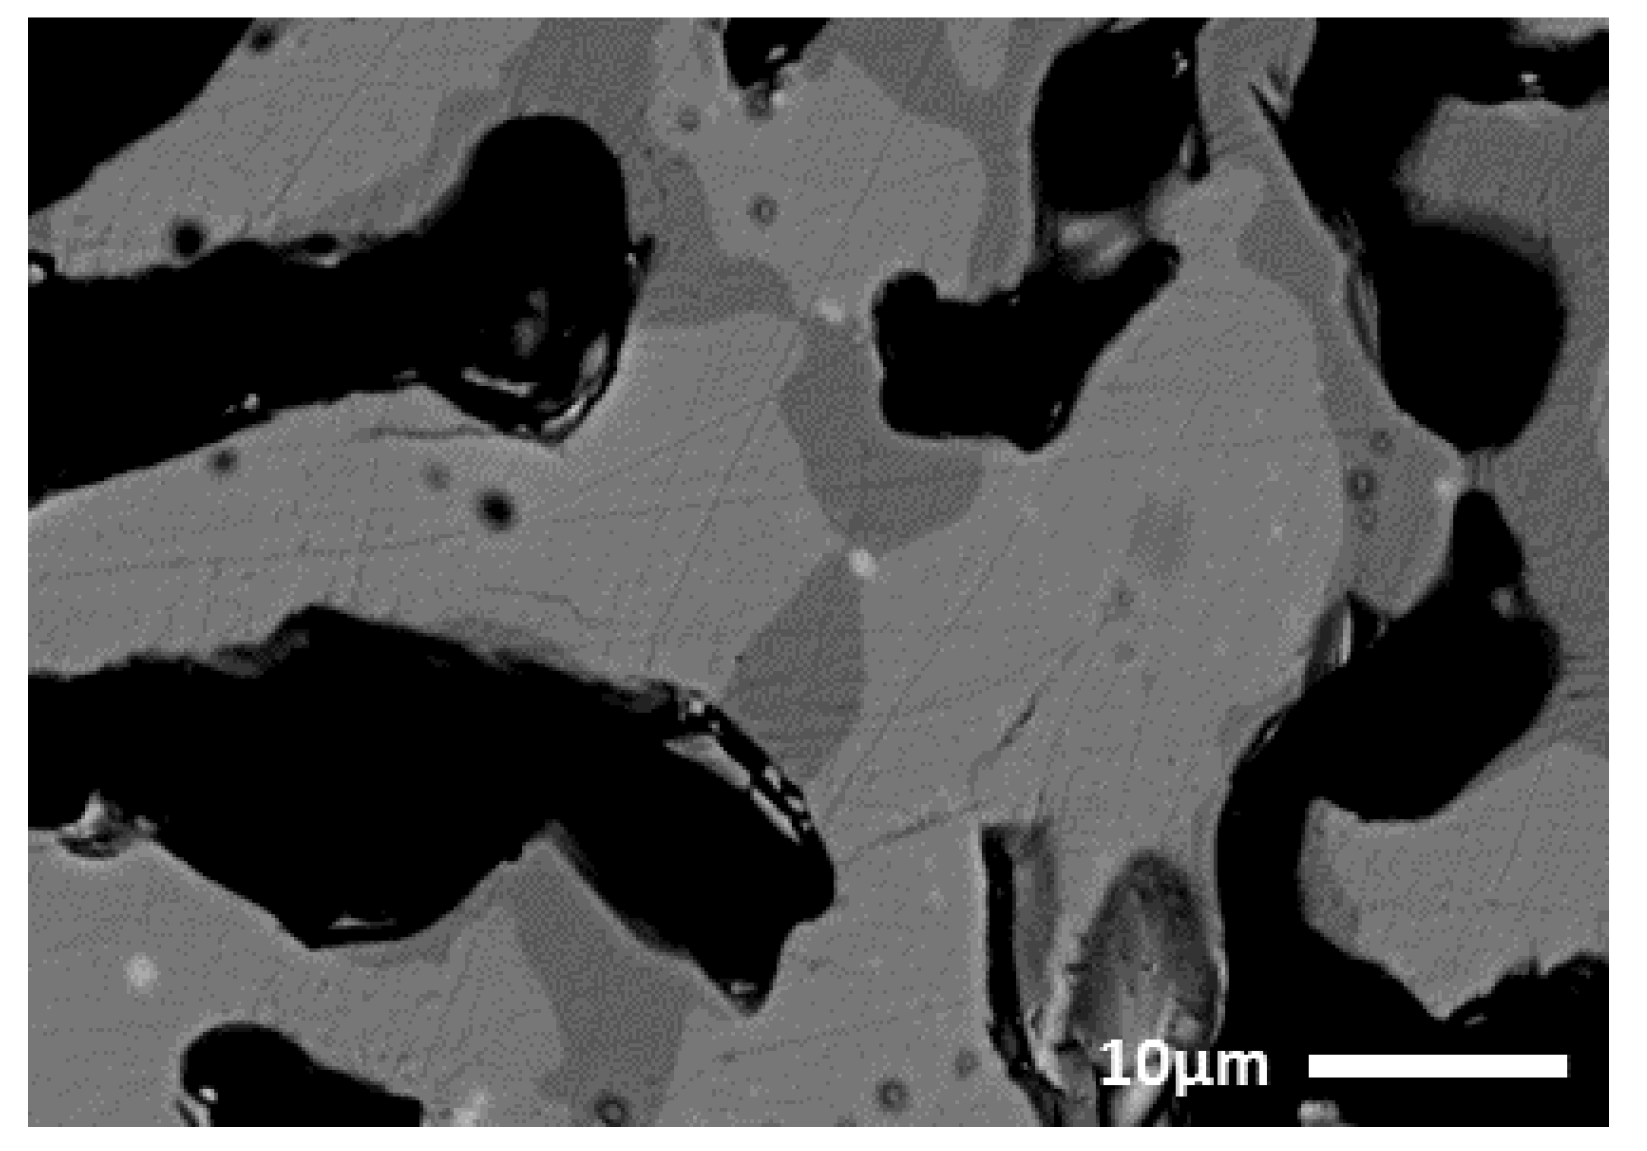
When looking in more detail at group 3, the highest point corresponds to SPS with which the oxidation is most limited. The lower points go with conventional annealing with which the low magnetostriction R
12Fe
3O
2 phase preferably forms from porosities as illustrated on
Figure 5. Therefore, SPS technique takes advantage over conventional annealing for the production of intermediate high performance sintered Terfenol-D material as it reduces internal porosities and oxidation. The performance can then reach that of cast alloy being in addition completely isotropic.
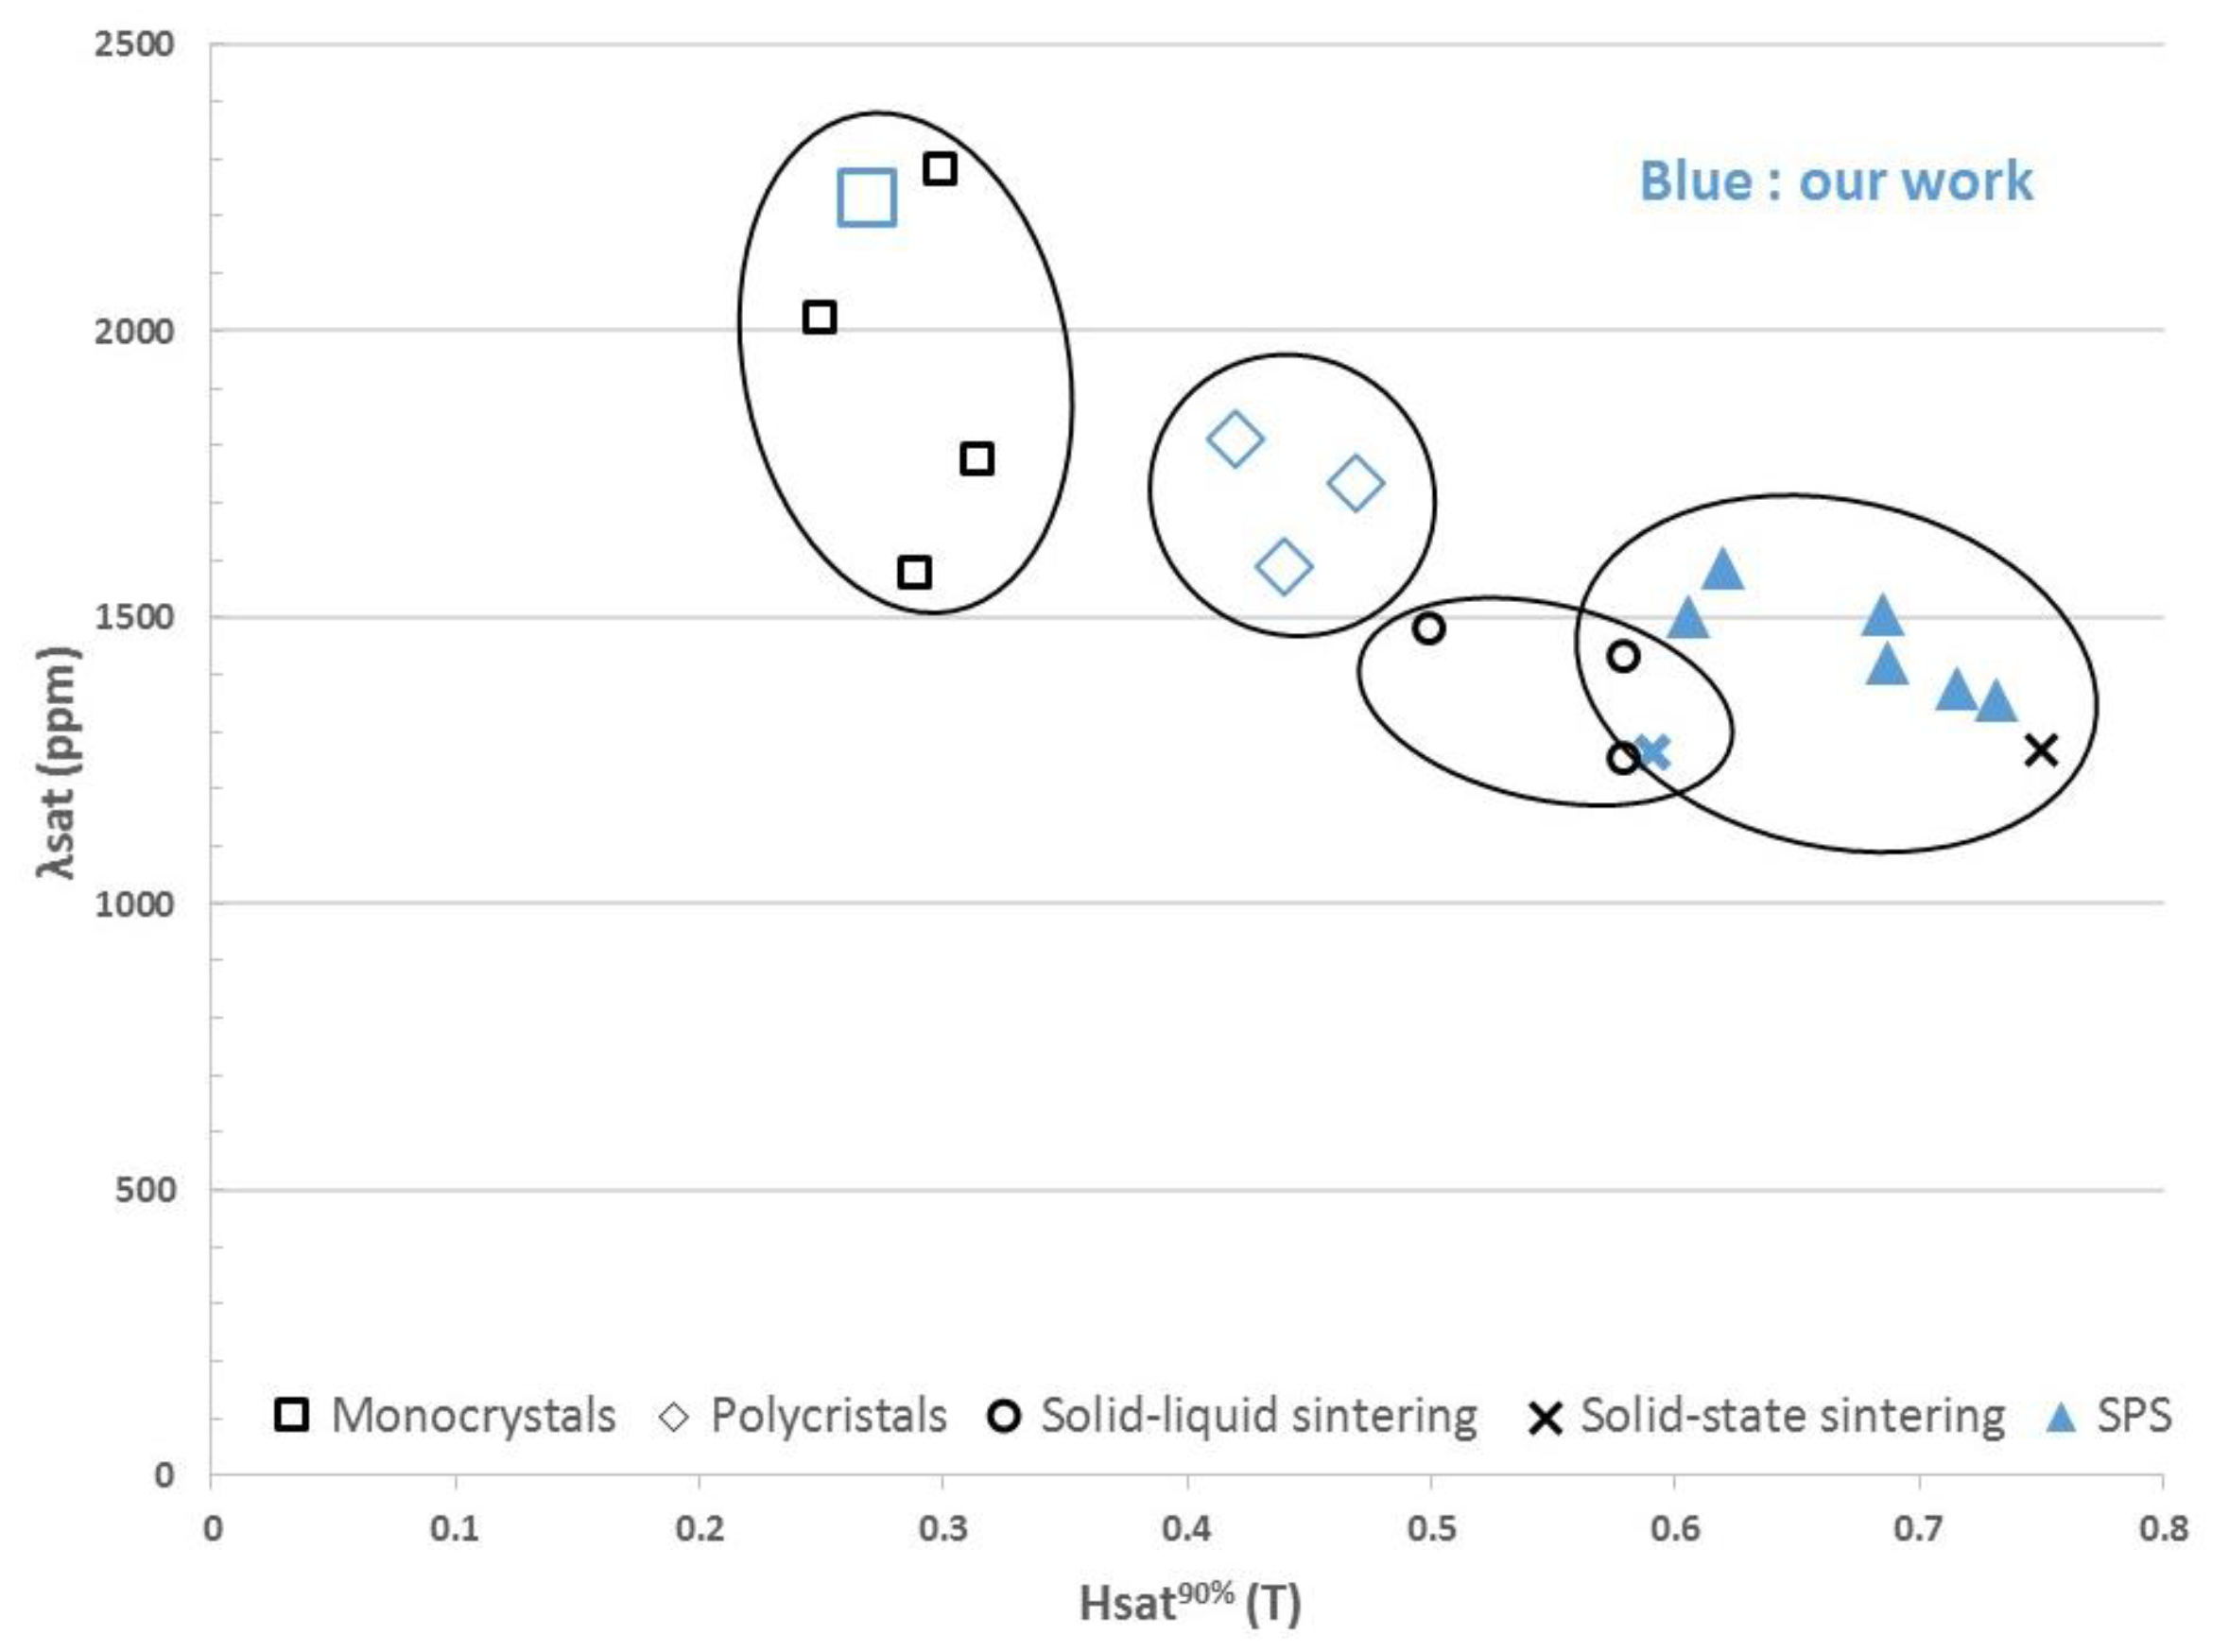
Figure 6 illustrates the obtained “performance phase diagram per technique”. For applications, attention is focused on the couple
λsat,
Hsat90% (practical drive field to reach 90% of
λsat). Our results (in blue) complement those of the literature (in black) [
5,
6,
7]. As expected, Terfenol-D single crystals remain the most efficient material located at the top left of the diagram. However, the best performance with miniature disks is obtained with a selection of sorted samples. The diagram reveals the very broad dispersion with unsorted single crystal disks approaching the intermediate performance materials. This central area (new) is occupied by disks of cast polycristalline materials which have been little used before. The area for sintered materials is shifted on the bottom right of the diagram. Hot-pressed powder materials are further penalized by higher driving fields due to residual porosity and oxidation. In this work, we show that SPS technique may bring them back close to the middle with reducing these defects. More, sintered materials (not oriented) are isotropic.


