Abstract
QCM is one of major sensing methods for volatile organic compounds (VOC) at room temperature. Nanostructure is effective to increase the sensitivity because of its large surface area. We introduced ZnO nanostructure to detect ethanol gas. ZnO nanostructure was fabricated by all wet process such as electrodeposition and chemical bath deposition (CBD). In this case, seed layer was obtained by electrodeposition, and nanostructure was formed by the CBD. The thickness of seed layer was controllable by charge amount on the electrodeposition, and that of nanostructure was controllable by deposition time on the CBD. As the results, the sensitivity increased with the thickness of the seed layer when the deposition time on CBD was set as 30 min. These results indicate that we can obtain high sensitive VOC sensor by using all wet process which is fit to large scale production with cost-effective.
1. Introduction
Volatile organic compounds (VOC) are one of the major targets for gas sensing, since they are known as air pollutants and marker of some diseases such as diabetes and kidney failure. For examples, acetone, ethanol, acetaldehyde, methane, and trimethylamine are measured for VOC sensing. In particular, sensing ethanol gas is very important in automobile and foods industry. In addition, we can use intelligent sensors at someone’s need, since a mobile sensor can be connected to a mobile device such as a smartphone.
There are mainly two measuring methods to detect ethanol gas, semiconductor and quartz microbalance methods (QCM). Semiconductor type gas sensor monitors the resistance changes corresponding to the gas adsorption on the electrode and works at high temperature over 200 °C. ZnO has been used for a sensor material for VOC on a semiconductor device [1,2]. QCM type sensor monitors the frequency changes of resonance frequency corresponding to the gas adsorption on the electrode and works at room temperature. QCM is known as a real time measurement with simplicity, convenience and low cost. QCM is one of candidates for highly sensitive ethanol sensor to be integrated with the mobile device without heating procedure. Some researchers tried to use ZnO material onto the quartz surface [3,4]. We have studied ZnO structure dependent with the deposition potential on the electrodeposition, and tried to detect ethanol using the electrodeposited ZnO on the twin sensor QCM [5]. As the results, QCM with scaly ZnO surface, which was obtained at −0.8 V vs. Ag/AgCl, showed high frequency changes on exposing to ethanol gas. This result indicated that highly specific surface would be effective to improve the sensor sensitivity. In this study, ZnO nanostructure was fabricated on the QCM chip by all wet process, and it was applied to detect ethanol gas. In fact, the seed layer was obtained by electrodeposition, and nanostructure was formed by Chemical Bath Deposition (CBD).
2. Experimental
Zinc nitrate hexahydrate was dissolved in pure water, and it was used as an electrolytic plating solution. The concentration of it was 0.05 M. We used a three electrode system and a potentiostat (HZ-5000, Hokuto Denko Corp., Japan). Counter electrode was Zn plate, and Ag/AgCl was used for a reference electrode. Working electrode was Au thin film on the quartz substrate (fundamental: 9 MHz, Seiko EG&G, Japan). On the electrodeposition, the potential was ranged from −0.7 to −0.9 V vs. Ag/AgCl at 60 °C. The deposition time was ranged from 5 to 15 min. The size of ZnO crystal enlarged with the charge amount which increased with the deposition time and the deposition potential. So, ZnO seed layer was fabricated on the QCM with the applied potential of −700 mV. The solution composed of Zinc nitrate hexahydrate, NH4OH, and TMAH was used for CBD at 90 °C. Finally, pH of the CBD solution was adjusted to 10.6. After the CBD deposition, the device was washed with pure water. Then, the device was stored within a vacuum until gas measurement.
3. Results and Discussion
3.1. Morphology of ZnO Nanostructures
The electrodeposited layer was used as a seed layer for CBD. As the results of SEM images of the ZnO films electrodeposited from −0.7 to −0.9 V vs. Ag/AgCl, ZnO crystal enlarged with charge amount. The charge amount increased with the deposition time and the potential. Thickness of the ZnO thin film increased linearly with the charge amount. So, we can control the thickness of ZnO thin film by the charge amount.
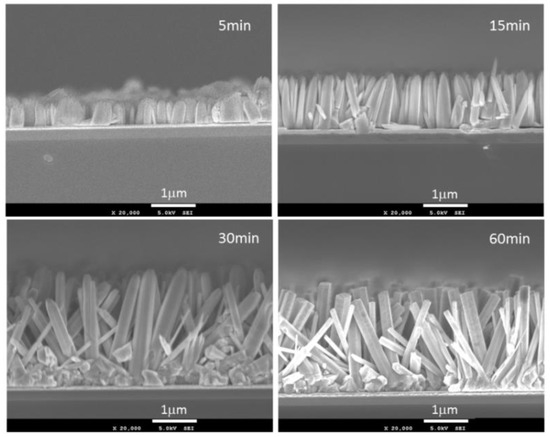
Figure 1 shows the SEM images of ZnO nanostructure on the CBD deposition time from 5 to 60 min. The height of the structure increased with the deposition time linearly lower than 30 min, then it was saturated after 30 min. In the same way, diameter of the nanostructures increased with the deposition time. In addition, nanostructures were grown in vertical direction on the deposition time within 15 min. After that, the structures were grown in diagonal direction.

Figure 1.
SEM images of ZnO nanostructures after CBD deposition for 5, 15, 30, and 60 min, respectively.
3.2. Sensor Characteristics
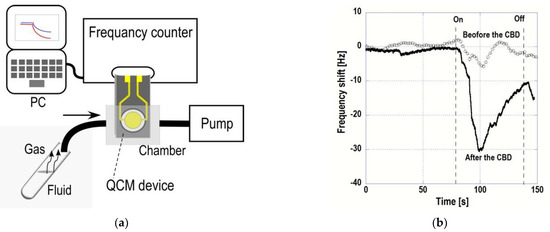
Figure 2a shows a schematic figure of ethanol vapor detection and an example of real time measurements of frequency shift corresponding to ethanol gas injection before and after the CBD deposition for 15 min (Figure 2b). Resonant frequency decreased just after the injection of EtOH gas. After the frequency shift reached the peak, it increased gradually. These results indicated that adsorption and desorption of EtOH gas on ZnO nanostructure was quickly or gas concentration decreased with the time because the gas was filled with a microtube at first. The magnitude of frequency shift corresponding to the gas adsorption was increased after the CBD, because of its large surface area. These data shows that ZnO nanostructure was effective to increase the sensitivity of the sensor.

Figure 2.
Left: (a) Schematic figure of QCM measurement for EtOH gas. Liquid EtOH was stored in a 1.5 mL microtube. After a cap of the microtube was opened, a silicone tube was inserted in the top of the microtube. Then, vapor of the EtOH gas was supplied to a measurement chamber by pump. Right: (b) Time dependent QCM measurements of EtOH gas before and after the CBD for 15 min.
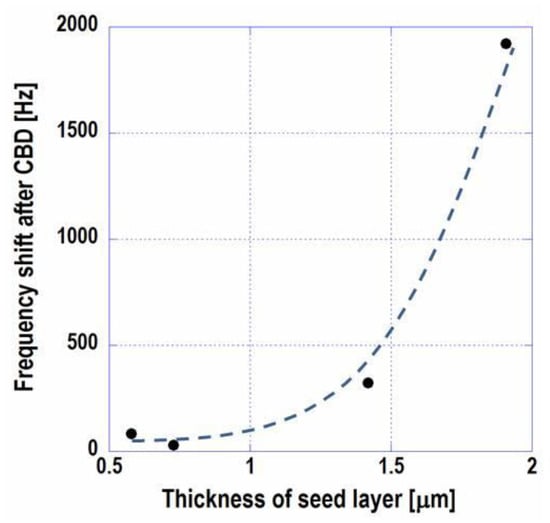
We evaluated the effect of the thickness of seed layer on the sensitivity, which was electrodeposited on Au electrode. Figure 3 shows the frequency shift on the EtOH gas injection corresponding to the thickness of the seed layer. Here, the thickness was monitored by using cross section SEM. As the results, the magnitude of the frequency shift increased with the thickness of the seed layer.

Figure 3.
The magnitude of frequency shift on EtOH gas injection dependent with the thickness of the seed layer.
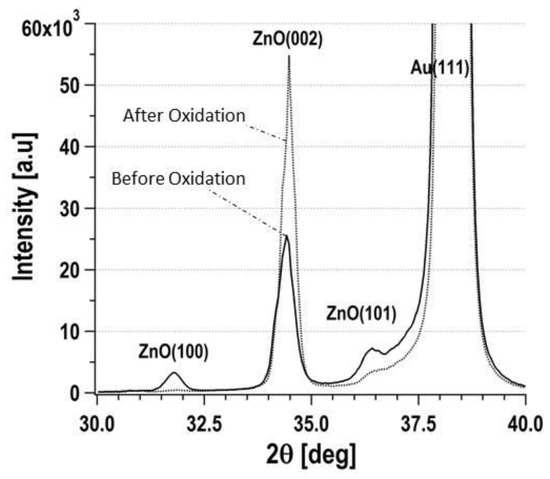
In addition, we evaluated the effect of thermal oxidation of nanostructured ZnO on EtOH gas sensing. Thermal oxidation was treated at 100 °C for 1 h in the atmosphere. The magnitude of the frequency shift on the EtOH gas injection decreased and was lower than the half of it after the thermal oxidation. X-ray diffracrion analysis was applied to the samples as shown in Figure 4. Before the thermal oxidation, the peaks belonging to ZnO(100), (002), and (101) were observed. The data shows ZnO structure was polycrystal. However, the peak intensity of ZnO(002) was only increased after the thermal ozidation. Other peak intensities were decreased or missed. These results indicated that the surface of (100) and (101) was effective to gas sensing.

Figure 4.
XRD patterns of ZnO nanostrucuture on the quartz crystal. Dash line and continuous line were measured before and after the thermal oxidation, respectively.
Finally, we evaluated the selectivity of the ZnO nanostructure based QCM sensor. Frequency shift dependent with vapors such as water, acetone, EtOH, and IPA were monitored, and the value of them were 48 Hz, 76 Hz, 266 Hz, and 195 Hz, respectively. These results agreeded with other report [1] and indicated that the QCM sensor had selectivity to the alcohols which have hydroxyl group.
Acknowledgments
This study was partially conducted by Formation of research center at Kansai University.
Conflicts of Interest
The authors declare no conflict of interest.
References
- Xie, J.; Wang, H.; Duan, M. QCM chemical sensor based on ZnO colloid spheres for the alcohols. Sens. Actuators B 2014, 203, 239–244. [Google Scholar] [CrossRef]
- Özturk, S.; Kösemen, A.; Kösemen, Z.A.; Kilinç, N.; Özturk, Z.Z.; Penza, M. Electrochemically growth of Pd doped ZnO nanorods on QCM for room temperature VOC sensors. Sens. Actuators B 2016, 222, 280–289. [Google Scholar] [CrossRef]
- Ito, T.; Aoki, N.; Tsuchiya, A.; Kaneko, S.; Suzuki, K. Sequential Analysis of β-lactoglobulin for Allergen Check Using QCM with a passive Flow System. Chem. Lett. 2015, 44, 981–983. [Google Scholar] [CrossRef]
- Ito, T.; Aoki, N.; Kaneko, S.; Suzuki, K. Highly Sensitive and Rapid sequential cortisol detection using twin sensor QCM. Anal. Methods 2014, 6, 7469–7474. [Google Scholar] [CrossRef]
- Ito, T.; Fujii, Y.; Yamanishi, N.; Asai, N.; Shimizu, T.; Shingubara, S. Electrodeposited ZnO thin film on twin sensor QCM for sensing ethanol at room temperature. Proc. Eng. 2017, 168, 411–414. [Google Scholar] [CrossRef]
Publisher’s Note: MDPI stays neutral with regard to jurisdictional claims in published maps and institutional affiliations. |
© 2017 by the authors. Licensee MDPI, Basel, Switzerland. This article is an open access article distributed under the terms and conditions of the Creative Commons Attribution (CC BY) license (https://creativecommons.org/licenses/by/4.0/).