Abstract
In the present work, we studied the controlled growth of MoO3 nanostructures and their gas sensing performance. MoO3 NS were synthesized using thermal evaporation method. FE-SEM (LEO 1525) and XRD were used to characterize the morphology and crystallinity of MoO3 NS. Sensing devices were mounted on TO packages using electro-soldered gold wires, and they were tested toward some chemical compounds. These NS give reversible response to Acetone, Ethanol and H2 in a temperature range of 300–550 °C. MoO3 sensors exhibit a high response ∆G/G = 45 towards 50 ppm of Ethanol at 450 °C.
1. Introduction
Semiconductor metal oxide nanostructures (NS) have been exploited in literature as chemical gas sensors due to their low cost easy fabrication, consistence stability, high sensitivity and simple interface electronics comparing to other type of gas sensors [1]. SnO2 and ZnO are the most common metal oxide used for gas sensing even if, recently, there is an increasing trend of using different metal oxides for gas sensing application. Among other metal oxides, MoO3 is an n-type semiconductor with 2.9 eV band gap, which can potentially cover a wide range of application including catalysis, electrochromic devices and gas sensing.
MoO3 thin films are widely used as chemical gas sensors, and show high reversible response toward some gases [2]. However, there are few literature works reporting the use of MoO3 NS for gas sensing application [1]. It is well known that, for chemisorption, gas sensitivity is mainly associated with the size and morphology of the metal oxide material; NS materials have high surface to volume ratio and provides rapid diffusion of gas molecule. There are plenty of synthesis methods for NS and among them; VLS is one of the leading technique because of low risk of contamination and produce highly crystalline structures. Also this technique has capability to growth NS on the substrate and without using expensive and time consuming transferring methods.
In this study, we report the synthesis of MoO3 by evaporation condensation method, characterization by SEM and XRD and gas sensing performance of this NS.
2. Materials and Method
Ultrasonically cleaned (in acetone bath for 15 min) Alumina (99.9% purity, 2 mm × 2 mm, Kyocera, Japan) substrates were used to growth MoO3 NS. A thin layer of Au catalyst was deposited on the alumina substrates by RF magnetron sputtering (75 W argon plasma 5.5 × 10⁻³ mbar, room temperate) to promote the growth of NS. Then MoO3 powder was placed in middle of the tubular furnace and heat up to 700 °C to promote the evaporation of MoO3. To growth MoO3 NS, Au coated alumina substrate was placed in temperate zone around 450–550 °C. Pressure was maintained at 10 mbar during the process and 10SSCM of Ar was used as carrier gas to transport MoO3 vapor towards the substrates. The deposition time was 30 min and it was cooled down to room temperature by naturally. In order to investigate the gas sensing performance of the MoO3 materials, contacts and heaters were prepared on top of metal oxide and the back side of the alumina substrate. First TiW adhesion layer was deposited by DC magnetron sputtering (70 W argon plasma, 7SCCm argon flow, 5.5 × 10⁻³ mbar presser in room temperature) then the platinum contacts were deposited on the TiW adhesion layer by using same condition used to for TiW. Platinum heaters were deposited on back side of the alumina. This alumina substrate was mounted on TO packages using electro-soldered gold wires. To investigate the condutrometric response for the gas species, the sensors were placed in homemade test chamber. The total gas flow was maintain at 200SCCM and relative humidity was set to 40%. A fixed voltage (1V) applied to the sensor and conductance of the sensor was measured using dedicated picoammeters and the sensors were tested in the temperature range of 200 °C to 550 °C.
3. Results
3.1. Characterization
MoO3 were successfully grown on Au-catalyzed alumina substrate by thermal evaporation method. The morphology of growth marital was investigated by FE-SEM. MoO3 NS have grown on alumina substrates in flakes-like shape as illustrated in Figure 1a,b. The condensation temperature has a strong influence on the groth of NS. The NS grown in high temperature range Figure 1b were thin and longer compared to NS grown in low temperature range Figure 1a. The SEM images clearly show that the thickness of the flakes is less than 200 nm, and that they grow homogeneously on the alumina substrate.
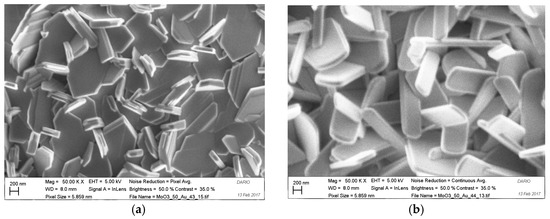
Figure 1.
The SEM image of the MoO3 nano structures at evaporation temperature 700 °C, pressure 10 mbar and 10SCCM Ar flow: (a) At low temperate zone (450 °C–500 °C); (b) At high temperature zone (500 °C–550 °C).
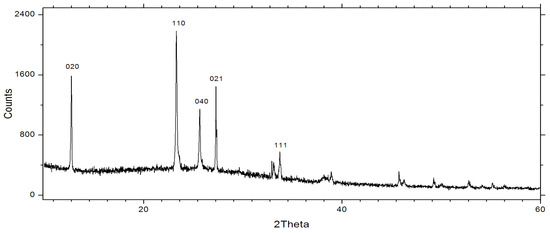
Figure 2.
The XRD spectra of thermally evaporated MoO3.
Figure 3, instead, shows the XRD spectrum of MoO3 NS, conforming the orthorhombic symmetry of crystalline structure. The diffraction peaks 12.77, 25.71 belongs to (020), (040) prove the presencs of lamellar structure of the MoO3. Also other peacks at 23.34, 27.30 and 33.77 are belogs to the (110), (021) and (111) respectivly.
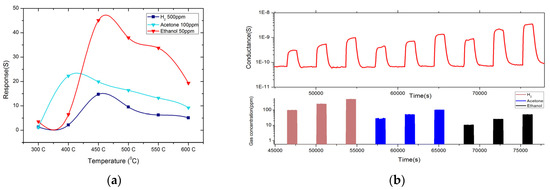
Figure 3.
(a) Dynamic response of MoO3 nanostructures toward H2, Acetone and Ethanol at 450 °C.; (b) Response towards H2, Acetone and Ethanol in different working temperatures. RH = 40%, at 20 °C, with an applied voltage equal to 1 V.
3.2. Gas Sensing
The gas sensing properties of MoO3 were also investigated, and Figure 3a reports the dynamic responce performed on the device. We can observe an increase of the electrical conductance in presence of Acetone, Ethanol and H2, while sensors recover the baseline when exposed to synthetic air. Figure 3b shows the temperature dependence of the MoO3 NS and MoO3 NS gives high response in temperature range between 400 °C–550 °C. Ethanol and Acetone show a high response at two different working temperatures. The optimal operation temperature is 450 °C for 50 ppm of Ethanol and 500 ppm of H2. This flakes like structure shows high response ∆G/G = 45.05 at 450 °C towards 50 ppm of Ethanol also response 14.71 and 22.26 for 500 ppm of H2 and 100 ppm of Acetone respectively. This MoO3 can be used to detect low concentrations of Ethanol and acetone and the highest response is varying with working temperature for different gases thus this can be used to identify the different gas species Figure 4 demonstrates the calibration curves and it’s in line with power low. The detection limit for ethanol and Acetone in ppb level, but detection limit for H2 is high compare to the other gas. All measurements were performed at a relative humidity of 40% at 20 °C, with an applied voltage equal to 1 V.
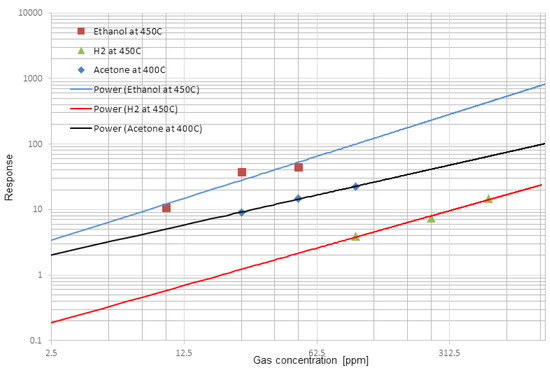
Figure 4.
Response towards H2, Acetone and Ethanol in different working temperatures. RH = 40% at 20 °C with applied voltage equal to 1 V.
4. Conclusions
In this study we successfully synthesed MoO3 by thermal evaporation method and measured the sensing behavior towards different chemical gases. This evaporation condensation method has potential to produce MoO3 NS in large quantities with tunable MoO3 NS. Dimensions can be changed mainly according to the condensation temperature and deposition time. XRD conform the orthorhombic symmetry of crystalline structure and SEM shows the morphological structure of the MoO3. This NS give high response to Ethanol and H2 in 450 °C and for Acetone at 400 °C. The detection limit for Acetone and Ethanol is lower than 1 ppm.
Acknowledgments
The work has been supported by the European Community’s 7th Framework Programme, under the grant agreement No. 611887 “MSP: Multi Sensor Platform for Smart Building Management” and Erasmus Mundus Project, Action 2, Strand 1 funded by the European Audiovisual and Culture Executive Agency of the European Commission.
Conflicts of Interest
The authors declare no conflict of interest.
References
- Rahmani, M.B.; Keshmiri, S.H; Yu, J.; Al Mashat, L. Gas sensing properties of thermally evaporated lamellar MoO3. Sens. Actuators B Chem. 2010, 145, 13–19. [Google Scholar] [CrossRef]
- Comini, E.; Youbao, L.; Sberveglieri, G. Gas sensing properties of MoO3 nanorods to CO and CH3OH. Chem. Phys. Lett. 2005, 407, 368–371. [Google Scholar] [CrossRef]
Publisher’s Note: MDPI stays neutral with regard to jurisdictional claims in published maps and institutional affiliations. |
© 2017 by the authors. Licensee MDPI, Basel, Switzerland. This article is an open access article distributed under the terms and conditions of the Creative Commons Attribution (CC BY) license (https://creativecommons.org/licenses/by/4.0/).