Proceeding Paper

Surface-Enhanced Raman Spectroscopy Study of Commercial Fruit Juices †

1
CNR-SPIN, Comprensorio Olivetti, 80078 Pozzuoli, Naples, Italy
2
Dipartimento di Medicina Sperimentale, Seconda Università di Napoli, 80138 Naples, Italy
3
Institute of Genetics and Biophysics—ABT, 80131 Naples, Italy
4
Dipartimento di Scienze Ecologiche e Biologiche, Università della Tuscia, 01100 Viterbo, Italy
*
Author to whom correspondence should be addressed.
Presented at the 3rd International Electronic Conference on Sensors and Applications, 15–30 November 2016; Available online: https://sciforum.net/conference/ecsa-3.
Proceedings 2017, 1(2), 25; https://doi.org/10.3390/ecsa-3-C003
Published: 14 November 2016

Abstract

:
Surface-enhanced Raman Spectroscopy (SERS) is a vibrational spectroscopy holding potentials for a rapid evaluation of quality and composition of food industry products without any need of sample preparation. Among many nanomaterials, gold nanoparticles (GNPs) and their colloidal dispersions have attracted great interest for SERS applications due to their unique properties of small size, large surface area to volume ratio, high reactivity to the living cells, stability over high temperatures. In this frame, a low-cost substrate, based on home-made 30-nm sized GNPs, has been designed and used for the investigation of commercial fruit juices and pulp. Thanks to the use of a wavelet denoising procedure and background subtraction spectra with clear features have been obtained. Their analysis has enabled to evidence the presence of components of great importance for the quality evaluation of the products, such as fructose and pectin. The overall inspection of the results has confirmed the potentialities of SERS in food industry.

1. Introduction

Over the past few decades Surface Enhanced Raman Spectroscopy (SERS) has been fruitfully used for investigating materials with low Raman signal and for the study and the detection of various molecules down to the single-molecule level [1,2]. This technique combines the advantages of the Raman effect such as the high specificity (ability to identify a given molecular species in the presence of many other chemicals) with the use of nanosized metallic materials enabling Raman signal enhancement of many orders of magnitude occurring when molecules are in the vicinity of metal nanosized substrates. Among many nanomaterials, gold nanoparticles (GNPs) and their colloidal dispersions have attracted great interest for SERS applications due to their unique properties of small size, large surface area to volume ratio, high reactivity to the living cells, stability over high temperatures. These properties along with the evidence that GNPs are amenable to the attachment of biomolecules or ligands through well-known thiol and amino chemistry or simply by electrostatic interactions have led to a wealth of nanoparticle-based bio-devices or sensors for many applications. Because of its potentials, the use of SERS is growing in popularity also in the field of food production and food-industry products quality control [3,4,5,6]. In addition, SERS holds potentials for the realization of methods or devices enabling a simple, low-cost and low time-consuming evaluation of the content of commercial food industry products such as juices, soft drinks and so on.
In the present work, we designed and used an approach enabling the evaluation of the content of commercial fruit juices and pulp featuring a low Raman signal. It is based on a home-made, low-cost SERS substrate and it is well-suited to be employed for the eventual on-line product evaluation. In particular, the analysis of the clear SERS spectra of pulp and juice has allowed the detection of fructose and pectine in both the samples, confirming the potentialities of SERS in food industry.

2. Experiments

2.1. Materials

Hydrogen tetrachloroaurate (HAuCl4), and trisodium citrate were purchased from Sigma-Aldrich (Sigma-Aldrich Co., St. Louis, MO, USA). All chemicals were used as received.
Commercial clear apple juice from biological cultivation (produced by LM, Predaia, Trento, Italy) and commercial smashed pulp of apple and pear (composition: of 50% of apple and 50% of pear; produced by Natura nuova, Ravenna, Italy) were used without further treatment.

2.2. Nanoparticle Preparation and Characterization

GNP preparations were obtained by conventional citrate reduction method [7]. A 0.01% HAuCl4 solution was reduced by 1% sodium citrate with vigorous stirring at near boiling temperature. GNP size was controlled by adjusting the amounts of sodium citrate. Two solutions of GNPs with an expected diameter in the 20–30 nm were used for measurements (named A and B GNP preparation, respectively).
The characteristics of these preparations in terms of particle size, preparation stability and Raman signal were investigated by means of Absorption spectroscopy, Transmission Electron Microscope (TEM), and Dynamic Light Scattering (DLS). Raman signal due to GNP preparations was also evaluated (see Section 2.4 for details about the used set-up and protocols).
Absorption spectra of the prepared GNP preparations were recorded by UV-Vis spectroscopy at a resolution of 1.0 nm on Perkin Elmer LS25 (Perkin Elmer, Waltham, MA, USA). All the spectra were collected over the range of 200–800 nm with 2.0 nm resolution. TEM images were obtained by a JEOL JEM-1011 TEM (JEOL, Tokyo, Japan) equipped with a thermionic tungsten filament and operated at an acceleration voltage of 100 kV. Images were taken using a Morada cooled slow-scan CCD camera (3783X2672 pixels, Morada, Munster, Germany) and micrographs were taken with iTEM software (Olympus Soft Imaging System GmbH, Munster, Germany). Particle sizing by DLS was performed using a Zetasizer Nano Series and DLS system (Malvern Instruments Ltd., Malvern, UK).

2.3. Sample Preparation

A small drop of colloidal solution of GNP was placed on a microscope glass slide and left to dry at room temperature. After about one hour the solvent evaporated leaving the GNPs dispersed on the glass surface into a limited area. A small amount of the fluid to be analysed (clear apple juice or smashed apple/pear pulp) was dropped on this area and right after the micro-Raman spectroscopy measurements were performed.

2.4. Micro-Raman Spectroscopy Measurements

The micro-Raman spectroscopy (µ-RS) measurements were performed by using a Jobin-Yvon system from Horiba ISA, with a TriAx 180 monochromator, equipped with a liquid nitrogen cooled charge-coupled detector and a 1800 grooves/mm grating (final spectral resolution: 4 cm−1). The spectra were recorded in air at room temperature using a 17 mW He-Ne laser source (wavelength 632.8 nm). Accumulation times in the range of 30–300 s were used. The laser light was focused to a 2 µm spot size on the sample through an Olympus microscope with 50× optical objective.

2.5. Data Analysis

An automatic numerical treatment based on wavelet algorithm was used to increase the readability of the small Raman features [8]. Briefly, each spectrum was decomposed in terms of the sum of different wavenumber scaled elementary functions (named wavelets) and a hierarchical representation of the spectrum was thus obtained. Starting from the decomposed signal the spectrum was reconstructed removing low and high frequency components due to background and non-correlated noise respectively. MATLAB 6.5 program (by Math Works Inc., Natick, MA USA) was used for wavelet analysis (functions bior6.8). The decomposition of the signal was performed up to the level n = 8; the signal was reconstructed using components from 5th to 8th level. The Raman spectra were then analyzed in terms of a sum of Lorentzian functions by using a best-fit peak-fitting routine of GRAMS/AI (2001, Thermo Fisher Scientific, Waltham, MA, USA) program. The main peaks of the spectrum were manually selected in order to define the starting conditions for the best-fit procedure. The best fit was then performed to determine convolution peaks with optimized intensity, position and width.

3. Results

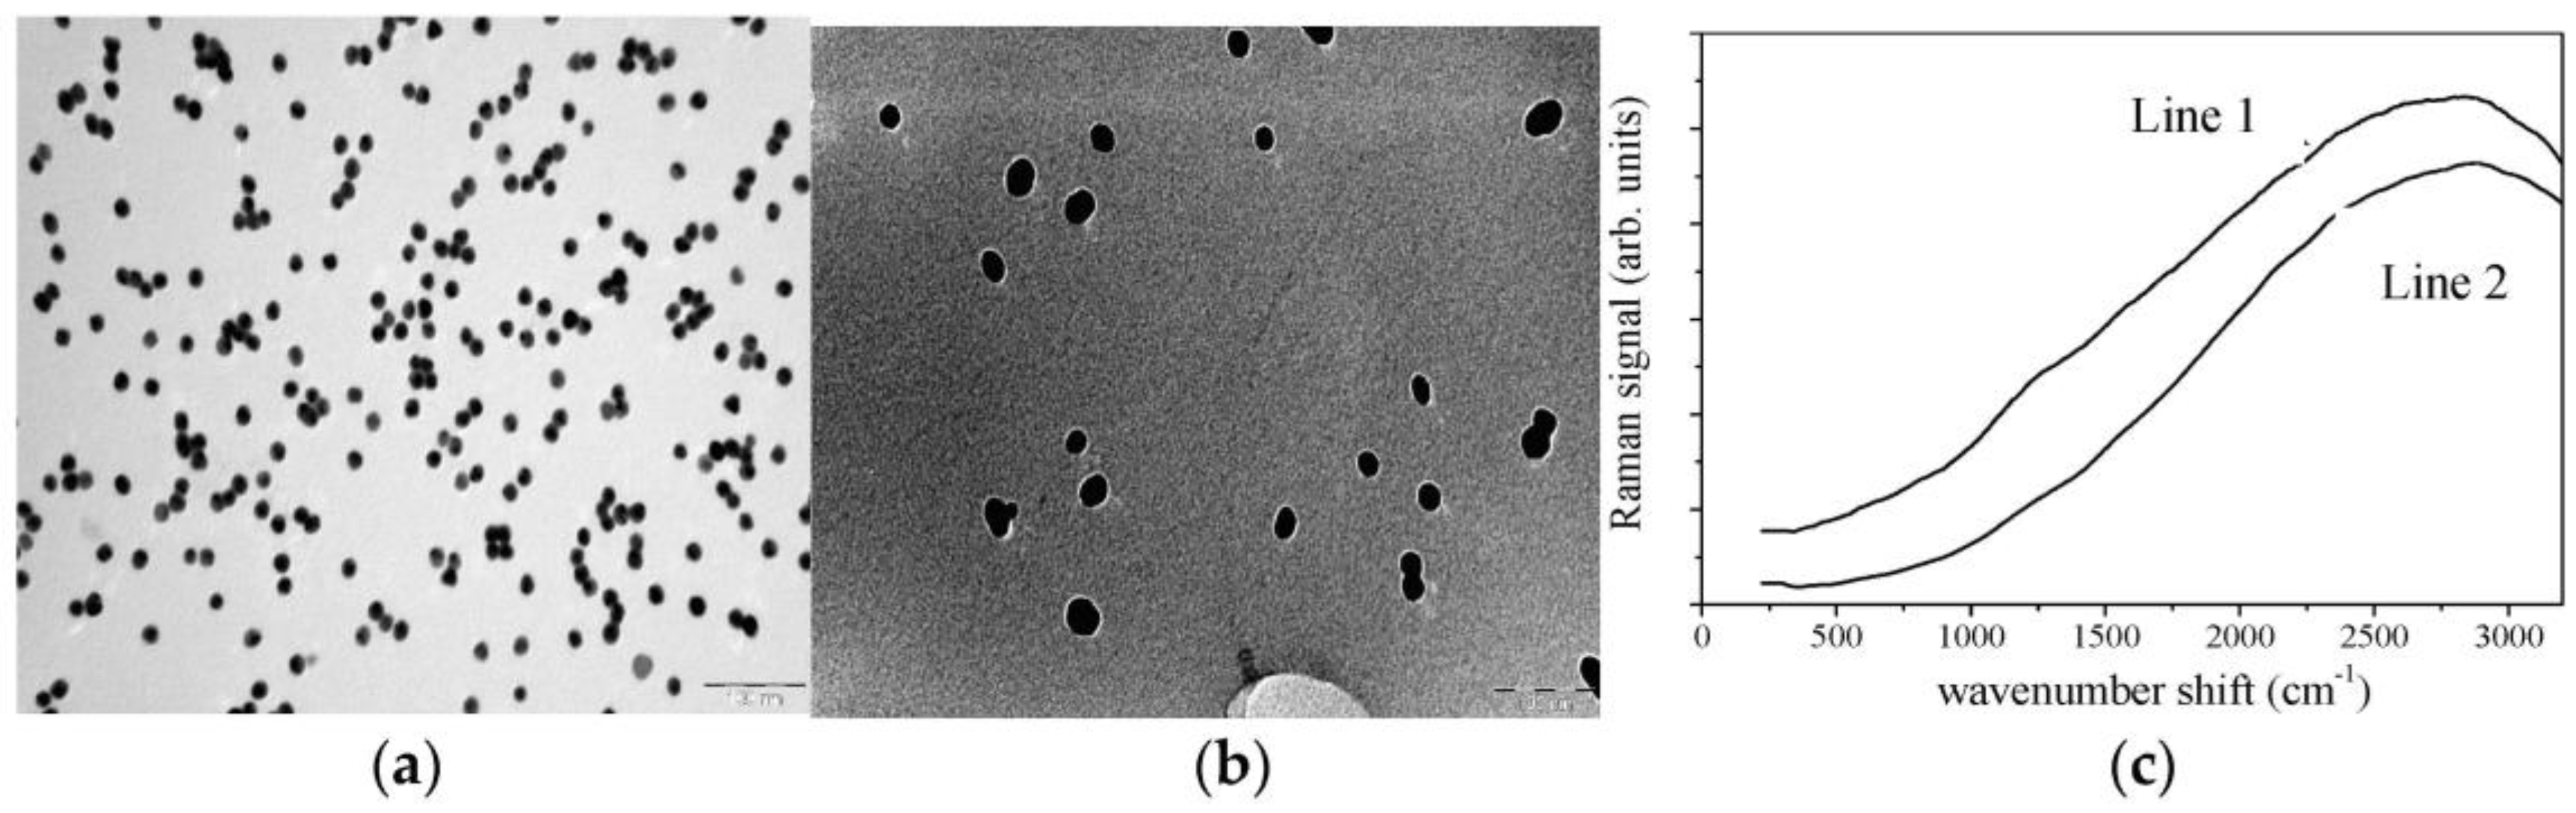
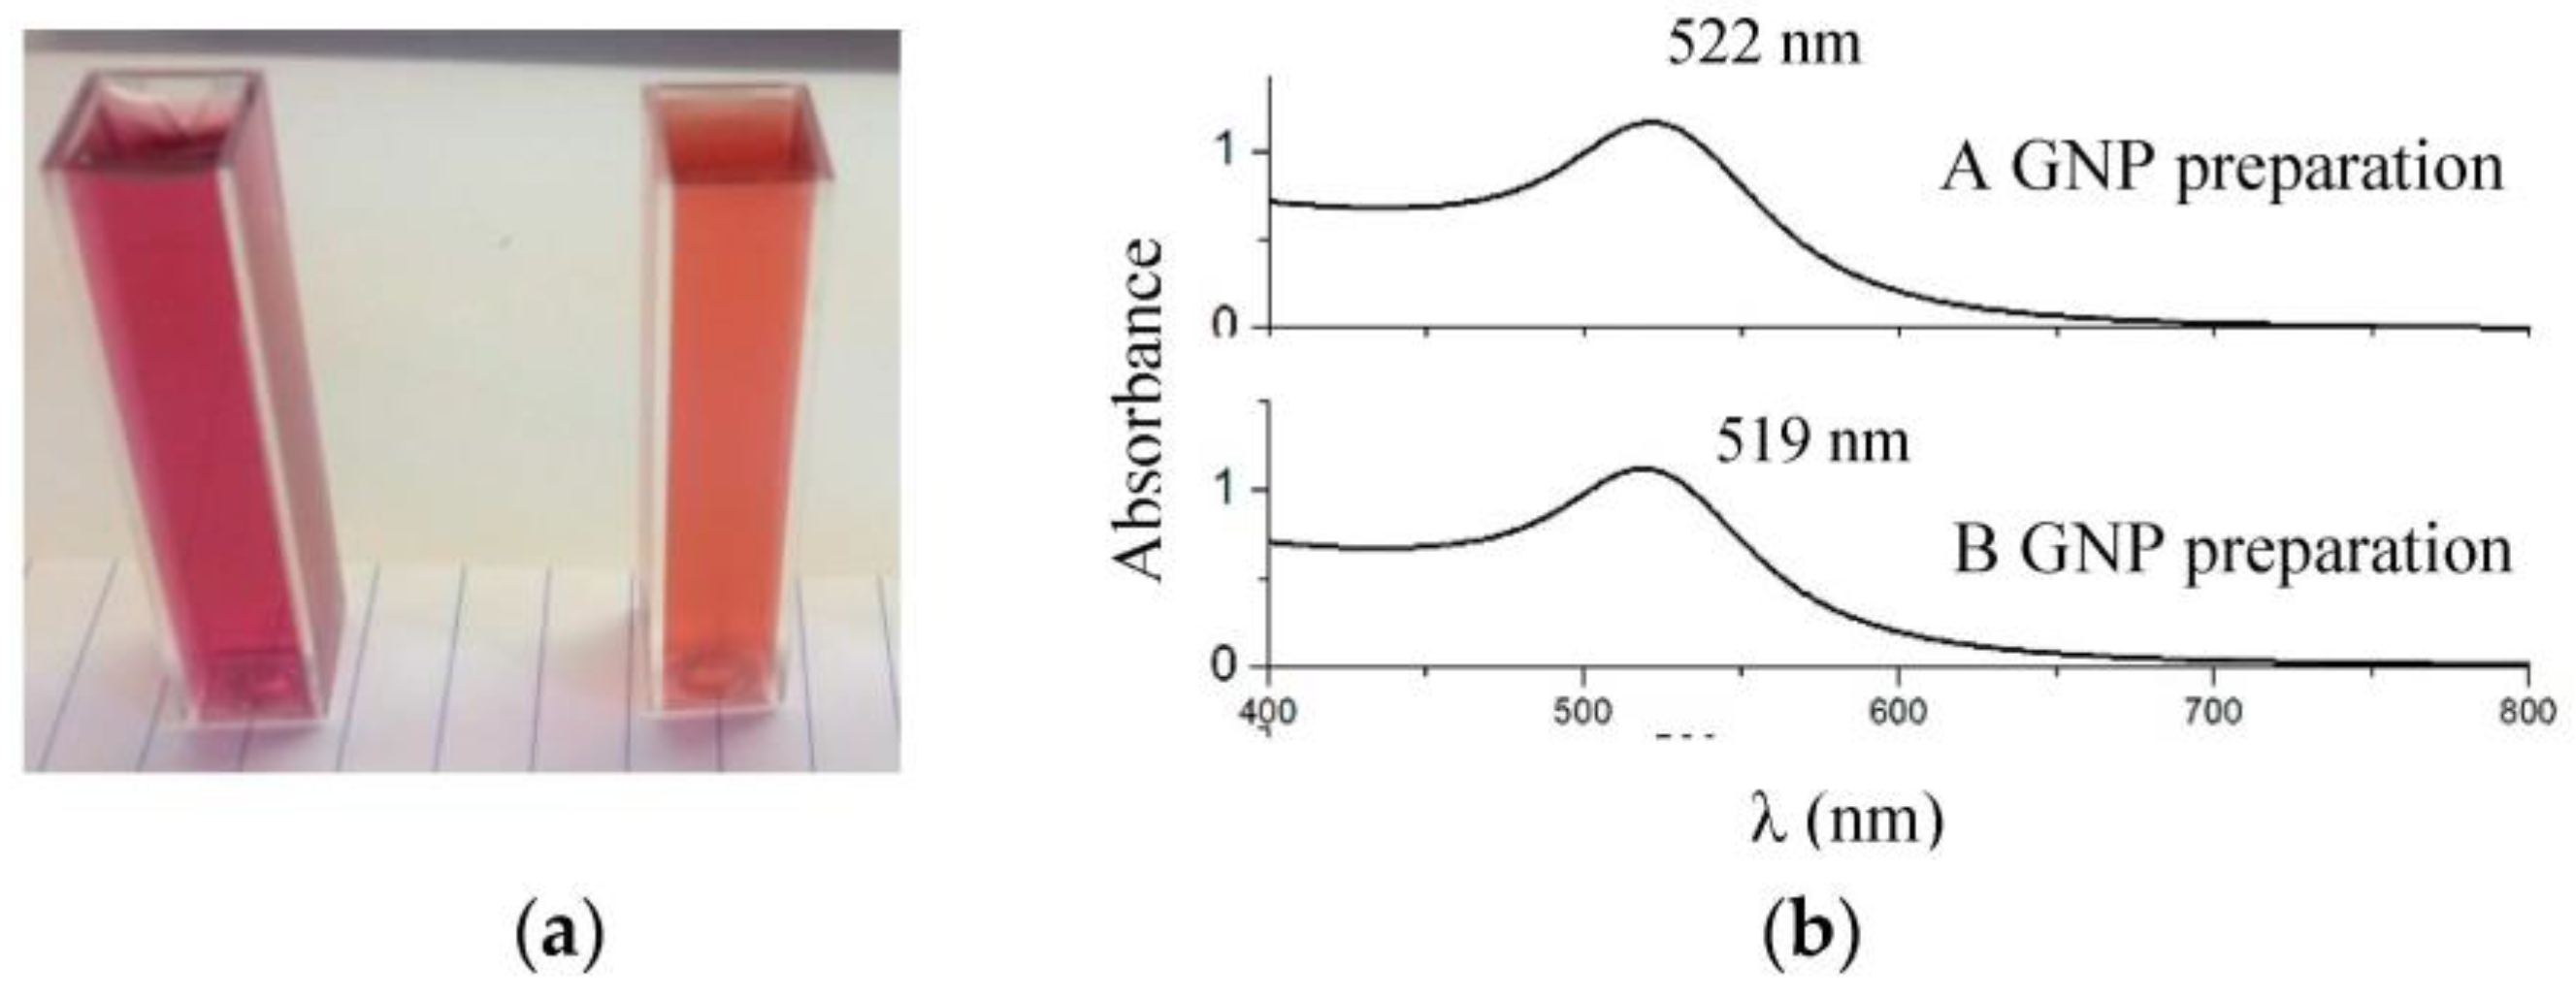
3.1. Nanoparticle Characterization and Substrate Selection

The GNP preparations feature different optical absorption spectra, as expected, that result in a difference in the perceived color of the solutions themselves (see Figure 1a, where the image of the cuvettes filled with A and B preparations is shown). The absorption spectra of the two preparations (see Figure 1b) are characterized by the presence of a single broad peak in the 400–800 nm range [9].
It represents the surface plasmon resonance (SPR) absorption band of the metal nanoparticles which can provide valuable information on the size, structure and aggregation of GNPs. Accordingly, from the position of plasmon peak (reported in Figure 1b for each spectrum) the mean diameter of the GNPs has been estimated [9], resulting to be 20 ± 2 and 30 ± 4 nm for A and B preparation, respectively. The absorption spectra remain unchanged for long time suggesting that the preparation is stable for more than 6 months.
Representative TEM images, reported in Figure 2a,b, and their analysis confirmed the spherical geometry of GNPs and the size obtained by studying SPR absorption even if a bigger dispersion is suggested. TEM results are in agreement with those from DLS that have provided a mean diameter of 18 ± 10 and 27 ± 7 nm for GNPs of A and B preparation, respectively.
Raman spectra of the dried A and B preparations are shown in Figure 2c for the 200–3200 cm−1 spectral range. As expected an unfeatured signal with a broad peak located at around 2800 cm−1 is observed for both the samples. Mainly, no features due to the GNPs are present in the 200–1800 cm−1 range that is the region of interest for the components of interest, since the main components of juice and pulp have clear Raman peaks in this region (see below).
The as-obtained µ-RS spectra of clear apple juice for juice drop on bare glass, juice drop on A-preparation based substrate and juice drop on B-preparation based substrate are shown in Figure 3a for the 700–1800 cm−1 range. All the spectra show a large unfeatured background signal. In the spectra from juice drop on B preparation clear peaks superimposed on this background are observed. This effect is more evident after the background signal subtraction. In fact, inspecting the spectra after-treatment (see Figure 3b) it comes out that clear peaks are evident only in the spectrum of juice drop on B preparation-based sample. This suggests that a higher enhancement is obtained when bigger GNPs are used as base layer; accordingly, B preparation based substrate (BGNPSub) was selected and used for investigating in details the samples of interest.

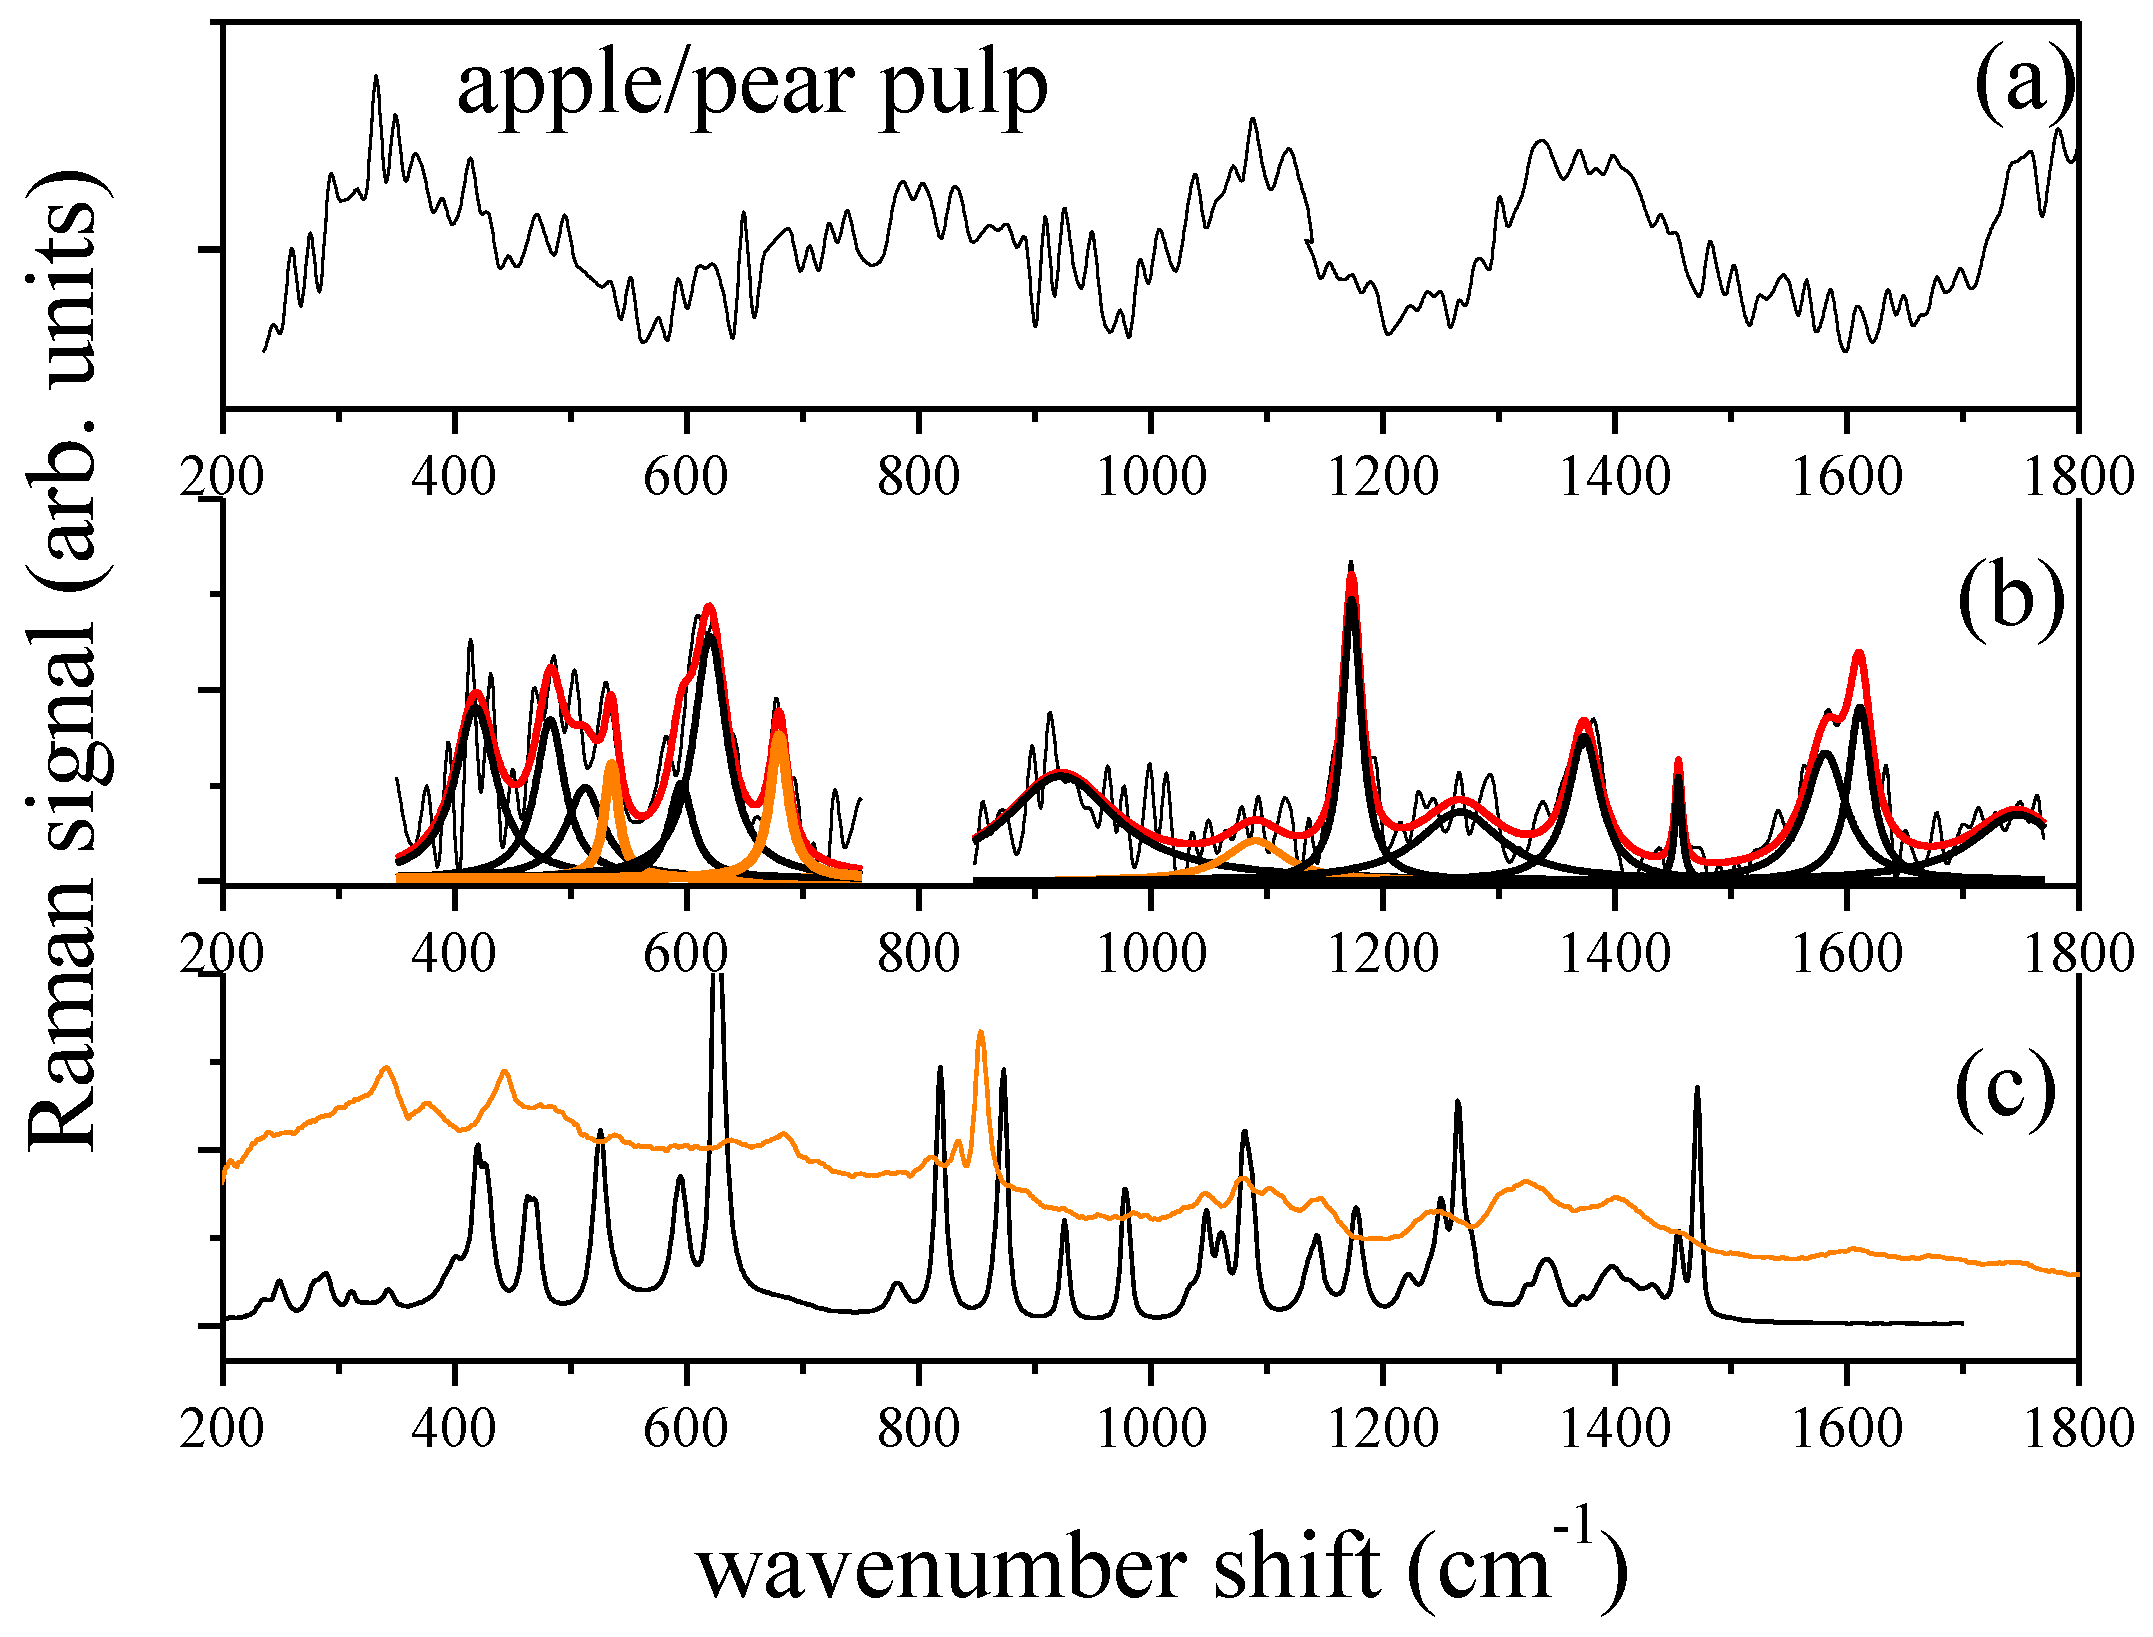
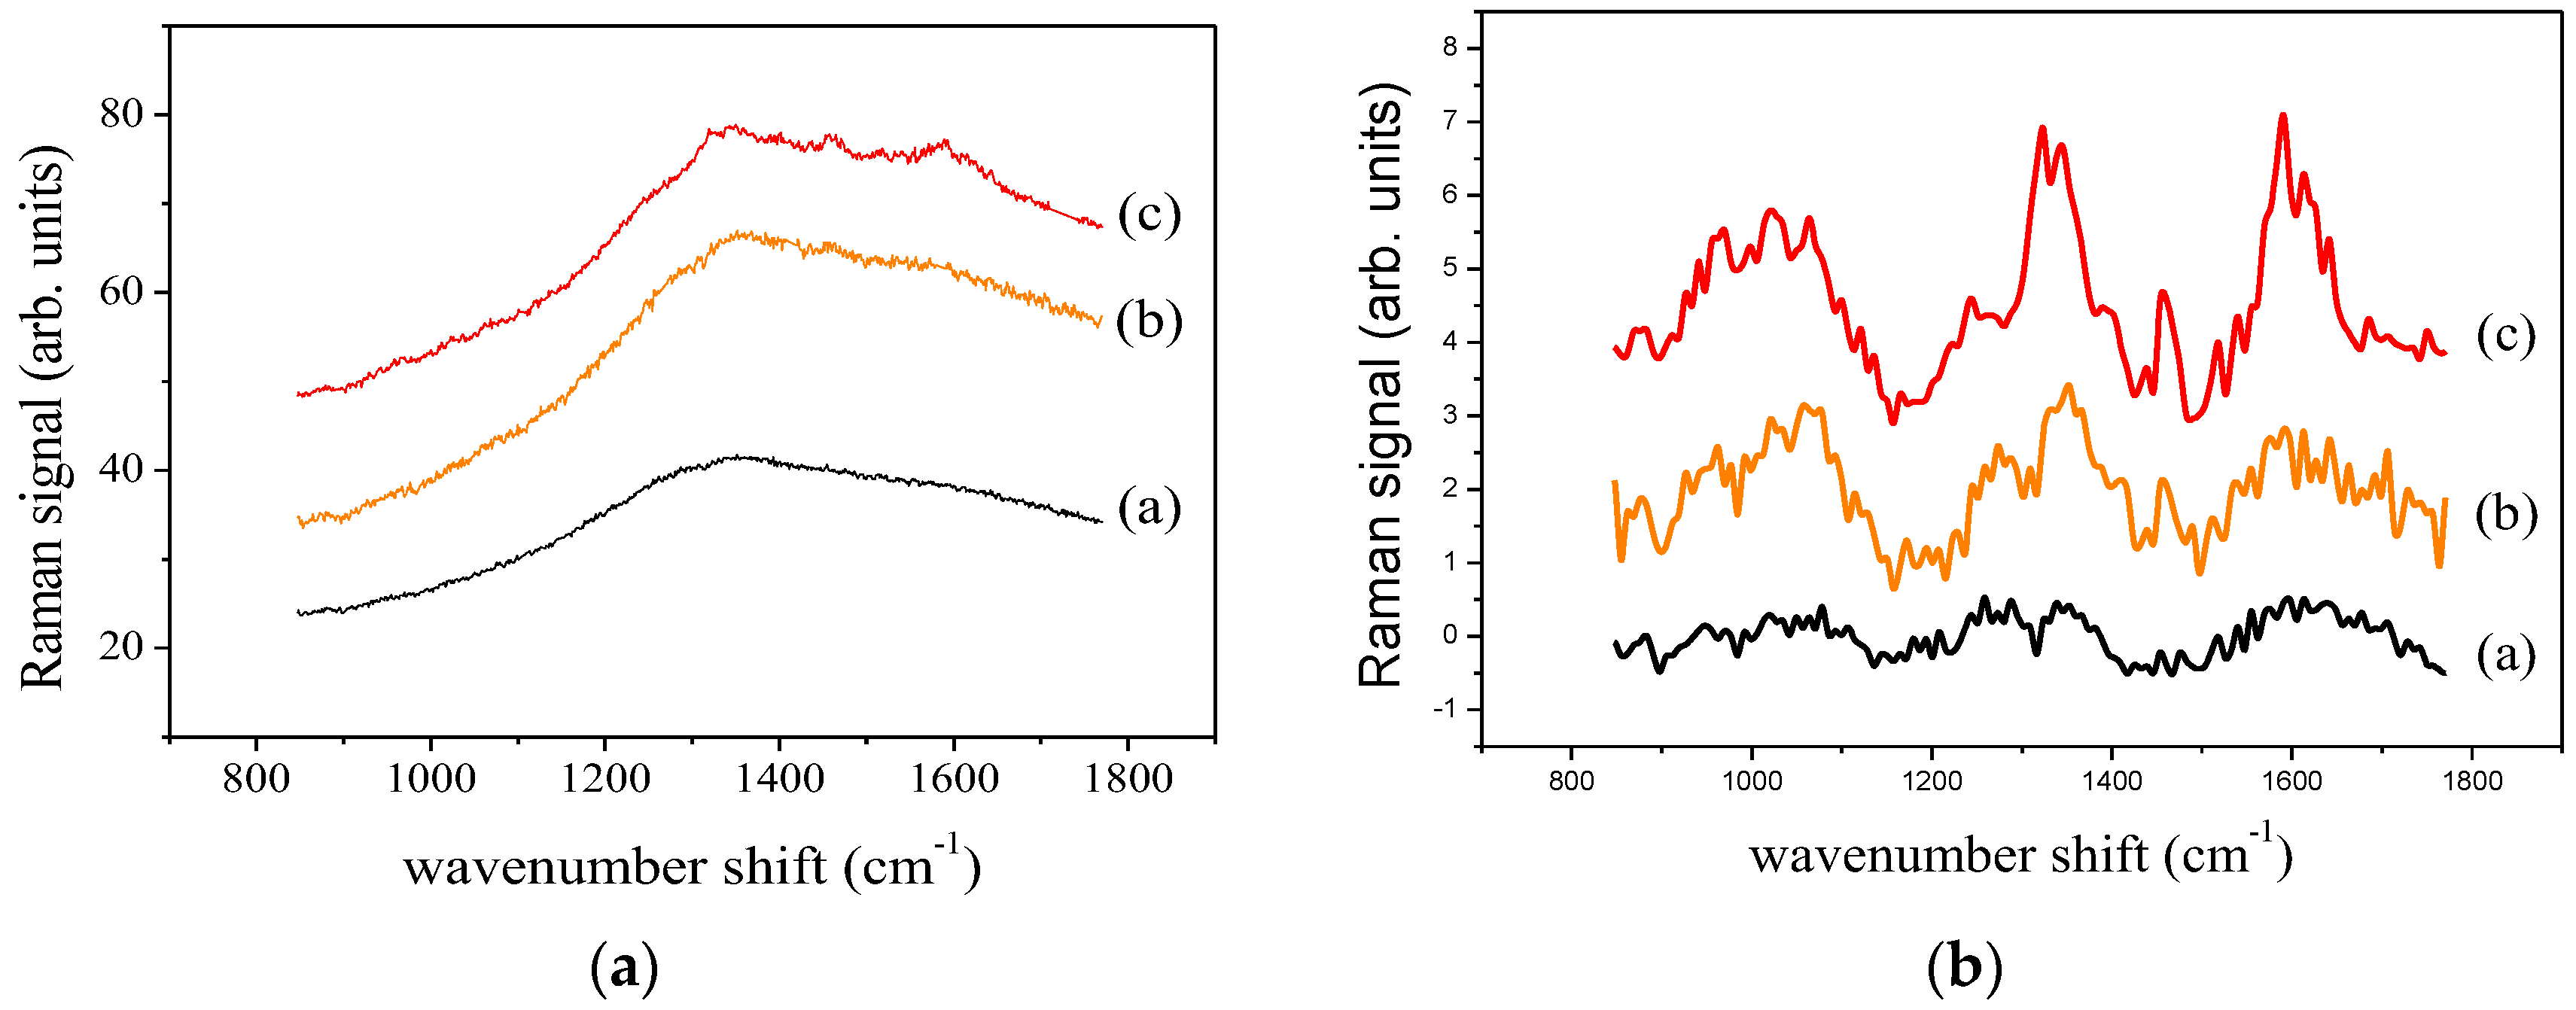
3.2. Raman and SERS Measurements

In Figure 4a the Raman spectrum of apple juice (from drop on bare glass) as obtained after the subtraction of the background signal is shown for the 200–1800 cm−1 wavenumber range. In Figure 4b the treated spectrum in the 300–750 cm−1 and 850–1750 cm−1 ranges is reported along with the results of the described deconvolution procedure in terms of Lorentzian curves (red line). Regarding the 300–750 cm−1 range, 7 Lorentzian modes are outlined and can be reasonably assigned to modes of fructose and pectin [3]. In fact, the five peaks located at the 417, 475, 512, 591, 624 cm−1 that can be assigned to fructose [10] have corresponding peaks in the spectrum of amorphous fructose, shown in Figure 4c (black line) for comparison [11]. The two peaks observed at 539 and 679 cm−1 (orange Lorentzian curves in Figure 4) can be assigned to pectin [12] and indicate a not complete depectination of the juice. In fact, similar features can be observed in the typical Raman spectrum of pectin (amidate lime/lemon pectin) that is also reported in Figure 4c as orange line [11].
In the 850–1700 cm−1 range 16 modes are outlined by the deconvolution procedure. As before, the majority finds a good correspondence with peaks of fructose and pectin (see reference spectra shown in Figure 4c). Three main broad modes are observed at about 1004, 1330 and 1590 cm−1, that can be tentatively assigned to methyl component rocking modes, typically present in protein and carotene, CH bending of pectin and contribution from CN stretching modes of pectin, respectively.
The spectra of the smashed apple/pear pulp after the analysis procedure is completed are reported in Figure 5 for the bare pulp (Figure 5a) and for the pulp on the BGNPSub (Figure 5b). The reference spectra of fructose and pectin (Figure 5c) are also shown for comparison. Also in this case, the Raman signal detected from the bare pulp is very low and no clear Raman peak is observed. On the contrary, when the pulp is dropped on the GNP based substrate a spectrum resembling the one of the apple juice is detected. The spectrum in Figure 5b has been deconvoluted in terms of Lorentzian functions; the resulting curves are displayed in the figure (black peaks are assigned to fructose and orange peaks to pectin—see discussion below). Similarly to what found for apple juice, in the 350–750 cm−1 range the fit procedure allows to determine five main peaks that can be assigned to fructose (they are located at 421, 464, 512, 591, 624 cm−1) [10] and two (those at 539 and 679 cm−1, orange peaks in Figure 5b) to pectin thus revealing the pectin content. Their intensity is a slight larger than that found in clear apple juice, as expected in an untreated fruit pulp. The contribution of pectin to the spectrum can be envisaged by the comparison of the spectrum with the reference signal of Figure 5c.

4. Conclusions

The reported results suggest that the realized home-made GNP based substrate allows to obtain clear Raman spectra of commercial apple juice and pear/apple smashed pulp, that feature a low Raman signal. By exploiting the SERS effect, the proposed approach allows us the investigation of these low Raman signal samples with the use of low-cost substrates. Good SERS spectra of commercial apple juices and pear/apple pulp are obtained allowing to evidence the presence of fructose and pectin in the untreated samples. The overall inspection of the results has confirmed the potentialities of SERS in food industry especially because of the use of home-made substrates well-suited to be employed for the eventual on-line product evaluation.

Author Contributions

C.C., M.P., M.L. and I.D. conceived and designed the experiments; C.C., M.P. and R.T. performed the experiments; C.C. and I.D. analyzed the data; C.C., M.L. and I.D. wrote the paper.

Conflicts of Interest

The authors declare no conflict of interest.

References

  1. Bonifacio, A.; Cervo, S.; Sergo, V. Label-free surface-enhanced Raman spectroscopy of biofluids: Fundamental aspects and diagnostic applications. Anal. Bioanal. Chem. 2015, 407, 8265–8277. [Google Scholar] [CrossRef] [PubMed]
  2. Delfino, I.; Bizzarri, A.R.; Cannistraro, S. Single Molecule detection of Yeast Cytochrome c by Surface-Enhanced Raman Spectroscopy. Biophys. Chem. 2005, 113, 41–51. [Google Scholar] [CrossRef] [PubMed]
  3. Camerlingo, C.; Zenone, F.; Delfino, I.; Diano, N.; Mita, D.G.; Lepore, M. Investigation on clarified fruit juice composition by using visible light micro-Raman spectroscopy. Sensors 2007, 7, 2049–2061. [Google Scholar] [CrossRef] [PubMed]
  4. Delfino, I.; Camerlingo, C.; Portaccio, M.; Della Ventura, B.; Mita, L.; Mita, D.G.; Lepore, M. Visible micro-Raman spectroscopy for determining glucose content in beverage industry. Food Chem. 2011, 127, 735–742. [Google Scholar] [CrossRef] [PubMed]
  5. Craig, A.P.; Franca, A.S.; Irudayaraj, J. Surface-Enhanced Raman Spectroscopy Applied to Food Safety. Annu. Rev. Food Sci. Technol. 2013, 4, 369–380. [Google Scholar] [CrossRef] [PubMed]
  6. Liu, B.; Zhou, P.; Liu, X.; Sun, X.; Li, H.; Lin, M. Detection of pesticides in fruits by Surface-Enhanced Raman Spectroscopy coupled with gold nanostructures. Food Bioprocess Technol. 2013, 6, 710–718. [Google Scholar] [CrossRef]
  7. Frens, G. Particle size and sol stability in metal colloids. Colloid Polym. Sci. 1972, 250, 736–741. [Google Scholar] [CrossRef]
  8. Camerlingo, C.; Zenone, F.; Gaeta, G.M.; Riccio, R.; Lepore, M. Wavelet data processing of micro-Raman spectra of biological samples. Meas. Sci. Technol. 2006, 17, 298–303. [Google Scholar] [CrossRef]
  9. Haiss, W.; Thanh, N.T.K.; Aveyard, J.; Ferni, D.G. Determination of Size and Concentration of Gold Nanoparticles from UV-Vis Spectra. Anal. Chem. 2007, 79, 4215–4221. [Google Scholar] [CrossRef]
  10. De Gelder, J.; de Gussem, K.; Vandenabeele, P.; Moens, L. Reference database of Raman spectra of biological molecules. J. Raman Spectrosc. 2007, 38, 1133–1147. [Google Scholar] [CrossRef]
  11. Raman Spectra of Carbohydrates. Available online: www.models.life.ku.dk/specarb (accessed on 10 October 2016).
  12. Engelsen, S.B.; Noorgard, L. Comparative vibrational spectroscopy for determination of quality parameters in amidated pectins as evaluated by chemometrics. Carbohydr. Polym. 1996, 30, 9–24. [Google Scholar] [CrossRef]
Figure 1. (a) Image of cuvettes containing A (orange solution, right hand size cuvette) and B (red solution, left hand side cuvette) GNP preparations. (b) Absorption spectra of A and B GNP preparations; the position of the maximum of the SPR band is labelled for each spectrum.
Proceedings 01 00025 g001
Figure 2. TEM images of (a) A and (b) B preparation. Scale bar = 100 nm. (c) Raman spectra of bare GNP A (line 1) and B (line 2) preparation. The same acquisition times has been used for all the spectra.
Proceedings 01 00025 g002
Figure 3. Untreated—panel (a)—and treated—panel (b)—Raman spectra of clear apple juice for juice drop on bare glass (line a), juice drop on A-preparation based substrate (line b) juice drop on B-preparation based substrate (line c). For clarity, the spectra were arbitrarily shifted along the y-axis.
Proceedings 01 00025 g003
Figure 4. (a) Raman spectra of apple clear juice on bare glass slide. (b) Raman spectra of apple clear juice dropped on the BGNPSub (black line) along with its deconvolution (red line) in terms of Lorentzian functions. Orange peaks are tentatively assigned to pectin and black peaks to fructose. (c) Raman spectra of amorphous dry fructose (black line) and of amidate lime/lemon pectin (orange line).
Proceedings 01 00025 g004
Figure 5. Raman spectra (a) of apple/pear smashed pulp dropped on the glass slide and of (b) apple/pear smashed pulp dropped on the BGNPSub (black line) along with its deconvolution in terms Lorentzian functions. The resulting convolution curve is shown by red line; orange peaks are tentatively assigned to pectin and black peaks to fructose. (c) Raman spectra of amorphous dry fructose (black line) and of amidate lime/lemon pectin (orange line).
Proceedings 01 00025 g005
Publisher’s Note: MDPI stays neutral with regard to jurisdictional claims in published maps and institutional affiliations.

