1. Introduction
A Water Management System can be made more efficient through the development of an automated system to implement fault detection in the water network (e.g., pipe break, water leakage, abnormal pressure or consumption). When faults are detected early, corrective actions can be taken resulting in more sustainable water management through avoiding the waste of natural resources and consequent economical losses. This paper presents such a system that links together an EPANET hydraulic model and an FDD algorithm. The resultant system and approach is particularly useful when more than one parameter needs to be considered at the same time to determine if an anomaly or fault is in place in a complex water network. For a first evaluation, simulated training scenarios have been developed and tested for Linate airport (Milan, Italy) water network. Initial results are presented in this paper.
2. Hardware and Software
This section presents an overview of one of the Fault Detection and Diagnosis (FDD) systems developed within the Waternomics project. The project has a pilot activity at the Milan area, Linate Airport, which provides an opportune test case as it contains a large water distribution system (WDS).
The model-based FDD approach proposed and implemented is based on the development of a hydraulic model of the water network by using the EPANET software coupled with an anomaly detection algorithm called ADWICE [
1] that is able to get data both from the hydraulic model and the meters installed to find whether there is a leakage in the water network. The principle behind the approach is simple. First, the software model simulates the hydraulic dynamics of the WDS (in terms of pressures at nodes and flows through pipes) in normal conditions (i.e., assuming no leakages are present). Then, the algorithm is used to compare the outputs of the hydraulic model (pressure and flow data) with the real time data gathered from the pressure and flow meters installed in place. From this comparison, the algorithm will point out whether abnormal conditions are occurring and an alert is then sent to the Waternomics information platform [
2]. The methodology proposed is derived from the energy sector and it is composed of 5 phases described in
Figure 1.
In the following section, a virtual test is depicted in order to understand how the method works and what is its potential by describing a case in which the comparison data are not obtained by the measuring instruments but solely from a mathematical simulation of the loss in the water network.
3. Test Set-Up Model-Based FDD
The main components of the proposed approach are the following:
- -
The hydraulic model of the water network
- -
Real data gathered from meters installed in place
- -
The algorithm trained and adapted for the water network
Through the hydraulic model we generate the data needed to train the anomaly detection algorithm. The model helps simulating the operational phases, in terms of flow and pressure, of the drinking water network both assuming leakages are in place or not. The second component is the real data coming from sensors installed in place. In the example that follows, sensor data (with leakages) is simulated as the actual sensor network is still being installed. Having now the necessary data to implement the model based FDD test, the next step is to perform the training of the algorithm. The algorithm ADWICE is a clustering-based anomaly detector that has been developed in a separate European Research Project targeting critical infrastructures protection. Originally designed to detect anomalies on network traffic sessions using features derived from TCP (Transmission Control Protocol) or UDP (User Datagram Protocol) packets, it has been adapted in this paper for the drinking water network at Linate [
3].
The training phase is very important in the process because the algorithm, which uses machine-learning technology, will learn the correct dynamics of the network operations and it builds its internal model of normality. In general, several months of monitoring data would be ideal to train the algorithm. In this paper, we have accelerated this process by producing an accurate model through EPANET. Prior to building the model, we have carried out a categorization of the Linate airport buildings and their frequency of use. By changing the water demand, a reasonable subset of the possible operating conditions that may occur in the water network is created. In this case, the approach results in 8100 scenarios that represent normal operating conditions. In order to test the FDD method without access to real sensor data we also produced scenarios with virtual leakages, which are created ad hoc by using the hydraulic model of the Linate WDS. Having modelled the operational conditions of the water network when a leakage occurs helps us testing the accuracy of the method and to obtain an early feedback to understand whether this component is working effectively or not. Of course, the model might not fully reflect the real operational conditions of the WDS and it might be necessary to adjust it further once evidence of the real operating conditions are available through real sensors installed in place. However, this fully simulated test methodology is still meaningful validating the effectiveness of the proposed model based FDD method.
Ten leakage scenarios have been implemented by introducing emitters coefficients in some nodes of the model and in the following example we focus our attention to and analyze the results of two out of the ten scenarios we believe are more representative. The motivation behind this comes from considering to explore how the ADWICE algorithm performs in two different cases which respectively concern a small area and a large area of the Linate Airport water network.
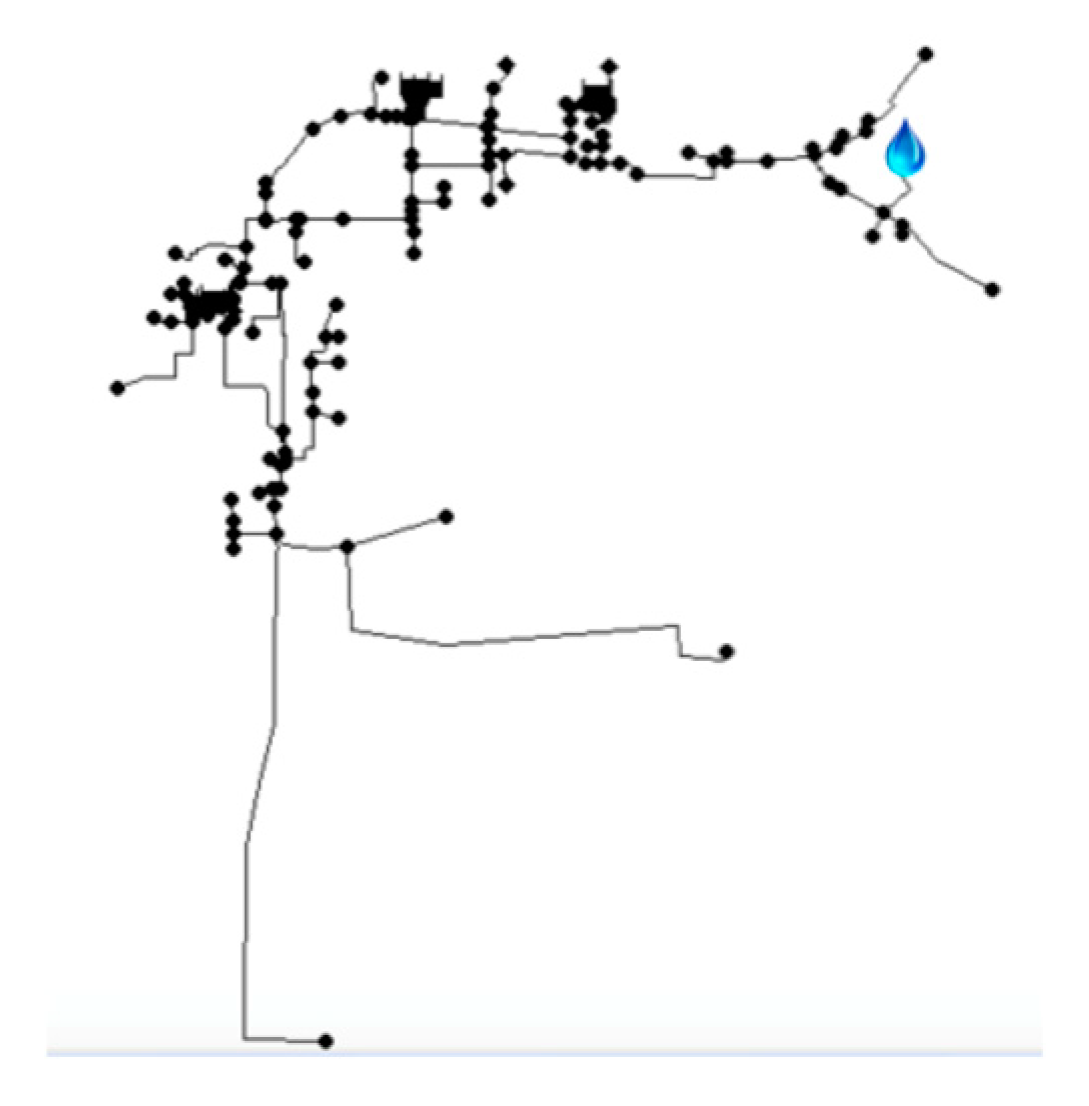
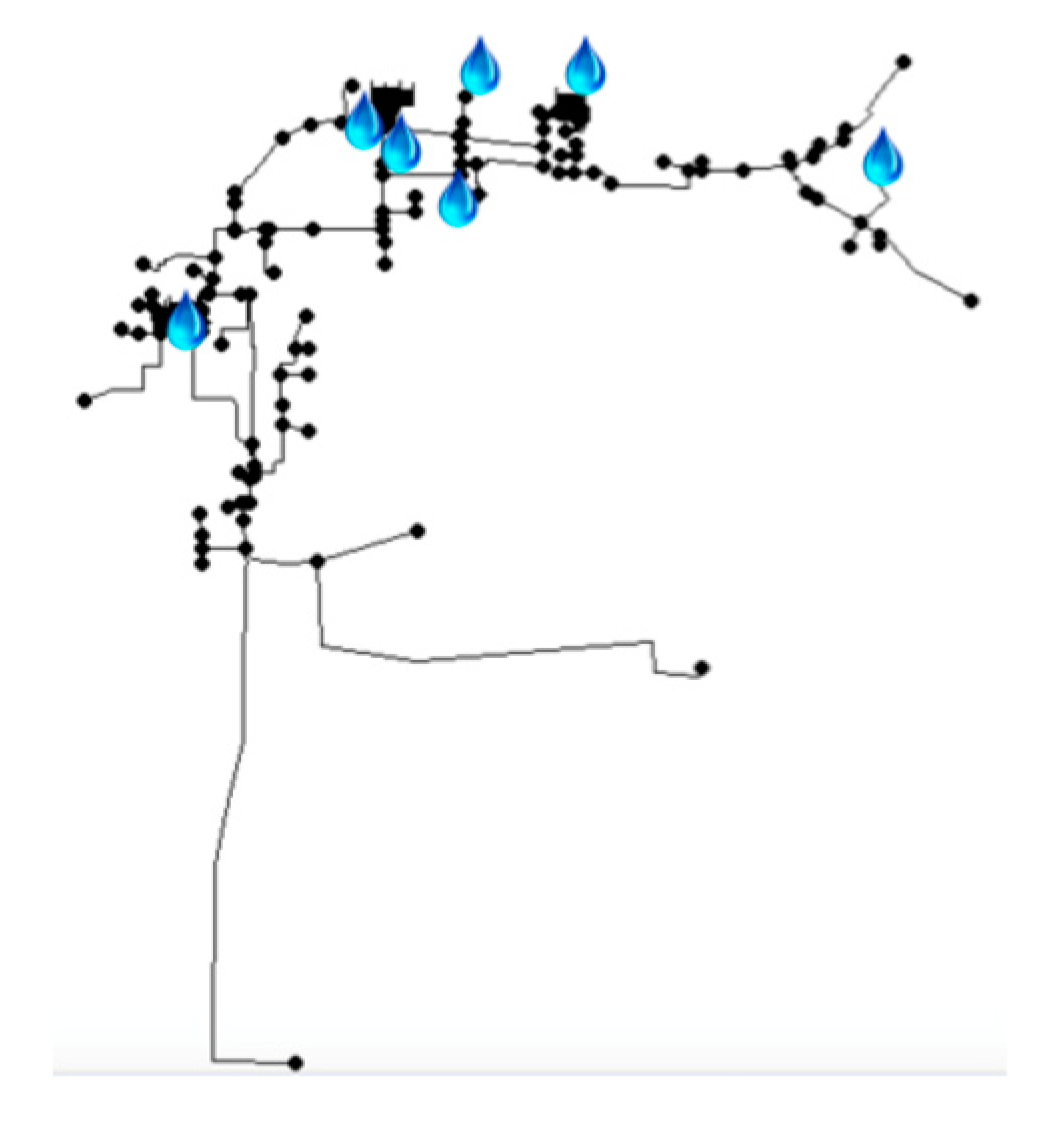
The two leakages scenarios (SP1 and SP8) are depicted in the
Figure 2 and
Figure 3.
Figure 2 introduces a leakage scenario in a single point of the WDS localized in the Control Tower area of the airport, while the
Figure 3 introduces multiple leakages in almost all the airport area. What we expect from the leakage scenario SP1 is that a local drop in the pressure should be registered and it should be more simple for the algorithm to detect the abnormality, while the situation completely change for the leakage scenario SP8 where we expect an overall drop in the pressure values and so it could be more difficult for the algorithm to understand if it is a normal operational scenario or a leakage one. As the dataset is quite large (145 nodes plus 155 links gave us a total of 300 variables to analyze) a feature reduction using Principal Component Analysis (PCA) has been performed and the number of features has been drastically scaled down to 5 features. This is not strange as the variables are highly correlated: a flow in a pipe in dependent on the pressure value. The resulting data is then used first to generate the normality model (ADWICE uses clustering to model normality). The same dataset (and portions of it) has been used to validate the normality model (check whether the algorithm correctly classifies the leakage-free data as normal data issuing no alarms). This has key importance the get it ready for the detection phase where unlabeled data is provided.
4. Results
In order to understand the effectiveness of the model based FDD method, the scenarios have been implemented by using the Linate WDS hydraulic model and the outputs in terms of flow in the pipes and pressure in the nodes have been represented in a user-friendly way using graphic visualization. The objective is to have an overview of the operational condition of the overall network and have knowledge about in which way the flow and pressure in the WDS change as consequence of one or more leakages in the water network.
To implement this a comparison between the different outputs of the scenarios, with and without leakages in the WDS, should be compared together and also the accuracy of the trained ADWICE algorithm should be tested accordingly with the scenarios outputs. For the objective aforementioned in the following the different scenarios outputs are presented taking in consideration the pressure in the junctions.
As we can see in
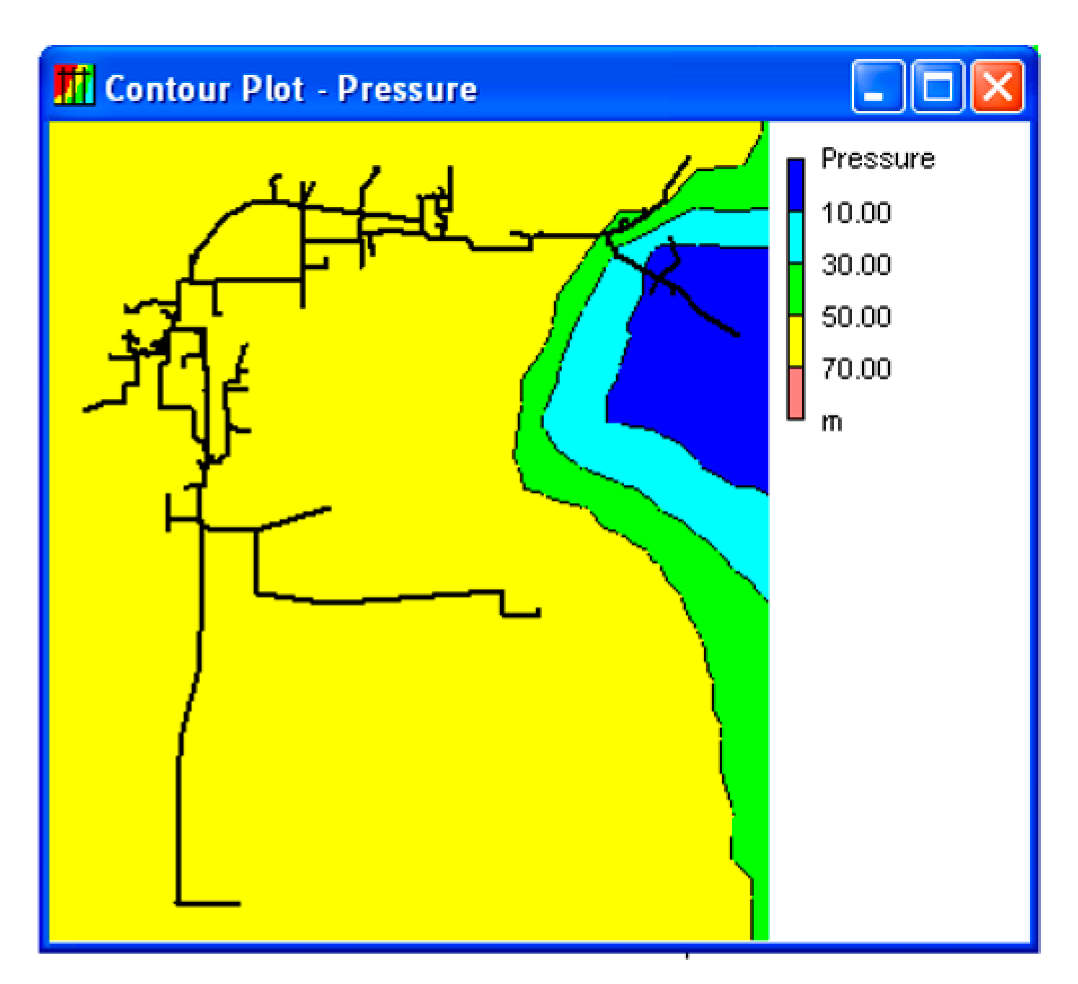
Figure 4, the scenario in normal conditions (i.e., no leakages are introduced) we can observe a gradient of pressure from the left to the right side of the network. In
Figure 5, where the leakage scenario SP1 is simulated, we can see how the pressure drops in a localized area on the right side (which corresponds to the Control Tower area of the Linate airport). The
Figure 6 shows the results, in terms of pressure, when more leakages are in the WDS. The scenario depicted in
Figure 4 has been fed to ADWICE for the construction of the normality model (after pre-processing the data using PCA as described above). The dataset has been studied and the algorithm tuned to find the proper number of clusters, in a similar way of k-means clustering. The leakages scenarios have been implemented and the resulting data fed to ADWICE algorithm to evaluate if the fault detection method works fine by recognizing that the scenario effectively shows anomalies in the usual operational values of functioning of the WDS.
The results are illustrated in the following
Table 1:
5. Discussion
The outputs of the hydraulic model performed both in the scenario without and with leakages in the water network are well summarized in the
Figure 4,
Figure 5 and
Figure 6 above. In detail,
Figure 4 shows the pressure set points in the water network when no leakages are introduced in the water network. As we can see, no one junction has the pressure under the value of 1 bar (10 m H
2O).
Figure 5 shows how the pressure operational values change in the WDS after the introduction of a virtual leakage in the junction number 136 (see
Figure 2). The leakage, as expected, produces a drop in pressure localized to the area where the leakage is established. We can highlight how the pressure in the mainly part of the water network is not affected by the local leakage; indeed the pressure remains almost unchanged. At first sight is clear that in the operational condition depicted in the
Figure 4 an anomaly occurred in a local area of the WDS. The ADWICE test will be successful if the algorithm recognizes the operational conditions of the WDS as an anomaly. The
Figure 6 shows how the pressure operational values change in the WDS after the introduction of many virtual leakages (see
Figure 3). The operational conditions of the WDS change in every single junctions of the water network. At first sight we can say that a global drop in pressure occurred in the WDS, but we don’t know effectively if the operational values depicted in the
Figure 6 are acceptable values or not. Also in this case the ADWICE test will be successful if the algorithm recognizes the operational conditions of the WDS as an anomaly. The results depicted in
Table 1 are as expected. We obtained better accuracy in SP1, where a single leakage is modelled in a localize area, whereas we got worse accuracy with SP8, where multiple leakages are introduced in different points of the network (we can also note that SP8 contains the same leakage as in SP1). Context surrounding the results can be gained as follows. SP1 contains a single leakage that has effects on a localized area. The resulting configuration (low pressure in this area compared to normal scenarios) might never happened in the dataset that has been used to train the algorithm, therefore it raises alarms getting 89% accuracy. In SP8, the higher number of leakages has an impact on a larger portion of the network. As we can see from
Figure 4 there is a global response of the network which sees a drop in pressure, following the same gradient pattern left to right. Although we might imagine multiple leakages being easy to detect, there are more chances that this configuration is similar to one of the normal 8100 scenarios where high water demand causes the pressure to drop in a similar way.
6. Conclusions
Water management systems that include and automate an FDD approach have an increased probability of detecting problems, improving efficiency, and saving time, water, energy and money [
4]. The model-based FDD method proposed in this paper could help in doing this and targets in specific complex water distribution systems [
5]. In this paper, an approach that compares parameters from a water distribution hydraulic model (simulations) to real time data from a sensor network via the use of an FDD algorithm has been presented. After training via the simulation of normal operational scenarios in the WDS, the algorithm was used to compare normal parameters vs. those resultant of two simulated leakage scenarios. The results show that the approach results in good detection rates, low false positives and good accuracies. Improvements in training is an action to conduct moving forward. Once the sensor network is fully installed at Linate, the approach will be tested using real instead of simulated data.


