1. Introduction
The current maritime trade requires ever larger vessels. For these vessels service the ports have to offer large drafts and protection structures have to be ever deeper consolidated, particularly in the case of Spain, a country with few natural harbours, shallow continental shelf, and being most of its ports exterior.
The construction of protection structures in such large drafts (up to 50 m in depth) is extremely expensive, and as at these depths usually the waves do not break, the most common type is the vertical dock, taking into consideration saving costs and environmental impact. These docks are vertical structures that are built on a rubble mound. The vertical part is usually anchored sections that can be placed on a support or regularization structure and depend on their mass and their geometric characteristics to withstand a certain maritime climate [
1].
One of the main problems of vertical docks design is the identification and quantification of the effects caused by pressures of waves on the stability of the resistant element and its rheology [
2].
These pressures, in form of impacts on the wall of the section that they will have to endure, will condition the design of the dock and its subsequent behaviour. From this point of view, and considering the randomness of certain breaking waves and its dependence on the period and height of wave, it is very important to estimate the structural response of the dock against this phenomena. There are a lot of researches dedicated to this theme [
3], however most of them are theoretical studies and simulations.
The aim of this research is to develop a measurement system to study the pressure laws acting on vertical dock and to optimize their design and sizing. In particular, it aims to explain hydrodynamic phenomena observed in real instrumentation that cannot be explained by current theories. To this end, the research is based on the analysis of data collected by the system of Botafoc (Ibiza, Spain) dock since 2003. The analysis of the data leads to outstanding results concerning the shape of the distributions of pressures, the influence of the wave period on them, and the importance of flows induced by waves through the bedding layer.
2. Experimental Part
Developed measuring system is placed in one of the vertical section of the dock and is used to check the safety factors against overturning and sliding of the dock, and in a second stage, it will allow to develop theories that link the forces acting on the dike with the actual movements of the section where the sensors are located.
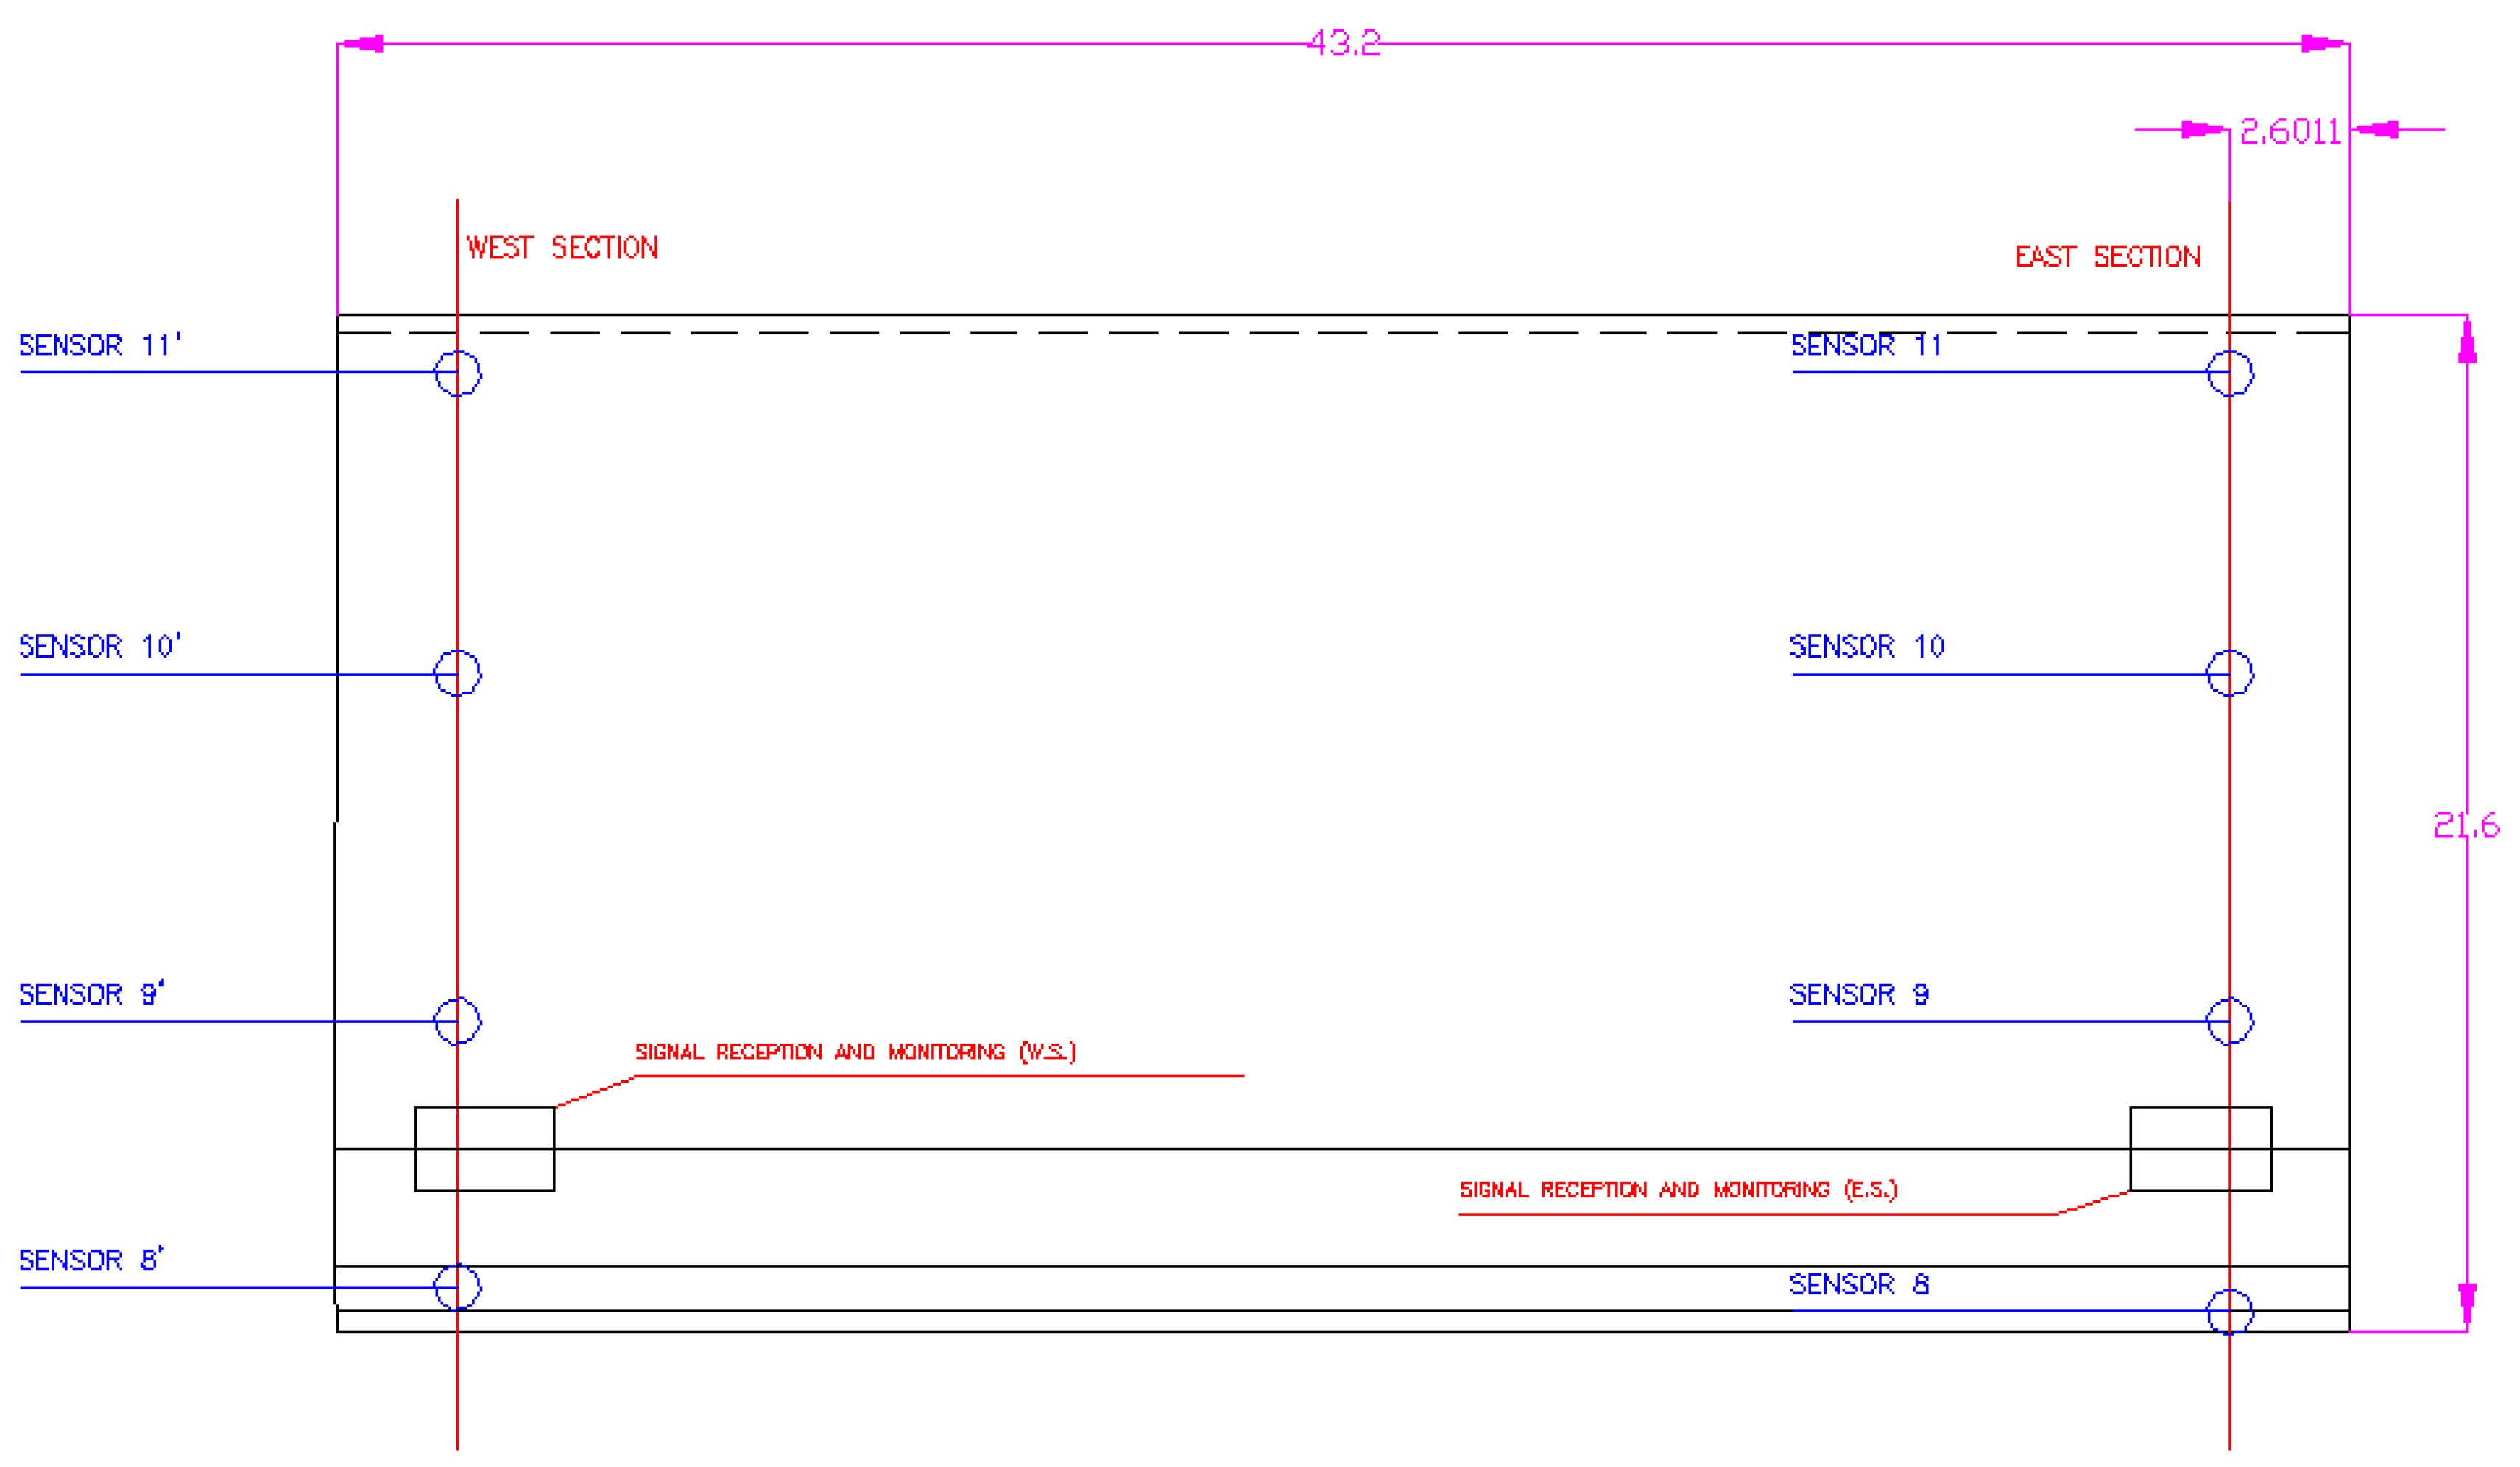
Our system is capable to measure simultaneously pressures in three parameters of the section in contact with water, to not separate the static part from the dynamic part on the laws of measured pressures and movements, in order to relate these data and dispense in the future with the pressure data. Different sensors are placed in the section of the dock as shown in
Figure 1.
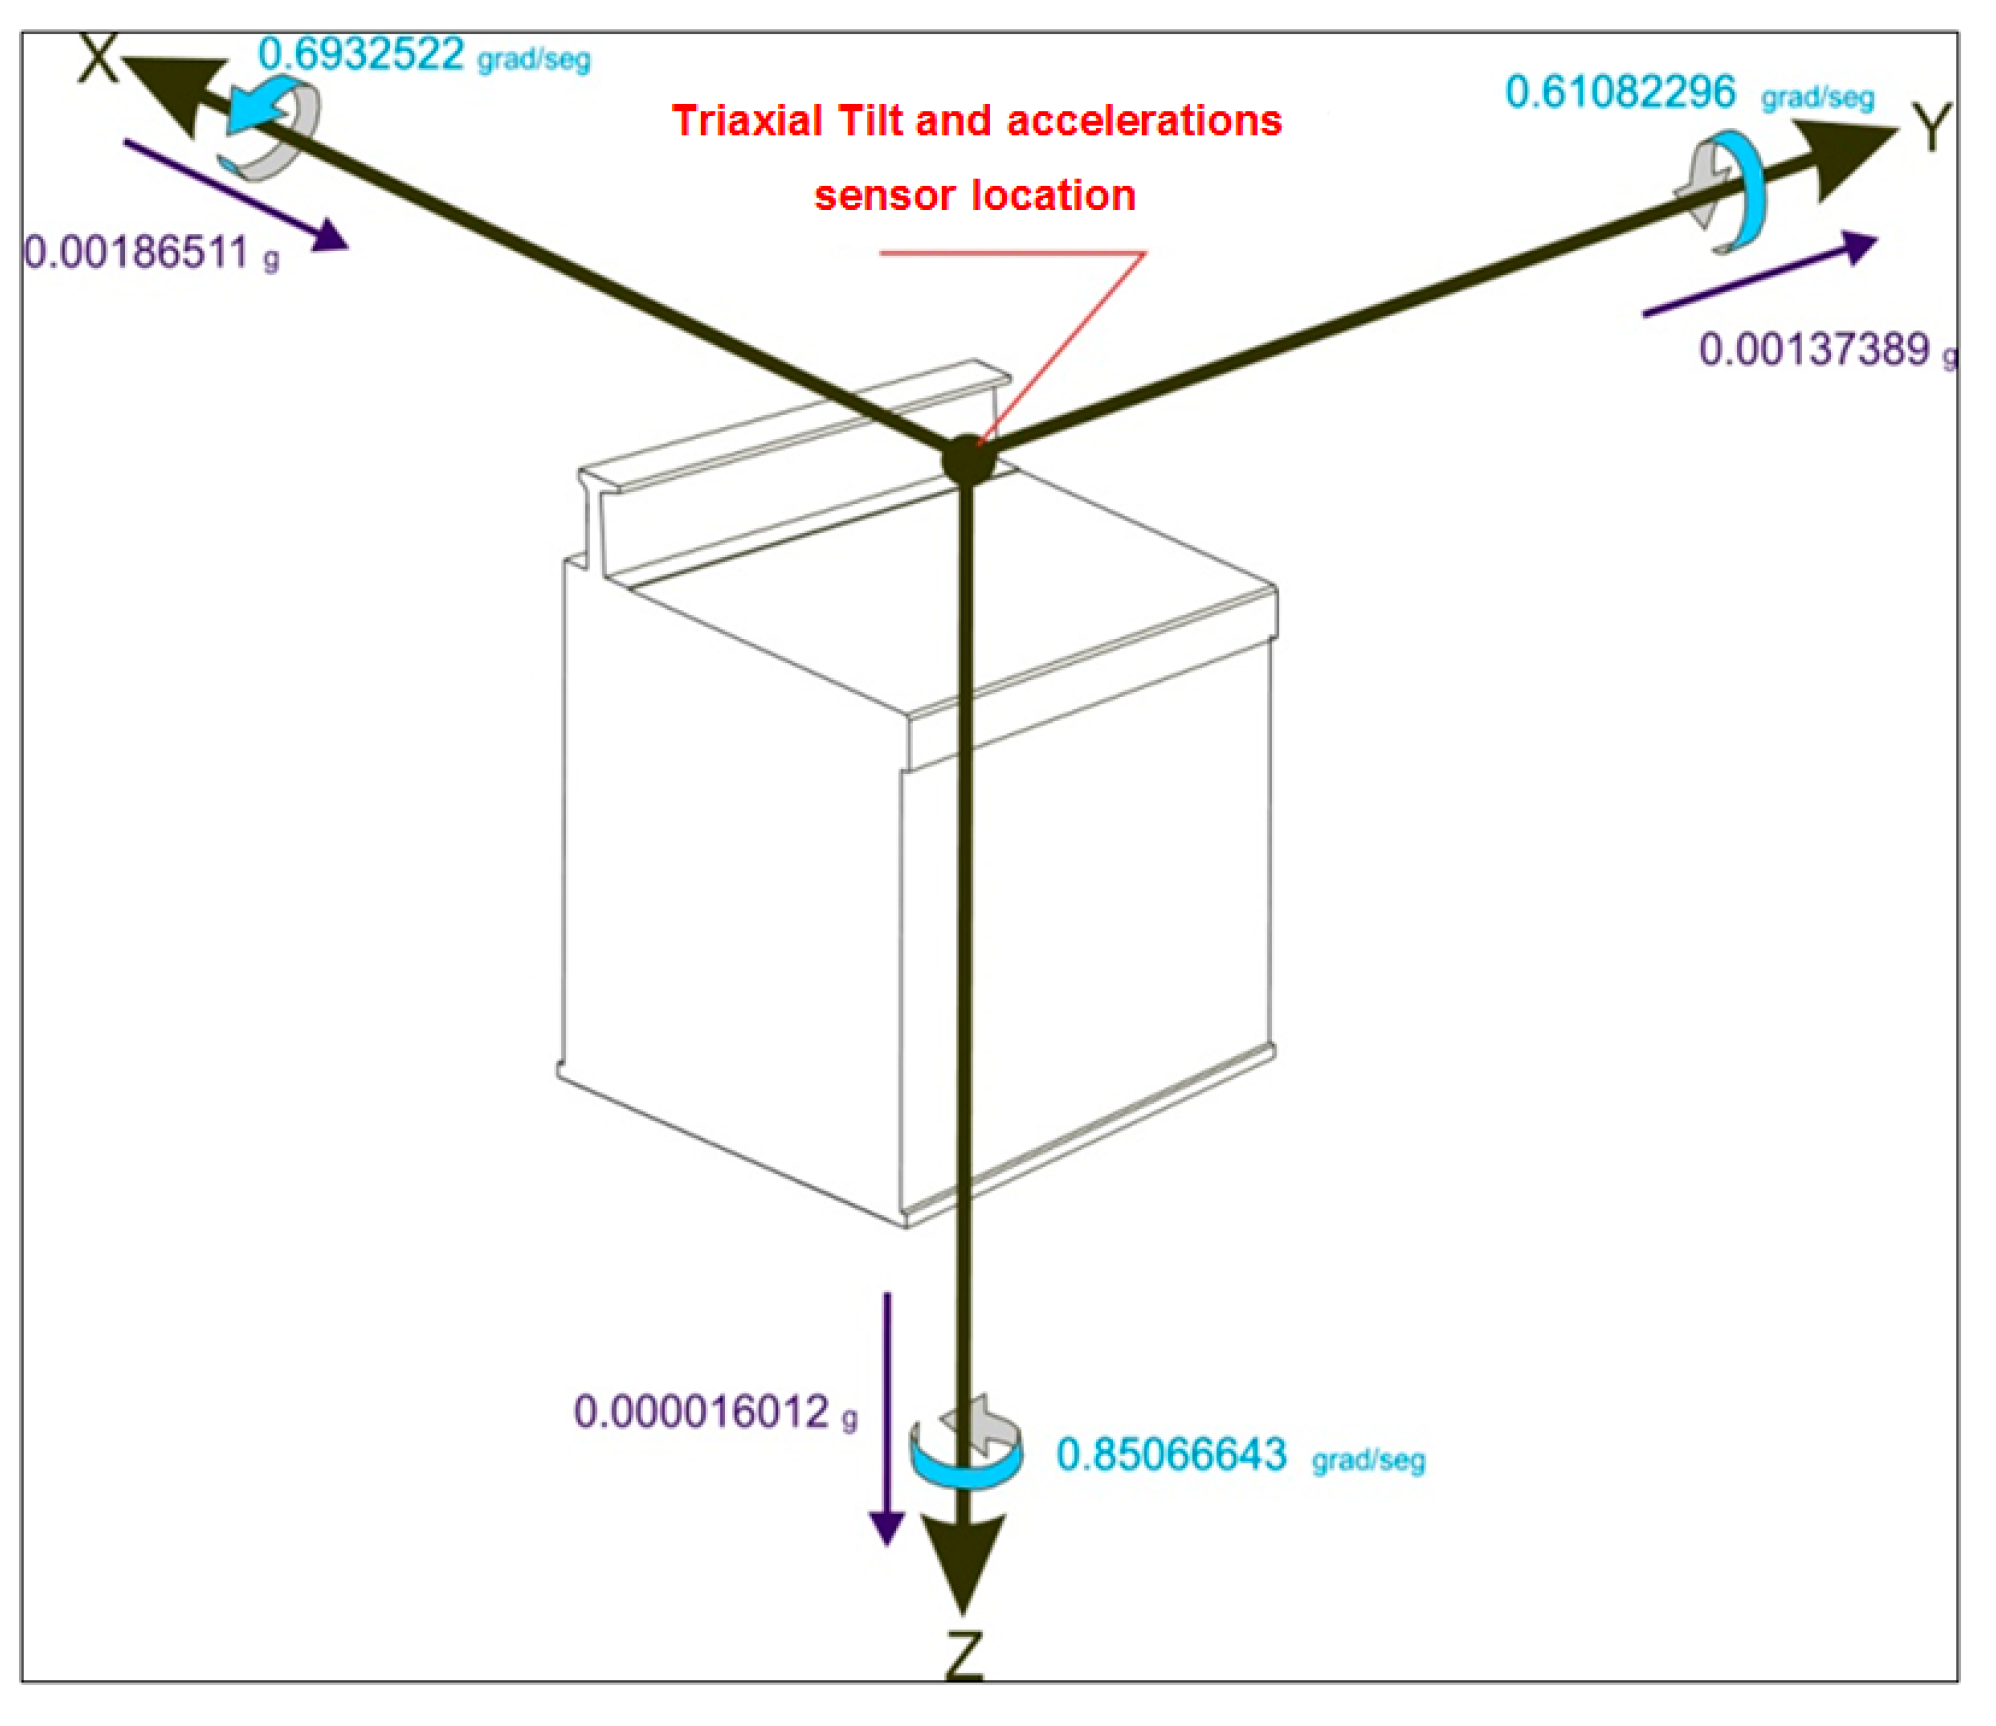
Furthermore, to register the movements of the section, a completely independent and autonomous measurement system is placed in one of the section, which can measure the angular movements of the section and accelerations around three Cartesian axes, rebuilding six degrees of freedom that presents the section in its movement as a rigid solid.
In essence, this system consists of three high-precision inclinometers mounted as triaxle and three accelerometers orthogonally mounted. This mobile and transportable instrument is able to study the six degrees of freedom of movement of any rigid element capable of displacements and rotations in maritime engineering.
As it can be seen, the acceleration will be positive if they are oriented in the positive part of the corresponding axis and turns will be positive if the corkscrew law is fulfilled. The system must be placed with its x axis towards the sea, perpendicularly to the longitudinal axis of the dock, with its axis parallel to the dock, and the z axis in the vertical down.
The system includes PC data logging and tele-control/tele-command software that enables control operations and remote download of stored data, making it to be locally completely unassisted system. Assembled system is shown in
Figure 2.
Complementing the described systems, an atmospheric pressure sensor is suggested to assess the potential miscalibration of pressure and under pressure sensors installed that while measuring the relative pressure (on air) through a vent pipe may suffer some miscalibration or blockage in the tube.
The entire assembly is connected to a computer network installed inside of respective booths at the dock and to a telecommunications and tele control system via satellite, which allows both data recording independently for each of the two sections of sensors and the inertial system, such as downloading data in real time from any place with Internet access, modification capture parameters (sampling rates, configuration files), or remote maintenance of computers.
The choice of frequency is not random, as an overlap with external electrical excitations produced in similar frequencies has to be avoided. The connection of the signal cables to the measurement system within each of the measure booths must prevent any kind of interference from electromagnetic type in the signal cables. This requires a shield to a mass that has been created specifically for each of the booths, and using industrial instrumentation weatherproof cabinets, that provide their own protection IP64 NEMA needed to guarantee immunity to the huge instrumentation aggressive environment at the edge of the sea.
Used pressure sensors are piezoelectric sensors in oil capsules. These sensors are designed to operate at pressures up to 5 bar as a scale bottom.
Furthermore, the accelerometer system measures movement in the six degrees of freedom of the section. Direct measurement provides accelerations in principal axes and angular velocity around these axes. To obtain turnings and displacements it is simply necessary to integrate velocities and accelerations. The section, after an impact of a group of waves gets again a zero velocity and acceleration, where the boundary conditions are obtained from.
Both the pressure sensors and accelerations measure the effects of the waves in its reflection, but do not allow to characterize the incident wave faced by the dock. For this reason it is necessary to use a profiler wave data to provide direction, height and direction of the incident wave in addition to the fields of current velocities at different depths.
3. Results and Discussion
The system has been installed in the Botafoc dock in the port of Ibiza (Spain). This dock starts from the lighthouse with the same name facing south-east and consists of anchored sections at a depth of −19.50 m.
During construction of the dock accommodations were designed to place two identical sections in the section number eight with the measurement system. In each of the sections 12 under pressure and pressure sensors located in the three faces in contact with water at different heights were placed as shown in
Figure 1: 7 sensors in the vertical wall between −12.00 m and +5.00 m, 4 under pressure sensors, and additional sensor on the sheltered face height −4.00 m for measuring actual hydrostatic pressure and eventual inner turmoil present in the sheltered dock.
To increase the time of optimal functioning assembly, the sensors built in titanium (sensor body and membrane), in flush mounting, and signal transmission in 4–20 mA current loop were chosen. To eliminate parasitic signals created by interference of the various systems which can be found in a port environment.
The joint analysis of acceleration, pressure and displacement allows a deep understanding of the behaviour of the dock, which will lead in future to researches on dynamic wave-section to achieve a perfect correlation of the phenomena involved in the structural design of a set section-beam dock edge-superstructure.
Checking the safety factor of a rigid structure of quasi-instantly failure, as in the case of certain failure modes in vertical section docks should be performed in the worst case, i.e., on the highest wave recorded in the period of study, being this wave one that can cause fault conditions.
Once located the period of the highest voltage on the selected sensor, carrying out detailed sampling around the monthly maximum, localization of the wave that produces higher voltage was carried out. After that the states of the maximum pressure which the section has been subject to were analysed, and a stability of the section in these extreme cases were studied and compared with the design limits established in the project (pressures caused by calculation wave). This has led to the development and optimization of various methods of analysis that are presented below.
3.1. Fourier Analysis
This analysis was carried out to determine the accuracy of the data and the amount of “electronic noise” introduced into the signal, and continuously it was decided to use or not the signal given by the sensor in the calculation of pressure laws of section. For each sensor, and on a significant sample of 15 min of gross register, the frequency spectrum was analysed using the Fast Fourier Transform (FFT). Subsequently, in the case of those sensors that showed a peak energy around typical wave frequencies in the spectrum, the SNR (signal to noise ratio) was calculated, applying an approach of acceptability.
The frequency spectrum of the FFT is limited to a range between 0.1 Hz and 1 Hz, being these the limits which encompass the existing typical wave in the area of Ibiza. After this analysis, and in case the sensor records pressures of waves, a spectrum shown in
Figure 3a is obtained, where it can be observed that the spectral density is much greater at frequencies of waves (as shown in the figure around frequency 0.13 corresponding to a wave of slightly less than 8 s).
After verifying that the sensors were registering pressures of waves, it was necessary to calculate signal to noise ratio in decibels at frequencies band near to waves with respect to the rest of the figure.
Currently, for the stability analysis of the section, signals with signal to noise ratio higher than 20 db are considered appropriate. In
Figure 3b a diagram corresponding to a signal with acceptable signal to noise ratio over 30 dB is shown.
3.2. Signal Filtering
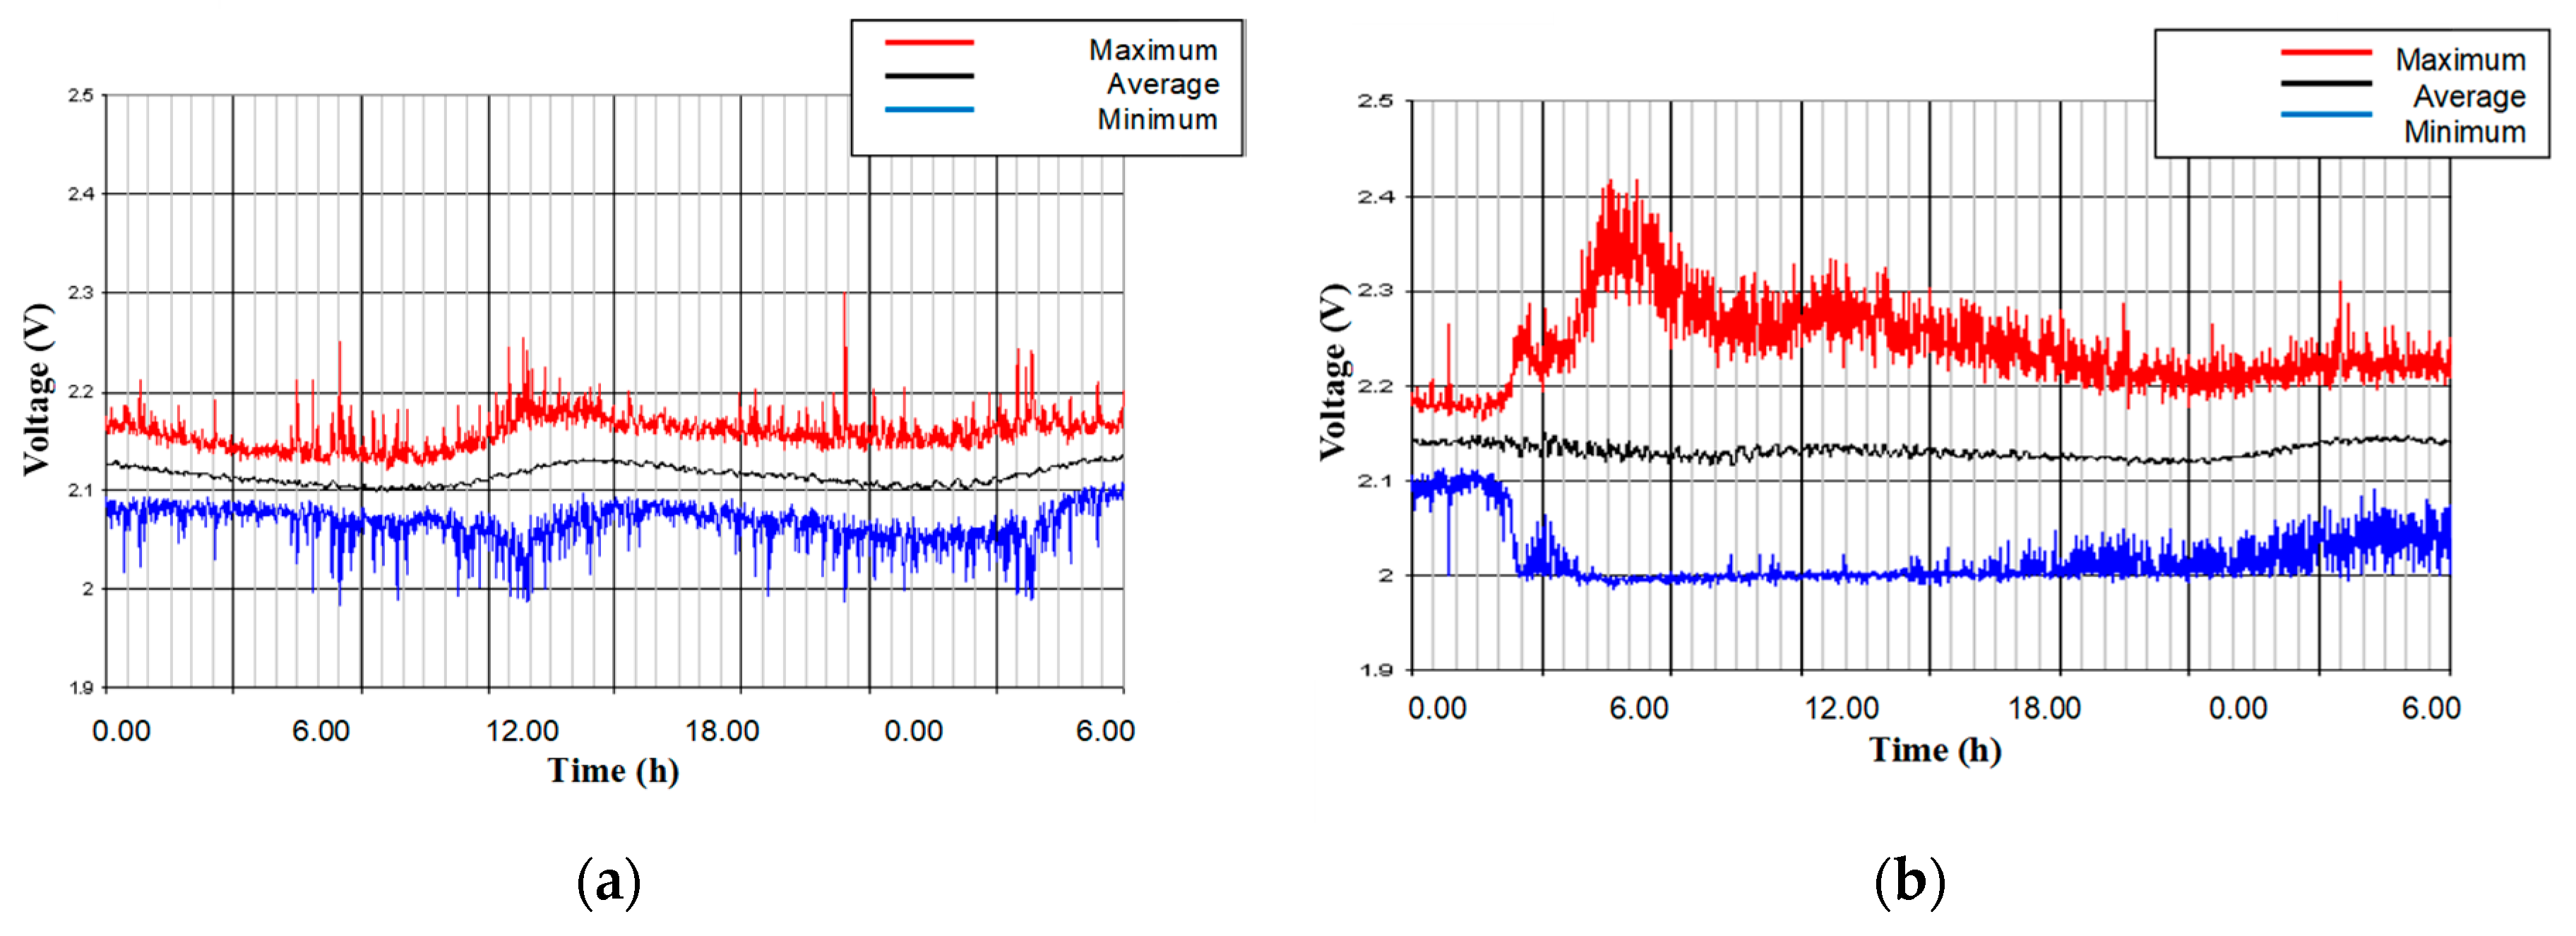
Filtering of the signal obtained by the sensors was carried out with a system of moving average on the collected signal, and produced a signal smoothing eliminating fluctuations on the basis level of this signal. The filter is applied to study the evolution of the base level in order to obtain signal statistics (mean, maximum and minimum levels), not intending to obviate the actual data collected by the sensors, as these may register other phenomena often much greater than the wave (bubble bursts, impulsive pressures). Thus the original data is always preserved.
Figure 4 shows a diagram where filtered three curves can be observed (first in black, second in red and third in blue). The horizontal scale shows data at 65 Hz, so that every 65 data correspond to 1 second signal.
4. Conclusions
This paper has developed a system of 8 pressure sensors and 4 under pressure sensors for measuring both direct and reflection waves. In this way, pressures can be measured simultaneously in the three parameters of dock section in contact with the water to check the safety factor against overturning and sliding of a dock.
The system has been installed on the dock Botafoc in the port of Ibiza (Spain), and according to the measures of pressure and under pressure obtained it can be concluded that the methods commonly used for the calculation of the acting pressure of docks (Goda, PROVERBS, Iribarren, Sainflou) oversize the resulting forces about 15% and under pressure more than 30%. Thus, using the proposed system it is possible to achieve the reduction of more than 15% of the costs of dock construction.


