Abstract
Early seedling survival is a key determinant of reforestation success under increasingly variable climatic conditions. Fertilizers used to mitigate nutrient limitations are believed to mitigate early establishment stress, but their effectiveness under heterogeneous field conditions remains uncertain. This study specifically tests whether an amino-acid-based nitrogen fertilizer can provide a more efficient and ecologically sustainable Nitrogen source compared with conventional mineral formulations. Using a dataset of 6238 seedlings from seven operational Austrian reforestation sites, we quantify amendment performance and examine interactions with relief, soil depth, water availability, and management practices. We apply CatBoost to identify influential predictors of mortality and summarize results across repeated evaluations. Further, for the reported settings, we can reliably predict tree seedling mortality for three out of four seedlings, with an average model accuracy of 76.4% and an AUC of 0.82 across sites. The arginine-based fertilizer increased survival probabilities by up to 15% on moist, deep soils but showed no consistent benefit under shallow or drought-prone conditions. The results highlight the potential of amino-acid-based N supply as a more ecologically aligned alternative and support operational decisions on when and where fertilizers may improve oak establishment under changing climatic conditions.
1. Introduction
Forest regeneration across Europe is increasingly threatened by rapid climatic change and interacting anthropogenic disturbances. These are reshaping European forests and challenging reforestation success across temperate and montane regions [1,2,3,4]. In Central Europe, forest regeneration after large-scale disturbances is increasingly constrained by episodic drought, heat, and site degradation, which together raise early seedling mortality, and weaken stand establishment [2,3,5]. Selecting species that tolerate emerging challenges on site and deploying treatments that reliably enhance survival under real-world constraints has become a central management task [6,7].
Managers have long used soil amendments to buffer young seedlings against water and nutrient stress. Among these, nitrogen (N) fertilizers are the most common, yet their effectiveness under operational reforestation conditions remains uncertain. Conventional mineral N sources can stimulate growth, but they often shift carbon allocation toward shoots, reduce root reserves, and increase vulnerability under water limitation [8,9]. A newer generation of amino-acid-based fertilizers seeks to overcome these trade-offs. By supplying organically bound N, they aim to synchronize nutrient release with microbial activity, enhance root uptake efficiency, and minimize leaching losses [10]. In theory, this coupling between N supply and microbial turnover could provide a more stable nutrient source under fluctuating moisture, yet evidence under field conditions settings remains scarce.
Evidence from operational settings remains limited, especially for Quercus petraea (Matt.) Liebl. (sessile oak), despite its importance for Central European reforestation on shallow or compacted soils under increasingly variable spring droughts [7,11]. For Q. petraea, experimental work shows that increased N can boost growth when moisture is adequate and that pre-plant internal N pools may offer short-term advantages under competition [12,13], yet several studies indicate that high mineral N inputs can also raise drought sensitivity by promoting shoot growth over root reserves and reducing nonstructural carbohydrate storage [8,14]. However, their performance under operational reforestation conditions remains largely untested, especially with decideous trees [10]. This suggests that survival responses to N depend on the match between N supply and site water status: N-only aditions rarely mitigate drought-related mortality, where near-root water is not sufficiently available.
Sessile oak (Q. petraea) is a priority species for climate-resilient reforestation in much of Central Europe due to its comparatively high drought tolerance, broad edaphic amplitude, and ecological value [11,15]. However, first-year and second-year seedling losses can still be substantial on exposed, shallow, or compacted soils, and under intense competing vegetation [16,17]. Soil amendments, like nutrient-supplying products, are widely proposed to mitigate these constraints by improving supply during the establishment phase [8]. Despite promising results from controlled or nursery conditions, large-scale field evaluations in heterogeneous terrain often report mixed or null effects, suggesting strong interactions with microtopography, soil texture and depth, planting method, and browsing pressure [18]. This evidence gap is pronounced for Q. petraea, where operational trials spanning realistic site and management gradients are limited.
Site and management factors frequently outweigh direct amendment effects. Browsing protection, vegetation control, and planting quality strongly influence oak establishment, and their absence can mask any treatment benefits [19,20]. Microrelief, exposure, soil depth, and coarse textures govern drought risk and interact with planting methods and amendment placement, explaining why identical products perform differently across nearby sites [18]. In practice, mineral N fertilizers require caution on drought-prone terrain due to the risk of allocation shifts that increase mortality under moisture stress [8,14].
In this study, we evaluate the survival of Q. petraea seeldlings across multiple Austrian reforestation sites to test whether such an amino-acid-based N fertilizer can provide a more ecologically aligned alternative to conventional mineral N supply for Q. petraea seedling survival under field conditions. The amendments include a mineral N source (Kombioplex©—formerly Basaplex (BP), [21]) as well as a novel arginine-based one (Arevo ArGrow© (ArGr), [22]). We evaluate their effects on seedling survival across heterogeneous sites and planting methods and identify the environmental and management factors that modulate amendment performance and focus on two linked questions: (1) which fertilizer(s) are associated with the highest survival of Q. petraea seedlings relative to untreated controls across heterogeneous sites and planting methods? And (2) which of the recorded management factors and environmental conditions most strongly influence amendment performance?
We tested whether the amino-acid-based nitrogen fertilizer (Arevo ArGrow®) improves early survival of Q. petraea seedlings compared with the conventional mineral nitrogen fertilizer (Kombioplex®). Arevo arGrow is produced by Arevo AB, a biotechnology company based in Umeå, Sweden, specializing in arginine-based biostimulants that enhance root and microbial growth in soil, https://arevo.se/en/knowledge-space/effektermedargrow (accessed on 4 November 2025). G11 Kombioplex is produced by G11 Vertriebs GmbH (G11 Unternehmensverbund) in Gmünd, Austria, https://www.g11.at/organischer-duenger-kombioplex.html (accessed on 4 November 2025). The underlying hypothesis is that the organically bound nitrogen in the amino-acid formulation leads to more consistent survival under operational field conditions. In addition, we hypothesize that fertilizer effectiveness depends on local site factors, particularly soil depth and moisture: positive responses are expected mainly under moderate water availability and sufficient rooting volume, while little or no improvement is anticipated on shallow or drought-prone soils.
Using the recorded data from our reforestation sites (e.g., treatment identity and amount, relief classes, water and drought descriptors, planting method), we identify factors that consistently covariate with survival and that likely govern tree survival in the field. Furthermore, we frame the findings within the nutrient–water context, with an explicit focus on N-based soil amendments and their interaction with site factors, to guide treatment choices and site selection for future plantings.
This study provides decision support for reforestation planning, helping practitioners and forest managers evaluate when nitrogen-based soil amendments are likely to enhance seedling survival under realistic field conditions. The results are relevant not only for reforestation managers but also for broader efforts to design resilient restoration strategies under changing environmental and economic constraints.
The article is structured as follows. Section 2 presents related publications. Section 3 describes the reforestation project from which the data were obtained. Section 4 outlines the machine learning approach and the full analysis. Section 5 reports the results. Section 6 provides a discussion of the approach and findings. Section 7 concludes the article. Finally, Appendix A collects additional plots for all scenarios not shown in the main text.
2. Related Work
Data-driven models are increasingly used to extract stable patterns from heterogeneous ecological datasets and inform management under field variability [23,24]. Against this background, work from forest ecology and plant physiology provides the biological mechanisms and site constraints that determine whether nitrogen (N) inputs translate into establishment gains.
For sessile oak and related European oaks, several studies highlight the importance of microsite conditions and early competition. Annighöfer et al. [16] mapped regeneration patterns across light and neighborhood gradients and showed that small-scale variation in canopy openness and local neighborhood strongly conditions seedling performance. Soil physical constraints matter as well: Kormanek et al. [17] demonstrated that increasing bulk density reduced Q. petraea seedling growth and root development, pointing to mechanical impedance and limited aeration as proximate causes. Along broader resource gradients, Gómez-Aparicio et al. [25] reported that oak seedling survival and growth are largely controlled by water availability and competition, with facilitation–competition balances shifting with site stress; this frames why uniform inputs rarely yield uniform outcomes.
Nitrogen form and timing interact with these site filters. In controlled and nursery contexts, high mineral N can favor shoot allocation and elevate drought sensitivity, consistent with reduced nonstructural reserves or imbalances between demand and water supply [8,14]. By contrast, organically bound N sources are designed to couple release to microbial activity. For conifer seedlings, Öhlund and Näsholm [26] showed that arginine-based formulations led to lower N losses than conventional mineral inputs, implying improved synchronization between availability and uptake; this mechanism motivates testing amino-acid-based N under field variability. Field-scale establishment work further stresses operational context: in a large post-fire synthesis, Marshall et al. [18] found that planted seedling survival was dominated by environment and management (e.g., moisture, microsite preparation, protection), with treatment effects emerging only where site constraints were alleviated.
Taken together, these studies suggest a consistent picture for oak establishment under operational conditions: (i) water status, rooting volume, and soil structure set the primary limits [16,17,25]; (ii) mineral N can amplify stress when moisture is limiting [8,14]; and (iii) amino-acid-based N may reduce losses and improve temporal matching of supply and demand, but any benefit should be contingent on sufficient moisture and active microbial turnover [26]. Our study extends this evidence to Q. petraea under realistic site and management gradients, quantifying when N source and dose align with conditions that favor early survival.
Building on this prior work, our approach applies machine learning—specifically a data-driven CatBoost algorithm—that has not previously been used in this context. We chose this method to address the inherent complexity of ecological data, where numerous interacting factors influence tree mortality and seedling growth, as discussed in the prior paragraphs on related work. Moreover, as highlighted by Toker et al. [27], many natural processes exhibit nonlinear or even chaotic dynamics rather than simple linear relationships and need to be treated with techniques that take this into account, [28]. Consequently, we avoid standard linear regression and instead employ a modern gradient-boosting classifier. Algorithms such as CatBoost are well suited for ecological datasets because they can capture nonlinear relationships better than linear regression, handle missing data, and integrate numerical and categorical predictors within a unified modeling framework to analyze their respective influences.
3. Material and Methods
Sessile oak (Q. petraea) was planted on colline to planar reforestation sites in Austria (Waldviertel and Burgenland) representing typical post-disturbance environments following windthrow, bark beetle outbreaks, and sanitary fellings of declining conifer stands. Many of these sites were previously dominated by spruce or pine, reflecting ongoing efforts to convert them to more drought-tolerant mixed forests. The sites span low to moderate elevations under a temperate climate with continental influence, with annual precipitation ranging from approximately 550 to 900 mm. Historically, Burgenland has experienced warmer, drier summers than the more humid and cooler upland sites (e.g., in Waldviertel). However, recent climate trends suggest that drought stress is becoming more frequent in Central Europe [1,29,30] and is even pronounced in Waldviertel, narrowing the moisture differential between regions. Soils include mainly cambisols and rendzinas on silicate or calcareous substrates, reflecting differences in parent material and past land use. Relief varies from gentle slopes to moderately dissected terrain, with local microrelief shaped by windthrow mounds and pits, erosion features, and former management practices. These gradients reflect realistic field variability in moisture and soil conditions that influence oak establishment.
All seedlings were sourced from local/regional nurseries and planted as bare-root stock from provenances adapted to Austrian montane climates. Standard handling included root-hydration and careful protection from desiccation during storage and transport. Planting was primarily conducted over the course of spring, with some autumn planting operations also taking place. Following regional practices, both manual and mechanical methods were used. Manual planting (holow planting-spade, spade, hoopoe hoe) allowed precise placement of soil amendments directly adjacent to the roots, whereas mechanical planting (tractor, semi-mechanical or precise dosage in a prepared distribution device) distributed amendments less precisely next to the seedling but allowed for more even distribution in the surrounding soil. The specific machinery used for mechanical planting varied among sites, depending on soil bearing capacity and terrain accessibility. A range of mechanical planting devices was used, selected by local forestry operators according to site conditions. Detailed documentation of the mechanical and manual planting tools used, including a comparative time study of their efficiency in combination with soil amendments, is provided in [31]. Planting density followed standard spacing of 1.0 × 1.5 m.
We applied the two N-based granular fertilizers differing in nutrient source and mode of action: mineral N fertilizer (Kombioplex, BP, [21]) supplying inorganic N, and arginine-based organic fertilizer (Arevo ArGrow, ArGr, [22]). Chemically, L-arginine (C6H15N4O2) represents an organically bound amino acid-based N source that must first be mineralized by soil microorganisms before becoming plant-available, as described in Table 1. During this microbial degradation, arginine is enzymatically converted to ammonium () through deamination and urease-mediated steps, leading to a gradual N release closely coupled to microbial activity and soil moisture. This coupling supports synchrony between N availability and root demand, limits leaching, and stimulates rhizosphere processes, as decomposers gain both carbon and nitrogen substrates. The result is a slower, biologically regulated nutrient supply that promotes fine root proliferation and symbiotic interactions. In contrast, the NPK formulation (Kombioplex) delivers readily soluble inorganic nitrogen primarily as ammonium nitrate () (Table 1), which dissociates rapidly into and ions after application. This provides immediate plant-available N but is prone to volatilization, nitrification losses, and leaching—especially under wet or coarse-textured soil conditions. Because the inorganic ions are not microbially immobilized, uptake efficiency strongly depends on root activity at the time of application. The key difference therefore lies in N form and release dynamics: the arginine-based fertilizer relies on microbial mediation and organic N mineralization, while the mineral NPK source provides direct inorganic N ions. Under conditions of moderate soil moisture and active microbial communities, the arginine-based fertilizer tends to sustain root growth and N availability over time, improving early seedling establishment and reducing nutrient losses [26].

Table 1.
Nitrogen properties of the fertilizers used in this study. Abbreviations: ArGr = Arevo ArGrow; BP = Kombioplex.
Untreated seedlings served as controls and were evenly distributed across each planting site among the treated individuals to ensure comparable micro-site conditions.
The manufacturer’s recommended application rate was used as a reference, but varying doses were tested to assess species sensitivity and to account for potential under- or over-application associated with different planting methods. In mechanically planted rows, fertilizer was distributed over a wider area because the seedlings were inserted in a second, machine-assisted step. To compensate for this broader dispersion and ensure sufficient nutrient contact in the near-root zone, approximately double the nominal amount was applied. While BP had to be applied on top of the soil, ArGr was mixed into it. Protection measures (fencing) were imposed on some plots following the forestry managers expertise and decision to reduce browsing, and vegetation control (mulching, mowing) was implemented and recorded in management metadata.
Seedling survival was evaluated after two growing seasons. All plants recorded as dead during the first assessment were also considered dead in the final evaluation, as no replacement or recovery occurred. Thus, the analysis represents cumulative survival over the two-year period. Seedlings were classified as alive if living tissue and apical dominance were present; dead or missing seedlings were recorded as mortality. Additionally, we noted visible causes of death or causes affecting the vitality of alive seedlings (e.g., browsing, desiccation, planting errors). Site- and planting-level metadata were recorded at the time of planting, whereas seedling vitality and survival status were assessed during mortality surveys after two growing seasons. All data were compiled into a central database and screened for consistency and completeness.
This study is part of a larger study, within the project WaldFIT, which investigated the success of climate-smart forestry in reforestation and the effects of soil amendments across 25 sites in Austria [32]. For the present analysis, only Q. petraea data were used. Although oak was planted on nine sites, two were excluded due to protocol deviations or extreme, non-treatment-related losses. The final dataset comprises five sites and 6238 seedlings, providing replication across ArGr and BP treatments, planting methods, and environmental conditions under realistic field deployment. The climatic context was described using temperature and precipitation data from the nearest GeoSphere Austria weather stations for each site during the planting and establishment periods, [33].
Resulting Dataset (Features and Structure)
Each record in the dataset represents one Q. petraea seedling, with a binary response variable total.alive indicating survival status (1 = alive, 0 = dead). Predictor variables describe the applied treatment (fertilizer in a specific dosage, planting method, site characteristics, and management interventions). Fertilizer treatments include Arevo ArGrow (ArGr), and Kombioplex (BP), each tested at different application rates [g].
The main features are described in Table 2 below.

Table 2.
Overview of variables included in the modelling dataset.
After filtering and quality control, the final dataset consists of seedlings across seven sites, with balanced replication of ArGr and BP treatments. This structure enables modelling of survival responses to N amendments in interaction with site, relief, and planting factors.
4. Machine Learning
To analyze seedling survival of Q. petraea under heterogeneous site and management conditions, we applied CatBoost, a gradient-boosting algorithm designed for tabular data with categorical features [34,35]. Gradient boosting builds an ensemble of shallow decision trees, each correcting residual errors from the previous iteration [36]. Unlike bagging-based methods such as Random Forests [37], CatBoost fits trees sequentially and integrates ordered boosting to reduce overfitting. It can handle categorical predictors without one-hot encoding and manage missing values directly, making it suitable for mixed ecological datasets with categorical relief descriptors, treatments, and site identifiers. Previous studies have shown its robustness and interpretability in ecological and agricultural contexts [23,24,38,39,40]. All Code and data are available in a corresponding GitHub repository at https://github.com/carettamarie/Quercus_Nitrogen (accessed on 4 November 2025).
Model setup and training. We used the CatBoostClassifier with default hyperparameters to ensure comparability and computational efficiency, [34,35]. The dataset was randomly divided into training and test subsets, repeated 1000 times to account for variability among random partitions.
Evaluation and interpretability. Model performance was evaluated on the independent test sets using standard metrics (accuracy, precision, recall, and F1-score) [41]. Feature importance values were extracted from each model using CatBoost’s PredictionValuesChange method [42], which estimates the average change in predictions caused by variation in a given feature. Aggregating feature importances across all 1000 models provided a stable ranking of predictor influence and quantified uncertainty from data partitioning. These aggregated importances form the basis for the variable-importance figures presented in Section 5.
Four-Feature Conditioning and Ensemble Aggregation
To evaluate how treatment effects vary under different site conditions, we performed a conditional prediction analysis based on the four most influential non-treatment variables: Precipitation, Slope, Soil Depth, and Water Budget. Each model (T = 1000) produced class predictions (dead or alive) for combinations of these site variables and fertilizer treatments. For each combination (scenario x), the predicted probability of outcome y was estimated as:
where is the number of models predicting outcome y for scenario x, and T = 1000 is the total number of trained models.
Aggregated probabilities were summarized as and for each treatment and scenario.
To visualize these relationships, we used stacked bar charts showing class proportions by treatment under fixed site conditions. Marginal summaries were also computed by averaging over all other features while keeping one variable constant, enabling comparison across site classes. These conditional predictions, as shown in the Results (Section 5), highlight treatment responses under controlled site conditions.
5. Results
Model performance. Across 1000 random train–test splits, the CatBoost classifier showed stable performance (macro accuracy , balanced accuracy ). Scores from concatenated out-of-fold predictions (accuracy , balanced accuracy ) closely matched split-wise averages, indicating robustness not driven by particular partitions (Table 3). This corresponds to correctly classifying about three out of four seedlings under the recorded conditions.

Table 3.
Classification performance for Q. petraea survival prediction. Macro-averaged scores are computed over 1000 independent train/test splits (mean ± SD). “Overall (concatenated)” shows scores from concatenated out-of-fold predictions.
Main drivers of survival and treatment effects. Feature-importance analysis (normalized per run) ranked Fertilizer Treatment, Precipitation, Water Budget, Slope, and Soil Depth as the most influential predictors (Figure 1; Table 4). We further performed a combinatorial analysis of all features (Figure 2, Figure 3 and Figure 4), where, for each feature level, predictions were averaged over all observed combinations of the remaining features. This estimates how often a given condition is associated with dead vs. alive outcomes across the recorded feature space and over the 1000 trained models, providing a robust statistic of our modeling approach. In CatBoost, feature importance is derived from the average change in model predictions when a feature’s value is varied while keeping others fixed, aggregated across all trees and iterations. Because this process yields a distribution of importance scores across 1000 models, we report means and standard deviations to indicate variability rather than applying classical statistical significance testing, which does not directly apply to ensemble-based, nonparametric models.
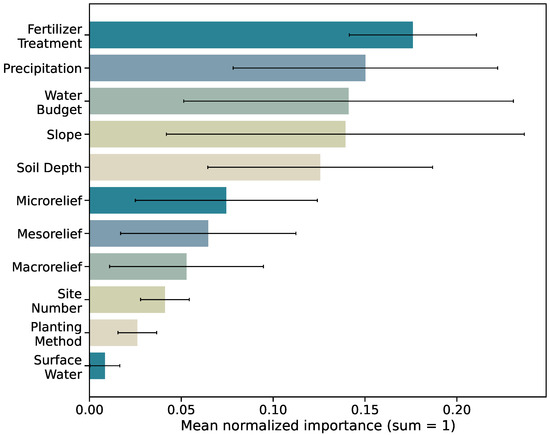
Figure 1.
Normalized feature importance from CatBoost’s Feature Importance across 1000 splits. The bars show the mean relative importance (sum = 1 per run) with SD for each feature and are sorted in decreasing importance order.

Table 4.
Normalized feature importances (mean ± SD) across 1000 CatBoost runs. Importance values were row-normalized per run and averaged across all models.
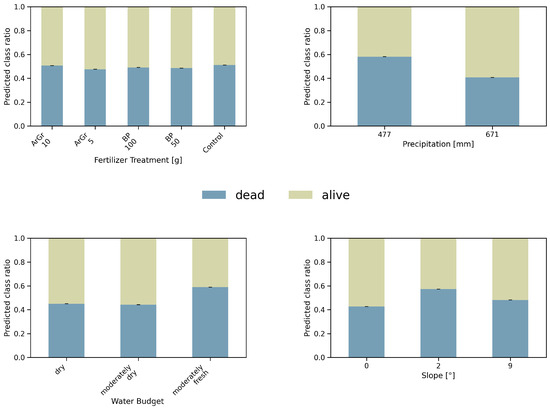
Figure 2.
Marginal effect visualizations for four influential predictors identified by CatBoost (combinatorial averaging over other features). The thin mark indicates the interface standard error.
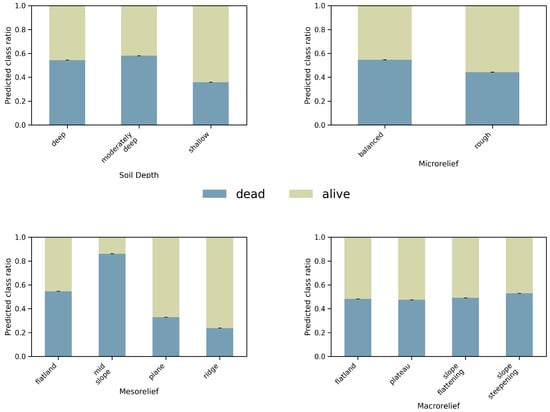
Figure 3.
Additional marginal effect plots for influential site descriptors (combinatorial averaging).
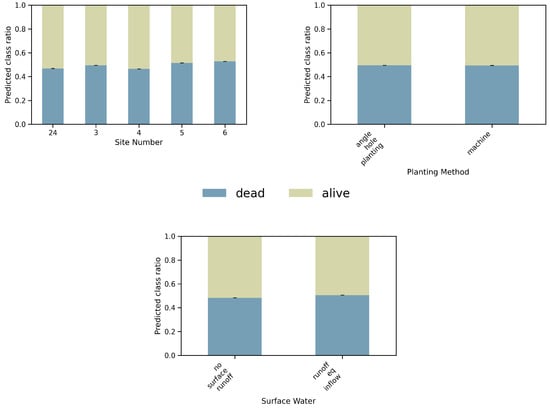
Figure 4.
Additional marginal effect plots for remaining predictors.
The aggregated ratios (Table 4) align with the importance ranking and show clear, interpretable trends: (i) mortality increases with slope (dead ratio: at ; Table A5); (ii) deeper soils are associated with higher mortality than shallow soils (dead ratio: shallow vs. deep ; Table A6); (iii) lower precipitation (477 mm class) shows higher mortality than the 671 mm class (dead vs. ; Table A3); (iv) sites labeled “moderately fresh” in water budget have higher mortality than dry/moderately dry categories (dead vs. /; Table A4); (v) mesorelief “mid slope” is strongly unfavorable (dead ; Table A8), while ridges and planes show lower mortality. Micro- and macrorelief show smaller but consistent contrasts (e.g., microrelief balanced vs. rough ; macrorelief slope steepening vs. plateau ; Table A7 and Table A9).
For Fertilizer Treatment, site-averaged differences are small (Table A2): Control () and ArGr_10 () show slightly higher mortality than BP_50 (), BP_100 (), and ArGr_5 (). These differences are within narrow standard errors but reproduce across combinations, indicating modest treatment signals relative to strong site effects. Across all sites, as depicted in Figure 2, there is no drastic influence of soil amendments on mortality when averaged marginally over other factors. However, Control and ArGr_10 tend to be slightly worse than the other treatments; this pattern is consistent with the corresponding errors (Appendix B, Table A2).
It is important to note that these aggregated results—covering the full spectrum of recorded variables and their expressions across all 1000 models—represent overall averages. This means that although some variables (e.g., Mesorelief) are strongly associated with increased mortality, the trend that Fertilizer Treatment and its different expressions provide roughly a 50/50 chance of increasing or decreasing survival appears contrary to it being ranked among the most influential features in our feature-importance analysis. However, we also observe substantial variability in feature importance across runs. Thus, while Fertilizer Treatment consistently ranks among the most influential predictors, this variability indicates that small differences in training data or overall data composition can shift its relative importance. In other words, under certain data subsets or site-specific contexts, Fertilizer Treatment may lose its role as a dominant driver of survival.
Nevertheless, given its prominence in the overall analysis, it is necessary to examine Fertilizer Treatment more closely. Although its global marginal effects appear weak when averaged over all combinations, the treatment’s influence may become more evident under particular environmental or site-specific conditions. Therefore, in the following section, we analyze treatment responses under selected combinations of site parameters to identify conditions where specific soil amendments are beneficial—or detrimental—for seedling survival.
Site-conditional treatment responses. To explore how treatment effects vary under different site conditions, we generated conditional predictions based on four influential non-treatment variables: Precipitation, Slope, Soil Depth, and Water Budget. Each model () produced class predictions (dead or alive) for combinations of these features and fertilizer treatments. The predicted probability of outcome y for scenario x is shown in Equation (1), where is the number of models predicting outcome y for scenario x. Aggregated probabilities (, ) were used to visualize treatment effects across site regimes.
Combinations Analysis: Treatment Effects Conditional on Site Factor Combinations
The Scenarios showcasing the combination of site factors with the highest differences in seedling mortality are shown as Scenarios A–C, whereas all other combinations can be found in Appendix A, These scenarios use realistic parameter values from Burgenland and Waldviertel, but in artificial combinations, to illustrate how the model predicts mortality across different site types (Figure A1). Representative examples show consistent patterns (Figure 5, Figure 6 and Figure 7):
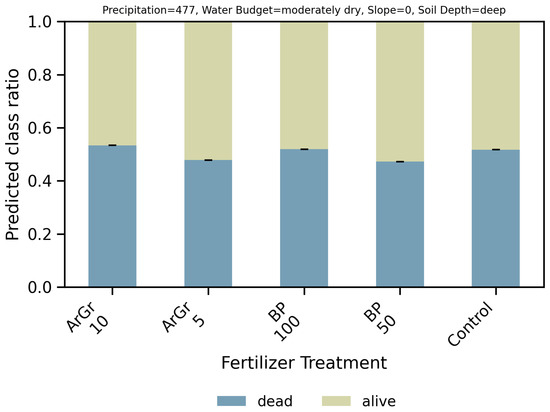
Figure 5.
Conditioned Fertilizer Treatment profile for Scenario A. Bars show predicted class proportions; the thin mark indicates the interface standard error.
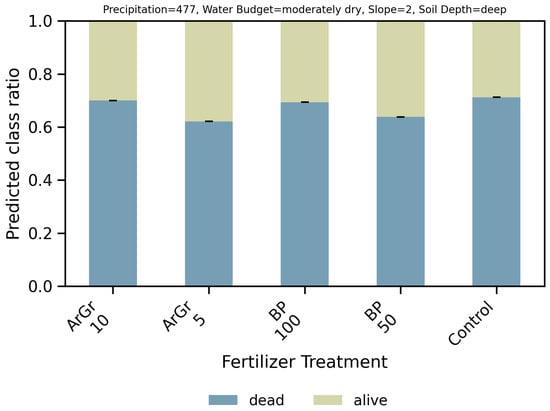
Figure 6.
Conditioned Fertilizer Treatment profile for Scenario B. N treatments improve outcomes over control, but overall mortality remains high. The thin mark indicates the interface standard error.
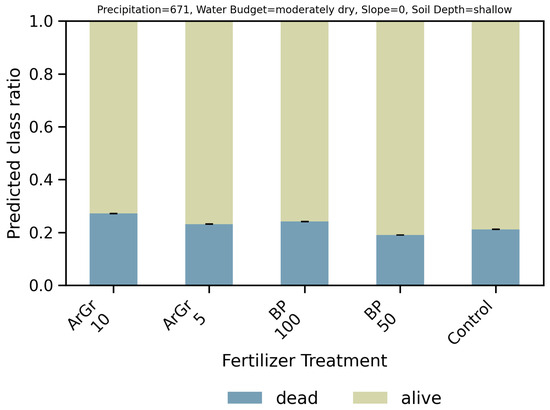
Figure 7.
Conditioned Fertilizer Treatment profile for Scenario C. Differences are small; control and BP_50 are marginally better. The thin mark indicates the interface standard error.
- Scenario A: Precipitation = 477, Water Budget = moderately fresh, Slope = 0, Soil Depth = deep.
Predicted mortality is high in all groups, but N treatments reduce mortality relative to Control. BP 100 g and both ArGr doses show lower (≈0.62–0.65) than Control (≈0.74); BP 50 g is close to Control. Error bars at the class interface are small, indicating stable class separation. Despite the low rainfall, the combination of deep soils, flat relief, and a moderately fresh water budget suggests a rather favorable site, a lowland or basin floor with groundwater influence.
- Scenario B: Precipitation = 477, Water Budget = moderately fresh, Slope = 2, Soil Depth = deep.
With a gentle slope, overall mortality increases. The control group has the highest (≈0.93); BP 50 g is similar. BP_100 and the ArGr doses reduce mortality (≈0.78–0.83), but absolute survival remains low. The ranking is consistent with Scenario A, with BP 100 g best among the shown treatments. Scenario B, with only 480 mm precipitation but a moderately fresh water budget, gentle slope, and deep soils, probably reflects a more favorable colline site, found in sheltered valleys or lower montaneous areas where deeper soils compensate for little rainfall.
- Scenario C: Precipitation = 671, Water Budget = moderately dry, Slope = 0, Soil Depth = shallow.
Mortality is lower in all groups ( 0.19–0.27) and treatment differences are small. BP 50 g and Control have the lowest ; ArGr 10 g is highest; ArGr 5 g and BP 100 g are intermediate. Under this combination of higher precipitation band and shallow soil, added N does not yield a consistent advantage over the Control group. The combination of only 670 mm annual precipitation, a moderately dry water budget, flat relief, and shallow soils could likely represent a Pannonian lowland site, with sandy or gravelly substrate and limited water-holding capacity, as often seen in Eastern Austria.
Overall, fertilizer performance depends on water availability and rooting conditions. N treatments—especially BP 100 g—reduce mortality primarily in moderately dry to intermediate moisture settings with sufficient rooting volume. The arginine-based fertilizer (ArGr) performs comparably under intermediate stress but shows no advantage under drought-prone or very shallow conditions.
Diagnostics.
The aggregated confusion matrix shows higher correct prediciton rates for the alive class () than for dead () (Figure 8, Table 5). If management applications require a stronger focus on mortality rates, threshold tuning or cost-sensitive learning can be applied (not explored here).
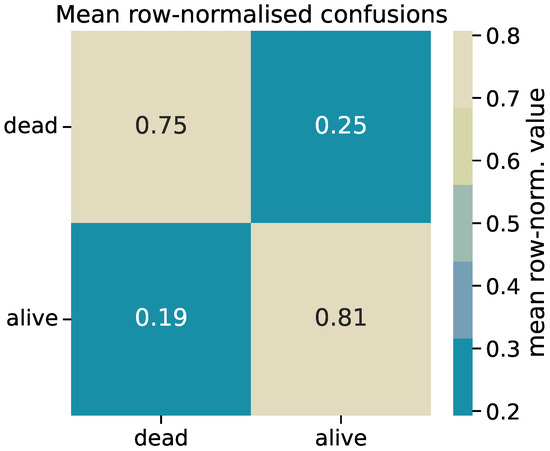
Figure 8.
Confusion matrix aggregated across 1000 independent splits. Cells show counts (or normalized rates); axes denote true vs. predicted classes.

Table 5.
Aggregated confusion matrix over all splits (absolute counts) and mean ± SD of row-normalized rates across runs. Rows are true classes; columns are predicted classes. Class encoding: 0 = dead, 1 = alive.
Key takeaways.
- Model performance is stable across 1000 runs, with a balanced accuracy of about . This shows that three out of four seedlings were correctly classified based on site and management conditions, reflecting the inherent noise of large ecological datasets.
- Site conditions and soil amendments (Fertilizer Treatment) are the main factors influencing survival in our models. In particular, Water Budget, Precipitation, Slope, and Soil Depth have the strongest effects, Table 4. Several relief-related features also show clear differences, such as high mortality on mid-slope positions.
- Nitrogen treatments show effects that depend on the site conditions. BP_100 usually lowers mortality when moisture is moderate and soil is deep enough for stable rooting. ArGr_5 performs similarly in some situations, while ArGr_10 and Control tend to have slightly higher mortality on average. These differences are small compared to the effects of the site variables.
- The Planting Method variable shows only minor differences. Small variations likely result from associated site properties rather than the planting technique itself.
- The positive effect of nitrogen fertilization disappears on very shallow or dry sites and is not visible under wetter or more compact conditions. Site-specific application, therefore, provides better outcomes than applying fertilizer uniformly across all conditions.
- The relatively high variation in feature-importance values (Figure 1) together with small standard errors in the outcome ratios (Appendix B) means that feature rankings change somewhat between runs, but the overall outcome patterns remain stable when averaged over all combinations. This suggests that the detailed ratio and regime analyses give more reliable information about actual survival trends, while the feature-importance ranking is best used to identify which variables matter most overall.
6. Discussion
Our analysis demonstrates that early survival of Sessile Oak (Q. petraea) is primarily governed by site conditions and management. While fertilizer treatments emerged among the most influential variables in the CatBoost model (Figure 1), their effects were secondary and highly context dependent, becoming evident only under particular site combinations. This outcome is not surprising, as water availability and rooting volume are well-established determinants of oak establishment success across Central Europe [18,25,43]. The model confirmed that precipitation, local water budget, soil depth, and slope were the strongest predictors of survival, emphasizing that successful establishment depends on a balance between sufficient moisture and adequate soil aeration. Mortality tended to increase on shallow or moderately sloping sites with limited rooting volume, while seedlings on deeper soils or gently drained flats performed better under comparable moisture regimes (Figure 2, Figure 3, Figure 4 and Appendix A).
Site-conditioned fertilizer responses (interpretation). The limited and site-specific effects of nitrogen treatments align with the expectation that nutrient supply becomes relevant only once water and soil constraints are alleviated. The arginine-based organic fertilizer likely provided a more gradual nutrient release through microbial mineralization, which can improve N-use efficiency and stimulate fine-root and microbial activity under favorable moisture conditions. In contrast, the mineral NPK formulation offered immediate nutrient availability but little buffering against leaching or volatilization, reducing its efficacy under fluctuating soil moisture. Thus, fertilizer effects appear contingent on soil biological activity and water status. These are conditions under which the organically bound N source could outperform mineral inputs by synchronizing nutrient release with seedling demand.
The scenario patterns (Figure 5, Figure 6 and Figure 7) are best read as evidence for a narrow hydrological window within which N inputs can assist establishment, rather than as a universal ranking of products or doses. Three caveats temper a literal interpretation of these findings. First, the conditioning variables (precipitation band, water budget, slope, soil depth) are also proxies for processes, drainage, aeration, and rooting volume, which we did not measure directly; their effects likely bundle unobserved features (compaction, fine-scale topography, plant quality) and are influenciung the quantitative importance of organic N uptake [10,44]. Second, management co-varies with site context: an apparent advantage under mechanically treated areas may reflect better preparation or more consistent operations, not the planting method per se (Figure 1) [45]. Third, the variability of the arginine formulation is consistent with process constraints—its benefit should depend on microbial mineralization and early-season soil temperature/moisture [46]—yet our data cannot separate these mechanisms from placement and dose effects (Figure 2, Figure 3 and Figure 4). Mechanistically, an N pulse can stimulate shoot demand and stomatal conductance; where rooting depth or near-root water is limited, the marginal water cost may outweigh nutritional gains, explaining why controls sometimes match or exceed fertilized seedlings [9]. Because averaging predictions makes the results more stable, but it cannot correct for biases in the data itself, we interpret the scenarios as compatibility signals: N helps when moisture and rooting space support uptake and carbon balance, and it does not when those constraints dominate.
Performance of nitrogen-based fertilizers. The influence of the mineral and arginine-based fertilizers (Figure 1, Figure 2, Figure 3 and Figure 4) on oak survival together with hydological factors such as precipitation and water budget highlight the importance of matching nutrient availability and site water balance. ArGrow provided similar but slightly consistent improvement in seedling survival, particularly under moderately fresh and deep-soil conditions, suggesting that slow N availability through microbial activity in the soil can enhance establishment when moisture supports active uptake [47]. However, the same treatment offered little or no benefit under drier or wetter microsites, where hydrological stress dominated mortality patterns (Scenario A–C, Figure 5, Figure 6 and Figure 7). This likely reflects its dependence on microbial mineralization and temperature-sensitive nutrient release—factors that fluctuate across operational sites [46].
The mineral-based Kombioplex H showed similar, in cases elevated survival responses, with modest gains under intermediate moisture conditions but neutral or negative effects under stress, showing that quick N release does not necessarily benefit the seedlings if water availability is not ensured [14].
The organic formulation of (Arevo ArGrow) contains a lower total nitrogen concentration (approximately 4000 mg/100 g) compared with the mineral NPK product (6800 mg/100 g), yet showed comparable effects under favorable soil and water budget conditions. This suggests that organically bound amino acid–derived nitrogen can be used more efficiently than mineral forms, because arginine N is gradually mineralized by soil microorganisms. Therefor its release is better synchronized with plant demand, reducing the risk of N leaching and volatilization.
Control plants frequently matched or exceeded fertilized ones in drier soils, reinforcing that nutrient supply cannot compensate for limited near-root water. These findings indicate that both fertilizers interact with, rather than override, site hydrology [12,48].
From an ecological and management perspective, the nutrient mobilization strategy of amino-acid-based fertilizers holds potential for more sustainable, site-tailored nutrient management, but its success depends on sufficient soil biological activity and stable moisture conditions.
Interactions with planting and management. Preliminary graphical analyses conducted suggested that mechanical planting enhanced the apparent benefit of N-based fertilizers, particularly under moderately dry conditions [49]. However, the feature-importance results (Figure 1) did not clearly support this effect, indicating that the observed gains may not arise from the planting method itself. Rather, mechanical planting is typically applied on sites with deeper soils, better preparation, and more consistent management, which jointly favor establishment. It may also co-occur with complementary measures such as fencing or mulching, creating microenvironments that reduce stress during the first season, or less browsing pressure [20]. This interaction highlights that operational context—more than the method alone—likely explains the improved survival patterns seen in mechanically planted seedlings.
From a reforestation management perspective, the efficiency of a lower content of N and needed dose of ArGrow has practical implications. Lower N concentrations and doses simplify logistics and reduce nutrient losses. Therefore making arginine-based formulations more suitable for large-scale planting operations. By contrast, mineral NPK fertilizers, while providing immediate N availability, can lead to transient nutrient surpluses under variable moisture, increasing leaching risks and reducing uptake efficiency and attrackt browsers due to the intense smell and aboveground application. The use of amino acid-based fertilizers may therefore represent a more sustainable and operationally robust approach, particularly when applied selectively under moisture-adequate site conditions.
Together, these findings reinforce a “site-first” logic: without adequate management, hydrological conditions, proper planting, and protection, product choice has limited influence on survival outcomes [50].
Implications for reforestation practice. From an operational perspective, the results suggest that N-based fertilizers should be targeted rather than applied uniformly. On sites with sufficient rooting depth and moderate moisture stress—typical of transitional relief positions or well-prepared soils—controlled nitrogen additions can modestly improve establishment. However, in shallow or coarse substrates where water becomes limiting, or in compacted soils where aeration is poor, nutrient inputs are unlikely to offset hydrological stress and may even intensify it by stimulating aboveground growth. Thus, moisture management, proper planting, and vegetation control remain the dominant levers for improving survival. Practical guidelines would benefit from condition-specific recommendations that report fertilizer performance by water and relief classes rather than as overall averages, facilitating transfer of insights across heterogeneous landscapes.
Position within current reforestation strategies. Within the broader shift toward climate-adapted reforestation, fertilizers continue to be promoted as tools for stabilizing early seedling performance under stress. Our findings advocate a more diagnostic and site-aware approach. N-based products may complement favorable microsites but cannot substitute for appropriate species–site matching or sound management. In line with recent work on adaptive forestry [7,18], our study reinforces that resilience arises from ecological fit and microsite preparation rather than chemical intervention. For future practice, integrating small-scale field experimentation with physiological monitoring and improved soil data could refine thresholds for when organic N sources like arginine formulations become beneficial, and when they simply add cost without ecological gain.
Methodological reflections. The machine-learning framework proved valuable for extracting consistent ecological signals from heterogeneous, operational field data. CatBoost offered a practical balance between robustness and interpretability for tabular datasets with many categorical site descriptors and missing values [34,35]. While overall predictive accuracy was moderate (balanced accuracy ), this level is realistic for complex survival data in which mortality arises from multiple interacting stressors. The repeated-split ensemble approach minimized partition bias and yielded stable rankings of key predictors, consistently highlighting the dominance of site factors over treatment identity, except for the influence of soil amendments, which, on average, dominated our models’ predictions. Nevertheless, the analysis remains associational: site encodings likely absorb unmeasured covariates such as soil structure, microtopography, or operational differences. Because the models showed higher recall for the alive class than for the dead class, applications requiring a stronger focus on mortality rates should consider threshold adjustments or cost-sensitive training, explicitly reporting trade-offs in precision and false-alarm rates. Future studies combining broader spatial replication with more detailed soil and microclimate measurements could help disentangle these hidden covariates and test the portability of the identified relationships across regions.
Limitations
We acknowledge several limitations. First, because on-site meteorological sensors were not available, climatic characterization relied on data from the nearest weather stations representing means and averages in the planting years. This approach captured regional gradients reasonably well but may have missed short-term or microclimatic variation influencing seedling stress and survival.
Second, our focus on survival necessarily provides a coarse measure of amendment performance. Additional indicators—such as above- and belowground biomass, or early growth allocation, could offer a fuller picture of how fertilizers affect both vigor and sustainability beyond establishment, although the present study deliberately targeted the critical early survival phase.
Third, soil characterization was limited to a basic descriptor set. Expanding measurements to include texture, stone content, organic matter, and baseline nutrient pools would strengthen inference on amendment–soil interactions and improve mechanistic understanding.
Finally, replication across a larger number of sites would enhance generalization, but the existing dataset already spans a broad operational range and captures much of the variability encountered in practice.
The study also highlights the value of rigorous metadata collection: consistent documentation of environmental and management parameters is essential to support future data integration and enable more comparable multi-site syntheses.
7. Conclusions
This study evaluated the establishment of sessile oak (Q. petraea) across reforestation sites in Austria, combining field-based survival data with site, management, and climatic information. By applying a CatBoost machine-learning model, we identified water availability, soil depth, and slope as dominant drivers of early survival with a balanced accuracy of ≈0.75. This highlights the overriding role of site hydrology and rooting space for oak establishment.
Fertilizer effects were conditional on these site factors. Both nitrogen-based products improved survival slightly, and only where sufficient moisture and soil depth supported nutrient uptake. Under shallow or drought-prone conditions, no benefit—and occasionally reduced survival—was observed. The mineral NPK fertilizer (BP) showed the highest gains under moderately moist, deep soils, while the amino acid-based fertilizer (ArGr) performed comparably but relies on microbial mineralization to release nitrogen gradually.
Overall, these findings confirm that nutrient effects are secondary to hydrological and structural site constraints. Fertilizers can complement—but not compensate for—insufficient soil depth, moisture, or planting quality. From a management perspective, soil amendments should therefore be applied selectively, guided by site-specific hydrological regimes rather than uniform prescriptions. The inclusion of a novel amino acid-based N source in this study provides new empirical evidence on how organically bound nitrogen behaves under realistic reforestation conditions, offering a promising direction for future work linking nutrient cycling, microbial processes, and seedling physiology.
Author Contributions
Conceptualization, M.L. and S.R.; Methodology, M.L. and S.R.; Software, S.R.; Validation, S.R., G.G., and K.M.; Formal analysis, S.R., G.G., and K.M.; Investigation, M.L., S.R., and G.G.; Resources, M.L.; Data curation, M.L. and H.S.; Writing—original draft, M.L., S.R., G.G., and K.M.; Writing—review & editing, M.L., S.R., G.G., H.S., and K.M.; Visualization, M.L. and S.R.; Supervision, S.R., H.S., and K.M.; Project administration, M.L.; Funding acquisition, M.L. and K.M. All authors have read and agreed to the published version of the manuscript.
Funding
This project is funded by the Federal Ministry of Agriculture and Forestry, Climate and Environmental Protection, Regions and Water Management via dafne.at. The BMLUK supports applied, problem-oriented research in its area of expertise. SBA Research (SBA-K1 NGC) is a COMET Center within the COMET—Competence Centers for Excellent Technologies Programme and funded by BMIMI, BMWET, and the federal state of Vienna. The COMET Programme is managed by FFG.
Data Availability Statement
All Code and data are available in a corresponding GitHub repository at https://github.com/carettamarie/Quercus_Nitrogen (accessed on 4 November 2025).
Conflicts of Interest
The authors declare no conflicts of interest.
Appendix A. Additional Combinatination-Analysis Plots (Profile 4, 2 × 2 Layouts)
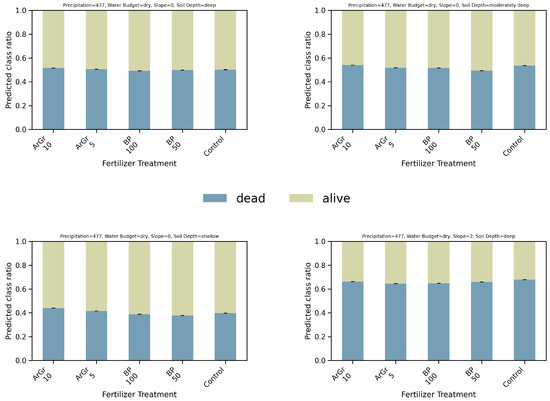
Figure A1.
Conditioned Fertilizer Treatment profiles (profile 4): Precipitation = 477, Water Budget = dry. Panels vary by Slope and Soil Depth. Bars show predicted class proportions; thin line marks the SE. The central legend applies to all panels.
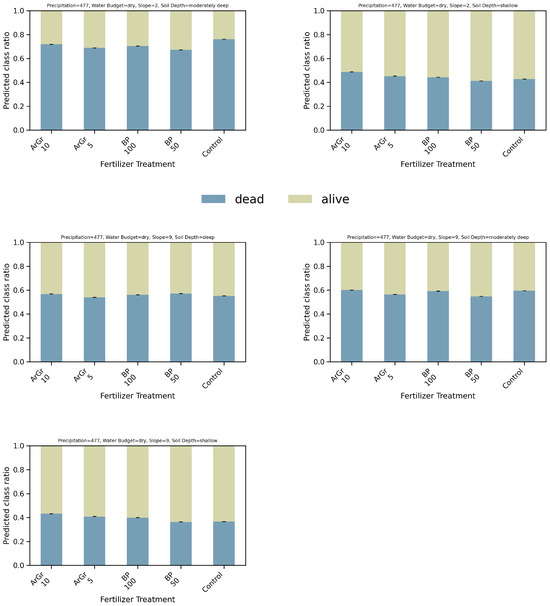
Figure A2.
Conditioned profiles: Precipitation = 477, Water Budget = dry.
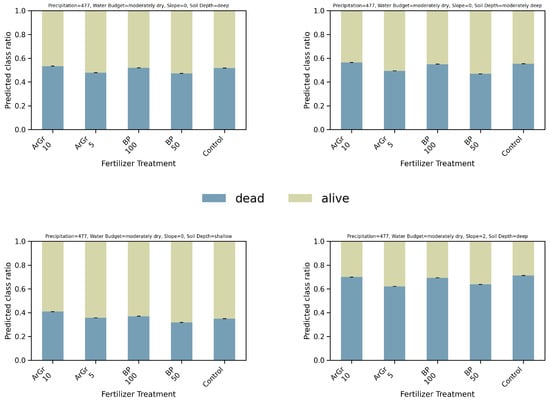
Figure A3.
Conditioned profiles: Precipitation = 477, Water Budget = moderately dry.
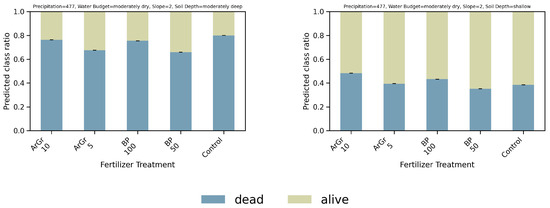
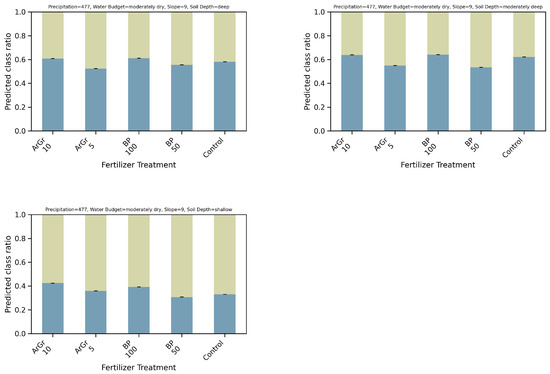
Figure A4.
Conditioned profiles: Precipitation = 477, Water Budget = moderately dry.
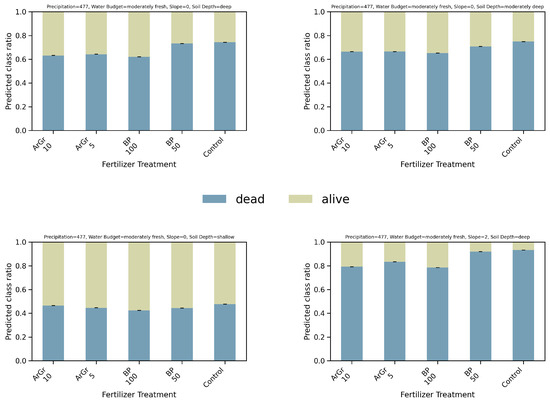
Figure A5.
Conditioned profiles: Precipitation = 477, Water Budget = moderately fresh.
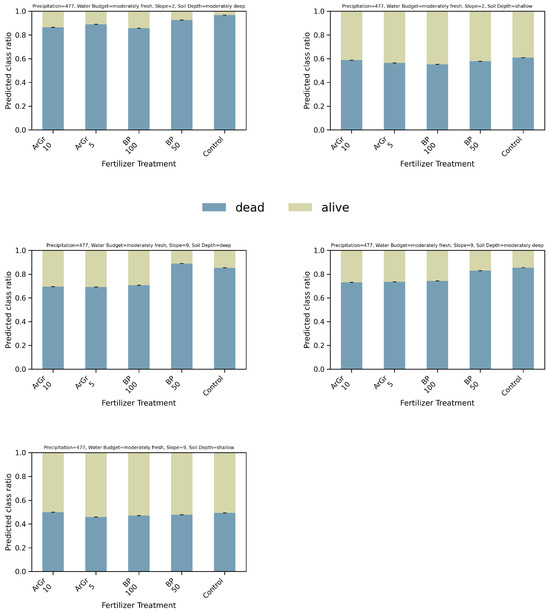
Figure A6.
Conditioned profiles: Precipitation = 477, Water Budget = moderately fresh.
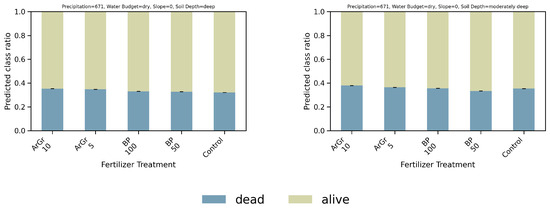

Figure A7.
Conditioned profiles: Precipitation = 671, Water Budget = dry.
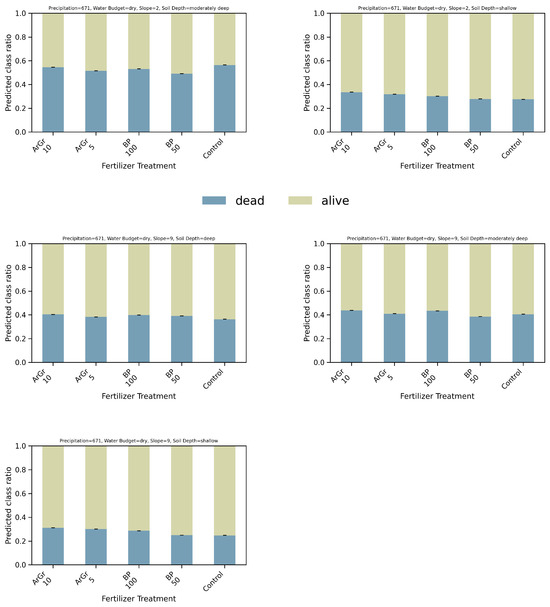
Figure A8.
Conditioned profiles: Precipitation = 671, Water Budget = dry.
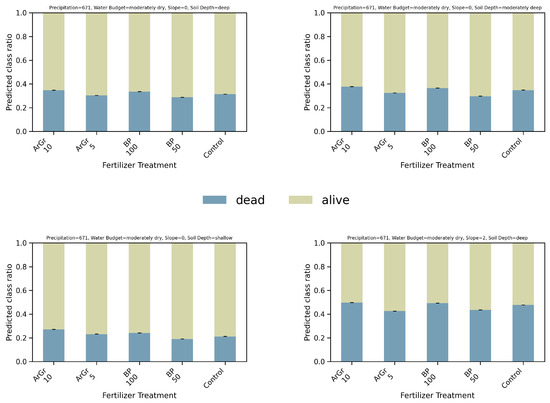
Figure A9.
Conditioned profiles: Precipitation = 671, Water Budget = moderately dry.
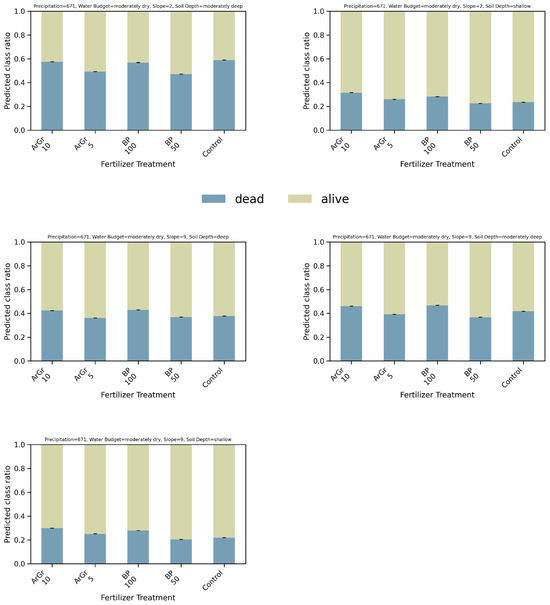
Figure A10.
Conditioned profiles: Precipitation = 671, Water Budget = moderately dry.
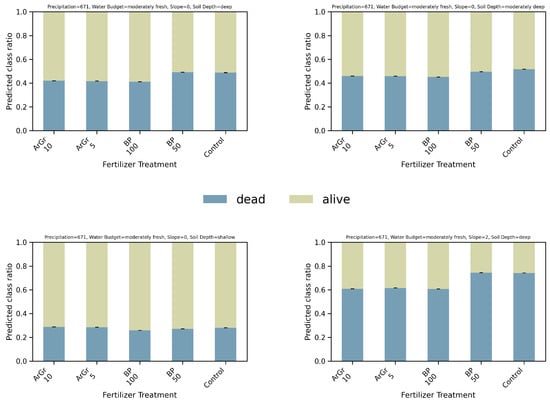
Figure A11.
Conditioned profiles: Precipitation = 671, Water Budget = moderately fresh.
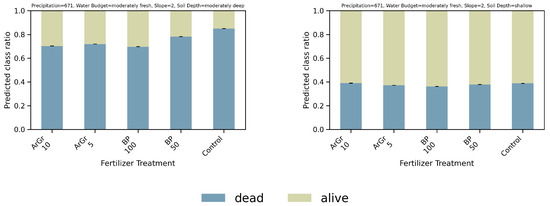
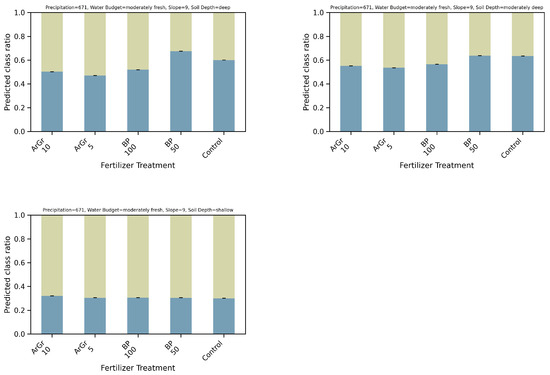
Figure A12.
Conditioned profiles: Precipitation = 671, Water Budget = moderately fresh.

Table A1.
Predicted mortality ratios () under specific site conditions and fertilizer treatments (regime analysis).
Table A1.
Predicted mortality ratios () under specific site conditions and fertilizer treatments (regime analysis).
| Condition | ArGr 10 | ArGr 5 | BP 100 | BP 50 | Control |
|---|---|---|---|---|---|
| precip = 477 water budget = dry slope = 0 soil = deep | |||||
| precip = 477 water budget = dry slope = 0 soil = moderately deep | |||||
| precip = 477 water budget = dry slope = 0 soil = shallow | |||||
| precip = 477 water budget = dry slope = 2 soil = deep | |||||
| precip = 477 water budget = dry slope = 2 soil = moderately deep | |||||
| precip = 477 water budget = dry slope = 2 soil = shallow | |||||
| precip = 477 water budget = dry slope = 9 soil = deep | |||||
| precip = 477 water budget = dry slope = 9 soil = moderately deep | |||||
| precip = 477 water budget = dry slope = 9 soil = shallow | |||||
| precip = 477 water budget = moderately dry slope = 0 soil = deep | |||||
| precip = 477 water budget = moderately dry slope = 0 soil = moderately deep | |||||
| precip = 477 water budget = moderately dry slope = 0 soil = shallow | |||||
| precip = 477 water budget = moderately dry slope = 2 soil = deep | |||||
| precip = 477 water budget = moderately dry slope = 2 soil = moderately deep | |||||
| precip = 477 water budget = moderately dry slope = 2 soil = shallow | |||||
| precip = 477 water budget = moderately dry slope = 9 soil = deep | |||||
| precip = 477 water budget = moderately dry slope = 9 soil = moderately deep | |||||
| precip = 477 water budget = moderately dry slope = 9 soil = shallow | |||||
| precip = 477 water budget = moderately fresh slope = 0 soil = deep | |||||
| precip = 477 water budget = moderately fresh slope = 0 soil = moderately deep | |||||
| precip = 477 water budget = moderately fresh slope = 0 soil = shallow | |||||
| precip = 477 water budget = moderately fresh slope = 2 soil = deep | |||||
| precip = 477 water budget = moderately fresh slope = 2 soil = moderately deep | |||||
| precip = 477 water budget = moderately fresh slope = 2 soil = shallow | |||||
| precip = 477 water budget = moderately fresh slope = 9 soil = deep | |||||
| precip = 477 water budget = moderately fresh slope = 9 soil = moderately deep | |||||
| precip = 477 water budget = moderately fresh slope = 9 soil = shallow | |||||
| precip = 671 water budget = dry slope = 0 soil = deep | |||||
| precip = 671 water budget = dry slope = 0 soil = moderately deep | |||||
| precip = 671 water budget = dry slope = 0 soil = shallow | |||||
| precip = 671 water budget = dry slope = 2 soil = deep | |||||
| precip = 671 water budget = dry slope = 2 soil = moderately deep | |||||
| precip = 671 water budget = dry slope = 2 soil = shallow | |||||
| precip = 671 water budget = dry slope = 9 soil = deep | |||||
| precip = 671 water budget = dry slope = 9 soil = moderately deep | |||||
| precip = 671 water budget = dry slope = 9 soil = shallow | |||||
| precip = 671 water budget = moderately dry slope = 0 soil = deep | |||||
| precip = 671 water budget = moderately dry slope = 0 soil = moderately deep | |||||
| precip = 671 water budget = moderately dry slope = 0 soil = shallow | |||||
| precip = 671 water budget = moderately dry slope = 2 soil = deep | |||||
| precip = 671 water budget = moderately dry slope = 2 soil = moderately deep | |||||
| precip = 671 water budget = moderately dry slope = 2 soil = shallow | |||||
| precip = 671 water budget = moderately dry slope = 9 soil = deep | |||||
| precip = 671 water budget = moderately dry slope = 9 soil = moderately deep | |||||
| precip = 671 water budget = moderately dry slope = 9 soil = shallow | |||||
| precip = 671 water budget = moderately fresh slope = 0 soil = deep | |||||
| precip = 671 water budget = moderately fresh slope = 0 soil = moderately deep | |||||
| precip = 671 water budget = moderately fresh slope = 0 soil = shallow | |||||
| precip = 671 water budget = moderately fresh slope = 2 soil = deep | |||||
| precip = 671 water budget = moderately fresh slope = 2 soil = moderately deep | |||||
| precip = 671 water budget = moderately fresh slope = 2 soil = shallow | |||||
| precip = 671 water budget = moderately fresh slope = 9 soil = deep | |||||
| precip = 671 water budget = moderately fresh slope = 9 soil = moderately deep | |||||
| precip = 671 water budget = moderately fresh slope = 9 soil = shallow |
Appendix B. Additional Tables

Table A2.
Outcome ratios by Fertilizer Treatment (mean ± SE).
Table A2.
Outcome ratios by Fertilizer Treatment (mean ± SE).
| Value | Dead | Alive |
|---|---|---|
| ArGr_10 | 0.506885 ± 8.5044 | 0.493115 ± 8.5044 |
| ArGr_5 | 0.476305 ± 8.4956 | 0.523695 ± 8.4956 |
| BP_100 | 0.491081 ± 8.5038 | 0.508919 ± 8.5038 |
| BP_50 | 0.485127 ± 8.5014 | 0.514873 ± 8.5014 |
| Control | 0.510685 ± 8.5032 | 0.489315 ± 8.5032 |

Table A3.
Outcome ratios by Precipitation (mean ± SE).
Table A3.
Outcome ratios by Precipitation (mean ± SE).
| Value | Dead | Alive |
|---|---|---|
| 477 | 0.580736 ± 5.3086 | 0.419264 ± 5.3086 |
| 671 | 0.407297 ± 5.2859 | 0.592703 ± 5.2859 |

Table A4.
Outcome ratios by Water Budget (mean ± SE).
Table A4.
Outcome ratios by Water Budget (mean ± SE).
| Value | Dead | Alive |
|---|---|---|
| dry | 0.450725 ± 6.5560 | 0.549275 ± 6.5560 |
| moderately dry | 0.442127 ± 6.5438 | 0.557873 ± 6.5438 |
| moderately fresh | 0.589198 ± 6.4824 | 0.410802 ± 6.4824 |

Table A5.
Outcome ratios by Slope (mean ± SE).
Table A5.
Outcome ratios by Slope (mean ± SE).
| Value | Dead | Alive |
|---|---|---|
| 0 | 0.506921 ± 1.2027 | 0.493079 ± 1.2027 |
| 2 | 0.539589 ± 1.1990 | 0.460411 ± 1.1990 |
| 9 | 0.573698 ± 1.1897 | 0.426302 ± 1.1897 |

Table A6.
Outcome ratios by Soil Depth (mean ± SE).
Table A6.
Outcome ratios by Soil Depth (mean ± SE).
| Value | Dead | Alive |
|---|---|---|
| deep | 0.544055 ± 6.5625 | 0.455945 ± 6.5625 |
| moderately deep | 0.580222 ± 6.5027 | 0.419778 ± 6.5027 |
| shallow | 0.357773 ± 6.3159 | 0.642227 ± 6.3159 |

Table A7.
Outcome ratios by microrelief (mean ± SE).
Table A7.
Outcome ratios by microrelief (mean ± SE).
| Value | Dead | Alive |
|---|---|---|
| balanced | 0.545934 ± 5.3564 | 0.454066 ± 5.3564 |
| rough | 0.442100 ± 5.3430 | 0.557900 ± 5.3430 |

Table A8.
Outcome ratios by Mesorelief (mean ± SE).
Table A8.
Outcome ratios by Mesorelief (mean ± SE).
| Value | Dead | Alive |
|---|---|---|
| flatland | 0.546614 ± 7.5741 | 0.453386 ± 7.5741 |
| mid slope | 0.861416 ± 5.2568 | 0.138584 ± 5.2568 |
| plane | 0.329478 ± 7.1512 | 0.670522 ± 7.1512 |
| ridge | 0.238559 ± 6.4845 | 0.761441 ± 6.4845 |

Table A9.
Outcome ratios by Macrorelief (mean ± SE).
Table A9.
Outcome ratios by Macrorelief (mean ± SE).
| Value | Dead | Alive |
|---|---|---|
| flatland | 0.482215 ± 7.6024 | 0.517785 ± 7.6024 |
| plateau | 0.474531 ± 7.5974 | 0.525469 ± 7.5974 |
| slope flattening | 0.491034 ± 7.6060 | 0.508966 ± 7.6060 |
| slope steepening | 0.528287 ± 7.5951 | 0.471713 ± 7.5951 |

Table A10.
Outcome ratios by Site Number (mean ± SE).
Table A10.
Outcome ratios by Site Number (mean ± SE).
| Value | Dead | Alive |
|---|---|---|
| 24 | 0.467961 ± 8.4877 | 0.532039 ± 8.4877 |
| 3 | 0.494895 ± 8.5047 | 0.505105 ± 8.5047 |
| 4 | 0.464814 ± 8.4841 | 0.535186 ± 8.4841 |
| 5 | 0.514576 ± 8.5016 | 0.485424 ± 8.5016 |
| 6 | 0.527837 ± 8.4920 | 0.472163 ± 8.4920 |

Table A11.
Outcome ratios by Planting Method (mean ± SE).
Table A11.
Outcome ratios by Planting Method (mean ± SE).
| Value | Dead | Alive |
|---|---|---|
| angle hole planting | 0.494611 ± 5.3788 | 0.505389 ± 5.3788 |
| machine | 0.493422 ± 5.3787 | 0.506578 ± 5.3787 |

Table A12.
Outcome ratios by Surface Water (mean ± SE).
Table A12.
Outcome ratios by Surface Water (mean ± SE).
| Value | Dead | Alive |
|---|---|---|
| no surface runoff | 0.483230 ± 5.3761 | 0.516770 ± 5.3761 |
| runoff eq inflow | 0.504803 ± 5.3789 | 0.495197 ± 5.3789 |
References
- Seidl, R.; Thom, D.; Kautz, M.; Martin-Benito, D.; Peltoniemi, M.; Vacchiano, G.; Wild, J.; Ascoli, D.; Petr, M.; Honkaniemi, J.; et al. Forest disturbances under climate change. Nat. Clim. Change 2017, 7, 395–402. [Google Scholar] [CrossRef]
- Allen, C.D.; Macalady, A.K.; Chenchouni, H.; Bachelet, D.; McDowell, N.; Vennetier, M.; Kitzberger, T.; Rigling, A.; Breshears, D.D.; Hogg, E.T.; et al. A global overview of drought and heat-induced tree mortality reveals emerging climate change risks for forests. For. Ecol. Manag. 2010, 259, 660–684. [Google Scholar] [CrossRef]
- Millar, C.I.; Stephenson, N.L. Temperate forest health in an era of emerging megadisturbance. Science 2015, 349, 823–826. [Google Scholar] [CrossRef] [PubMed]
- Johnstone, J.F.; Allen, C.D.; Franklin, J.F.; Frelich, L.E.; Harvey, B.J.; Higuera, P.E.; Mack, M.C.; Meentemeyer, R.K.; Metz, M.R.; Perry, G.L.; et al. Changing disturbance regimes, ecological memory, and forest resilience. Front. Ecol. Environ. 2016, 14, 369–378. [Google Scholar] [CrossRef]
- Forzieri, G.; Girardello, M.; Ceccherini, G.; Spinoni, J.; Feyen, L.; Hartmann, H.; Beck, P.; Camps-Valls, G.; Chirici, G.; Mauri, A.; et al. Emergent vulnerability to climate-driven disturbances in European forests. Nat. Commun. 2021, 12, 1081. [Google Scholar] [CrossRef] [PubMed]
- Wessely, J.; Essl, F.; Fiedler, K.; Gattringer, A.; Hülber, B.; Ignateva, O.; Moser, D.; Rammer, W.; Dullinger, S.; Seidl, R. A climate-induced tree species bottleneck for forest management in Europe. Nat. Ecol. Evol. 2024, 8, 1109–1117. [Google Scholar] [CrossRef]
- Jalonen, R.; Valette, M.; Boshier, D.; Duminil, J.; Thomas, E. Forest and landscape restoration severely constrained by a lack of attention to the quantity and quality of tree seed: Insights from a global survey. Conserv. Lett. 2018, 11, e12424. [Google Scholar] [CrossRef]
- Ouyang, S.; Tie, L.; Saurer, M.; Bose, A.K.; Duan, H.; Li, M.H.; Xu, X.; Shen, W.J.; Gessler, A. Divergent role of nutrient availability in determining drought responses of sessile oak and Scots pine seedlings: Evidence from 13C and 15N dual labeling. Tree Physiol. 2023, 44, tpad105. [Google Scholar] [CrossRef]
- Ovalle, J.; Arellano, E.; Ginocchio, R.; Becerra, P. Fertilizer location modifies root zone salinity, root morphology, and water-stress resistance of tree seedlings according to the watering regime in a dryland reforestation. J. Plant Nutr. Soil Sci. 2016, 179, 223–233. [Google Scholar] [CrossRef]
- Näsholm, T.; Kielland, K.; Ganeteg, U. Uptake of organic nitrogen by plants. New Phytol. 2009, 182, 31–48. [Google Scholar] [CrossRef]
- Bose, A.; Scherrer, D.; Camarero, J.; Ziche, D.; Babst, F.; Bigler, C.; Bolte, A.; Dorado-Liñán, I.; Etzold, S.; Fonti, P.; et al. Climate sensitivity and drought seasonality determine post-drought growth recovery of Quercus petraea and Quercus robur in Europe. Sci. Total Environ. 2021, 784, 147222. [Google Scholar] [CrossRef] [PubMed]
- Berger, T.W.; Glatzel, G. Response of Quercus petraea seedlings to nitrogen fertilization. For. Ecol. Manag. 2001, 149, 1–14. [Google Scholar] [CrossRef]
- Vernay, A.; Malagoli, P.; Fernandez, M.; Pérot, T.; Améglio, T.; Balandier, P. Carry-over Benefit of High Internal N Pool on Growth and Function of Oak Seedlings (Quercus petraea) Competing with Deschampsia cespitosa. For. Ecol. Manag. 2018, 419–420, 130–138. [Google Scholar] [CrossRef]
- Dziedek, C.; Grams, T.E.E.; Matyssek, R.; Pretzsch, H.; Rosenkranz, M.; Haberle, K.H.; Rennenberg, H.; Simon, J.; Evers, J.; Dieler, J.; et al. Nitrogen Addition Enhances Drought Sensitivity of Young Deciduous Tree Species. Front. Plant Sci. 2016, 7, 1100. [Google Scholar] [CrossRef]
- Nicolescu, V.N.; Vor, T.; Brus, R.; Đodan, M.; Perić, S.; Podrázský, V.; Andrašev, S.; Tsavkov, E.; Ayan, S.; Yücedağ, C.; et al. Management of sessile oak (Quercus petraea (Matt.) Liebl.), a major forest species in Europe. J. For. Res. 2025, 36, 78. [Google Scholar] [CrossRef]
- Annighöfer, P.; Beckschäfer, P.; Vor, T.; Ammer, C. Regeneration Patterns of European Oak Species (Quercus petraea (Matt.) Liebl., Quercus robur L.) in Dependence of Environment and Neighborhood. PLoS ONE 2015, 10, e0134935. [Google Scholar] [CrossRef]
- Kormanek, M.; Głąb, T.; Banach, J.; Szewczyk, G. Effects of soil bulk density on sessile oak Quercus petraea Liebl. seedlings. Eur. J. For. Res. 2015, 134, 969–979. [Google Scholar] [CrossRef]
- Marshall, L.A.; Fornwalt, P.J.; Stevens-Rumann, C.S.; Rodman, K.C.; Chapman, T.B.; Schloegel, C.A.; Stevens, J.T. What influences planted tree seedling survival in burned Colorado montane forests? For. Ecol. Manag. 2024, 572, 122321. [Google Scholar] [CrossRef]
- Petersson, L.K.; Dey, D.C.; Felton, A.M.; Gardiner, E.S.; Löf, M. Influence of Canopy Openness, Ungulate Exclosure, and Low-Intensity Fire for Improved Oak Regeneration in Temperate Europe. Ecol. Evol. 2020, 10, 2626–2637. [Google Scholar] [CrossRef]
- Barrere, J.; Petersson, L.K.; Boulanger, V.; Collet, C.; Felton, A.M.; Löf, M.; Saïd, S. Canopy Openness and Exclusion of Wild Ungulates Act Synergistically to Improve Oak Natural Regeneration. For. Ecol. Manag. 2021, 487, 118976. [Google Scholar] [CrossRef]
- Österreichische Bundesforste AG. ÖBf Forschungsbericht 2024/25. Technical Report. 2024. Available online: https://www.bundesforste.at/fileadmin/forschung/OEBf_Forschungsbericht_2024.pdf (accessed on 8 October 2025).
- Arevo AB. Arevo—Organic Nitrogen Based on Amino Acids. 2025. Available online: https://arevo.se/en/ (accessed on 8 October 2025).
- Mallinger, K.; Raubitzek, S.; Neubauer, T.; Lade, S. Potentials and limitations of complexity research for environmental sciences and modern farming applications. Curr. Opin. Environ. Sustain. 2024, 67, 101429. [Google Scholar] [CrossRef]
- Raubitzek, S.; Hartlieb, M.; König, P.; Hinderling, J.; Mallinger, K. Multi-Class Machine Learning to Quantify the Impact of Nitrogen Management Practices on Grassland Biomass. Nitrogen 2025, 6, 52. [Google Scholar] [CrossRef]
- Gómez-Aparicio, L.; Pérez-Ramos, I.; Mendoza, I.; Matías, L.; Quero, J.; Castro, J.; Zamora, R.; Marañón, T. Oak seedling survival and growth along resource gradients in Mediterranean forests: Implications for regeneration in current and future environmental scenarios. Oikos 2008, 117, 1683–1699. [Google Scholar] [CrossRef]
- Öhlund, J.; Näsholm, T. Low nitrogen losses with a new source of nitrogen for cultivation of conifer seedlings. Environ. Sci. Technol. 2002, 36, 4854–4859. [Google Scholar] [CrossRef]
- Toker, D.; Sommer, F.T.; D’Esposito, M. A simple method for detecting chaos in nature. Commun. Biol. 2020, 3, 11. [Google Scholar] [CrossRef]
- Raubitzek, S.; Neubauer, T.; Friedrich, J.; Rauber, A. Interpolating Strange Attractors via Fractional Brownian Bridges. Entropy 2022, 24, 718. [Google Scholar] [CrossRef]
- Schuldt, B.; Buras, A.; Arend, M.; Vitasse, Y.; Beierkuhnlein, C.; Damm, A.; Gharun, M.; Grams, T.; Hauck, M.; Hajek, P.; et al. A first assessment of the impact of the extreme 2018 summer drought on Central European forests. Basic Appl. Ecol. 2020, 45, 86–103. [Google Scholar] [CrossRef]
- Hänsel, S.; Ustrnul, Z.; Łupikasza, E.; Skalák, P. Assessing seasonal drought variations and trends over Central Europe. Adv. Water Resour. 2019, 127, 53–75. [Google Scholar] [CrossRef]
- Teuchert, H. The Efficiency of Different Tree Planting Methods with and Without Hydrogel Amendment. Master’s Thesis, University of Natural Resources and Life Sciences, Vienna (BOKU), Vienna, Austria, 2024. [Google Scholar]
- van Loo, M.; Rewald, B.; Neophytou, C.; Klumpp, R.T.; Trujillo-Moya, C.; Konrad, H. Klimafitte Wälder: Herkunftswahl und Pflanzverfahren (WF-ProjektWaldFIT). Project Report, Research Information and Partner Publication. 2022. Available online: https://dafne.at/projekte/wf-projekt-waldfit (accessed on 10 March 2025).
- GeoSphere Austria. GeoSphere Austria Data Hub/Dataset API and Online Data Services. Online Data Repository, APIs, Maps, and Geoscientific Data Services. 2025. Available online: https://data.hub.geosphere.at/ (accessed on 10 March 2025).
- Prokhorenkova, L.; Gusev, G.; Vorobev, A.; Dorogush, A.V.; Gulin, A. CatBoost: Unbiased boosting with categorical features. In Proceedings of the 2018 Conference on Neural Information Processing Systems—NeurIPS2018, Montreal, BC, Canada, 2–8 December 2018; pp. 6638–6648. [Google Scholar]
- Dorogush, A.V.; Ershov, V.; Gulin, A. CatBoost: Gradient boosting with categorical features support. In Proceedings of the Workshop on ML Systems at NeurIPS, Long Beach, CA, USA, 8 December 2017. [Google Scholar]
- Quinlan, J.R. Induction of Decision Trees. Mach. Learn. 1986, 1, 81–106. [Google Scholar] [CrossRef]
- Breiman, L. Random Forests. Mach. Learn. 2001, 45, 5–32. [Google Scholar] [CrossRef]
- Raubitzek, S.; Corpaci, L.; Hofer, R.; Mallinger, K. Scaling Exponents of Time Series Data: A Machine Learning Approach. Entropy 2023, 25, 1671. [Google Scholar] [CrossRef]
- Raubitzek, S.; Mallinger, K. On the Applicability of Quantum Machine Learning. Entropy 2023, 25, 992. [Google Scholar] [CrossRef]
- Corpaci, L.; Wagner, M.; Raubitzek, S.; Kampel, L.; Mallinger, K.; Simos, D.E. Estimating Combinatorial t-Way Coverage Based on Matrix Complexity Metrics. In Testing Software and Systems; Menéndez, H.D., Bello-Orgaz, G., Barnard, P., Bautista, J.R., Farahi, A., Dash, S., Han, D., Fortz, S., Rodriguez-Fernandez, V., Eds.; Springer: Cham, Switzerland, 2025; pp. 3–20. [Google Scholar]
- Pedregosa, F.; Varoquaux, G.; Gramfort, A.; Michel, V.; Thirion, B.; Grisel, O.; Blondel, M.; Prettenhofer, P.; Weiss, R.; Dubourg, V.; et al. Scikit-learn: Machine Learning in Python. J. Mach. Learn. Res. 2011, 12, 2825–2830. [Google Scholar]
- Developers, C. Feature Importance Calculation in CatBoost. 2024. Available online: https://catboost.ai/docs/en/features/feature-importances-calculation (accessed on 10 March 2025).
- Meeran, K.; Grabner, M.; Schott, K.; Wächter, E.; van Loo, M.; Watzinger, A. Tree size and site environment affects sessile oak growth and intrinsic water-use efficiency response to wet-dry years. For. Ecol. Manag. 2025, 577, 122413. [Google Scholar] [CrossRef]
- Henriksson, N.; Lim, H.; Marshall, J.; Franklin, O.; McMurtrie, R.; Lutter, R.; Magh, R.K.; Lundmark, T.; Näsholm, T. Tree water uptake enhances nitrogen acquisition in a fertilized boreal forest—But not under nitrogen poor conditions. New Phytol. 2021, 232, 113–122. [Google Scholar] [CrossRef] [PubMed]
- Sikström, U.; Hjelm, K.; Hanssen, K.; Saksa, T.; Wallertz, K. Influence of mechanical site preparation on regeneration success of planted conifers in clearcuts in Fennoscandia—A review. Silva Fenn. 2020, 54, 10172. [Google Scholar] [CrossRef]
- Zhang, S.; Zheng, Q.; Noll, L.; Hu, Y.; Wanek, W. Environmental effects on soil microbial nitrogen use efficiency are controlled by allocation of organic nitrogen to microbial growth and regulate gross N mineralization. Soil Biol. Biochem. 2019, 135, 304–315. [Google Scholar] [CrossRef]
- Biro, A.; Wong, M.Y.; Lucas, J.M.; Batterman, S.A.; Staver, A.C. Native soil microbes buffer savanna trees against nutrient limitation but are drought sensitive. J. Ecol. 2025, 113, 1521–1531. [Google Scholar] [CrossRef]
- Jordan, D.; Ponder, F., Jr.; Hubbard, V.C. Effects of soil compaction, forest leaf litter and nitrogen fertilizer on two oak species and microbial activity. Appl. Soil Ecol. 2003, 23, 33–41. [Google Scholar] [CrossRef]
- Zhu, C.; Xiang, J.; Zhang, Y.; Zhang, Y.; Zhu, D.; Chen, H. Mechanized transplanting with side deep fertilization increases yield and nitrogen use efficiency of rice in Eastern China. Sci. Rep. 2019, 9, 5653. [Google Scholar] [CrossRef]
- North, M.P.; Stevens, J.T.; Greene, D.F.; Coppoletta, M.; Knapp, E.E.; Latimer, A.M.; Restaino, C.M.; Tompkins, R.E.; Welch, K.R.; York, R.A.; et al. Tamm Review: Reforestation for resilience in dry western U.S. forests. For. Ecol. Manag. 2019, 432, 209–224. [Google Scholar] [CrossRef]
Disclaimer/Publisher’s Note: The statements, opinions and data contained in all publications are solely those of the individual author(s) and contributor(s) and not of MDPI and/or the editor(s). MDPI and/or the editor(s) disclaim responsibility for any injury to people or property resulting from any ideas, methods, instructions or products referred to in the content. |
© 2025 by the authors. Licensee MDPI, Basel, Switzerland. This article is an open access article distributed under the terms and conditions of the Creative Commons Attribution (CC BY) license (https://creativecommons.org/licenses/by/4.0/).