Article

Remote Screening of Nitrogen Uptake and Biomass Formation in Irrigated and Rainfed Wheat

1
Department of Computer Engineering, University of Harran, Osmanbey Campus, 63050 Sanliurfa, Turkey
2
Institute of Soil Science and Plant Nutrition, Faculty of Agriculture, University of Harran, Osmanbey Campus, 63050 Sanliurfa, Turkey
3
GAP Regional Development Administration, 63000 Sanliurfa, Turkey
4
Agrosphere Institute IBG-3, Forschungszentrum Jülich GmbH, 52425 Jülich, Germany
5
School of Natural Sciences, Bangor University, Bangor LL57 2UW, UK
*
Author to whom correspondence should be addressed.
These authors contributed equally to this work.
Nitrogen 2025, 6(3), 82; https://doi.org/10.3390/nitrogen6030082
Submission received: 8 August 2025 / Revised: 1 September 2025 / Accepted: 2 September 2025 / Published: 9 September 2025

Abstract

Sustainable nitrogen (N) management in arable crops requires the real-time assessment of crop growth and N uptake, particularly in water-limited environments. In the present study, we conducted two large-scale field experiments with rainfed and irrigated wheat in South-East Turkey to evaluate the effectiveness of drone- and satellite-based spectral indices, in combination with neural network models, for estimating biomass and nitrogen uptake. Four N fertilizer rates in the irrigated fields (N0: 0, N6: 60, N12: 120, and N16: 160 kg N ha−1) and five N rates in the rainfed fields (N0: 0, N2: 20, N4: 40, N5: 50, and N6: 60 kg N ha−1) were tested. Highest fresh biomass was 57.7 ± 1.1 and 15.9 ± 1.0 t/ha−1 for irrigated and rainfed treatments, respectively, with 2.5-fold higher grain yield in irrigated (8.2 ± 1.2 t/ha−1) compared to rainfed (2.9 ± 0.9 t/ha−1) wheat. Drone-based spectral indices, especially those based on the red-edge region (CLRed_edge), correlated strongly with biomass (R2 > 0.9 in irrigated wheat) but failed to explain crop N concentration throughout the vegetation period. This limitation was attributed to the nitrogen dilution effect, where increasing biomass during crop growth leads to a decline in the concentration of nitrogen, complicating its accurate estimation via remote sensing. To address this, we employed a two-layer feed-forward neural network model and used SPAD and plant height values as supplementary input parameters to enhance estimations based on vegetation indices. This approach substantially enhanced the predictions of N uptake (R2 up to 0.95), while even simplified model version using only NDVI and plant height parameters achieved significant performance (R2 = 0.84). Overall, our results showed that spectral indices are reliable predictors of biomass but insufficient for estimating nitrogen concentration or uptake. Integrating indices with complementary crop traits in nonlinear models provides acceptable estimates of N uptake, supporting more precise fertilizer management and sustainable wheat production under water-limited conditions.

1. Introduction

Together with rice and maize, wheat accounts for nearly half of the world’s food calories and two-fifths of protein intake. Excessive use of nitrogen fertilizers to achieve higher wheat yields can result in negative impacts on both the environment and farmers’ income [1,2]. Potential environmental consequences of nitrogen overuse include soil acidification, eutrophication of water bodies, and greenhouse gas emissions [3]. In contrast, the underuse of nitrogen fertilizer can lead to decreased crop yield and quality, thereby adversely affecting global food security.
Accurately mapping the spatial distribution of crop nitrogen uptake and demand throughout growth is crucial for monitoring plant stress and crop health [4]. This information can then be utilized to optimize fertilizer management based on dynamic yield forecasts. Remote sensing techniques provide a resource-efficient approach for modelling crop health in a continuous spatial manner at regular time intervals [3,5,6]. The absorption of light in the visible region of the spectrum (450–680 nm) by photosynthetic pigments such as chlorophyll a and b, or carotenoids, has been well documented [7], and the content of these pigments are known to be affected by the nitrogen status of crops, among other factors [8]. The “red-edge” region (680–780 nm), lying between the visible and near-infrared (NIR) regions, is known to be related to the levels of chlorophyll content which can be used as an indicator of crop nitrogen status [9]. Additionally, reflectance at longer wavelengths, such as the NIR (780–1100 nm) regions, which penetrate deeper into leaves, is influenced by internal leaf structure and composition, including plant biochemical content [10]. The normalized difference vegetation index (NDVI) is a widely used spectral index that measures the difference between the reflectance values of near-infrared and red wavelengths and is positively correlated with crop yield and biomass in wheat [11,12,13]. Other spectral indices, such as the green normalized difference vegetation index (GNDVI), soil-adjusted vegetation index (SAVI), and plant senescence reflectance index (PSRI), have also been used to estimate crop yield and nitrogen status in wheat and other crops [14,15,16].
The use of remote sensing techniques to estimate crop nitrogen uptake and optimize nitrogen management in crop production is a complex and evolving field that requires a multidisciplinary approach. The reflectance spectra collected from large fields usually contain a mixture of both crop and soil information due to the limited canopy coverage at early vegetation stages. Additionally, spectral indices lose sensitivity for deriving crop N status in later growth stages under moderate to high biomass conditions [17,18]. Restricted crop growth under water stress may also diminish the accuracy of spectral indices in estimating crop nitrogen uptake [19]. Statistical models are typically established between measured spectral indices and crop nutrient content, often normalized by reflectance in wavelengths that are sensitive to leaf or canopy size/structure [13]. To overcome these problems, a number of vegetation indices have been developed to estimate the N status of crops using multispectral data from satellites or drones. However, these indices often have limited capability to predict N uptake accurately across various growth stages of wheat [20,21]. In order to rectify these constraints and augment the precision of crop N uptake estimation, the incorporation of supplementary agronomic input parameters (e.g., leaf area index, plant height or canopy size) becomes imperative. By assimilating easily available simple agronomic input variables with spectral data within sophisticated modelling frameworks, accurate nitrogen uptake kinetics throughout a growth season may be achieved.
More sophisticated nonlinear models that incorporate additional sources of information, such as agronomic and soil data, may improve the accuracy of nitrogen uptake estimates with spectral indices. Non-parametric models, such as artificial neural networks (ANN) [3,22], are expected to enhance crop trait prediction thanks to their ability to find patterns, extract information, and build high-performance predictive models from big datasets [23]. These algorithms can capture the complex relationships between spectral reflectance, plant physiology, and soil properties, and can be used to generate more accurate estimates of crop nitrogen uptake. The dynamics of wheat nitrogen uptake are governed by a multitude of interrelated factors, such as climate, soil type, irrigation, and variety, making it a highly complex process. Therefore, the implementation of site-specific models is essential to accurately capture the interrelated relationships between these factors.
Few studies systematically analyzed the performance of vegetation indices of winter wheat in estimating nitrogen uptake under different irrigation and N fertilization regimes. In this research, we aimed to improve the accuracy of estimating nitrogen uptake dynamics of irrigated and rainfed winter wheat using spectral indices by combining easily available agronomic data. The main objectives are: (i) to identify optimal spectral indices for accurately assessing winter wheat traits such as biomass, nitrogen content, and plant height, under both rainfed and irrigated conditions; and (ii) to enhance the estimation of crop nitrogen uptake by utilizing neural network modelling techniques that incorporate spectral data and crop traits such as plant height.

2. Material and Method

2.1. Experimental Sites and N Fertilizer Treatments

A one-year field experiment was conducted at two experimental sites near Harran Plain, Sanliurfa, Turkey (irrigated field = 37°09′44″ N, 39°00′11″ E; and rainfed field = 37°06′22″ N, 39°00′09″ E). The locations have a mean annual temperature of 17.2 °C and a mean sum of precipitation of 365 mm (long-term averages 2000–2021). The soil was classified as alkaline clay soil (sand 17.8%, silt 26.2%, clay 56.0%) which contained 1.01% total C, 0.11% total N and had a pH of 7.9. Plots of size 2025 m2 (45 × 45 m) were sown with the winter wheat (Triticum aestivum) variety Ovidio. The sowing density was 3.7 million germinating seeds per hectare with a row distance of 0.125 m. Due to the farmer’s farrow irrigation technique common in the region, plots were not randomized. However, to ensure variability, three replicates were placed in the same plots (Supplementary Figure S1A,B). Although large plots ensure data quality, the non-randomized design may introduce spatial confounding (e.g., gradients in soil texture, fertility, micro-relief), potentially obscuring or biasing spectral index–N relationships. We mitigated these risks by sampling across space and dates; nevertheless, residual confounding remains possible and is acknowledged in our interpretation. Four N fertilizer rates in the irrigated field were applied as (i) N0: control without N fertilization, (ii) N6: 60 kg·N·ha−1, (iii) N12: 120 kg N ha−1, and (iv) N16: 160 kg N ha−1 as a top dressing. Rainfed wheat received 5 N level: (i) N0: control without N fertilization, (ii) N2: 20 kg N ha−1, (iii) N4: 40 kg N ha−1, (iv) N5: 50 kg N ha−1, and (v) N6: 60 kg N ha−1 as a top dressing. Urea was given as topdressing N source. In the irrigated fields, the N levels were applied in three equal splits, while in the rainfed fields, the N levels were applied in two equal splits. All plots received 20 kg of diammonium-phosphate ha−1 (DAP) as basal dressing during sowing.

2.2. Plant Samplings and Spectral Analysis

Throughout the growing season, the fresh biomass samples (aboveground biomass) were collected approximately every two weeks resulting in five intermediate sampling points. Plant sampling and drone flights for spectral imaging were performed on the same day on each campaign date (see below for the dates). Here, samples were collected from a 1 m2 square area (random spots chosen from each plot) for biomass and N analysis. To determine the dry weight of the plants, samples were dried at 60 °C until a constant weight was achieved. In addition, SPAD values were recorded at each harvest by using a Minolta SPAD 502 (Konica Minolta, Tokyo, Japan) instrument. Total N in the biomass was determined by the micro-Kjeldahl method.
The multispectral images were taken by unmanned aerial vehicle (Parrot Bluegrass drone with Parrot Sequoia multispectral camera, Paris, France). Drone flights were conducted between 10:00 and 14:00 o’clock at 30 m high resulting in a 10 cm ground sample distance (GSD). Multispectral images consist of the following spectral regions: green (530–570 nm), red (640–680 nm), red-edge (730–740 nm), and near-infrared (770–810 nm). To ensure accurate image capture, the Parrot Sequoia camera was equipped with a sunlight sensor that could assess the light conditions during the shooting process. This feature helped to eliminate the influence of external light conditions and the sensor’s errors, resulting in more reliable data. Additionally, a calibration reference board was used before each flight to enable the software to calibrate the reflectance of the image based on the value provided by the calibration board. The spectral images captured by the Parrot Bluegrass were mosaicked using Pix4D Mapper v.4.8.4 software (Pix4D S.A., Prilly, Switzerland) through the ‘Ag Multispectral’ photogrammetric model pipeline. Radiometric calibration was applied to the generated ortho-mosaics using the reference images of a radiometric calibration target acquired after each flight. Generated ortho-mosaic was used to calculate spectral indices given in Supplementary Table S1. The dates where the images were taken, were as follows; irrigated wheat: (i) 9 February 2021 (BBCH21–23), (ii) 15 February 2021 (BBCH24–25), (iii) 16 March 2021 (BBCH37–39), (iv) 19 April 2021 (BBCH72–75), and (v) 6 May 2021 (BBCH81–83). The flight dates for the rainfed wheat were as follows; rainfed wheat: (i) 9 February 2021 (BBCH21–23), (ii) 5 March 2021 (BBCH31–34), (iii) 2 April 2021 (BBCH55–57), (iv) 23 April 2021 (BBCH81–83), and (v) 4 May 2021 (BBCH91–93). Satellite NDVI values for each plot were calculated by using the Sentinel 2A images with a spatial resolution of 10 m (using bands B04 and B08 (red and near-infrared, respectively) by GAP-Hassas software (https://app.gaphassas.gov.tr, URL accessed on 15 December 2024).
To identify the best vegetation indices and related parameters for estimating wheat nitrogen uptake, we employ a two-layer feed-forward neural network (ANN) model (MATLAB—R2019a). Two-layer feed-forward artificial neural network with sigmoid hidden neurons and linear output neurons is used to estimate nitrogen uptake at various vegetation stages. Data from irrigation and rainfed fields are combined and 70%, 15%, and 15% of the data are used for training, validation, and testing, respectively. These consist first of a feed-forward iteration to calculate the output of the network, as a function of the interconnection weights, based on training input values presented to the input layer. This is then followed by a BPN learning rule, which is an iterative gradient descent algorithm designed to minimize the mean squared error (MSE) between network-predicted outputs and training set values (Supplementary Table S2). Two-layer feed-forward ANNs learn a nonlinear mapping from inputs to a continuous target by passing features through sigmoid hidden units and a linear output, with weights optimized via back-propagation to minimize mean-squared error and validated/tested to control overfitting. For nitrogen-uptake estimation, such models can fuse vegetation indices and structural/phenological parameters to capture interactions and nonlinearities (e.g., index saturation, N-dilution, irrigation effects) that simple regressions miss, yielding more accurate and robust N-uptake predictions across growth stages and environments. With modest n, however, ANN models may overfit. We mitigate via train/validation/test splitting and early stopping, but we acknowledge that generalization uncertainty remains. As a robustness check conceptually aligned with operational deployment, leave-one-field-out (or field/date-out) validation is the recommended standard for transferability; given only two fields, such a split is informative but limited and is therefore discussed as an uncertainty.

2.3. Statistics

Statistically significant differences are evaluated by the general linear model (univariate) using Turkey’s honest significant difference and post hoc tests at a 5% significance level with SPSS 21 software (IBM SPSS Statistics, Chicago, IL, USA).

3. Results

3.1. Crop Parameters During Vegetation

Under irrigated conditions, the aboveground fresh biomass (FBM) increased over time, ranging from 47.5 (±2.2) to 57.7 (±1.1) t/ha−1 at BBCH81–83. The lowest FBM was observed in the N0 treatment, while the highest was observed in the N16 treatment (Table 1). The effect of nitrogen supply on FBM formation was significantly higher only in the N16 treatment as compared to the non-fertilized control treatment (N0) at BBCH81–83. The dry biomass (DM) values showed a similar trend, ranging between 17.3 (±0.6) to 18.2 (±1.2) t/ha−1 with no N fertilizer effect observed. For rainfed wheat, FBM and DM values were about 70% lower than the irrigated wheat treatments. The average grain yields were 8.2 (±1.2) and 2.9 (±0.9) t/ha−1 in irrigated and rainfed soils, respectively.
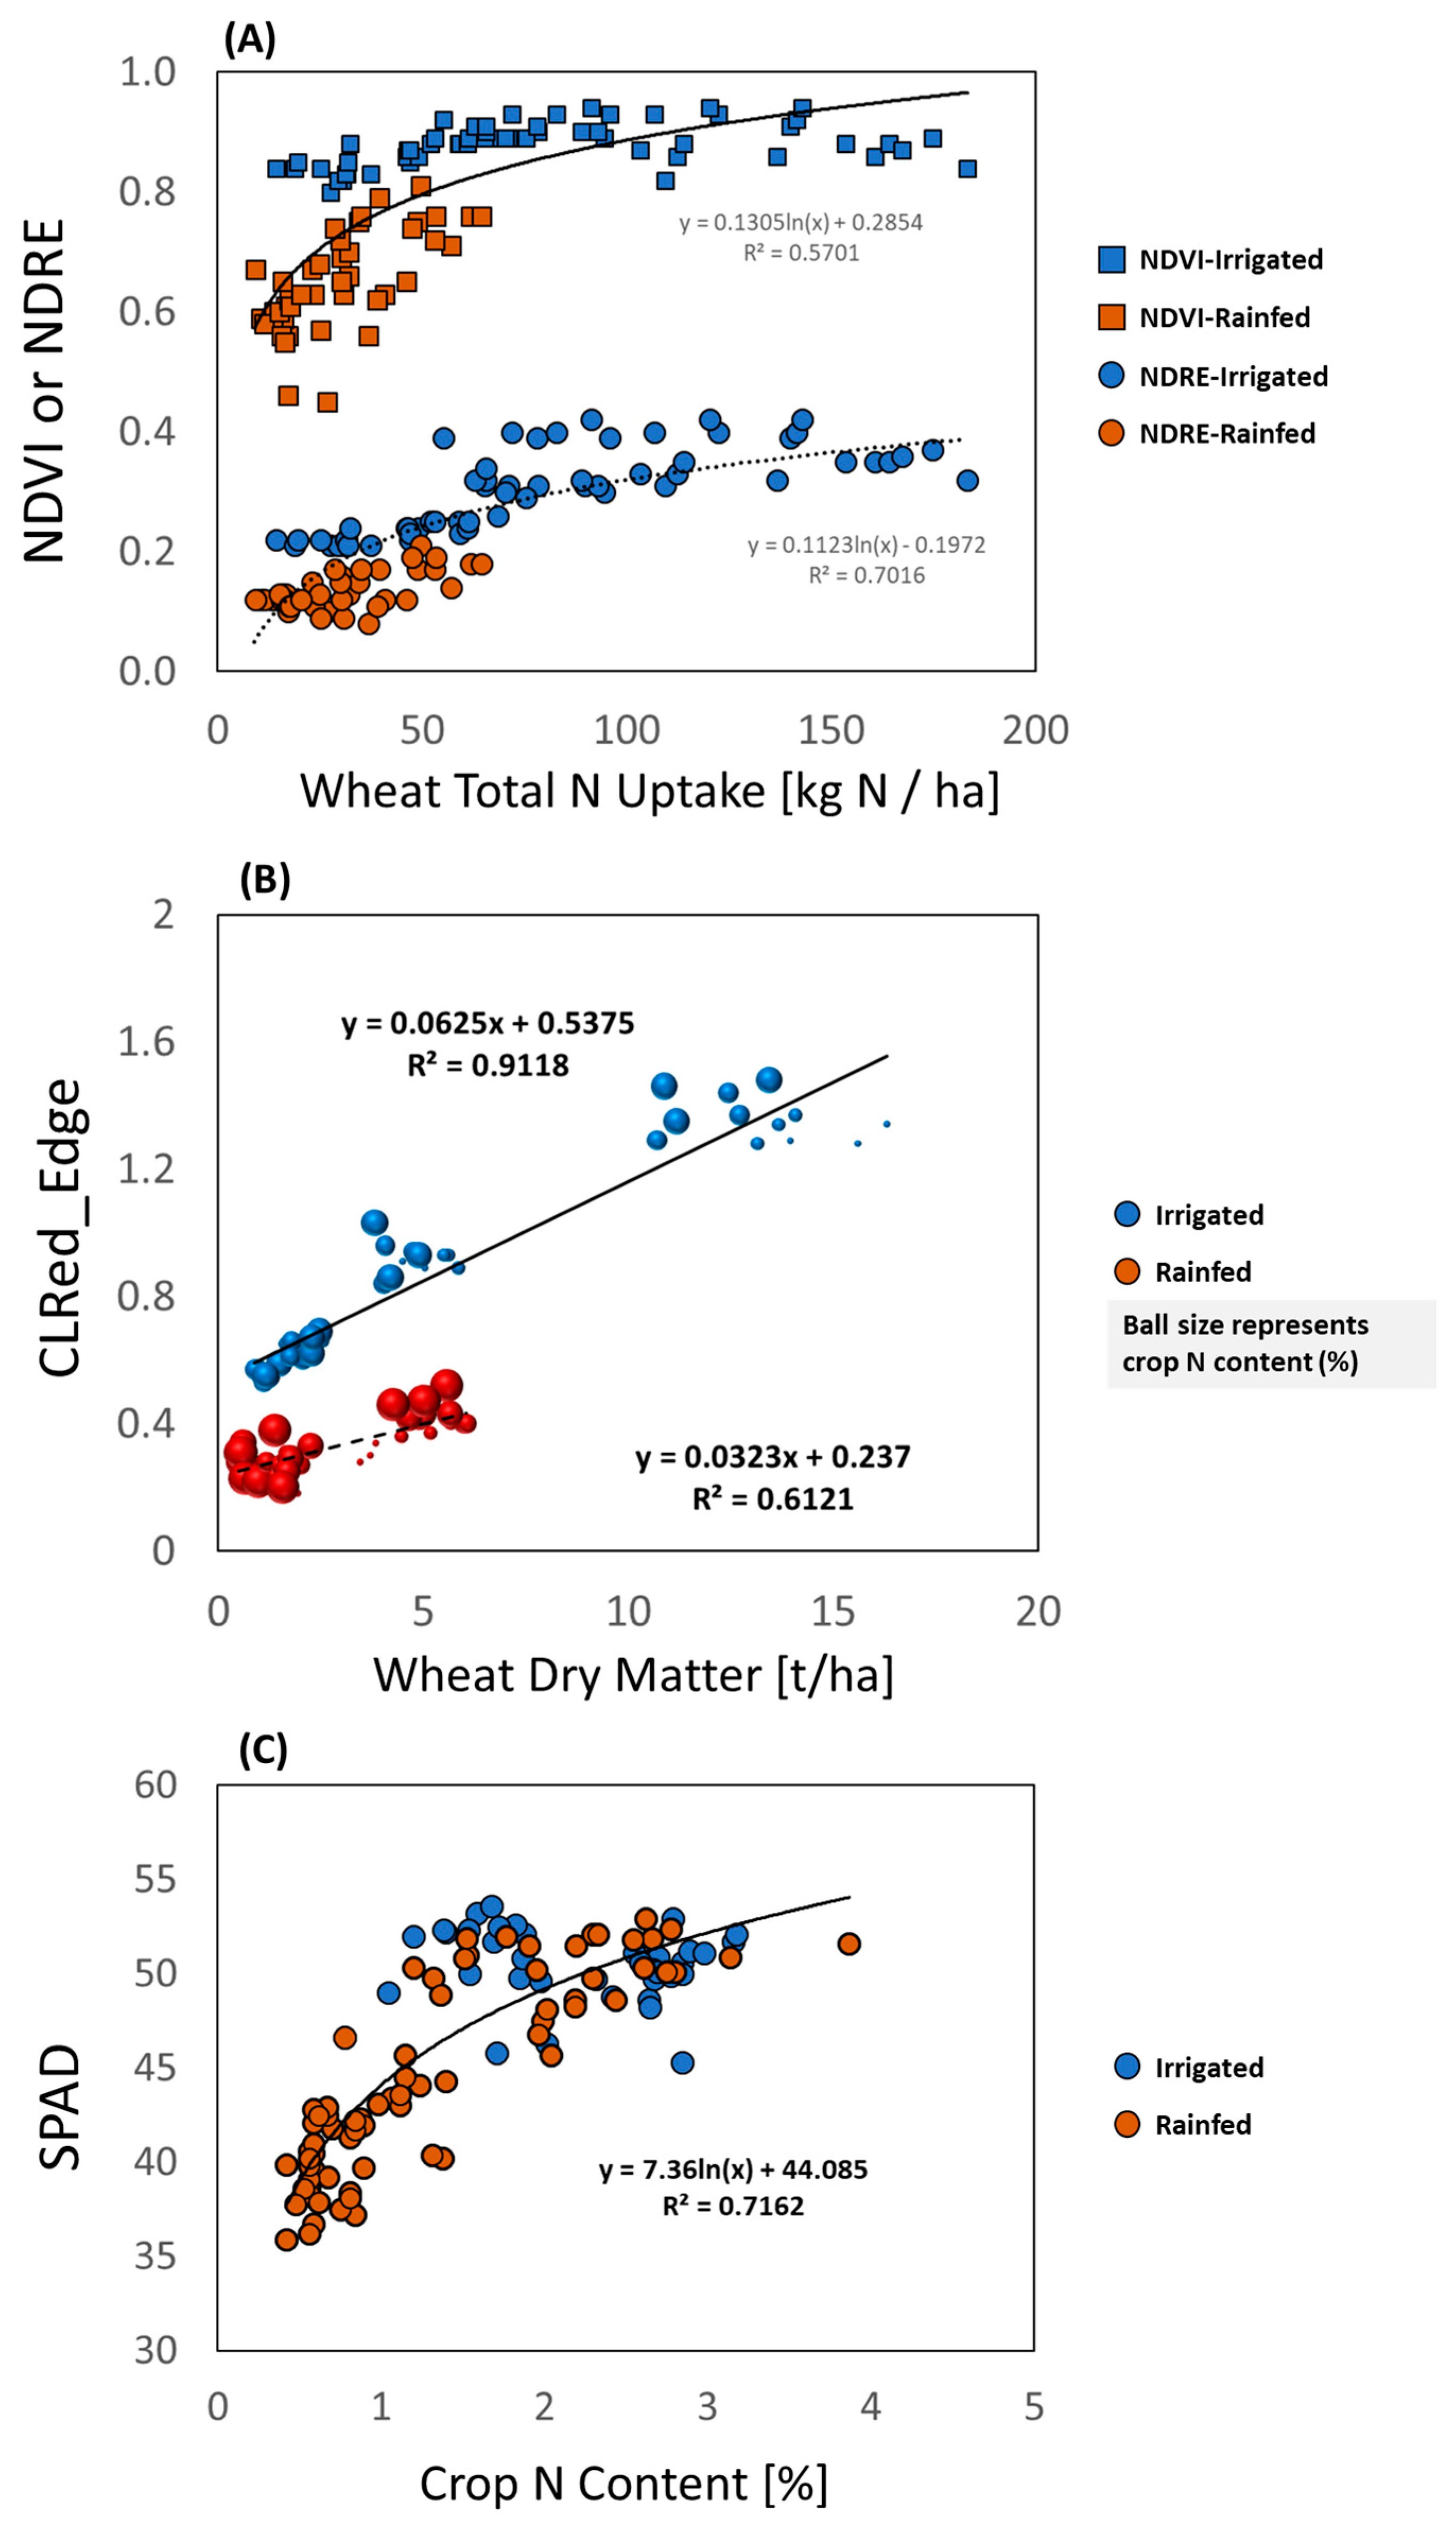
Biomass N concentration and N uptake derived from the aboveground biomass showed significant variation during the growth season (Figure 1). The average biomass N concentration across all treatments was highest at the beginning of the vegetation (2.5 ± 0.21% N in irrigated and 2.5 ± 0.19% N in rainfed), gradually decreasing to 0.7% and 0.5% in irrigated and rainfed wheat, respectively. Biomass N content was highest in high N fertilizer treatments in both irrigated and rainfed wheat at BBCH81–83. In line with the N concentration, SPAD values were also highest at the beginning of the vegetation, gradually decreasing over time in all treatments, with the decrease being more pronounced in rainfed wheat (Figure 1). There was a significant correlation between biomass N content and SPAD values, but only until growth the stage BBCH72–75 (R2 = 0.72, Figure 2). The correlation between SPAD values and biomass N content was less significant (R2 = 0.42) when data were analyzed until BBCH81–83. Total N uptake at BBCH71–75 was about 1.5-fold higher in irrigated soils than in rainfed soils. Overall, the N uptake trend follow the increased in canopy biomass until BBCH81–83. The data clearly suggest that the N uptake parameter is strictly determined by the canopy biomass rather than the crop N concentration. Due to the wide range of variation in biomass, N concentration, and N uptake, our irrigated and rainfed trials feature wider scatter than those of conventional uniformly fertilized fields.

3.2. Relationship Between Crop Variables and Spectral Indices

Figure 3 presents the mean correlation values between selected spectral indices and measured crop parameters. We reveal that most of the examined indices showed a significant relationship with crop parameters, but only until the wheat growth stage BBCH72–75. As nitrogen management practices are typically completed by this stage, we focus on spectral data until BBCH72–75 as it shows a reliable correlation with crop parameters.
Relationship between biomass formation and spectral indices
The aboveground fresh biomass of wheat showed a significant correlation with thirteen remote sensing indices until BBCH72–75. The WDRI, GNDVI, ClGreen, SR, and NDVI indices were highly correlated with fresh biomass (R2 > 0.84), while OSAVI, MCCCL, and SatelliteNDVI values show the least correlation (R2 < 0.60). The SatelliteNDVI indices also showed an acceptable fit with the fresh biomass values (R2 = 0.59). When we analyzed the irrigated and rainfed treatments separately, spectral indices explain more than 90% of the variation in fresh biomass over time in irrigated wheat (Supplementary Table S3), with the highest fit observed with NDRE (R2 = 0.96). However, all indices showed a much lower correlation with fresh biomass in rainfed wheat treatments (Supplementary Table S4), with the highest fit observed with WDRI (R2 = 0.83). Here, the WDRI indices performed very well in explaining the variation in both rainfed (R2 = 0.83) and irrigated wheat (R2 = 0.93).
Dry biomass values showed a weaker correlation with the spectral indices studied. The GNDVI, WDRI, NDVI, and ClGreen spectral indices showed the best fit, whereas OSAVI, MTVI, and MCCR reveal the least correlation with dry biomass when pooled overall data (until BBCH72–75; R2 > 0.71). Similar to the fresh biomass data, almost all spectral indices showed a very good fit with dry biomass in irrigated wheat than in rainfed wheat. Both NDVI and GNDVI perform well in estimating dry biomass, but NDRE show a good fit only in irrigated wheat. Finally, the correlation of plant height values and spectral indices followed almost the same trend as fresh biomass. The comparison between satellite and drone NDVI revealed a strong nonlinear relationship (R2 = 0.83), with satellite NDVI consistently underestimating canopy greenness relative to drone measurements, particularly at high values (Supplementary Figure S2). This reflects the saturation and resolution limitations of satellite imagery, underscoring the need for UAV calibration or integration of additional canopy traits to improve field-level nitrogen management.

3.3. Spectral Indices to Explain Crop Nitrogen Parameters

In our study, almost all spectral indices failed to explain crop N content and show negative correlation values when data pooled over all treatments and dates. These correlation values were more significant in irrigated wheat than in rainfed wheat. Similarly, SPAD values were either not correlated (irrigated wheat) or negatively correlated (rainfed wheat) with spectral indices, further highlighting the challenge in estimating crop N content via spectral indices.
Total N uptake values measured until BBCH72–75 showed a reasonable correlation with the spectral indices. Among the examined indices, WDRI, GNDVI, SR, NDVI, and ClGreen indices showed the best fit (R2 > 0.85) with total N uptake values, while MCCL and OSAVI indices showed the least relationship. When irrigation treatment analyzed separately, the correlation between spectral indices and crop N uptake values was higher in irrigated wheat (up to R2 = 0.91 with GNDVI) than in rainfed wheat (up to R2 = 0.74 with WDRI), in line with the correlation patterns observed for biomass data. These results suggest that these specific spectral indices may be useful for estimating crop N uptake in irrigated wheat, but caution should be taken when using remote sensing techniques for rainfed wheat.

3.4. Neural Network Modelling to Estimate N Uptake

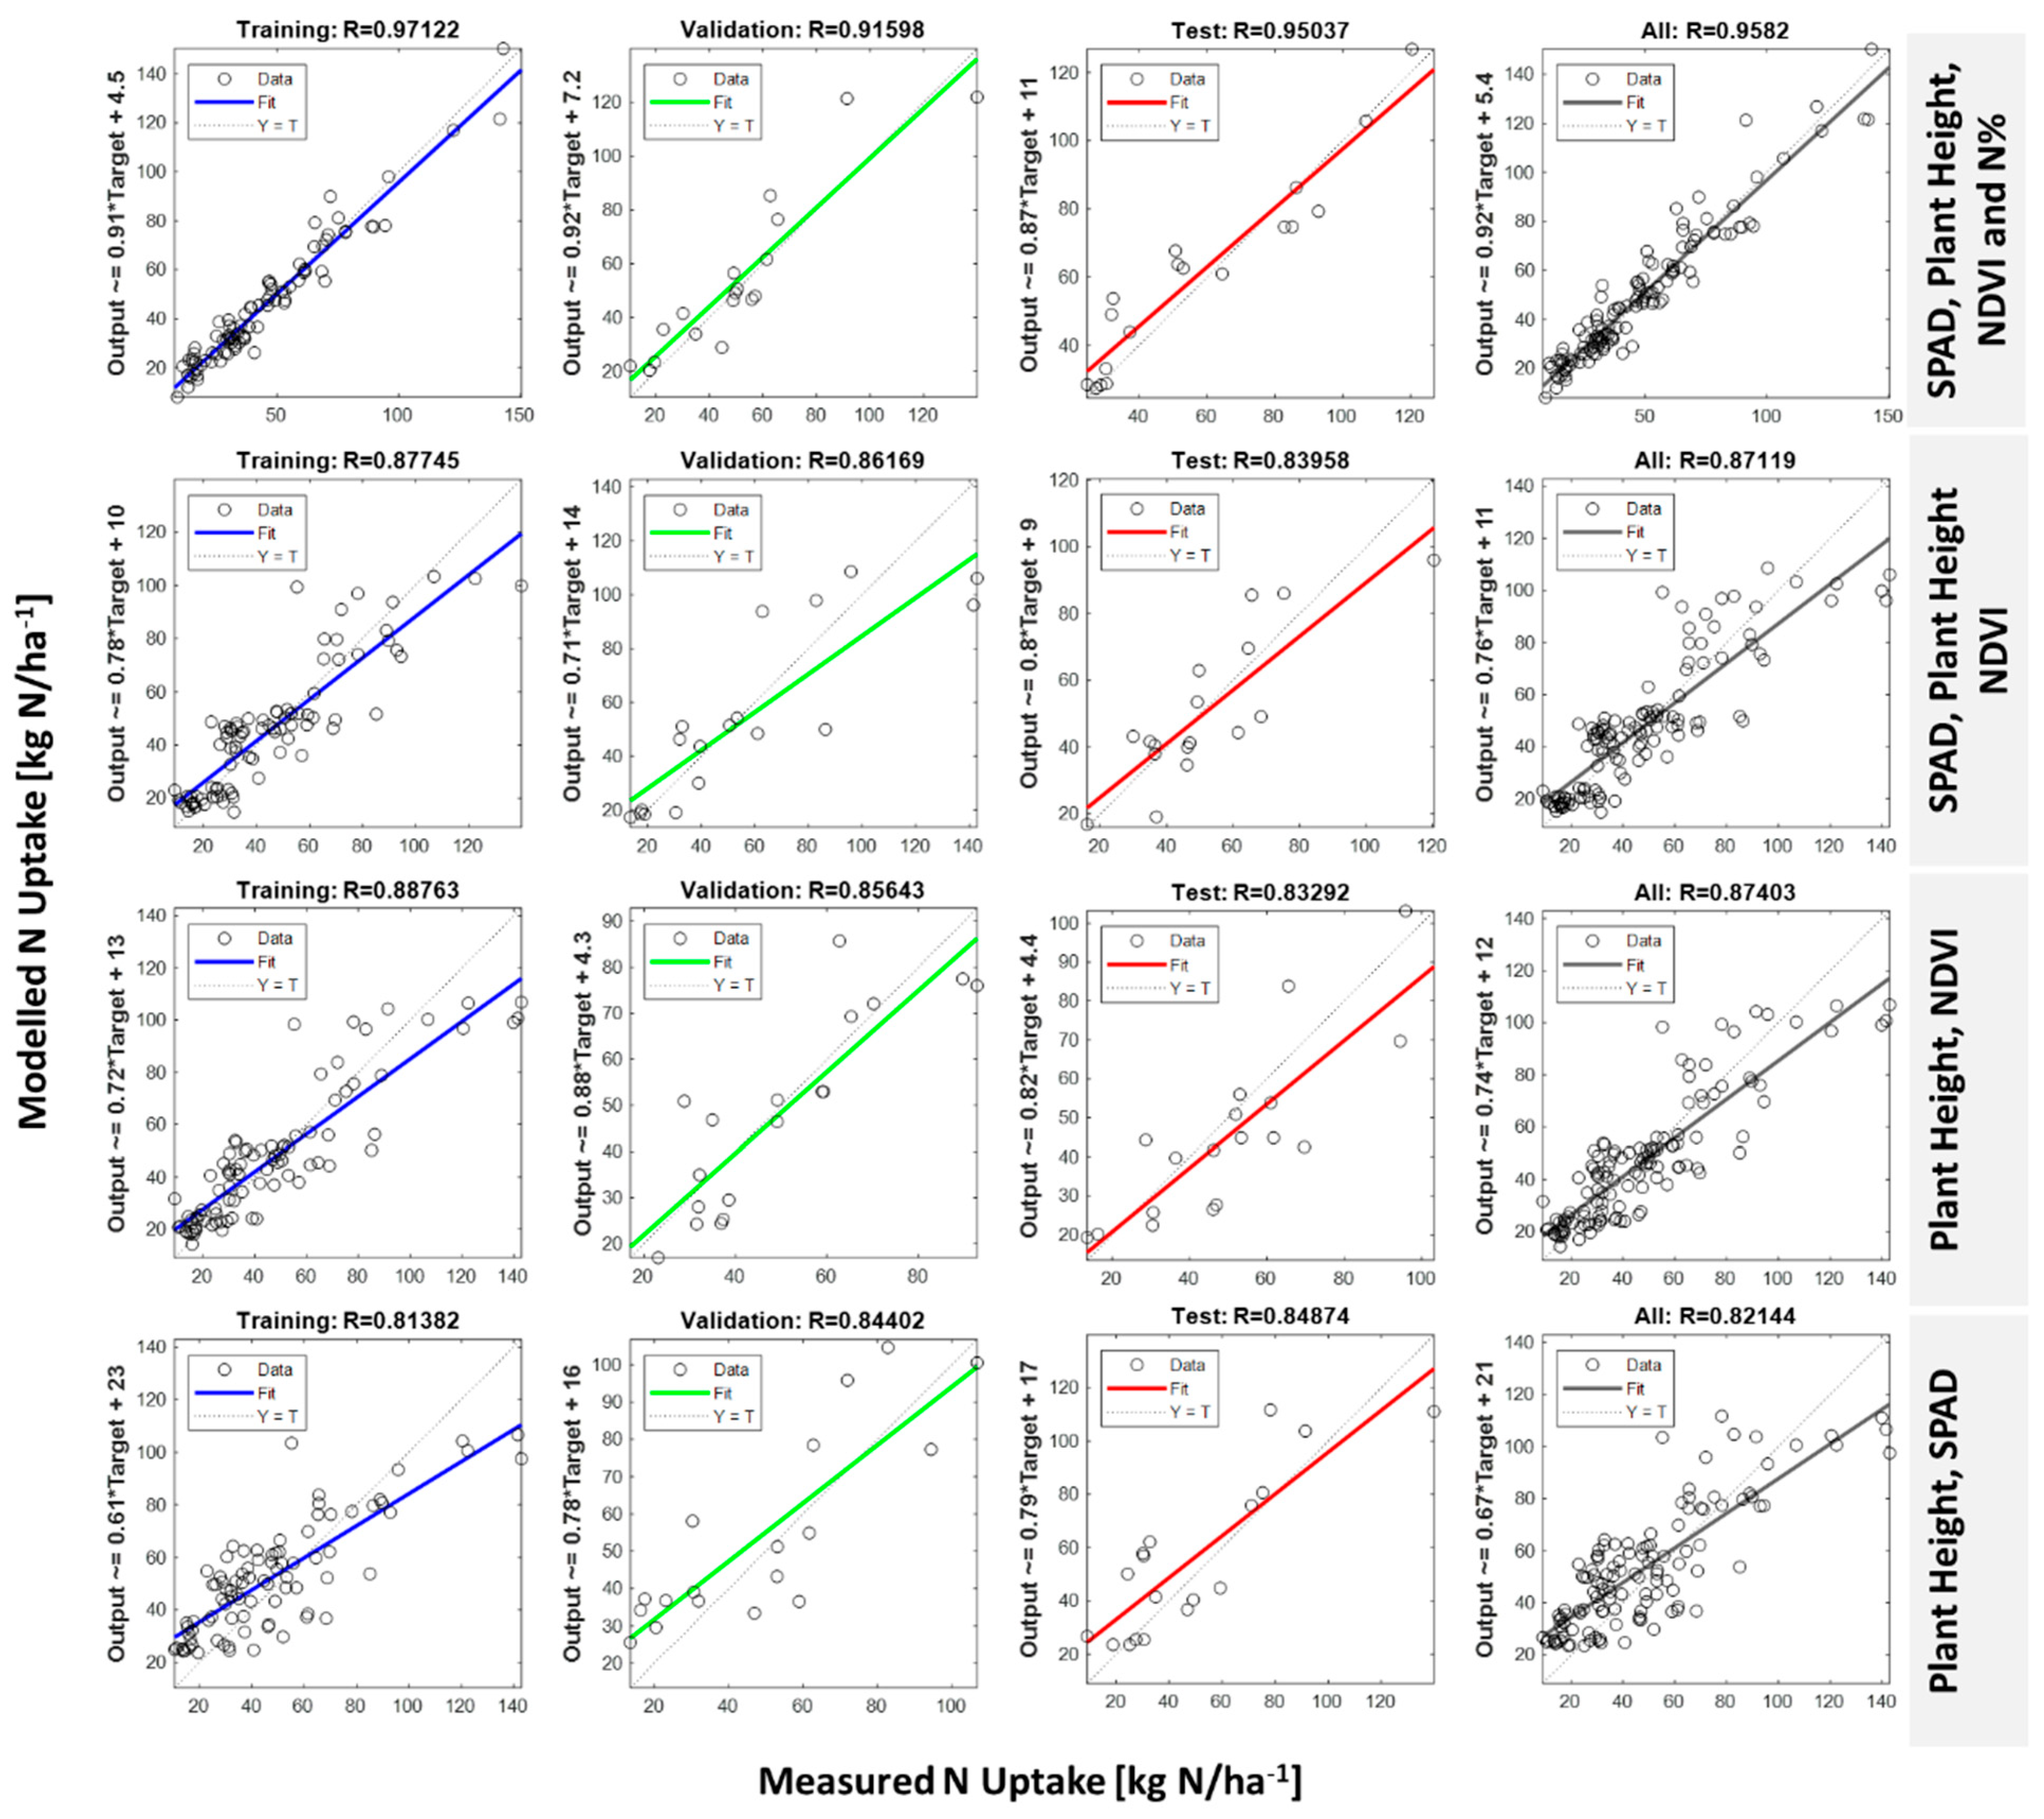
To improve the N uptake estimations with the NDVI indices and related parameters for estimating wheat nitrogen uptake, we employed a two-layer feed-forward neural network model (MATLAB—R2019a). We evaluated various combinations of four parameters (NDVI (drone or satellite), plant height, SPAD, and plant N content (%N)) to determine an algorithm for estimating N uptake (Figure 4). We evaluated four different combinations: (i) NNall, included all four parameters, (ii) NNremote, included only NDVI, SPAD, and plant height, (iii) NNNDVI, included only NDVI and plant height, and (iv) NNSPAD, included only SPAD and plant height. As expected, NNall provided the best fit (R2 = 0.95) with the tested samples. However, NNall relied on real crop N concentration data, making the model non-remote sensing. On the other hand, both NNremote and NNNDVI models showed reasonable estimates of crop N uptake for the whole dataset (R2 = 0.84 and R2 = 0.84, respectively). This indicates that a simple neural network model trained with NDVI and plant height (with or without SPAD values) can provide acceptable information about crop N status. When only satellite NDVI values are used as input variables to predict wheat N uptake (R2 = 0.65), model accuracy decreased almost 20% as compared to sole drone NDVI values. However, when plant height values are incorporated as input values in conjunction with the satellite NDVI data, neural network model prediction accuracy increased significantly with the R2 value of 0.83.

4. Discussion

Irrigation had a significant impact on wheat biomass formation, with maximum fresh biomass reaching 57.7 ± 1.1 t ha−1 compared to only 15.9 ± 1.0 t ha−1 in rainfed fields, clearly showing the impact of drought stress. Grain yield showed similar trend, being c.a. threefold higher in irrigated (8.2 ± 1.2 t ha−1) than in rainfed wheat (2.9 ± 0.9 t ha−1). These values are consistent with regional averages, highlighting the critical role of water availability in Mediterranean wheat production [24,25]. In line with the differences in biomass formation, total N uptake was also significantly higher under irrigation, highlighting the strong interaction between the rate of biomass production, water availability and nitrogen fertilization. Adoption of dynamic/real-time nitrogen management has potential to sustain high wheat yields with improved resource-use efficiency and minimized environmental impacts especially in regions with strong year-to-year yield fluctuations driven by variable water availability.

4.1. Vegetation Indices and Wheat Traits

We investigated the association between fourteen spectral indices and crop biomass, N concentration, plant height, and crop N uptake. Almost all spectral indices provide reasonable predictions for crop biomass. Spectral indices calculated from the red edge and near-infrared regions are well-known to contain useful information for predicting vegetation biomass [26,27,28]. In our study, the Wide Dynamic Range Vegetation Index (WDRI) performed slightly better than NDVI, ClGreen, or ClRed_edge indices for predicting biomass when pooled overall data. Gitelson et al. [14] reported that a simple modification of the NDVI as WDRI (WDRI = (0.2 * ρNIR − ρred)/(0.2 * ρNIR + ρred)) increases correlation with vegetation fraction by linearizing the relationship for wheat, soybean, and maize canopies. However, the differences between WDRI and NDVI in our experiment were minor (<5%) in both irrigated and rainfed wheat.
In irrigated wheat, NDRE, ClRed_edge, and ClGreen indices performed slightly better than NDVI and WDRI indices in predicting both fresh and dry matter. The results suggest that the NIR/red-edge and NIR/green ratio may better predict the denser canopy traits. Previous studies have reported that red-edge-derived indices typically outperform broadband indices [6,29]. In our study, broadband indices (NDVI, GNDVI, NDRE) also show a strong positive relationship with biomass variables, including plant height. As shown in Figure 2B, ClRed_edge alone have a very good relationship with the dry matter biomass, specifically in irrigated wheat treatments. This suggests that the red-edge group indices, such as ClRed_edge, are better predictors for biomass, particularly in high-yielding dense canopies, when differences among water supplies and nitrogen treatment are mainly related to chlorophyll content. Biomass estimation can further be improved by, for example, using stratified two-parameter models that combine phenological variables with spectral vegetation indices, as reported to enhance aboveground biomass allocation across winter wheat growth stages [28]. In our study, however, our primary focus is the estimation of crop N uptake.
Among spectral indices, red-edge–based metrics are among the most sensitive to variations in chlorophyll content and are widely used as an indicator of N deficiency [30,31,32,33,34]. However, our study found no significant correlation between leaf N content or SPAD values (a reliable indicator for leaf chlorophyll content) and red-edge-based indices in irrigated wheat. The relationship between biomass, leaf nitrogen/chlorophyll content and total nitrogen uptake is highly dynamic and phenology dependent. Authors earlier reported that crop N concentration decreases over time during crop development [35]. This decrease can be attributed to (i) self-shading, causes non-uniform leaf-N content across the canopy [36], (ii) an increasing proportion of plant structural and storage tissues [37], and iii) the accumulation of structural biomass (cellulose, lignin, carbohydrates) that is low in N [38]. This decrease (so called N-dilution effect) weakens correlation between spectral indices and tissue N concentration and total N uptake [39]. The N-dilution effect is particularly pronounced during the vegetative growth stages due to the effect of aboveground biomass on spectral reflectance being stronger compared with that of plant N prior to flowering [18,40]. Thus, our study shows that during rapid canopy expansion phase, the N-dilution effect may introduces bias and instability into spectral estimates of plant N concentration, thereby limiting their reliability for N status assessment [14,41,42,43]. Similarly, authors reported that canopy-scale indices related to canopy N% needs to be normalized with biomass [6]. Therefore, we conclude that, canopy-level spectral indices (e.g., NDVI, red-edge metrics) seem to be more responsive to canopy size or leaf area index than to chlorophyll or tissue N content. Spectral indices alone are reliable indicators for biomass, but effective estimations of crop nitrogen uptake require additional modelling and/or structural normalization.

4.2. Neural Network Model Estimate for Nitrogen Uptake

Neural network tools are effective in modelling and predicting nitrogen uptake in crops. For example, a study by Yang et al. [44] concluded that spectral indices are an efficient input variable for machine learning models for predicting plant nitrogen content in individual crops and across crops. As discussed above, canopy-scale spectral indices alone are insufficient for accurately estimating crop N status, since additional information on biomass or canopy structure is required. Neural network models provide a powerful option to capture these complex, nonlinear relationships and integrate multiple input variables for improved estimation of crop N parameters. This is particularly important for modelling the dynamic nature of crop N status throughout growth and development.
Jin et al. [27] showed that biomass estimation accuracy is further increased when, for example, leaf area index is combined with spectral data. In our study, we combined spectral indices with wheat N concentration (%), plant height (an indicator of growth stage and biomass), and SPAD values (an indicator of leaf chlorophyll content) to enhance the prediction accuracy of crop nitrogen uptake through spectral indices. Notably, the neural network model performed best when all these parameters were included as input variables, achieving an estimation with an R2 of 0.95 for N uptake. We still observed reasonable estimates for crop N uptake when sole SPAD or plant height values were used as input variables (without N concentration) across the entire dataset, achieving an R2 of 0.84 (Figure 4). The latter suggests that neural network models may give reliable estimates of crop N uptake when plant height and NDVI values are used as input variable. Furthermore, SPAD values, which are commonly used as a proxy for chlorophyll content, only marginally improved model performance for nitrogen uptake estimation. When satellite NDVI values are used as sole input variables to predict wheat N uptake (R2 = 0.65), model accuracy decreased almost 20% as compared to drone NDVI values (Supplementary Figure S3). However, when plant height values are incorporated as input values in conjunction with the satellite NDVI data, neural network model prediction accuracy increased significantly with R2 value of 0.83 (similar to the input variable drone NDVI + plant height).
This finding carries significant practical implications for growers and indicates that by utilizing easily measurable plant height or integrating simple plant height sensors in the field, along with drone or satellite NDVI data, accurate estimates of wheat nitrogen uptake can be achieved. In conclusion, our study suggests that a neural network model trained with plant height data and spectral indices can effectively estimate nitrogen uptake in irrigated and rainfed wheat. The integration of plant height and NDVI data enhances the capacity to assess crop N status and enables more accurate, data-driven nitrogen management decisions. Nevertheless, we should note that neural network models are data-driven and may be sensitive to the representativeness of the training dataset; model performance may vary in different agro-ecosystems. However, our findings suggest that when sufficiently diverse training data are available, such models can be scaled to regional or even national mapping of crop N status using satellite platforms. While our approach shows promise for estimating wheat N uptake, the limited two-site dataset and non-randomized large plots necessitate multi-site, multi-year validation before operational deployment.

5. Conclusions

The development of simple, remote sensing–based tools to map canopy nitrogen status at the critical timing of mid-season fertilizer application could support sustainable N management in both rainfed and irrigated wheat production. While canopy spectral indices (particularly red-edge-based metrics) are reliable indicators of biomass, they do not, on their own, provide sufficient information to determine crop nitrogen status under field conditions. Neural network approaches can capture complex nonlinear relationships between crop traits and spectral indices, enabling more accurate prediction of nitrogen uptake than traditional methods. Our results clearly showed that including plant height values (with or without SPAD measurements) in conjunction with NDVI data (from drones or satellites) substantially improved prediction accuracy for nitrogen uptake. This integration enables more precise and efficient nitrogen management in both agricultural practice and crop research. By implementing neural network models together with plant height and spectral indices, farmers can better optimize nitrogen supply with crop demand, resulting in higher yields and a more sustainable approach to wheat production. Although our approach shows promise for estimating wheat N uptake, future research should validate model performance across diverse environments, wheat genotypes, and management systems, and assess scalability to regional or national monitoring efforts to ensure broader applicability in precision nitrogen management.

Supplementary Materials

The following supporting information can be downloaded at https://www.mdpi.com/article/10.3390/nitrogen6030082/s1, Figure S1A: Rainfed wheat field depicting crop variability during various vegetation stage; Figure S1B: Irrigated wheat field depicting crop variability during various vegetation stage; Figure S2: The relationship between drone and satellite NDVI values in irrigated (blue dots) and rainfed (brown triangle) wheat; Figure S3: The relationship between measured and simulated crop N uptake by the two-layer feed-forward neural network (ANN) model; Table S1: Vegetation indices and calculation formula [14,30,45,46,47,48,49,50,51,52]; Table S2: RMSE and R2 values of the two-layer feed-forward neural network (ANN) model; Table S3: Spearman correlation coefficients (R) for relationships between selected agronomic parameters (FBM: fresh dry matter, DBM: dry matter, Plant height, Crop N (%), SPAD, and N Uptake (N Uptake: total crop N uptake) until BBCH72–75; Table S4: Spearman correlation coefficients (R) for relationships between selected agronomic parameters (FBM: fresh dry matter, DBM: dry matter, Plant height, Crop N (%), SPAD, and N Uptake (N Uptake: total crop N uptake) until BBCH72–75.

Author Contributions

M.H.S.: Planned the experiment, analyzed spectral data, contributed to the writing of the paper. F.K.: Performed the field experiment, shared responsibility for collecting field data, contributed to writing and reviewing the paper. E.R.: Performed the field experiment and soil analysis, shared responsibility for collecting field data, contributed to writing and reviewing the paper. M.A.C.: Contributed to project writing, statistical analysis, and writing and reviewing the paper. N.M.: Contributed to project writing and field data collection, and writing and reviewing the paper. A.Y.: Contributed to field experiment planning and data collection, and writing and reviewing the paper. R.B.: Contributed to project writing, field experiment planning, and writing and reviewing the paper. M.S.: Planned the experiment, performed UAV measurements, analyzed field data, and contributed to the writing of the paper. All authors have read and agreed to the published version of the manuscript.

Funding

This study was funded by the GAP Project (BUBAP: 5303) and the University of Harran HUBAP Project (21141).

Data Availability Statement

All data and model functions will be available upon request as supplementary files.

Conflicts of Interest

Author Roland Bol was employed by the Agrosphere Institute IBG-3, Forschungszentrum Jülich GmbH. The remaining authors declare that the research was conducted in the absence of any commercial or financial relationships that could be construed as a potential conflict of interest.

References

  1. Good, A.G.; Shrawat, A.K.; Muench, D.G. Can Less Yield More? Is Reducing Nutrient Input into the Environment Compatible with Maintaining Crop Production? Trends Plant Sci. 2004, 9, 597–605. [Google Scholar] [CrossRef]
  2. Shiferaw, B.; Smale, M.; Braun, H.-J.; Duveiller, E.; Reynolds, M.; Muricho, G. Crops That Feed the World 10. Past Successes and Future Challenges to the Role Played by Wheat in Global Food Security. Food Secur. 2013, 5, 291–317. [Google Scholar] [CrossRef]
  3. Franco, C.; Mejía, N.; Pedersen, S.M.; Gislum, R. Potential Impact of Learning Management Zones for Site-Specific N Fertilisation: A Case Study for Wheat Crops. Nitrogen 2022, 3, 387–403. [Google Scholar] [CrossRef]
  4. Li, X.; Ata-UI-Karim, S.T.; Li, Y.; Yuan, F.; Miao, Y.; Yoichiro, K.; Cheng, T.; Tang, L.; Tian, X.; Liu, X.; et al. Advances in the Estimations and Applications of Critical Nitrogen Dilution Curve and Nitrogen Nutrition Index of Major Cereal Crops. A Review. Comput. Electron. Agric. 2022, 197, 106998. [Google Scholar] [CrossRef]
  5. Fox, R.H.; Walthall, C.L. Crop Monitoring Technologies to Assess Nitrogen Status. In Nitrogen in Agricultural Systems; John Wiley & Sons, Ltd.: Hoboken, NJ, USA, 2008; pp. 647–674. ISBN 978-0-89118-191-0. [Google Scholar]
  6. Cammarano, D.; Fitzgerald, G.J.; Casa, R.; Basso, B. Assessing the Robustness of Vegetation Indices to Estimate Wheat N in Mediterranean Environments. Remote Sens. 2014, 6, 2827–2844. [Google Scholar] [CrossRef]
  7. Sims, D.A.; Gamon, J.A. Relationships between Leaf Pigment Content and Spectral Reflectance across a Wide Range of Species, Leaf Structures and Developmental Stages. Remote Sens. Environ. 2002, 81, 337–354. [Google Scholar] [CrossRef]
  8. Heitholt, J.J.; Johnson, R.C.; Ferris, D.M. Stomatal Limitation to Carbon Dioxide Assimilation in Nitrogen and Drought-Stressed Wheat. Crop Sci. 1991, 31, 135–139. [Google Scholar] [CrossRef]
  9. Cho, M.A.; Skidmore, A.K. A New Technique for Extracting the Red Edge Position from Hyperspectral Data: The Linear Extrapolation Method. Remote Sens. Environ. 2006, 101, 181–193. [Google Scholar] [CrossRef]
  10. Serrano, L.; Peñuelas, J.; Ustin, S.L. Remote Sensing of Nitrogen and Lignin in Mediterranean Vegetation from AVIRIS Data: Decomposing Biochemical from Structural Signals. Remote Sens. Environ. 2002, 81, 355–364. [Google Scholar] [CrossRef]
  11. Uribeetxebarria, A.; Castellon, A.; Aizpurua, A. A First Approach to Determine If It Is Possible to Delineate In-Season N Fertilization Maps for Wheat Using NDVI Derived from Sentinel-2. Remote Sens. 2022, 14, 2872. [Google Scholar] [CrossRef]
  12. Jamali, M.; Soufizadeh, S.; Yeganeh, B.; Emam, Y. Wheat Leaf Traits Monitoring Based on Machine Learning Algorithms and High-Resolution Satellite Imagery. Ecol. Inform. 2023, 74, 101967. [Google Scholar] [CrossRef]
  13. Zhai, W.; Cheng, Q.; Duan, F.; Huang, X.; Chen, Z. Remote Sensing-Based Analysis of Yield and Water-Fertilizer Use Efficiency in Winter Wheat Management. Agric. Water Manag. 2025, 311, 109390. [Google Scholar] [CrossRef]
  14. Gitelson, A.A. Wide Dynamic Range Vegetation Index for Remote Quantification of Biophysical Characteristics of Vegetation. J. Plant Physiol. 2004, 161, 165–173. [Google Scholar] [CrossRef]
  15. Pancorbo, J.L.; Alonso-Ayuso, M.; Camino, C.; Raya-Sereno, M.D.; Zarco-Tejada, P.J.; Molina, I.; Gabriel, J.L.; Quemada, M. Airborne Hyperspectral and Sentinel Imagery to Quantify Winter Wheat Traits through Ensemble Modeling Approaches. Precis. Agric. 2023, 24, 1288–1311. [Google Scholar] [CrossRef]
  16. Dordas, C.A. Impact of Nitrogen Fertilization on Rosemary: Assessment of Physiological Traits, Vegetation Indices, and Environmental Resource Use Efficiency. Nitrogen 2025, 6, 33. [Google Scholar] [CrossRef]
  17. Gebbers, R.; Adamchuk, V.I. Precision Agriculture and Food Security. Science 2010, 327, 828–831. [Google Scholar] [CrossRef]
  18. Li, F.; Li, D.; Elsayed, S.; Hu, Y.; Schmidhalter, U. Using Optimized Three-Band Spectral Indices to Assess Canopy N Uptake in Corn and Wheat. Eur. J. Agron. 2021, 127, 126286. [Google Scholar] [CrossRef]
  19. Colovic, M.; Yu, K.; Todorovic, M.; Cantore, V.; Hamze, M.; Albrizio, R.; Stellacci, A.M. Hyperspectral Vegetation Indices to Assess Water and Nitrogen Status of Sweet Maize Crop. Agronomy 2022, 12, 2181. [Google Scholar] [CrossRef]
  20. Peñuelas, J.; Munné-Bosch, S.; Llusià, J.; Filella, I. Leaf Reflectance and Photo- and Antioxidant Protection in Field-Grown Summer-Stressed Phillyrea Angustifolia. Optical Signals of Oxidative Stress? New Phytol. 2004, 162, 115–124. [Google Scholar] [CrossRef]
  21. Klem, K.; Záhora, J.; Zemek, F.; Trunda, P.; Tůma, I.; Novotná, K.; Hodaňová, P.; Rapantová, B.; Hanuš, J.; Vavříková, J.; et al. Interactive Effects of Water Deficit and Nitrogen Nutrition on Winter Wheat. Remote Sensing Methods for Their Detection. Agric. Water Manag. 2018, 210, 171–184. [Google Scholar] [CrossRef]
  22. Rumelhart, D.E.; McClelland, J.L. Learning Internal Representations by Error Propagation. In Parallel Distributed Processing: Explorations in the Microstructure of Cognition: Foundations; MIT Press: Cambridge, MA, USA, 1987; pp. 318–362. ISBN 978-0-262-29140-8. [Google Scholar]
  23. van Klompenburg, T.; Kassahun, A.; Catal, C. Crop Yield Prediction Using Machine Learning: A Systematic Literature Review. Comput. Electron. Agric. 2020, 177, 105709. [Google Scholar] [CrossRef]
  24. Tita, D.; Mahdi, K.; Devkota, K.P.; Devkota, M. Climate Change and Agronomic Management: Addressing Wheat Yield Gaps and Sustainability Challenges in the Mediterranean and MENA Regions. Agric. Syst. 2025, 224, 104242. [Google Scholar] [CrossRef]
  25. Phogat, V.; Šimůnek, J.; Petrie, P.; Pitt, T.; Filipović, V. Sustainability of a Rainfed Wheat Production System in Relation to Water and Nitrogen Dynamics in the Soil in the Eyre Peninsula, South Australia. Sustainability 2023, 15, 13370. [Google Scholar] [CrossRef]
  26. Gitelson, A.A.; Kaufman, Y.J.; Merzlyak, M.N. Use of a Green Channel in Remote Sensing of Global Vegetation from EOS-MODIS. Remote Sens. Environ. 1996, 58, 289–298. [Google Scholar] [CrossRef]
  27. Jin, X.; Li, Z.; Feng, H.; Ren, Z.; Li, S. Deep Neural Network Algorithm for Estimating Maize Biomass Based on Simulated Sentinel 2A Vegetation Indices and Leaf Area Index. Crop J. 2020, 8, 87–97. [Google Scholar] [CrossRef]
  28. Chen, W.; Yang, G.; Meng, Y.; Feng, H.; Li, H.; Tang, A.; Zhang, J.; Xu, X.; Yang, H.; Li, C.; et al. Estimation of Winter Wheat Stem Biomass by a Novel Two-Component and Two-Parameter Stratified Model Using Proximal Remote Sensing and Phenological Variables. Remote Sens. 2024, 16, 4300. [Google Scholar] [CrossRef]
  29. Patel, M.K.; Ryu, D.; Western, A.W.; Suter, H.; Young, I.M. Which Multispectral Indices Robustly Measure Canopy Nitrogen across Seasons: Lessons from an Irrigated Pasture Crop. Comput. Electron. Agric. 2021, 182, 106000. [Google Scholar] [CrossRef]
  30. Daughtry, C.S.T.; Walthall, C.L.; Kim, M.S.; de Colstoun, E.B.; McMurtrey, J.E. Estimating Corn Leaf Chlorophyll Concentration from Leaf and Canopy Reflectance. Remote Sens. Environ. 2000, 74, 229–239. [Google Scholar] [CrossRef]
  31. Sellami, M.H.; Albrizio, R.; Čolović, M.; Hamze, M.; Cantore, V.; Todorovic, M.; Piscitelli, L.; Stellacci, A.M. Selection of Hyperspectral Vegetation Indices for Monitoring Yield and Physiological Response in Sweet Maize under Different Water and Nitrogen Availability. Agronomy 2022, 12, 489. [Google Scholar] [CrossRef]
  32. Hnizil, O.; Baidani, A.; Khlila, I.; Nsarellah, N.; Laamari, A.; Amamou, A. Integrating NDVI, SPAD, and Canopy Temperature for Strategic Nitrogen and Seeding Rate Management to Enhance Yield, Quality, and Sustainability in Wheat Cultivation. Plants 2024, 13, 1574. [Google Scholar] [CrossRef]
  33. Li, H.; Zhang, Y.; Lei, Y.; Antoniuk, V.; Hu, C. Evaluating Different Non-Destructive Estimation Methods for Winter Wheat (Triticum aestivum L.) Nitrogen Status Based on Canopy Spectrum. Remote Sens. 2020, 12, 95. [Google Scholar] [CrossRef]
  34. Yu, K.-Q.; Zhao, Y.-R.; Li, X.-L.; Shao, Y.-N.; Liu, F.; He, Y. Hyperspectral Imaging for Mapping of Total Nitrogen Spatial Distribution in Pepper Plant. PLoS ONE 2014, 9, e116205. [Google Scholar] [CrossRef]
  35. Plénet, D.; Lemaire, G. Relationships between Dynamics of Nitrogen Uptake and Dry Matter Accumulation in Maize Crops. Determination of Critical N Concentration. Plant Soil 1999, 216, 65–82. [Google Scholar] [CrossRef]
  36. Pons, T.L.; Pearcy, R.W. Nitrogen Reallocation and Photosynthetic Acclimation in Response to Partial Shading in Soybean Plants. Physiol. Plant. 1994, 92, 636–644. [Google Scholar] [CrossRef]
  37. Charles-Edwards, D.A.; Stutzel, H.; Ferraris, R.; Beech, D.F. An Analysis of Spatial Variation in the Nitrogen Content of Leaves from Different Horizons Within a Canopy. Ann. Bot. 1987, 60, 421–426. [Google Scholar] [CrossRef]
  38. Gastal, F.; Lemaire, G. N Uptake and Distribution in Crops: An Agronomical and Ecophysiological Perspective. J. Exp. Bot. 2002, 53, 789–799. [Google Scholar] [CrossRef] [PubMed]
  39. Jiang, J.; Wang, C.; Wang, Y.; Cao, Q.; Tian, Y.; Zhu, Y.; Cao, W.; Liu, X. Using an Active Sensor to Develop New Critical Nitrogen Dilution Curve for Winter Wheat. Sensors 2020, 20, 1577. [Google Scholar] [CrossRef]
  40. Yin, H.; Li, F.; Yang, H.; Di, Y.; Hu, Y.; Yu, K. Mapping Plant Nitrogen Concentration and Aboveground Biomass of Potato Crops from Sentinel-2 Data Using Ensemble Learning Models. Remote Sens. 2024, 16, 349. [Google Scholar] [CrossRef]
  41. Li, F.; Mistele, B.; Hu, Y.; Yue, X.; Yue, S.; Miao, Y.; Chen, X.; Cui, Z.; Meng, Q.; Schmidhalter, U. Remotely Estimating Aerial N Status of Phenologically Differing Winter Wheat Cultivars Grown in Contrasting Climatic and Geographic Zones in China and Germany. Field Crops Res. 2012, 138, 21–32. [Google Scholar] [CrossRef]
  42. Liaghat, S.; Ehsani, R.; Mansor, S.; Shafri, H.Z.M.; Meon, S.; Sankaran, S.; Azam, S.H.M.N. Early Detection of Basal Stem Rot Disease (Ganoderma) in Oil Palms Based on Hyperspectral Reflectance Data Using Pattern Recognition Algorithms. Int. J. Remote Sens. 2014, 35, 3427–3439. [Google Scholar] [CrossRef]
  43. Sun, H.; Feng, M.; Yang, W.; Bi, R.; Sun, J.; Zhao, C.; Xiao, L.; Wang, C.; Kubar, M.S. Monitoring Leaf Nitrogen Accumulation With Optimized Spectral Index in Winter Wheat Under Different Irrigation Regimes. Front. Plant Sci. 2022, 13, 913240. [Google Scholar] [CrossRef]
  44. Yang, H.; Yin, H.; Li, F.; Hu, Y.; Yu, K. Machine Learning Models Fed with Optimized Spectral Indices to Advance Crop Nitrogen Monitoring. Field Crops Res. 2023, 293, 108844. [Google Scholar] [CrossRef]
  45. Rouse, J.; Haas, R.H.; Schell, J.A.; Deering, D. Monitoring Vegetation Systems in the Great Plains with ERTS. In Proceedings of the Third Symposium on Significant Results Obtained from Earth Resources Technology Satellite-1, Washington, DC, USA, 10–14 December 1973; Volume 1, pp. 309–317. [Google Scholar]
  46. Gitelson, A.A.; Merzlyak, M.N. Quantitative estimation of chlorophyll-a using reflectance spectra: Experiments with autumn chestnut and maple leaves. J. Photochem. Photobiol. B Biol. 1994, 22, 247–252. [Google Scholar] [CrossRef]
  47. Gitelson, A.A.; Gamon, J.A.; Solovchenko, A. Multiple drivers of seasonal change in PRI: Implications for photosynthesis 2. Stand level. Remote Sens. Environ. 2017, 190, 198–206. [Google Scholar] [CrossRef]
  48. Barnes, E.M.; Clarke, T.R.; Richards, S.E.; Colaizzi, P.D.; Haberland, J.; Kostrzewski, M.; Waller, P.; Choi, C.; Riley, E.; Thompson, T.; et al. Coincident Detection of Crop Water Stress, Nitrogen Status and Canopy Density Using Ground-Based Multispectral Data. In Proceedings of the 5th International Conference on Precision Agriculture, Bloomington, MN, USA, 16–19 July 2000; pp. 1–15. [Google Scholar]
  49. Gamon, J.A.; Surfus, J.S. Assessing leaf pigment content and activity with a reflectometer. New Phytol. 1999, 143, 105–117. [Google Scholar] [CrossRef]
  50. Thenkabail, P.S.; Smith, R.B.; De Pauw, E. Hyperspectral Vegetation Indices and Their Relationships with Agricultural Crop Characteristics. Remote Sens. Environ. 2000, 71, 158–182. [Google Scholar] [CrossRef]
  51. Rondeaux, G.; Steven, M.; Baret, F. Optimization of soil-adjusted vegetation indices. Remote Sens. Environ. 1996, 55, 95–107. [Google Scholar] [CrossRef]
  52. Haboudane, D.; Miller, J.R.; Tremblay, N.; Zarco-Tejada, P.J.; Dextraze, L. Integrated narrow-band vegetation indices for prediction of crop chlorophyll content for application to precision agriculture. Remote Sens. Environ. 2002, 81, 416–426. [Google Scholar] [CrossRef]
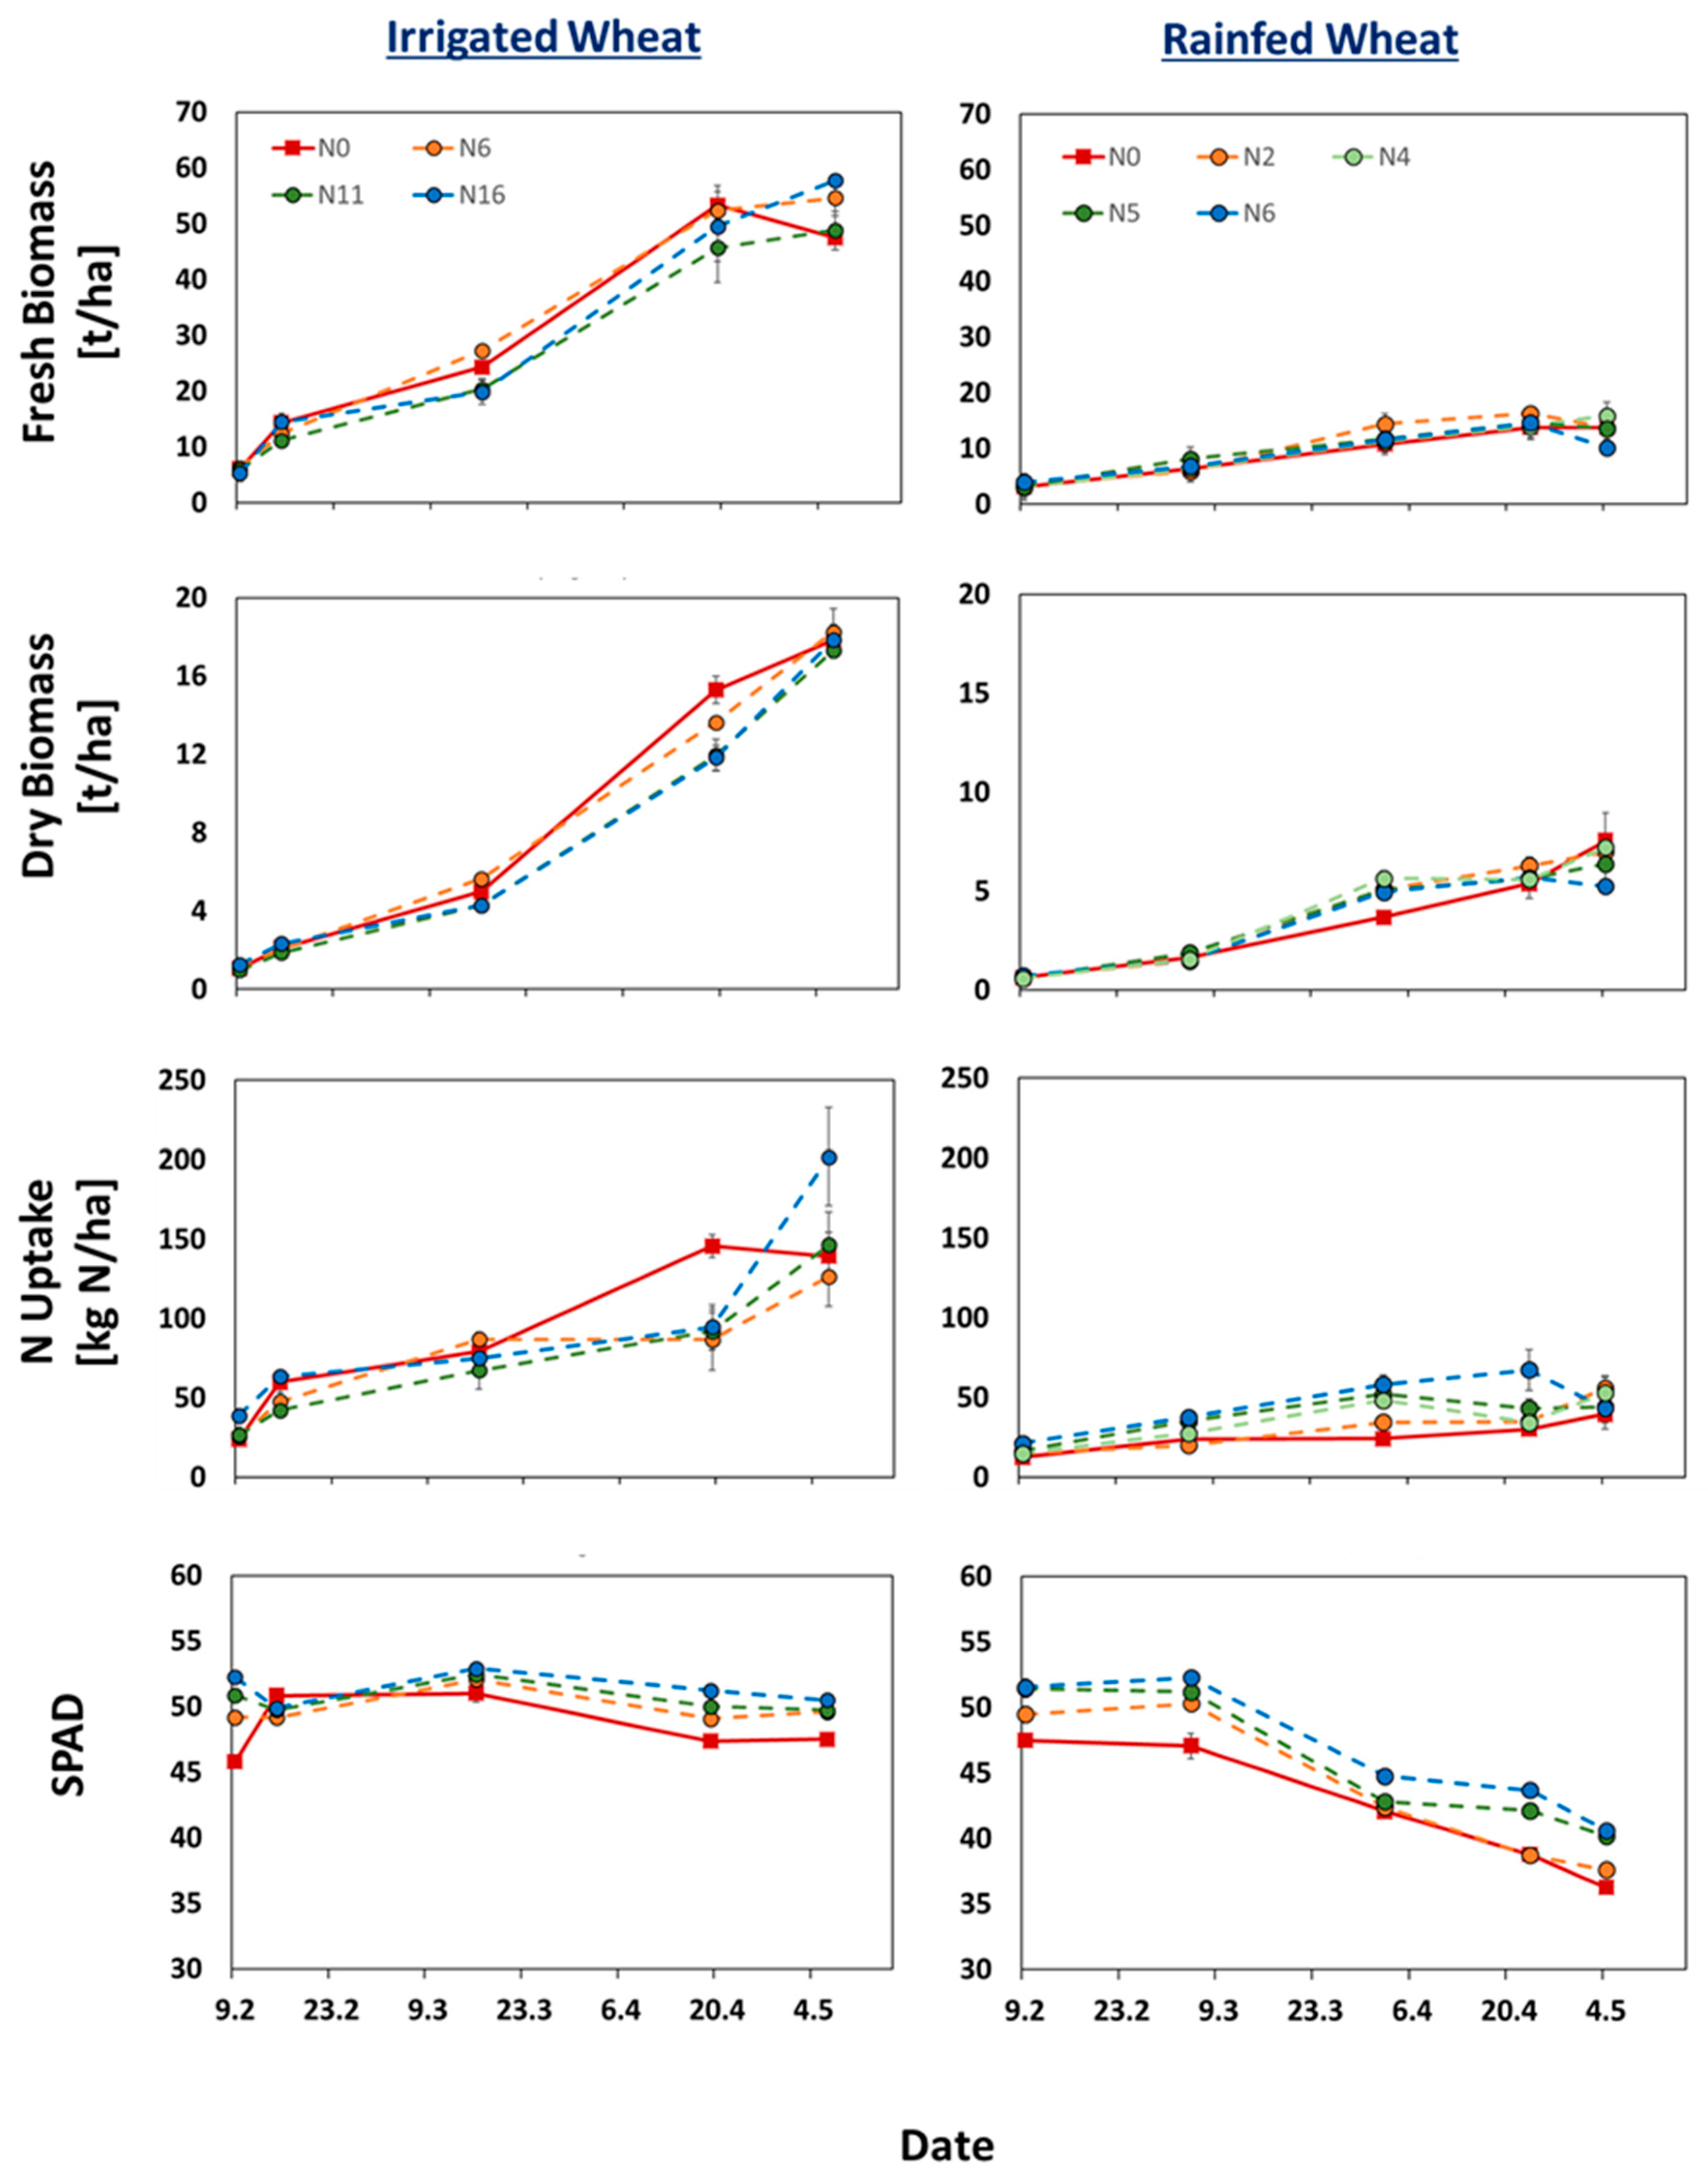
Figure 1. Time integrated values of fresh biomass (FBM, (t/ha−1)), dry biomass (DBM, (t/ha−1)), N uptake (kg N/ha2) and SPAD values of irrigated (four N levels: 0, 60, 110, 160 kg N ha−1) and rainfed (five N levels, 0, 20, 40, 50, 60 kg N ha−1) wheat treated with various N levels. Error bars indicate the standard errors of the mean values. In some cases, error bars are smaller than the symbols.
Nitrogen 06 00082 g001
Figure 2. The relationship between (A) NDVI, NDRE and wheat total N uptake, (B) CLRed_edge and wheat dry matter, and (C) SPAD values and crop N content for irrigated and rainfed wheat.
Nitrogen 06 00082 g002
Figure 3. Spearman correlation coefficients (R) for relationships between selected agronomic parameters (FBM: fresh dry matter, DBM: dry matter, Plant height, Crop N (%), SPAD, and N Uptake (N Uptake: total crop N uptake) until BBCH72–75. The data from both fields and all treatments were used.
Nitrogen 06 00082 g003
Figure 4. The relationship between measured and simulated crop N uptake by the two-layer feed-forward neural network (ANN) model. Data are shown for overall and separately for training, validation, and for test samples.
Nitrogen 06 00082 g004
Table 1. Fresh biomass (FBM, (t/ha−1)), dry biomass (DBM, (t/ha−1)), plant height (PH, (cm)), plant N content (% N), and cumulative N uptake (N Uptake, (kg N/ha2)) values of irrigated (four N levels: 0, 60, 110, 160 kg N ha−1) and rainfed (five N levels, 0, 20, 40, 50, 60 kg N ha−1) wheat treated with various N levels. Means denoted by a different letter in the same column differ significantly according to Tukey’s HSD post hoc tests at α = 0.05.
Urea (kg/da)FBM
(t/ha2)
DBM
(t/ha2)
PH
(cm)
%NN Uptake
(kg N/ha2)
IrrigatedN047.5 ± 2.2 b17.8 ± 0.8 *108 ± 2.0 *0.84 ± 0.01 ab146 ± 20 *
N654.6 ± 3.2 ab18.2 ± 1.2106 ± 0.70.69 ± 0.07 b127 ± 19
N1148.8 ± 3.4 ab17.3 ± 0.6107 ± 1.20.78 ± 0.09 ab139 ± 15
N1657.7 ± 1.1 a17.8 ± 0.4108 ± 1.01.13 ± 0.16 a201 ± 31
RainfedN013.8 ± 2.2 ab7.6 ± 1.4 *71.0 ± 1.0 c0.73 ± 0.13 *53.0 ± 10.7 *
N213.7 ± 1.6 ab7.0 ± 0.779.7 ± 0.9 ab0.80 ± 0.0356.0 ± 6.9
N415.9 ± 1.0 a7.2 ± 0.478.5 ± 0.9 b0.52 ± 0.0539.7 ± 9.3
N513.6 ± 2.2 ab6.4 ± 0.980.8 ± 1.3 ab0.84 ± 0.2743.3 ± 12.7
N610.2 ± 0.2 b5.2 ± 0.182.3 ± 0.3 a0.76 ± 0.2844.2 ± 10.1
* Not significant.
Disclaimer/Publisher’s Note: The statements, opinions and data contained in all publications are solely those of the individual author(s) and contributor(s) and not of MDPI and/or the editor(s). MDPI and/or the editor(s) disclaim responsibility for any injury to people or property resulting from any ideas, methods, instructions or products referred to in the content.