Article

Spatial Distribution Characteristics of Soil Nutrients in the Ferralic Cambisols Watershed

1
School of History and Geography, Minnan Normal University, Zhangzhou 363000, China
2
Changting County Soil and Water Conservation Station, Longyan 366300, China
3
College of Geographical Sciences, Fujian Normal University, Fuzhou 350007, China
*
Author to whom correspondence should be addressed.
Nitrogen 2025, 6(3), 77; https://doi.org/10.3390/nitrogen6030077
Submission received: 26 June 2025 / Revised: 26 August 2025 / Accepted: 29 August 2025 / Published: 1 September 2025

Abstract

In southern China, the long-term irrational utilization of land resources has caused severe damage to the ecology and environment of the entire region. Serious issues such as soil degradation and water erosion have led to the decline of soil quality and productivity. In this study, the spatial distribution characteristics of soil carbon, nitrogen, and phosphorus in Zhuxi watershed, Changting County, southern China, were analyzed by coupling geostatistics with GIS. The analysis generated several important results: (1) The concentrations of soil organic matter (OM), alkali-hydrolyzable nitrogen (AN), and available phosphorus (AP) are at moderate levels, and AP exhibits local enrichment in the downstream farmland, while the concentrations of total nitrogen (TN) and total phosphorus (TP) remain at low levels. (2) The optimal theoretical model for AN is an exponential model, while other nutrients follow spherical models. Except for AP, which has a nugget effect exceeding 75%, the nugget effects of other nutrients range between 25% and 75%, indicating that their spatial distribution is moderately correlated. According to Kriging interpolation results, the distribution of OM, TN, and AN shows a clear trend of decreasing from northeast to southwest, followed by a gradual increase, which is generally consistent with the direction of rivers. The trends of TP and AP are more irregular, generally decreasing from downstream to upstream. (3) OM, TN, and AN exhibit a negative correlation with the degree of soil erosion, indicating that soil erosion is associated with the loss of carbon and nitrogen nutrients. However, the impact on phosphorus is relatively insignificant.

1. Introduction

Soil nutrients are the most important material basis of soil fertility, which is crucial for sustainable agriculture [1]. Regulating soil development processes is a fundamental measure to promote high-yield and high-quality agriculture [2,3]. The ferralic cambisols hilly region in southern China is rich in water and heat resources, offering huge production potential. However, due to long-term irrational land use and the interaction of natural conditions, soil degradation and water erosion have become severe, leading to reduced soil fertility, productivity, and ecological environment deterioration [4,5,6]. Analyzing the spatial distribution characteristics of soil nutrients to determine soil fertility can provide a basis for rational fertilization in sustainable agriculture and promote soil erosion control, improving the local ecological environment and achieving sustainable social and economic development in mountainous areas [7,8].
Since the 1970s, scholars have begun studying the spatial variability of soil properties, applying geostatistical theory to soil science. Recognizing that soil properties are regionalized variables with both geological structure characteristics and statistical randomness, Webster et al. [9] made successful explorations, promoting research on soil spatial variability. Because geostatistics requires uniform sampling, quantitative studies on the spatial variability of soil properties over large areas face difficulties. Initially, most studies on soil spatial variability were limited to small scales. Webster et al. used transgressive Kriging to create spatial distribution maps of soil pH, exchangeable potassium, and available phosphorus concentration on a 0.77 km2 farm [10]. Numerous studies have shown that soil nutrients in small areas are spatially correlated, with the spatial correlation distance of soil organic matter ranging from 50 to 350 m [7,11]. The spatial correlation distances of available phosphorus and available potassium vary significantly, with some studies showing distances over 100 m [12] and others below 60 m [13], confirming the universal existence of soil nutrient spatial variability.
Yost et al. [14] were among the first to apply statistical methods to study soil property spatial variability at a larger scale. They investigated the spatial correlation of soil nutrients on the Hawaiian Islands and found that the spatial correlation distances of P, K, Ca, and Mg concentration ranged from 32 to 42 km. Gaston et al. [15] used geostatistical methods to study the spatial distribution of soil properties (organic matter, pH, soil texture) and weeds in the Mississippi Delta, finding a significant correlation between weeds and organic matter concentration and soil texture. Haefele and Wopereis [12] studied large areas of paddy fields in the Senegal Valley, West Africa, discovering obvious spatial variations in various nutrients, which guided fertilization strategies. These studies indicate that soil shows spatial correlation at large scales, and mastering its spatial variation laws is practically significant for guiding soil surveys.
As one of the 30 typical monitoring watersheds in China, the Zhuxi watershed exhibits complex and diverse soil erosion characteristics, representing the typical red soil erosion area in southern China. Nitrogen is a key limiting factor for ferralic cambisols productivity; the coupled migration patterns of nitrogen with carbon and phosphorus are crucial for understanding the mechanisms of soil degradation in eroded areas. This study took the Zhuxi watershed as a case, obtained extensive basic data through field sampling and laboratory testing, and analyzed the spatial distribution characteristics of soil nutrients using geostatistical methods combined with GIS technology, aiming to provide references for implementing sustainable agriculture and controlling soil erosion in the watershed. The systematic analysis of the spatial heterogeneity changes in soil carbon, nitrogen, and phosphorus in the Zhuxi watershed after the implementation of ecological restoration projects has filled the gap in research on nutrient dynamics in the basin following restoration. Through the in-depth integration of geostatistics and GIS, the correlation threshold between soil erosion and nutrient loss has been quantified, providing parameter support for precise restoration in ferralic cambisols regions.

2. Materials and Methods

2.1. Study Area

The Zhuxi watershed is located in the east of Hetian Town, Changting County, Fujian Province (Figure 1), with geographical coordinates between 116°23′30″–116°30′30″ E and 25°38′15″–25°42′55″ N, covering a total area of approximately 44.96 km2 [16]. The watershed is widely distributed with coarse-grained granite, which contains minerals (feldspar, quartz, mica, etc.) forming a good mosaic structure. The rock is solid and hard. Due to its subtropical location and influence of marine monsoons, weathering is strong, forming a thick weathering crust. However, the weathering crust has a loose structure and poor erosion resistance due to unweathered quartz sand grains. The landform is dominated by low mountains and hills, with an altitude of 270–680 m. The terrain tilts from northeast to southwest, with fragmented topography and valley basins along the river, presenting an interlaced distribution of basins and valleys. It has a subtropical monsoon humid climate, with warm and humid spring and summer, cold and dry autumn and winter, a long summer and short winter, distinct dry and wet seasons, and frequent disastrous weather. The average annual temperature is 18.3 °C, the average annual precipitation is 1700 mm, with large interannual variations. Most rainfall (76% of the annual total) concentrates from March to August [17]. The soil is mainly red soil and eroded red soil developed from late Yanshanian coarse-grained biotite granite under long-term humid and hot climatic conditions. Corresponding to red soil in the Chinese soil classification system, its equivalent in the FAO-WRB classification is ferralic cambisols, which is characterized by rich iron and aluminum content and strong acidity. Paddy fields are distributed in the downstream area, and fluvo-soil is found along both sides of the river. The zonal vegetation is subtropical evergreen broad-leaved forest, but due to long-term human destruction and policy errors, the surface vegetation has been severely damaged, with almost all original vegetation replaced by secondary forests.

2.2. Soil Erosion Data

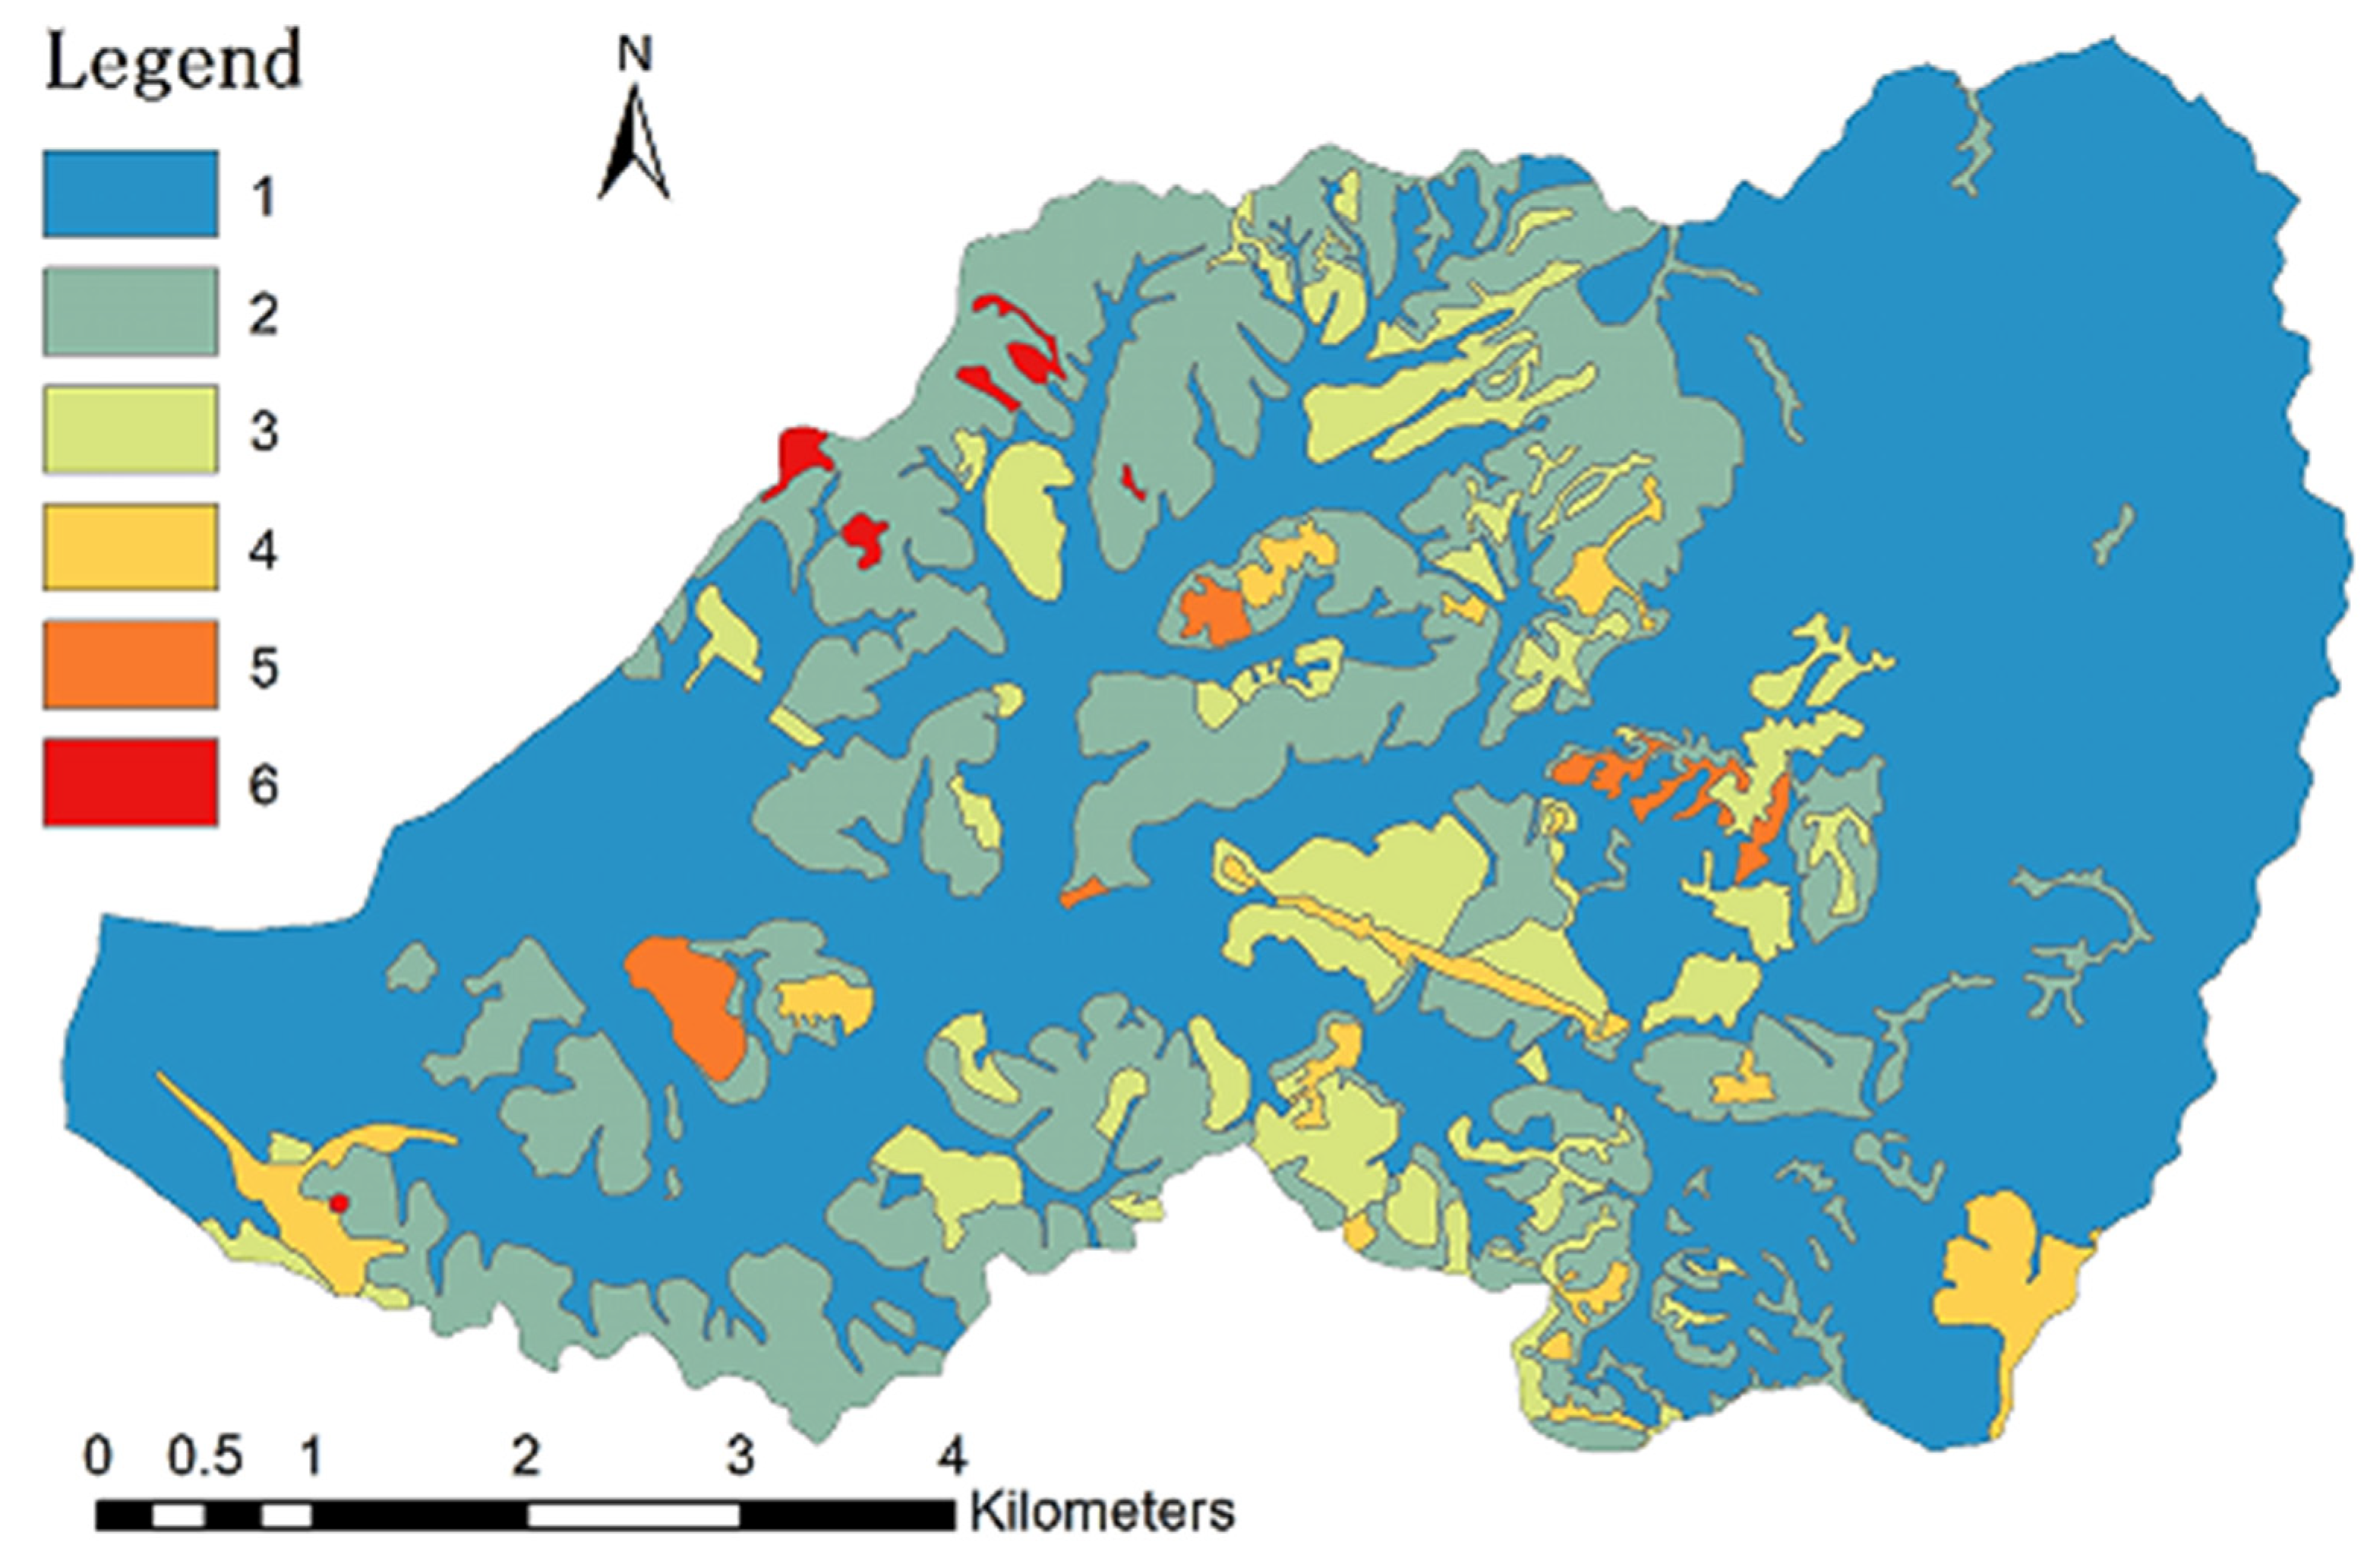
Based on the slope map, land use map, and vegetation coverage map, computer-aided classification and identification were first conducted using the watershed land use identification results and topographic slope data, referring to other soil erosion-related materials (see Table S1). Finally, a topological relationship was established, errors were checked and modified, and soil erosion data for the Zhuxi watershed were generated (Figure 2 and Table 1).

2.3. Sample Collection

For field soil sampling positioning, the approximate location was first determined according to the soil sampling sketch. Upon arriving at the sampling area, a handheld GPS was used to accurately locate the sample points based on recorded coordinates. Sampling points were selected considering different slopes, vegetation coverage, and soil erosion degrees, avoiding human activity interference. If the points on the sampling sketch did not meet requirements, their positions were adjusted, and coordinates were recorded. After determining sample points, soil profiles were dug with a hoe to observe soil genetic layers. Surface soil samples (about 1 kg) were collected by random sampling from 5 points around the profile and stored in soil bags.
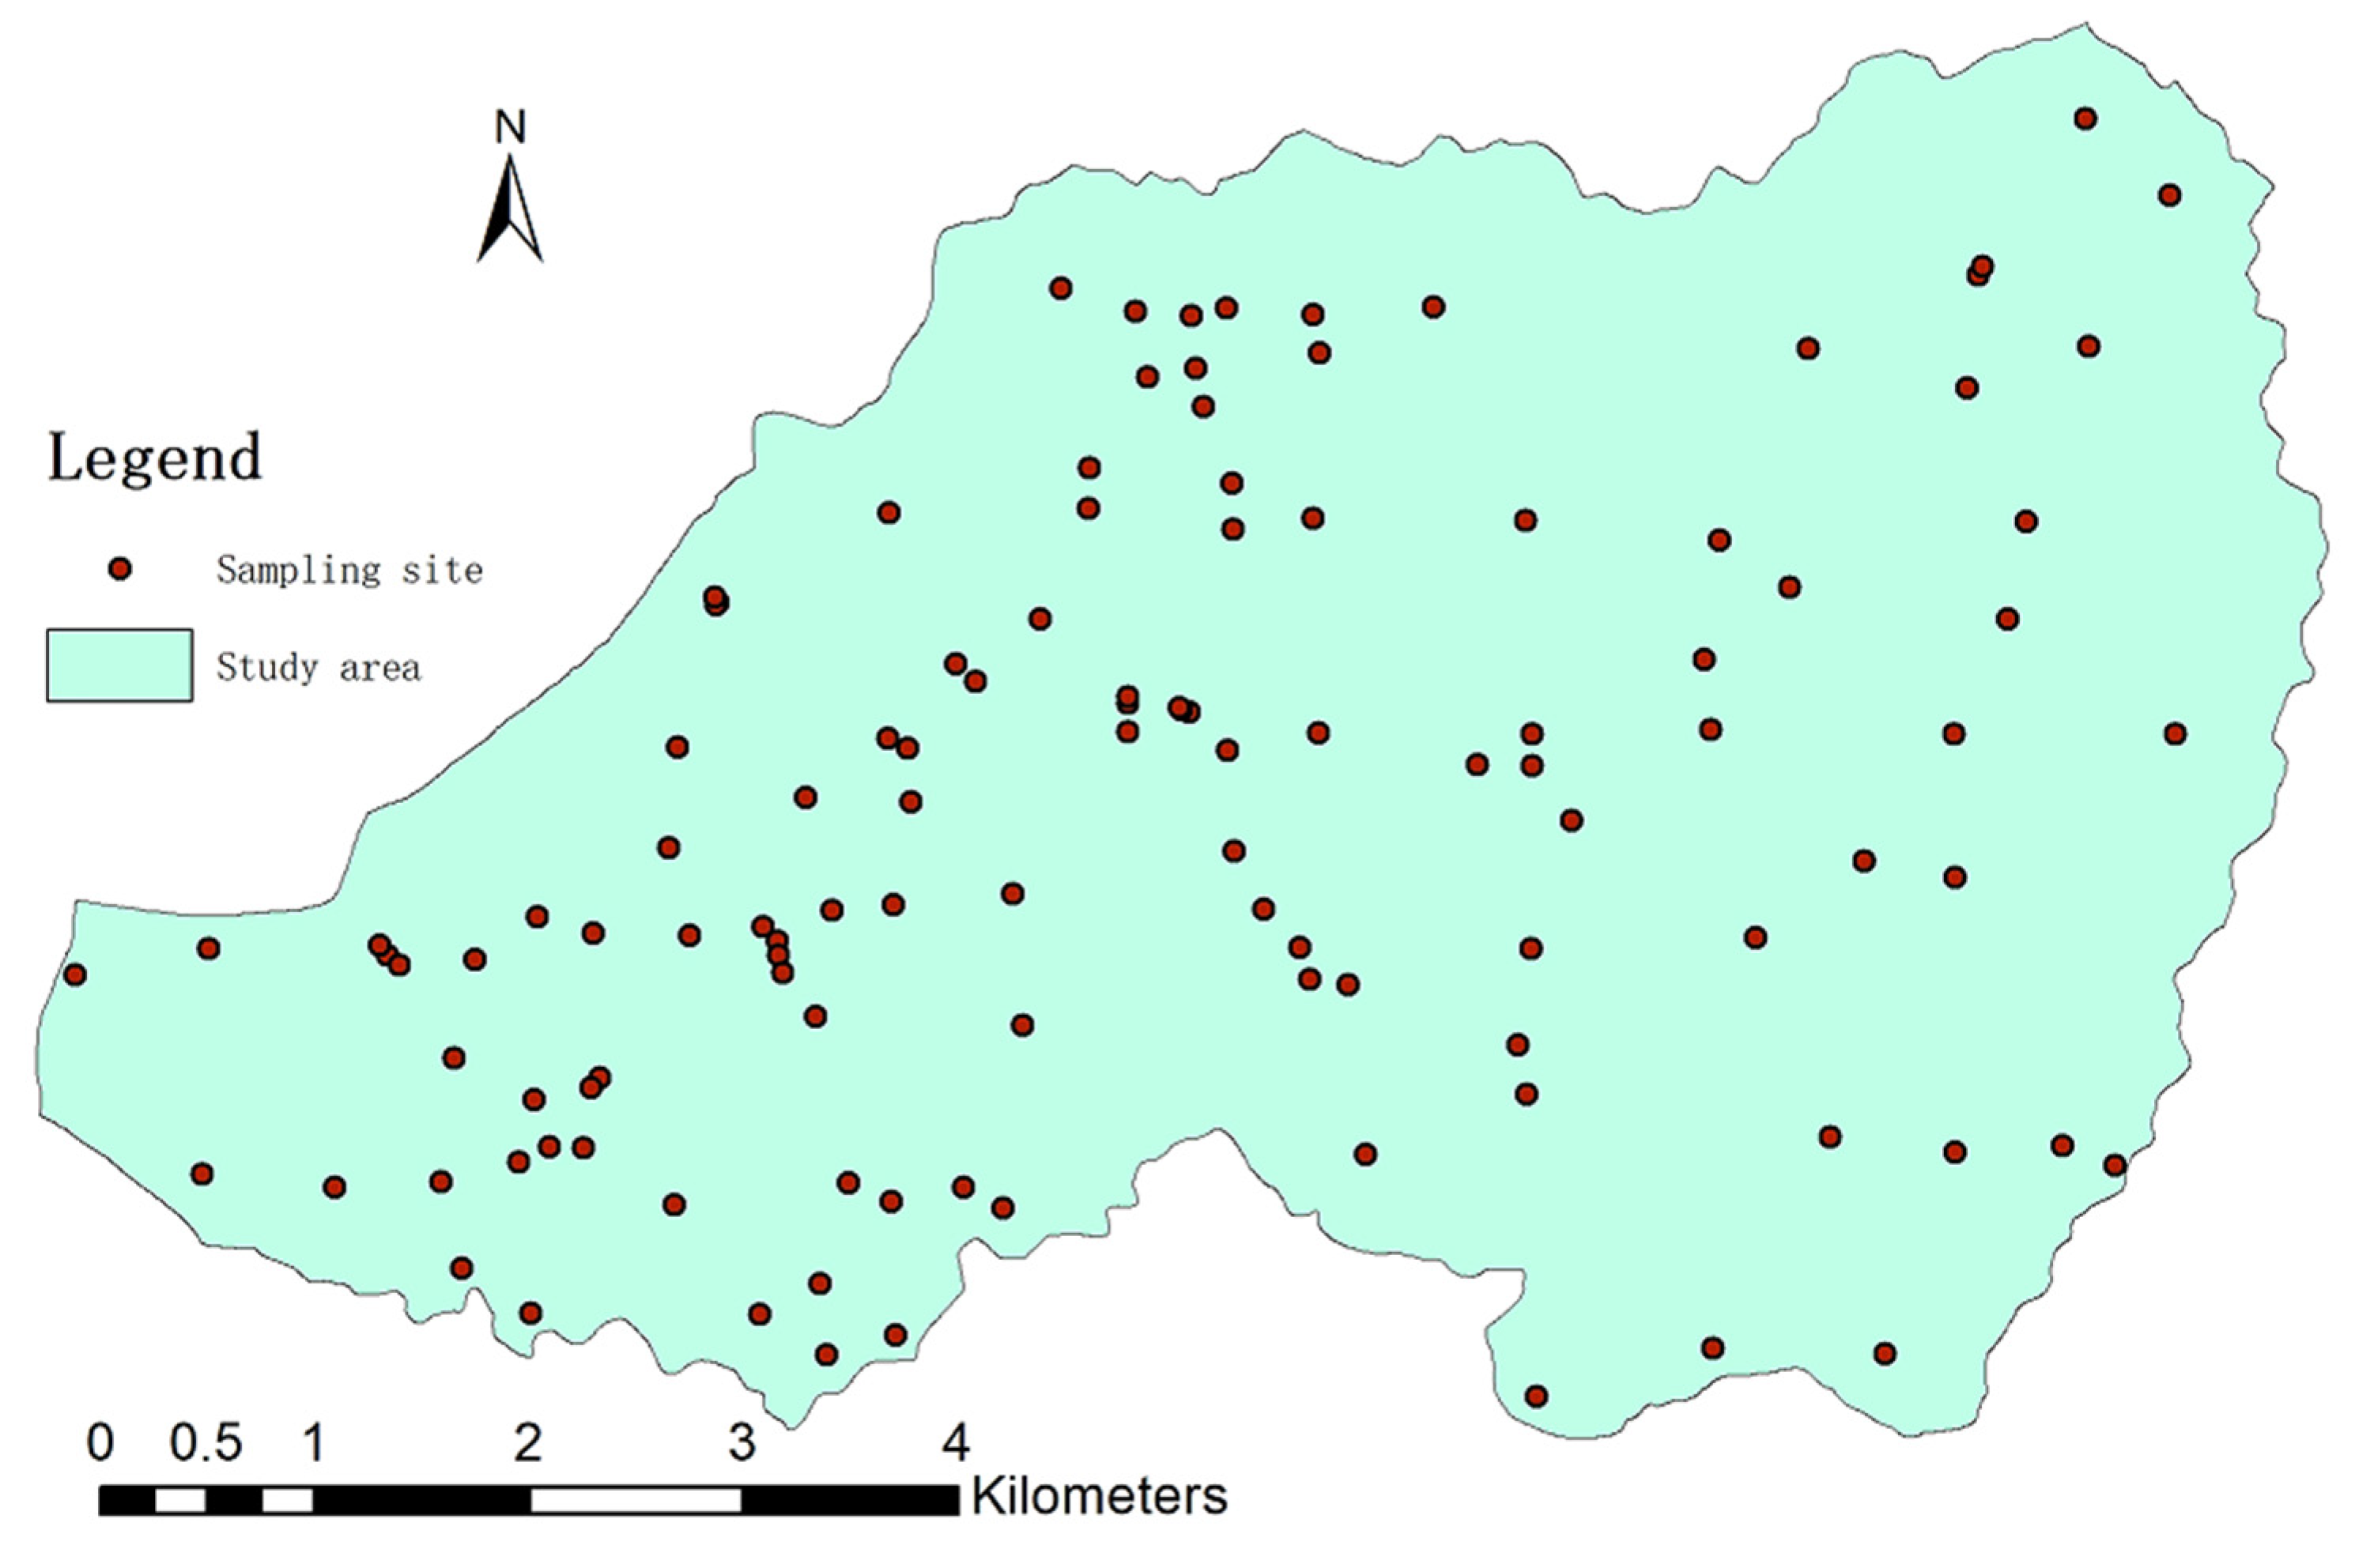
A total of 118 soil samples (see Folder S1) were collected in the field. After indoor GIS sample point correction, a soil sample distribution map was generated, including spatial information of sampling points and basic recorded information, forming a complete soil sample database (Figure 3).

2.4. Analytical Methods

According to the soil characteristics of the study area, key factors significantly affecting plant growth were selected: soil organic matter (OM), total nitrogen (TN), alkali-hydrolyzable nitrogen (AN), total phosphorus (TP), and available phosphorus (AP). These indices were measured using methods described in Methods of Soil Agricultural Chemical Analysis [18], as shown in Table 2.

2.5. Data Analysis

This study mainly used the semivariance function in geostatistics for data analysis, combined with Kriging interpolation, to analyze the spatial variability of soil nutrient indices in the watershed. Parameters of the semivariance function, which represent the spatial variation and correlation degree of regionalized variables, are key to studying soil characteristic spatial variability and the basis for accurate Kriging interpolation [19]. The semivariance expression is
γ ( h ) = 1 2 N ( h ) i = 1 N ( h ) [ Z ( x i ) Z ( x i + h ) ] 2
in which N(h) is the number of observation points at interval h; Z( x i ) and Z( x i + h) are the measured values of the regionalized variable at spatial positions Z( x i ) and Z( x i + h), respectively. The semivariograms were calculated and the variability maps were created in ArcGIS 10.2 software (ESRI Inc., Redlands, CA, USA). Experimental data were processed under IBM SPSS 24.0 software.

3. Results and Discussion

3.1. Characteristics of Soil Nutrients

Statistical characteristic analysis of soil nutrients is the premise and basis for establishing spatial variability analysis. As shown in Table 3, the variation ranges and averages of OM, TN, and TP were 0.29–67.38 g·kg−1, 0.04–1.3 g·kg−1, and 0.04–0.8 g·kg−1, respectively. Referencing the soil nutrient classification standard used in China Soil Survey (Table 4), the study area showed a large variation range for OM and small ranges for TN and TP. The average OM concentration was 22.28 g·kg−1, at level 3 (medium), while the average TN and TP were 0.42 g·kg−1 and 0.25 g·kg−1, at lower levels of 5 and 6. The variation ranges of AN and AP were 15.25–230.38 mg·kg−1 and 0.1–56 mg·kg−1, respectively. Their averages were 79.98 mg·kg−1 and 14.03 mg·kg−1, reaching medium levels.
The coefficient of variation (CV) reflects relative variation, i.e., the degree of dispersion of random variables. According to relevant research, CV ≤ 0.1 indicates weak variability; 0.1 < CV < 1 indicates moderate variability; and CV ≥ 1 indicates strong variability [19]. Table 3 shows significant differences in variation coefficients of different soil nutrients in the study area, ranging from 0.08 to 1.44. AP has a CV of 1.44 (strong variability), possibly due to regional differences in fertilization measures, making AP concentration in some farmlands much higher than in unfertilized soils, consistent with the Sun Bo et al. research in red soil areas [20]. However, the Yan et al. [21] research in the adjacent basin showed relatively smaller variability, which indicates that there is significant uncertainty in the variation of phosphorus. Other soil nutrients showed moderate variability. OM and TN have a high correlation, with the CV around 0.8. TP is affected by fertilization measures and has low mobility in soil, so its CV reaches 0.88, while the CV of AN was 0.63. The variation in soil nutrients is related to their chemical behavior in soil, parent materials, land use patterns, and fertilization conditions. Most soil nutrients in the study area showed moderate variability. Kurtosis and skewness coefficients reflect the normal distribution of data. When the kurtosis coefficient is close to 3 and the skewness coefficient is less than 1, data are considered normally distributed. Thus, Table 3 shows that OM, TN, and AN are approximately normally distributed, while TP and AP (after log transformation) do not follow a normal distribution.
Overall, soil OM, AN, and AP concentrations were at moderate levels, reaching medium levels, while TN and TP remained at a low level, indicating poor overall nutrient status.
Before the soil and water conservation restoration, the nutrient concentration in the surface soil of the Zhuxi watershed were as follows: OM 6.52 g·kg−1, TN 0.39 g·kg−1, AN 22.39 mg·kg−1, and TP 0.65 g·kg−1 [22].

3.2. Geostatistical Analysis of Soil Nutrients

3.2.1. Trend Analysis of Soil Nutrient

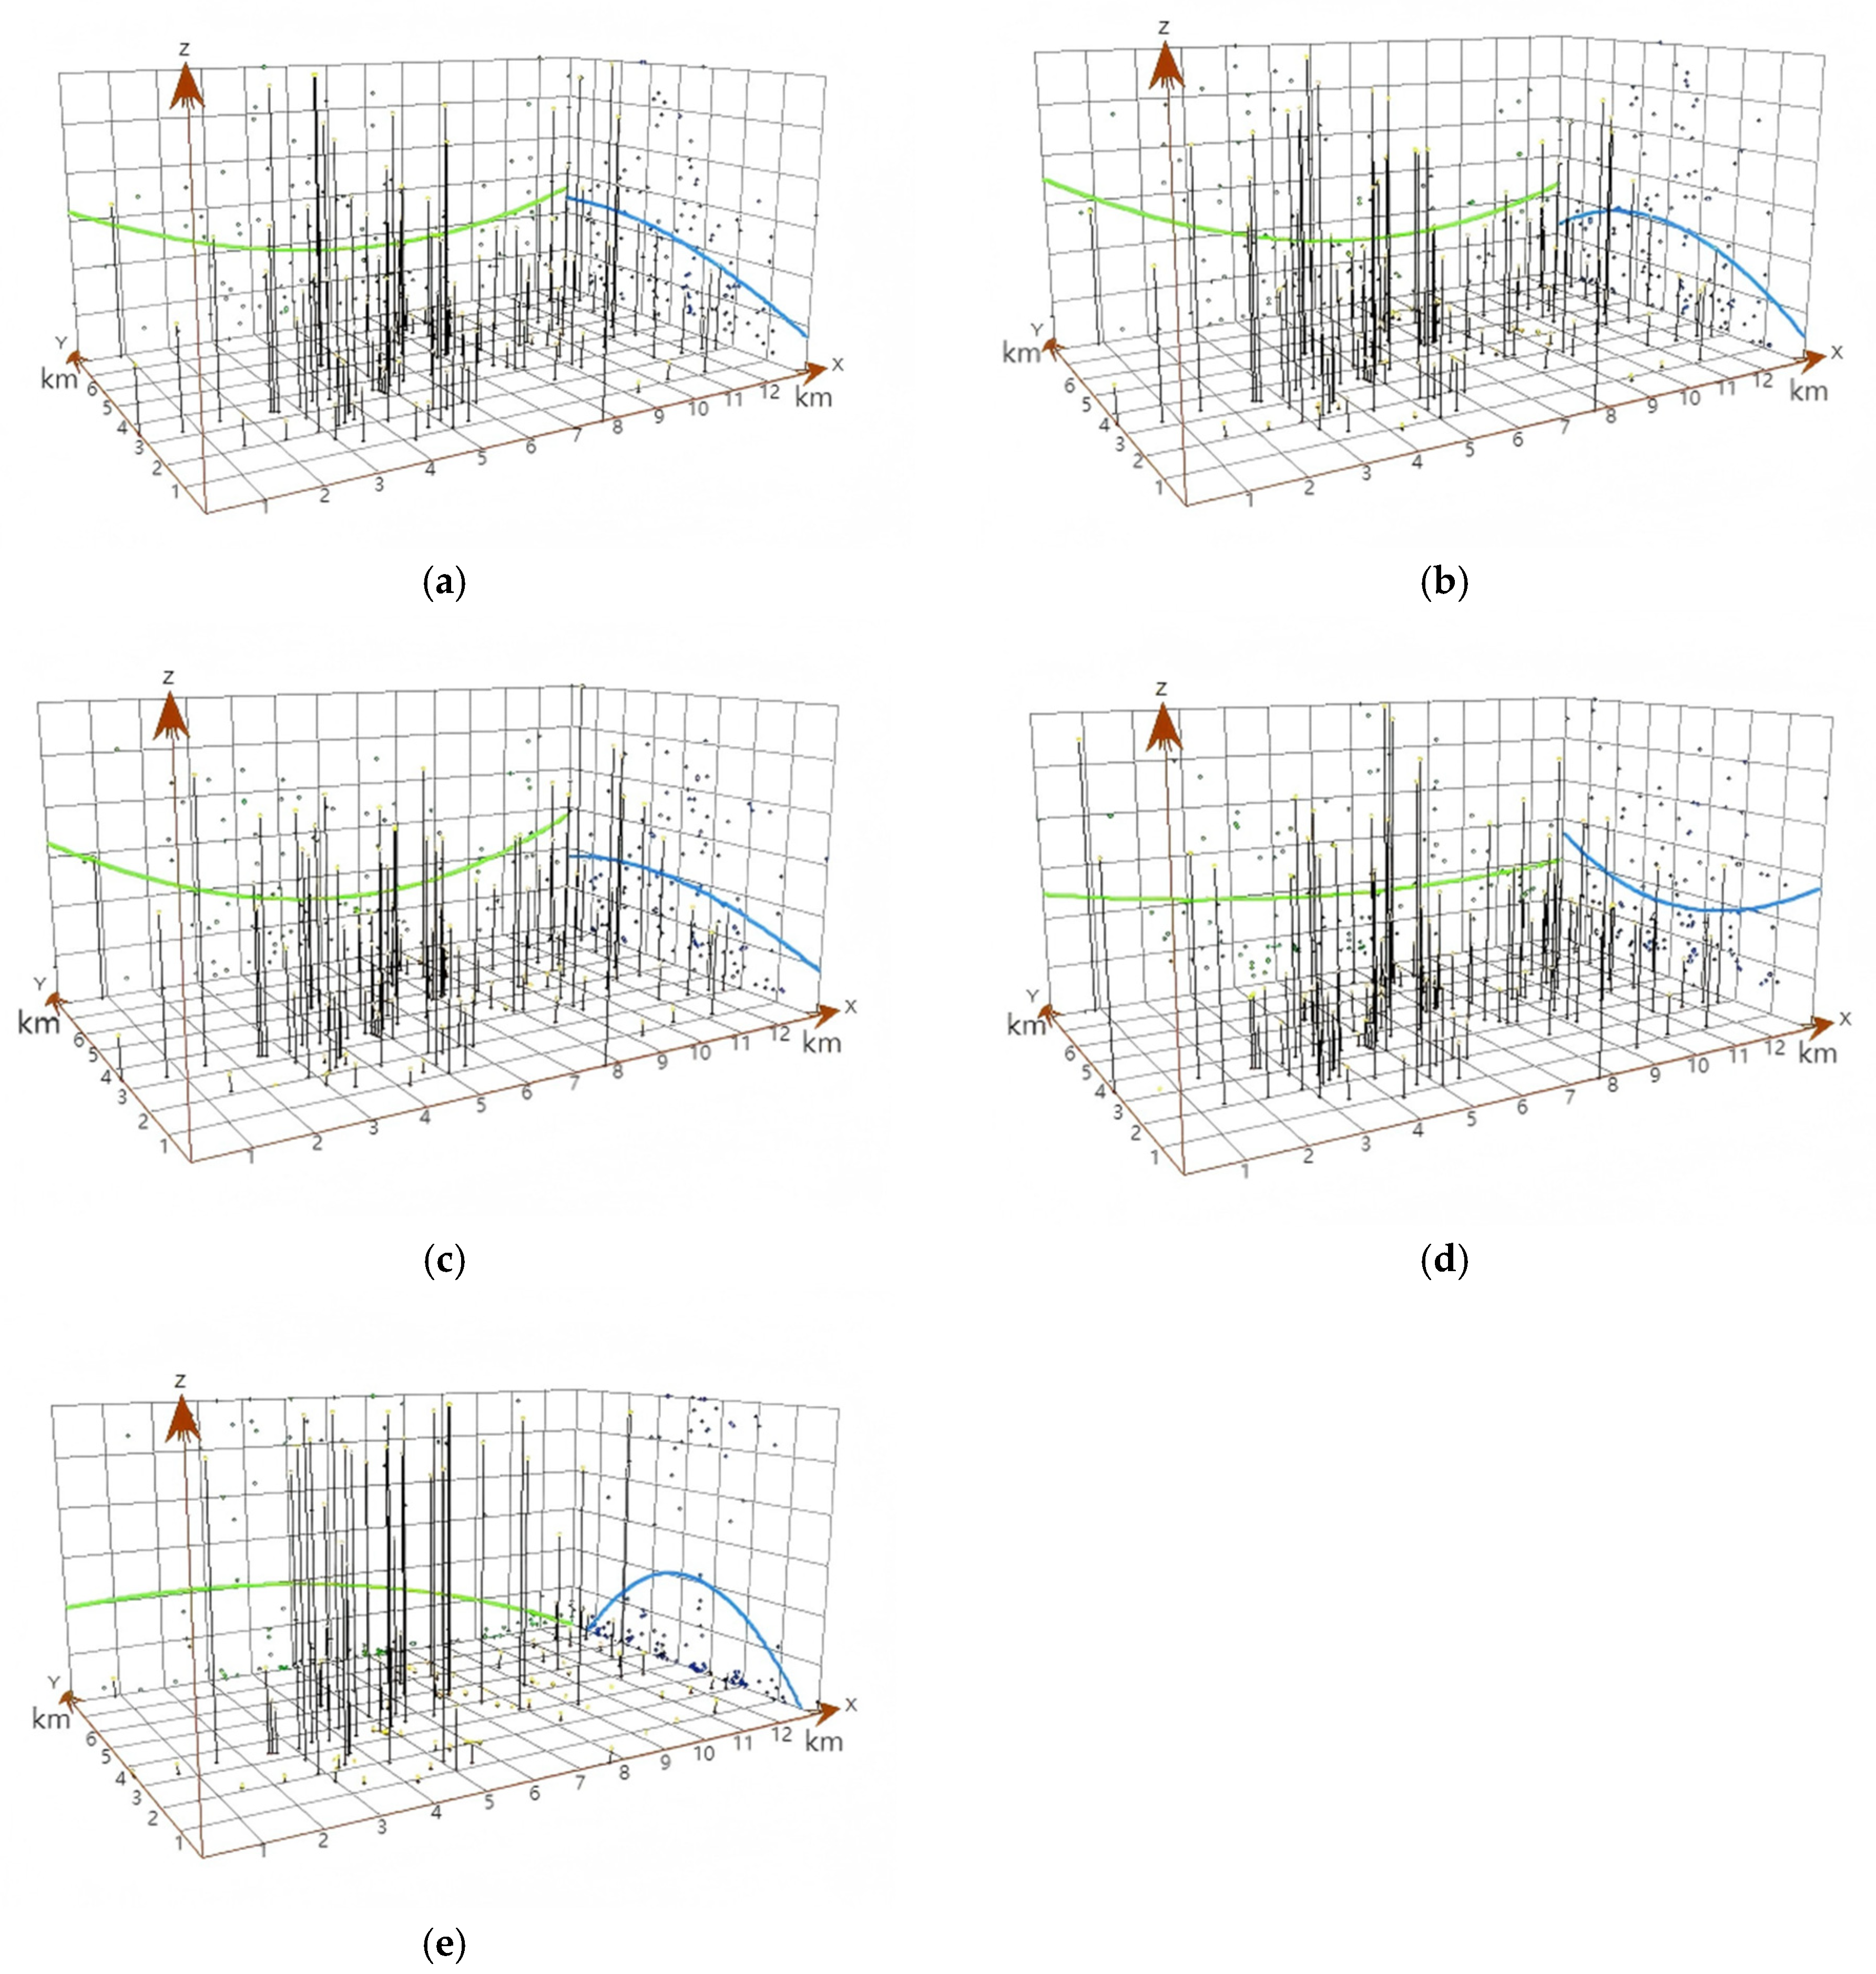
Trend surface analysis is a mathematical method using functions to simulate the spatial distribution and variation trend of geographic objects, reflecting the overall variation trend of spatial data. The existence of global trends significantly affects local variation analysis, so global trends should be removed during local variation analysis. Figure 4 shows the soil nutrient trend maps generated by the geostatistical module of ArcGIS 10.2, where the X-axis represents the due east direction, the Y-axis the due north direction, and the Z-axis the sample values. The green line on the left rear projection represents the east–west global trend, and the blue line on the right rear projection represents the north–south global trend. A parallel coordinate straight line projection indicates no trend; a tilted straight line indicates a first-order trend; a “U”-shaped projection indicates a second-order polynomial trend [23]. To reduce errors caused by high-order global trends requiring more parameters for interpolation, low-order or simple effects were selected for estimation or removed when multiple trend effects or intermediate-order trends existed.
As shown in Figure 4, soil OM shows a “U”-shaped change in the east–west direction (high on both sides, low in the middle) and a decreasing linear trend from north to south. The variation trend of AN was similar to that of OM. TN showed an inverted “U”-shaped trend in the north–south direction, generally close to OM, indicating a strong correlation between nitrogen and organic matter. TP and AP showed a decreasing trend from west to east in the east–west direction and a significant inverted “U”-shaped trend in the north–south direction, possibly related to fertilization and phosphorus migration. Farmlands in the watershed are distributed in the west and along the central river. Fertilization and weak phosphorus migration lead to higher phosphorus concentration in the west and central river areas. For soil nutrients, TP and AP show first-order trends in the east–west direction, while other indices show second-order trends. In the north–south direction, OM and AN showed first-order trends, and others showed second-order trends. In subsequent semivariance analysis, corresponding low-order trend effects were removed based on each soil nutrient’s trend to obtain more accurate results.

3.2.2. Soil Nutrient Semivariance Models

The essence of spatial interpolation research is to use spatial modeling to fit function equations that fully approximate the spatial distribution characteristics of elements. Semivariance analysis (see Figure S1) is the basic step to study soil nutrient spatial variability and the premise for determining geostatistical analysis and Kriging interpolation, identifying the spatial correlation domain of correlated nutrient data. The cross-validation module was used to select the model type with the mean standard deviation (MS) closest to zero, the root mean square of prediction error (RMS) as small as possible, the average standard deviation of prediction (ASE) as close as possible to RMS, and the root mean square standard error of prediction (RMSS) closest to 1 [23], i.e., the model with the largest correlation coefficient between estimated and predicted values is optimal. According to the semivariance function selection criteria, the optimal theoretical models and parameters for soil nutrient indices are shown in Table 5. And the cross-validation result shown in Table 6. Except for AN, whose optimal model was exponential, other nutrients follow spherical models.
In Table 5, C0 represents the pure nugget variance, usually indicating variation caused by experimental error and scales smaller than the sampling scale. (C0 + C) is the sill value, indicating that the semivariance function value increases with the sample interval, stabilizing at a constant value at a certain interval (range). The ratio C/(C0 + C) represents the degree of spatial variability. A higher ratio indicates greater spatial variability from random parts, while a lower ratio indicates greater variability from spatial autocorrelation. A ratio close to 1 means the variable has constant variation across the entire scale. Structurally, the ratio C/(C0 + C) reflects the degree of spatial correlation of system variables: <25% indicates strong spatial correlation, 25–75% indicates moderate correlation, and >75% indicates weak correlation [19]. The principal axis direction shows the overall variation trend of samples, and the range reflects the spatial variation characteristics of soil properties (soil properties are spatially independent beyond the range and correlated within it).
Spatial variability of soil properties results from the combined effect of structural and random factors. Typically, structural factors promote strong spatial correlation of soil nutrients, while random factors weaken it. Table 5 shows that AN has the largest nugget value, followed by AP, indicating strong spatial variability of soil available nutrients at the smallest interval due to human influence. OM also has a large nugget value, suggesting high spatial variability or sampling error. TP and TN have small nugget values, indicating low variation in total nutrient concentration at small scales.
Except for AP, whose nugget effect exceeds 75%, other soil nutrients in the study area show nugget effects of 25–75%, indicating moderate spatial correlation in their distribution. Random factors contribute to the spatial variability of soil nutrients. AP, TP, and AN have large nugget effects, indicating that fertilization significantly impacts phosphorus and AN. AP shows weak spatial correlation, especially affected by random factors. TN has the smallest nugget effect, meaning random factors minimally impact it. OM has a nugget effect of 0.5, with structural and random factors contributing equally.
The range is the distance where the variogram reaches the sill value, representing the spatial autocorrelation distance of soil properties. If the distance between two soil nutrient observations exceeds this value, they are independent; if smaller, they are spatially correlated. TN has the largest range (5333.97 m). Although the sampling mean nearest-neighbor distance is 316.94 m and some sample pairs exceed the range, most meet requirements, indicating the feasibility of spatial interpolation for soil nutrient concentration.

3.3. Kriging Interpolation of Soil Nutrients

3.3.1. Spatial Distribution of OM

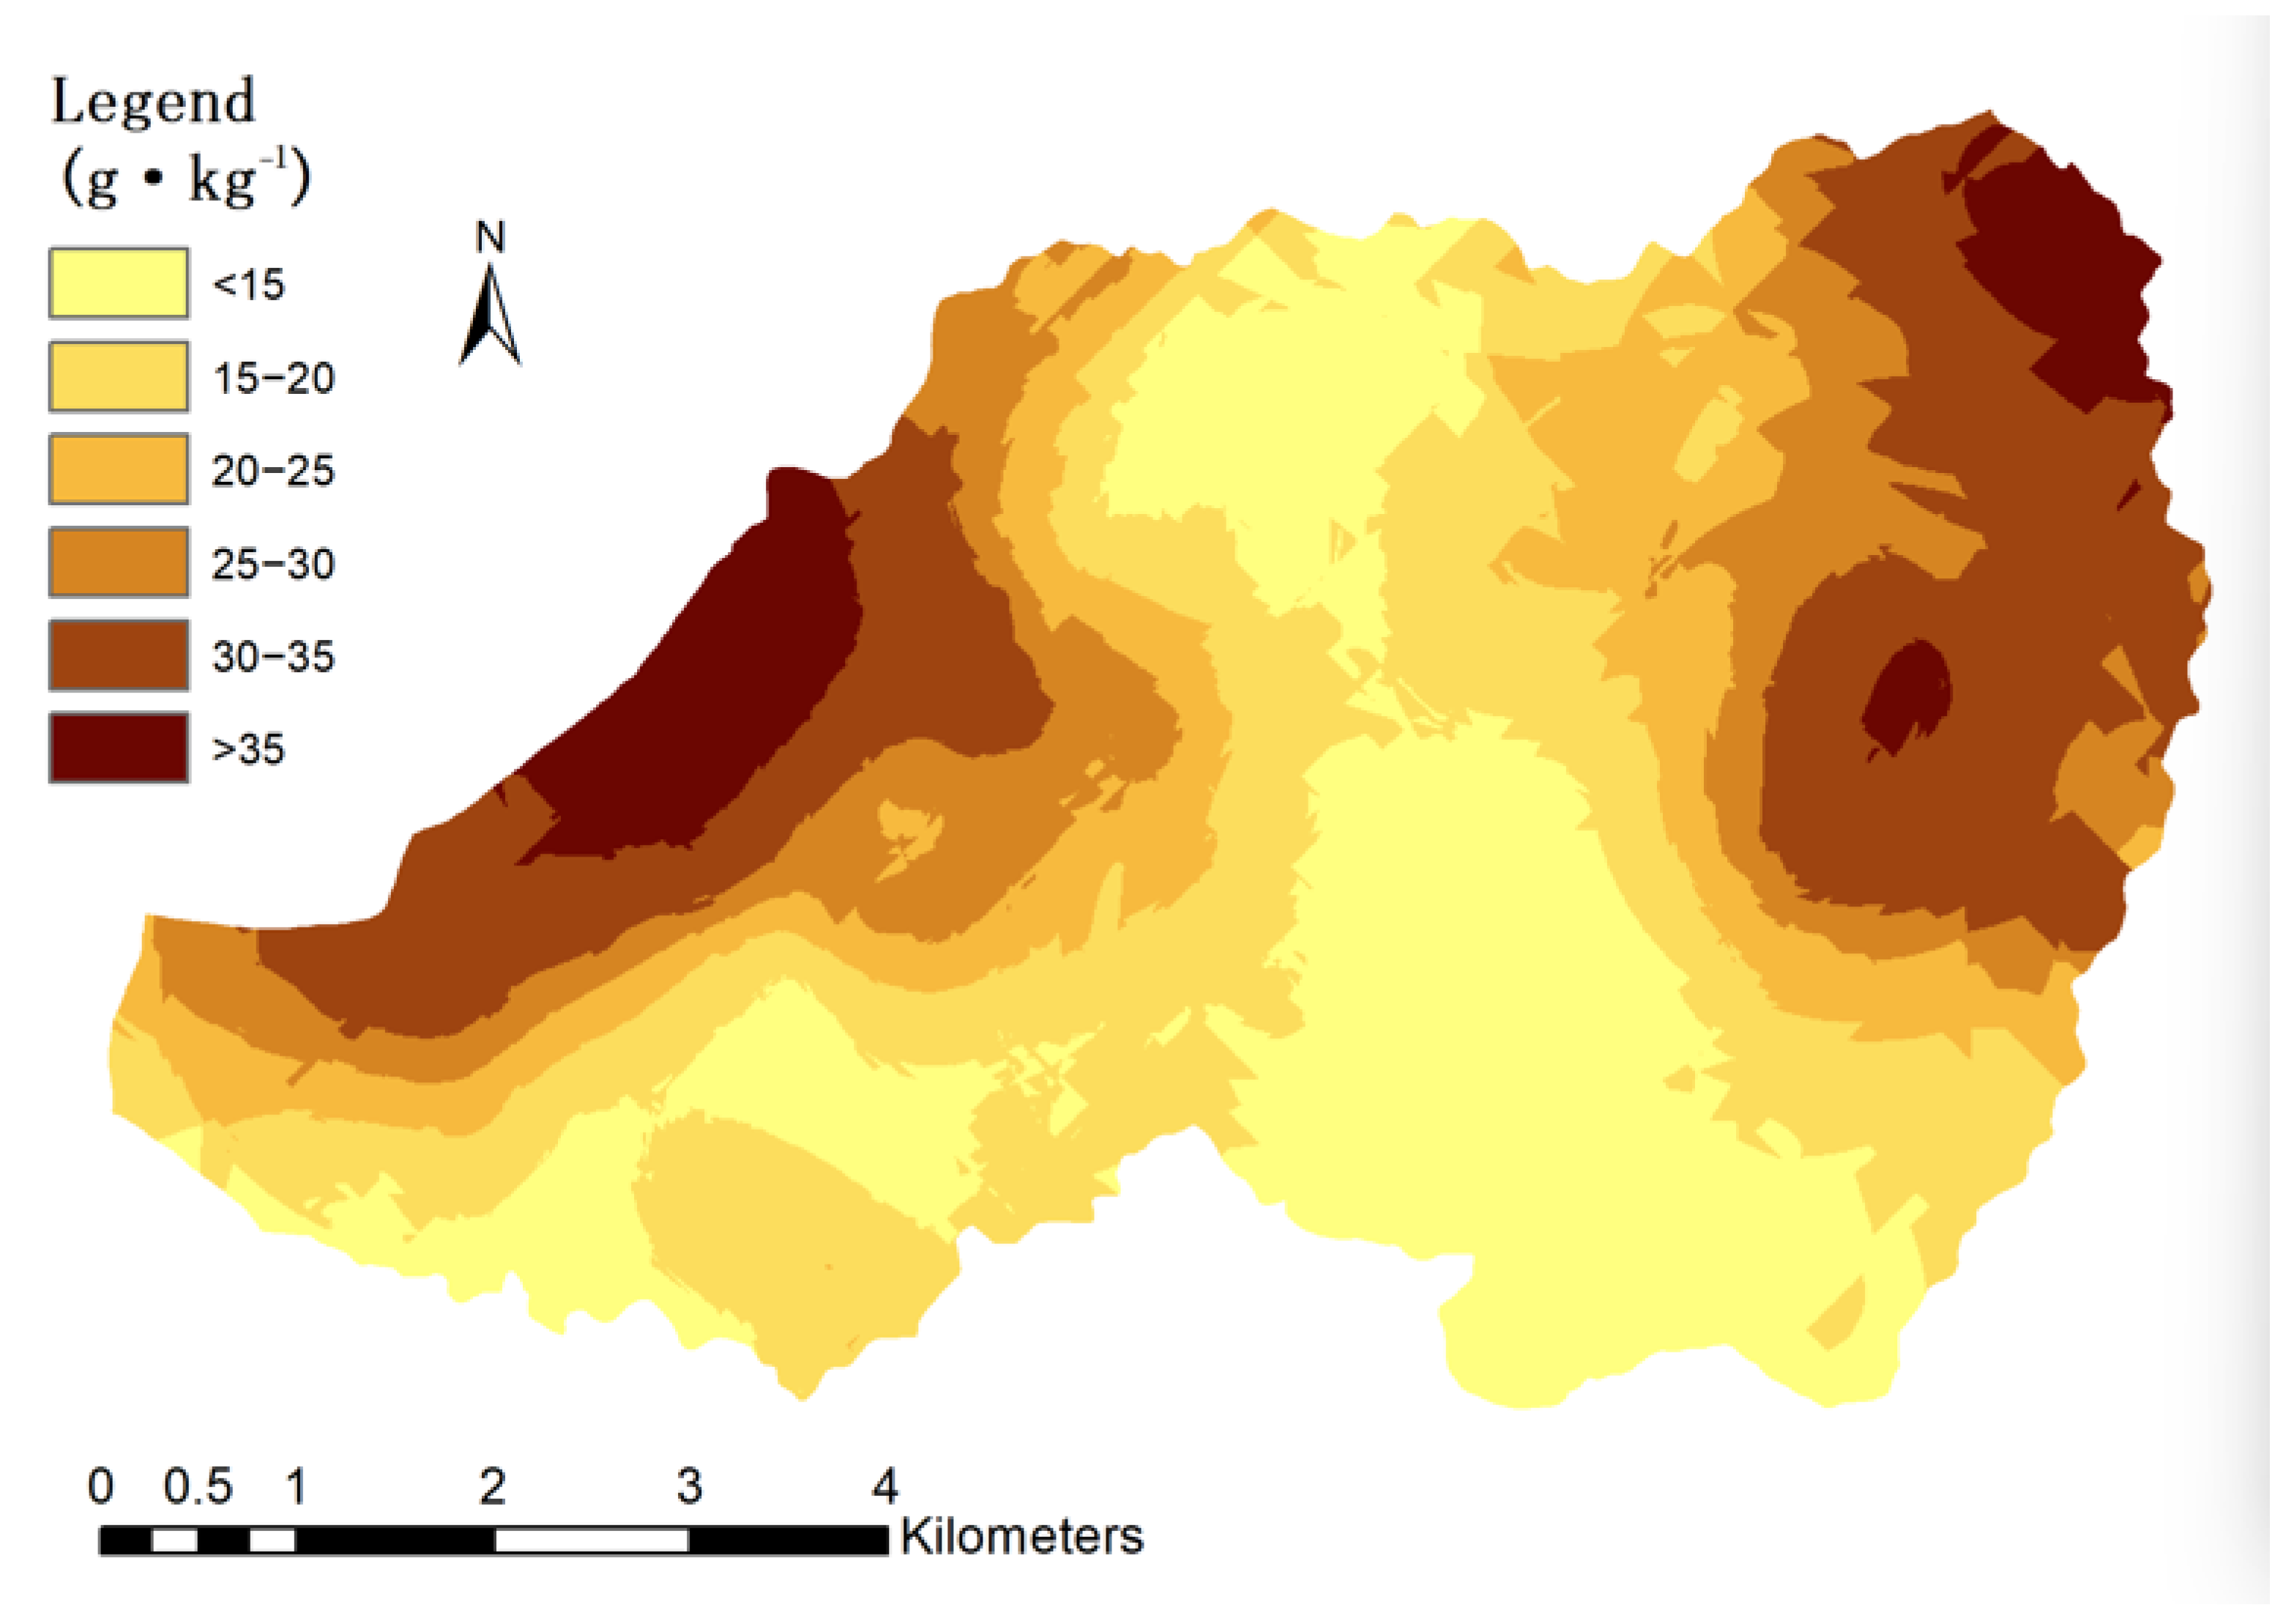
As shown in Figure 5, OM concentration is mostly below 20 g·kg−1, concentrated in the midstream and southern areas of the watershed. Areas above 40 g·kg−1 are patchily distributed in the northwest downstream and northeast upstream. The distribution shows a clear trend of decreasing from northeast to southwest and then gradually increasing, basically consistent with the river direction. The northeast area has high altitude, steep slopes, less human activity, and well-protected vegetation due to long-term forest closure for natural regeneration. During sampling, the research team found an A horizon soil layer ten centimeters thick in valley lows, leading to high OM concentration. The northwest downstream area is a basic farmland protection zone with high-quality cultivated land and high OM concentration. The midstream area has severe soil erosion, with most collapsing hills distributed here, resulting in low OM concentration. The southeast area also has serious soil loss due to forest fires, leading to low OM concentration. Overall, after years of management, OM concentration has significantly improved, especially in the northeast, which has reached a high level through long-term forest closure for natural regeneration. However, OM concentration is still low, particularly in the central area, indicating that OM restoration requires a long process.

3.3.2. Spatial Distribution of TN

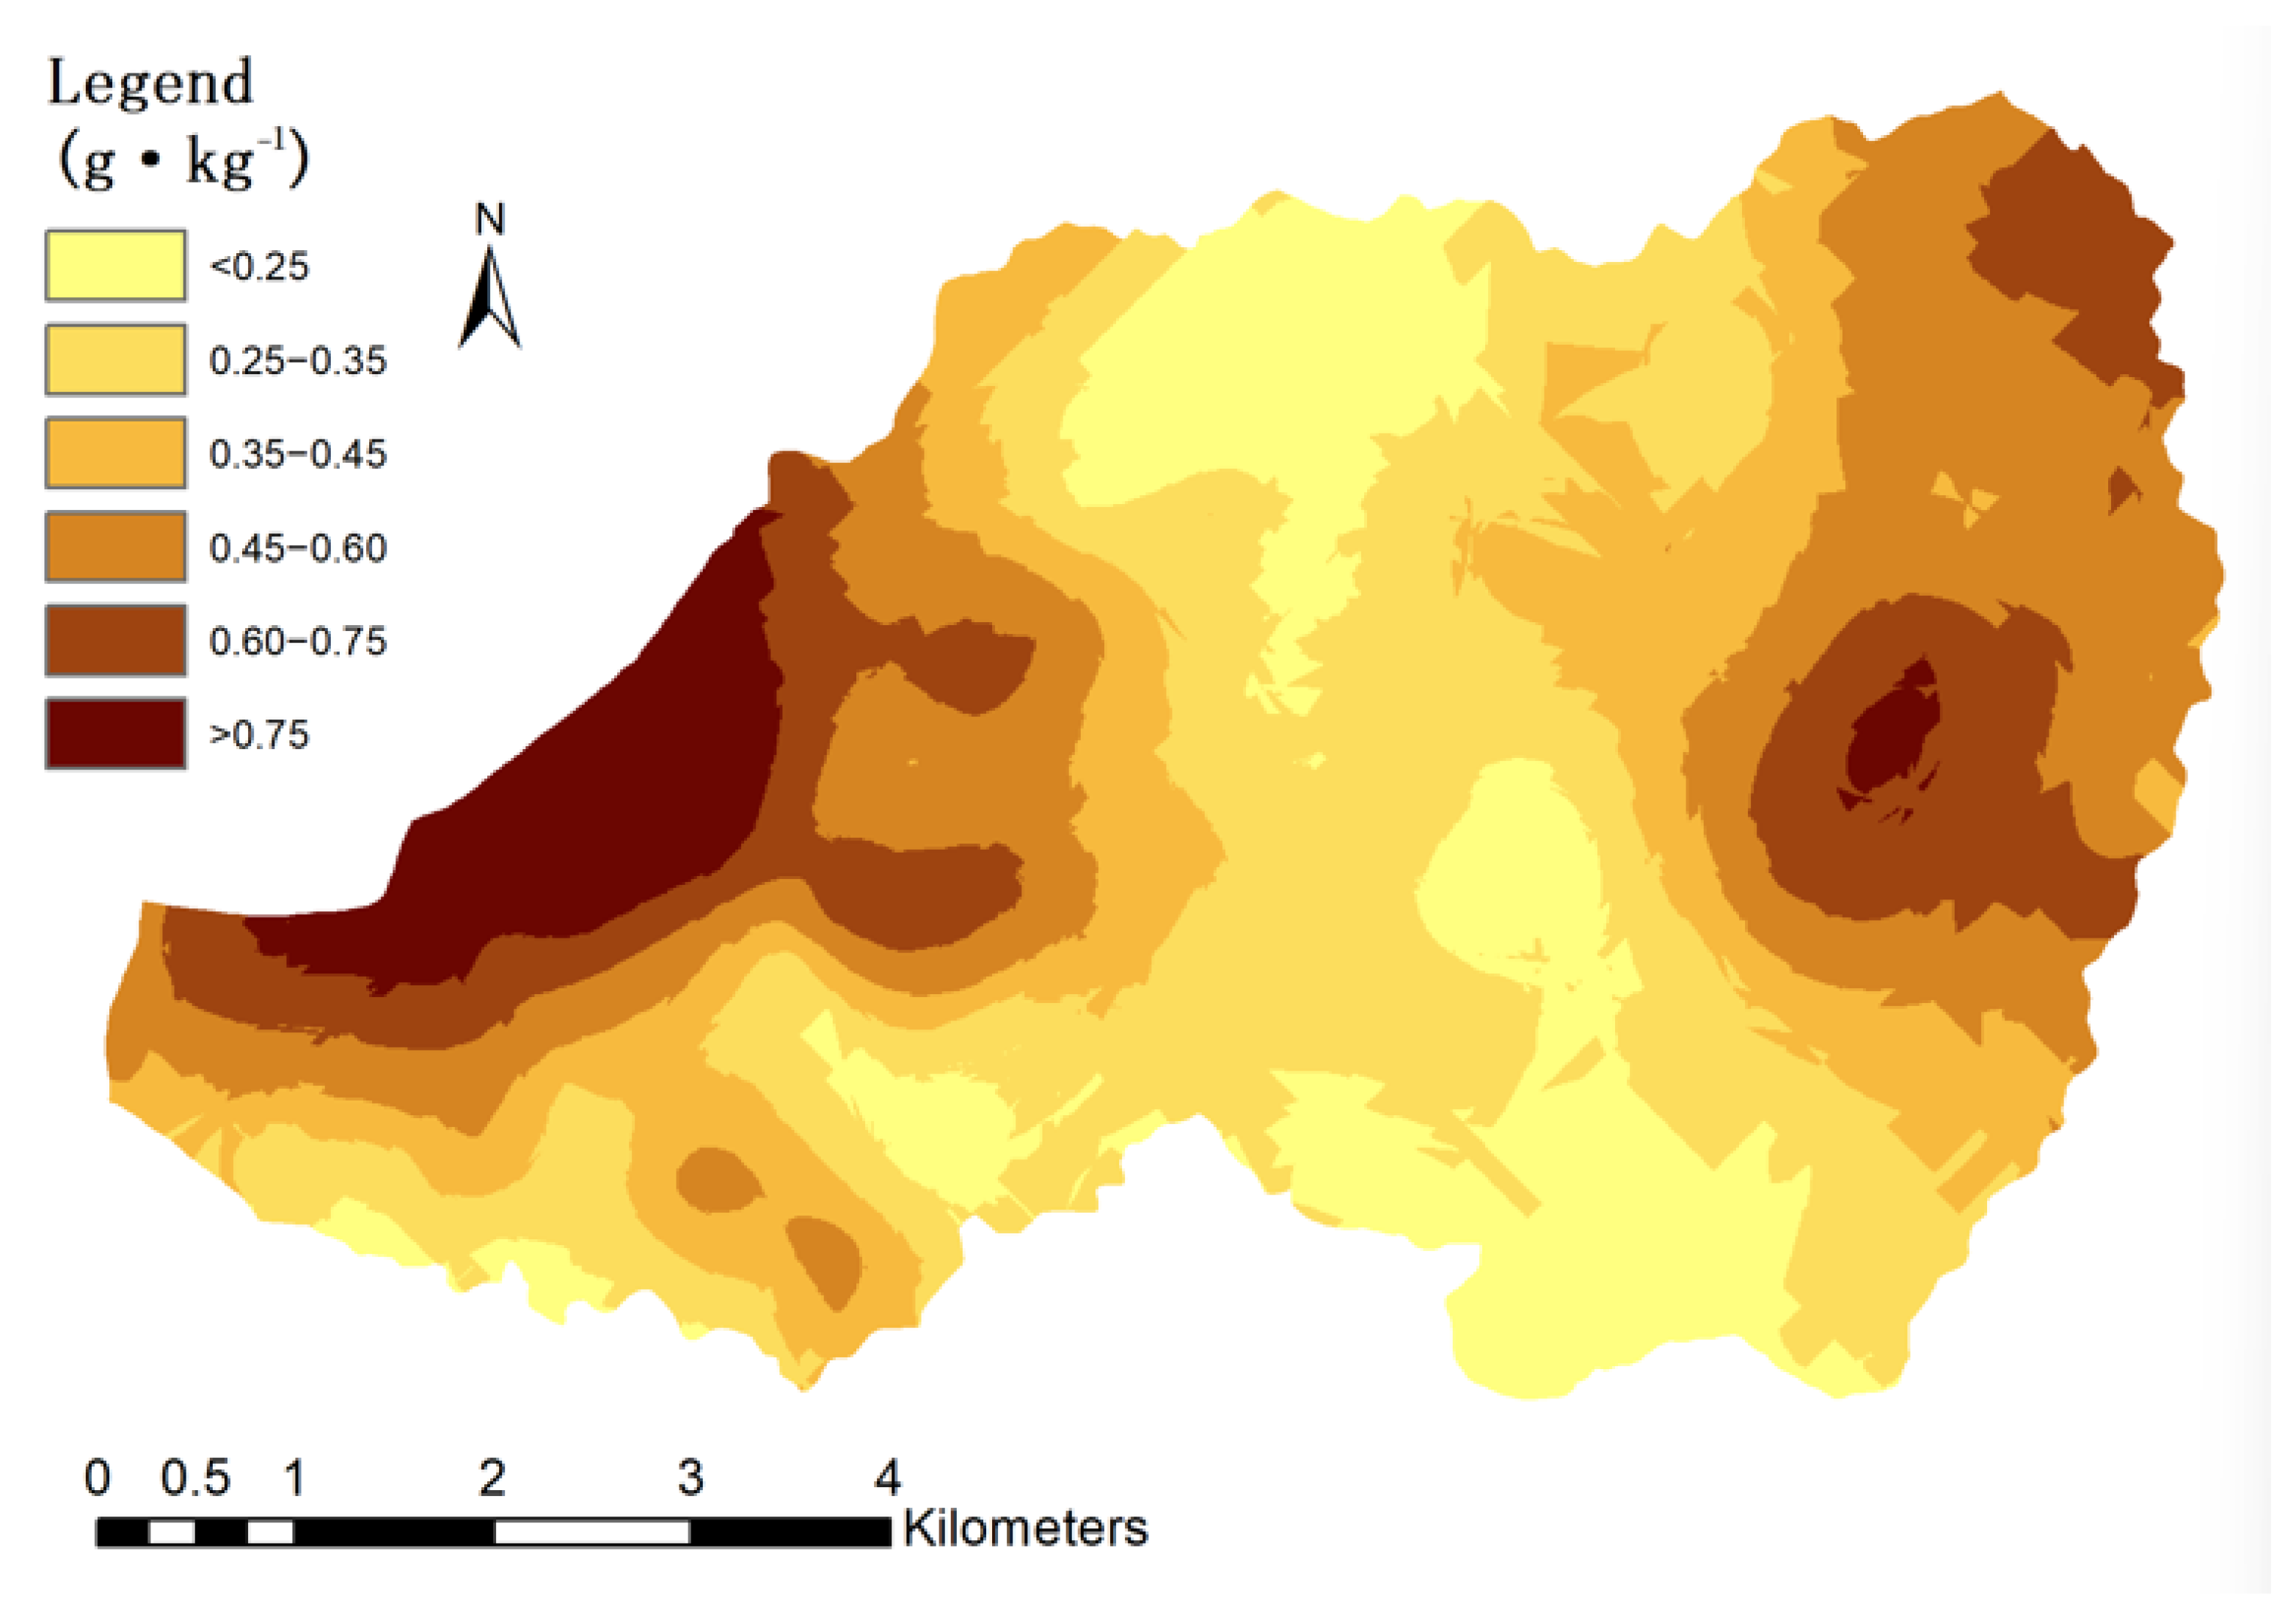
Figure 6 shows that soil TN concentration is mainly below 0.45 g·kg−1, concentrated in the midstream zone, with small high-value areas in the northwest downstream and northeast upstream. Its distribution trend is similar to OM, decreasing first and then increasing from east to west, but in a direction perpendicular to the watershed, showing a more irregular strip distribution. Since soil nitrogen concentration mainly exists in soil organic matter, TN is positively correlated with OM, hence their similar distributions. Additionally, the nitrogen cycle mechanism differs from that of organic matter, and nitrogen distribution is more affected by soil biological cycles, fertilization, and other factors. Thus, although OM concentration is abundant in some areas, the overall TN level in the entire watershed remains low. Nitrogen is the mineral element with the highest plant demand and a common limiting factor for plant growth. Relevant studies show that even with extensive nitrogen fertilization, 50% of nitrogen accumulated in plants still comes from the soil. Therefore, during future watershed development and management, attention should focus not only on nitrogen fertilization but also on improving soil nitrogen concentration.

3.3.3. Spatial Distribution of AN

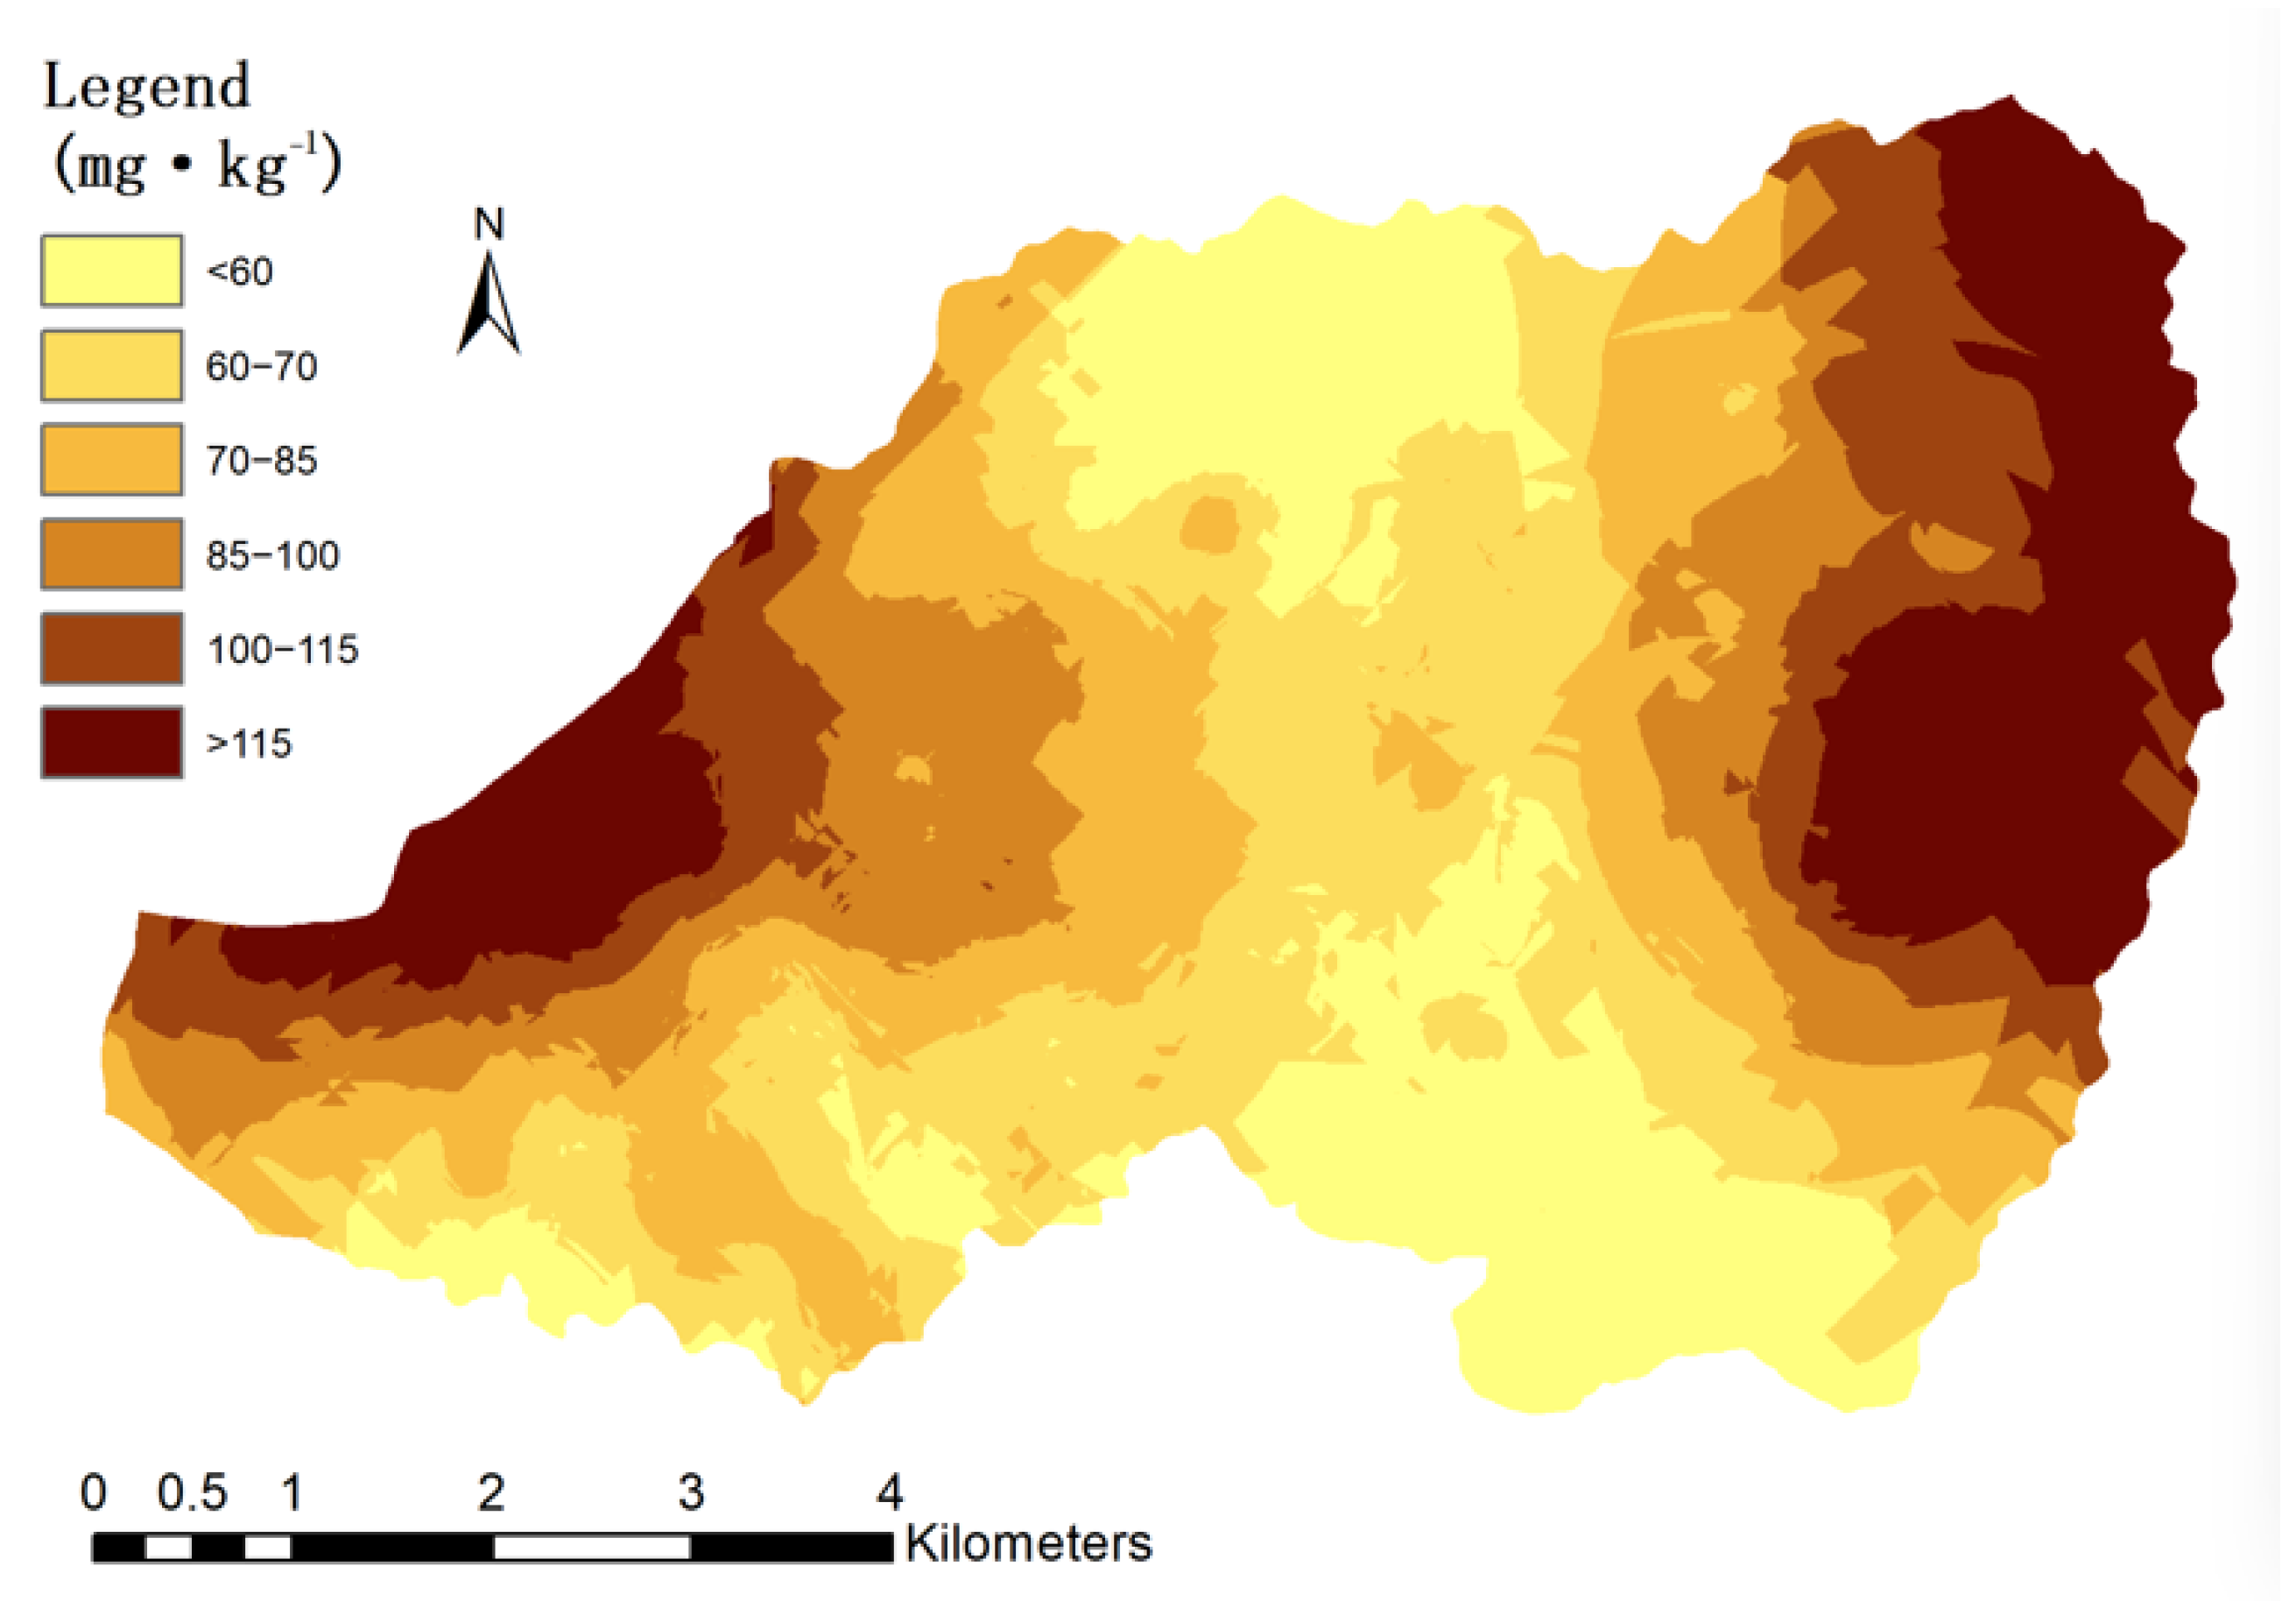
As shown in Figure 7, soil AN concentration is mostly below 85 mg·kg−1, mainly concentrated in the midstream area, with small high-value areas in the northeast upstream and northwest downstream. The distribution trend decreases along the watershed and then increases, similar to OM, further indicating a strong correlation between soil organic matter and nitrogen. AN better reflects the recent soil nitrogen supply status as an indicator of soil nitrogen availability. AN concentration is related to OM concentration and quality: high OM and high maturity lead to high available nitrogen, and vice versa. The eastern area had high vegetation coverage and OM concentration due to long-term forest closure for natural regeneration, so soil nitrogen supply capacity was high. The downstream area had high OM and AN concentration, while the central area had low OM and low AN concentration. Overall, AN was at a medium level, but the central area remains poor. Due to the poor TN level, the long-term nitrogen supply capacity is weak, requiring further improvement through management.

3.3.4. Spatial Distribution of TP

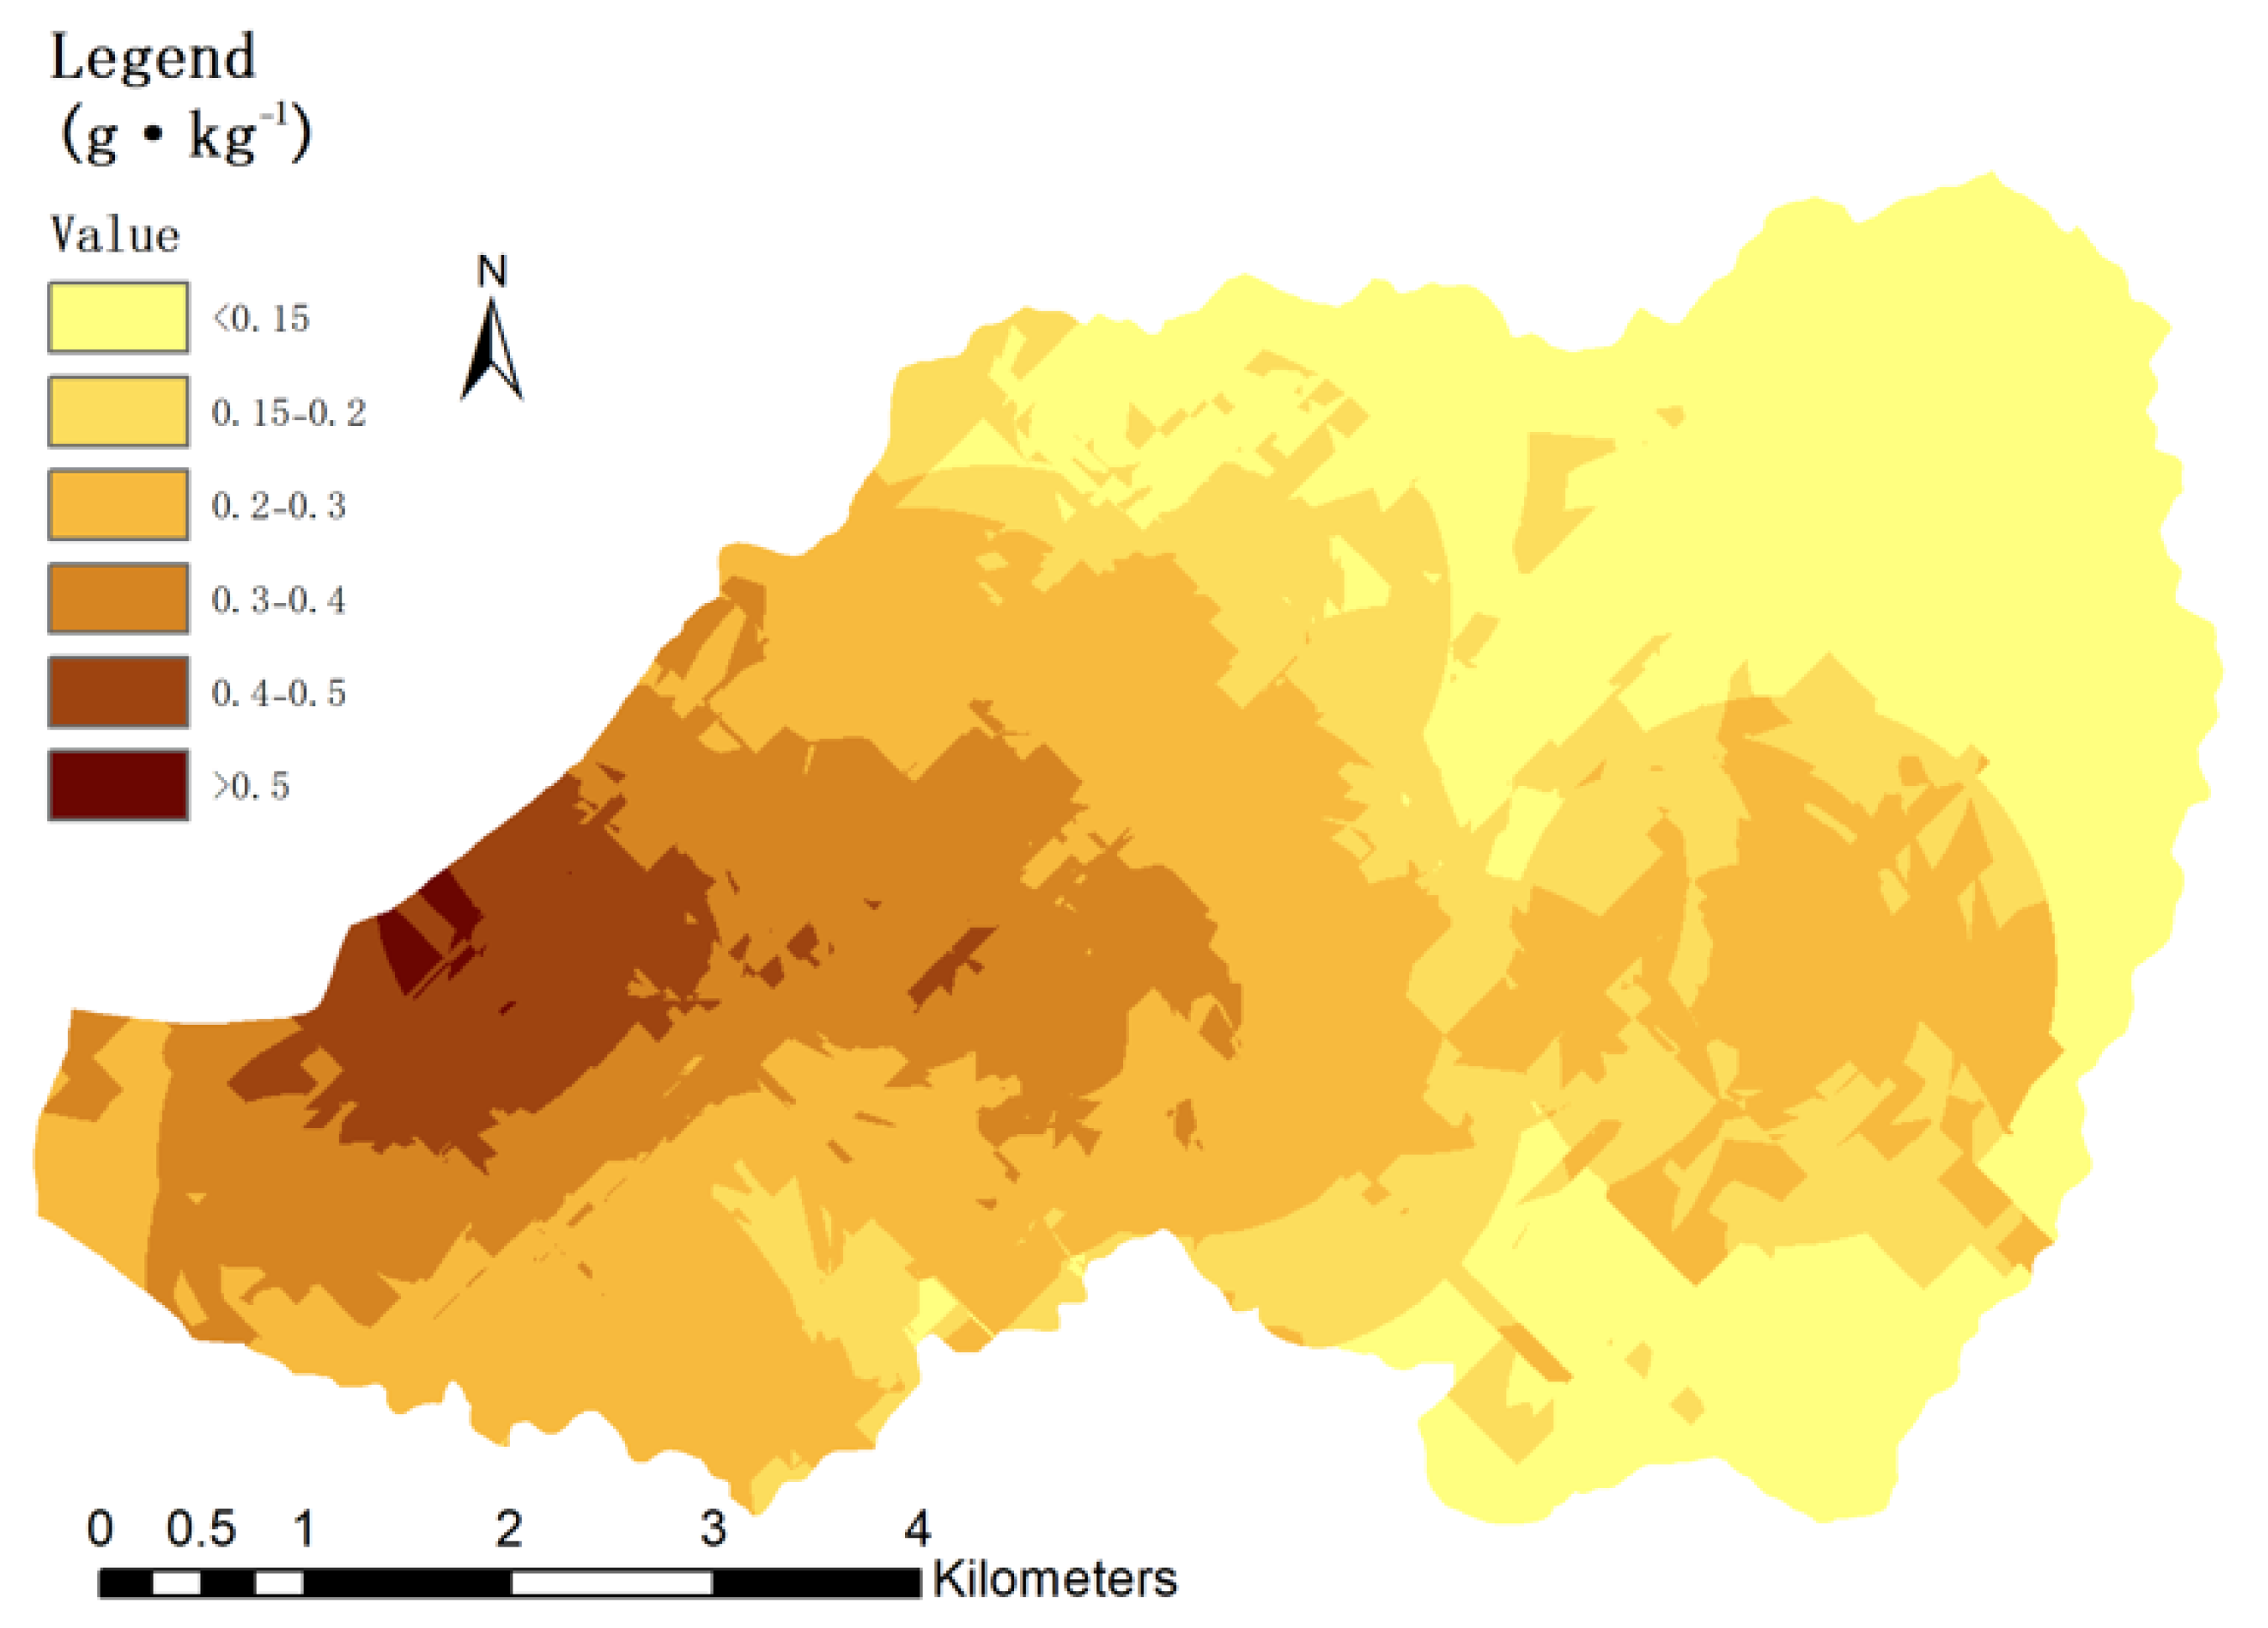
Figure 8 shows that soil TP concentration is mostly below 0.4 g·kg−1 in the mid-upper reaches, with a small concentrated area above 0.4 g·kg−1 in the western downstream. The entire watershed has low TP concentration, with a maximum of only 0.86 g·kg−1. TP distribution was strip-shaped and irregular, generally increasing from east to west, close to the river direction. Soil phosphorus partly comes from parent rocks, and during soil formation, phosphorus migration or enrichment causes significant spatial differences. The figure shows that phosphorus decreases with increasing altitude. Additionally, phosphorus may be affected by fertilization, with relatively higher concentration in downstream farmlands. Most soil TP is in an invalid state for plants, so TP concentration cannot indicate soil phosphorus supply. However, it is generally believed that applying phosphorus fertilizer promotes plant growth when TP is below 0.8–1 g·kg−1 [24]. The figure shows that most areas in the watershed have TP below 0.65 g·kg−1, so phosphorus fertilization should be emphasized during soil erosion control to promote plant growth.

3.3.5. Spatial Distribution of AP

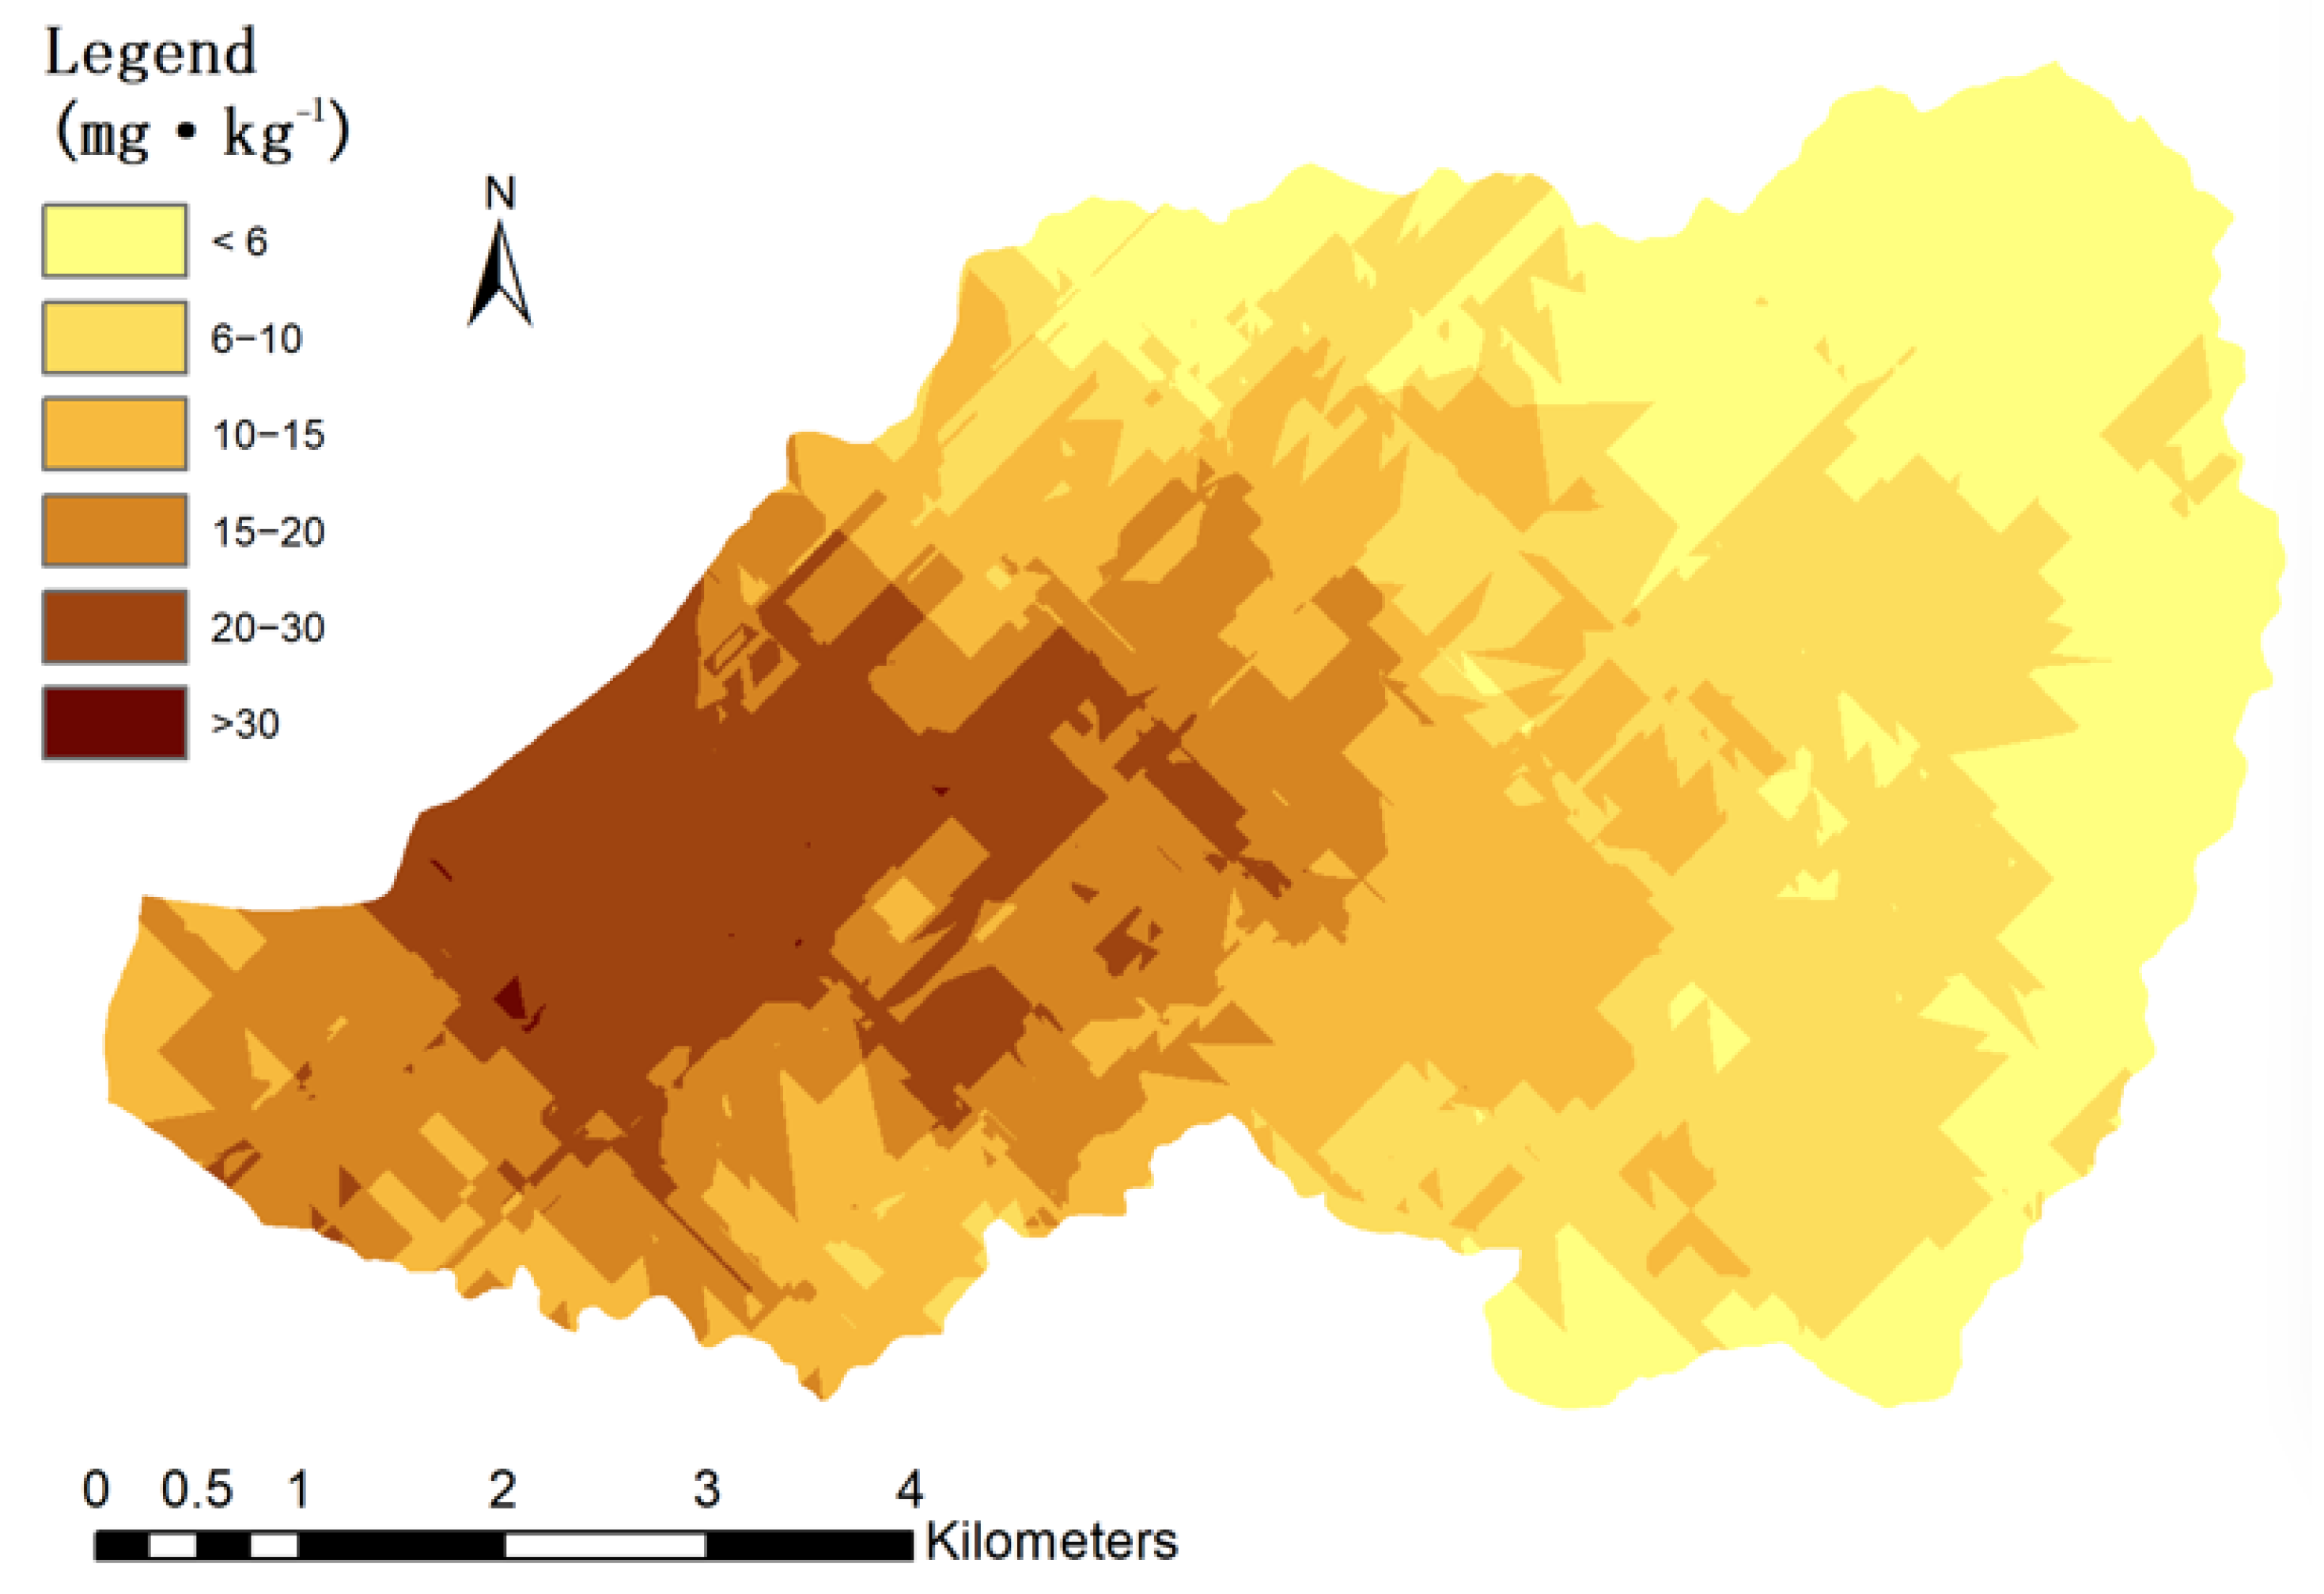
Figure 9 shows that AP distribution is irregular, generally decreasing from west to east. The downstream western area has high AP concentration, with areas near the town exceeding 20 mg·kg−1, indicating a certain “urban effect” on AP. In the upstream area, in high-altitude and steep-slope regions, AP concentration was mostly below 10 mg·kg−1, suggesting that AP may also be affected by topography. Soil AP refers to the part of phosphorus available to plants in the short term, being the most comprehensive indicator reflecting soil phosphorus supply. It depends on soil reactions, total phosphorus concentration, organic matter concentration, particle composition, and other factors. From an environmental safety perspective, soil AP levels reaching 20 mg·kg−1 are in a significantly enriched state [25]. The AP distribution in the study area showed that phosphorus fertilization in downstream farmlands has become wasteful and may even cause environmental pollution. Overall, AP concentration was greatly affected by human fertilization, and the study area’s AP concentration has basically reached a medium level. The lack of TP and enrichment of AP indicate that phosphorus fertilization during watershed management has not been well converted and stored in the soil but is wasted due to irrational application. Therefore, how to apply phosphorus fertilizer according to local conditions requires more attention.

3.4. Relationship Between Soil Erosion and Soil Nutrients

The Kendall correlation analysis results between watershed soil erosion grades and soil nutrient indices are shown in Table 7. Soil erosion grade shows significant associations with various soil nutrients. Specifically, soil erosion grade exhibits a highly significant negative correlation (p < 0.01) with OM, TN, and AN, with correlation coefficients of −0.292, −0.369, and −0.412, respectively. Field surveys also found that carbon and nitrogen were the main causes of soil degradation, consistent with Sun Bo’s [20] research in red soil areas. In contrast, there is a highly significant positive correlation between soil erosion grade and AP (r = 0.259, p < 0.01), suggesting that the AP may increase with the intensification of erosion, a phenomenon that may be related to the migration and accumulation characteristics of phosphorus during the erosion process. Among the soil nutrients themselves, there are also notable correlation patterns. For instance, there is a very strong positive correlation between TN and AN (r = 0.855, p < 0.01), reflecting a close intrinsic link between them. Additionally, TP and AP show a highly significant positive correlation (r = 0.757, p < 0.01), indicating that the AP is largely dependent on the total phosphorus level in the soil. OM is significantly positively correlated with both TN and AN (r = 0.782 and 0.796, respectively, p < 0.01), which may be attributed to the important role of OMr in nitrogen retention and supply in the soil system. During soil erosion control, effective utilization of carbon and nitrogen nutrients must be emphasized to ensure vegetation growth.

4. Conclusions

The nutrient distribution patterns revealed in this study can provide specific guidance for ecological restoration in the Zhuxi watershed: (1) in the northeastern and downstream areas, the existing vegetation coverage should be maintained, and disturbances should be reduced to protect regions with high OM and AN; (2) in the midstream areas with severe erosion, vegetation restoration (such as planting nitrogen-fixing plants) is needed to increase carbon and nitrogen storage; (3) in the downstream farmland, phosphorus fertilizer application strategies should be optimized to avoid pollution risks caused by excessive AP. Compared with the early study on this watershed, the current concentrations of OM and AN have increased significantly, indicating that ecological restoration measures have achieved initial results. However, TN and TP are still at low levels, requiring long-term monitoring and improvement.
While the number of sampling points in the watershed is sufficient to reflect the overall trends, it may underestimate nutrient variations at the microscale (<100 m). Additionally, this study did not include analyses of soil pH and potassium concentration, which limits the comprehensive evaluation of soil fertility. Specifically, soil pH indirectly influences the cycling of nutrients such as carbon, nitrogen, and phosphorus by regulating nutrient transformation (e.g., changes in chemical forms) and microbial activity. Meanwhile, available potassium—an essential nutrient for crop growth—may provide supplementary insights into red soil fertility evaluation through its associations with soil erosion and ecological restoration measures. These factors should therefore be incorporated in subsequent research.

Supplementary Materials

The following supporting information can be downloaded at: https://www.mdpi.com/article/10.3390/nitrogen6030077/s1, Figure S1: The semivariogram plots of soil nutrient in the Zhuxi watershed: (a) OM, (b) TN, (c) AN, (d) TP, (e) AP; Table S1: The intensity grade index of soil erosion; Folder S1: point118.

Author Contributions

Conceptualization, H.C. and Z.C.; methodology, H.C.; software, S.F.; validation, G.L., Y.S. and F.C.; formal analysis, S.F.; investigation, F.C.; resources, G.L.; data curation, Y.S.; writing—original draft preparation, S.F.; writing—review and editing, H.C.; visualization, H.C.; supervision, Z.C.; project administration, Z.C.; funding acquisition, H.C. All authors have read and agreed to the published version of the manuscript.

Funding

This research was funded by the Natural Science Foundation of Fujian Province, China, grant number 2023J01928.

Data Availability Statement

All data generated or analyzed during this study are included in this article.

Conflicts of Interest

The authors declare no conflicts of interest.

References

  1. Wang, N.; He, H.; Lacroix, C.; Morris, C.; Liu, Z.; Ma, F. Soil fertility, leaf nutrients and their relationship in kiwifruit orchards of China’s central Shaanxi province. Soil Sci. Plant Nutr. 2019, 65, 369–376. [Google Scholar] [CrossRef]
  2. Xia, R.; Zhang, S.-Q.; Li, J.; Li, H.; Ge, L.-S.; Yuan, G.-L. Spatial distribution and quantitative identification of contributions for nutrient and beneficial elements in top- and sub-soil of Huairou District of Beijing, China. Ecol. Indic. 2023, 154, 110853. [Google Scholar] [CrossRef]
  3. Chaurasia, M.; Patel, K.; Bhadouria, R.; Rao, K.S. Spatial variability in soil physicochemical parameters across land use classes in the peri-urban landscape. Environ. Dev. Sustain. 2023, 26, 24791–24815. [Google Scholar] [CrossRef]
  4. Tian, M.; Sun, B.; Wu, C.; Cheng, X.; Zhou, G.; Huang, C.; Zhou, Y.; Hu, Q.; Li, L. Spatial distributions and the main driving factors of soil total nitrogen in Zhejiang Province, China. Geoderma 2024, 452, 117112. [Google Scholar] [CrossRef]
  5. Cao, Y.; Ouyang, Z.Y.; Zheng, H.; Huang, Z.G.; Wang, X.K.; Miao, H. Effects of forest plantations on rainfall redistribution and erosion in the red soil region of Southern China. Land Degrad. Dev. 2010, 19, 321–330. [Google Scholar] [CrossRef]
  6. Liang, Y.; Li, D.; Lu, X.; Yang, X.; Pan, X.; Mu, H.; Shi, D. Soil erosion changes over the past five decades in the red soil region of Southern China. J. Mt. Sci. 2010, 7, 92–99. [Google Scholar] [CrossRef]
  7. Wu, X.; Jiang, N.; Li, A.; Yang, Y.; Cheng, H. Spatial distribution pattern of soil organic matter in the wind erosion region of northeastern China based on the cokriging method. Catena 2025, 248, 108575. [Google Scholar] [CrossRef]
  8. Zhou, W.; Li, C.; Zhao, W.; Stringer, L.C.; Fu, B. Spatial distributions of soil nutrients affected by land use, topography and their interactions, in the Loess Plateau of China. Int. Soil Water Conserv. Res. 2024, 12, 227–239. [Google Scholar] [CrossRef]
  9. Webster, R. Quantitative Spatial Analysis of Soil in the Field. In Advances in Soil Science; Springer: New York, NY, USA, 1985; pp. 1–70. [Google Scholar]
  10. Webster, R.; Oliver, M.A. Optimal interpolation and isarithmic mapping of soil properties. VI. Disjunctive kriging and mapping the conditional porbability. J. Soil Sci. 1989, 40, 497–512. [Google Scholar] [CrossRef]
  11. Qi, G.; Lu, H.; Zang, Y.; Zhang, J.; Li, X.; Hu, X. Predicting Soil Organic Carbon Content by Combining Unmanned Aerial Vehicle Multispectral Images and Machine Learning Algorithms. J. Soil Sci. Plant Nutr. 2025, 25, 1–15. [Google Scholar] [CrossRef]
  12. Haefele, S.M.; Wopereis, M.C.S. Spatial variability of indigenous supplies for N, P and K and its impact on fertilizer strategies for irrigated rice in West Africa. Plant Soil 2005, 270, 57–72. [Google Scholar] [CrossRef]
  13. Cahn, M.D.; Hummel, J.W.; Brouer, B.H. Spatial Analysis of Soil Fertility for Site-Specific Crop Management. Soil Sci. Soc. Am. J. 1994, 58, 1240–1248. [Google Scholar] [CrossRef]
  14. Yost, R.S.; Uehara, G.; Fox, R.L. Geostatistical Analysis of Soil Chemical Properties of Large Land Areas. II. Kriging. Soil Sci. Soc. Am. J. 1982, 46, 1033–1037. [Google Scholar] [CrossRef]
  15. Gaston, L.A.; Locke, M.A.; Zablotowicz, R.M.; Reddy, K.N. Spatial Variability of Soil Properties and Weed Populations in the Mississippi Delta. Soil Sci. Soc. Am. J. 2001, 65, 449–459. [Google Scholar] [CrossRef]
  16. Chen, Z.; Chen, Z. Spatial misallocation of ecological restoration and resulting economic costs in the red soil hilly region of China: A case study of the Zhuxi watershed. Environ. Monit. Assess. 2020, 192, 125. [Google Scholar] [CrossRef]
  17. Chen, H.; Chen, H.; Chen, Z.; Chen, Z. The ecological impacts of residues from the heap leaching of ion-adsorption rare earth clays. Int. J. Environ. Sci. Technol. 2023, 20, 13267–13276. [Google Scholar] [CrossRef]
  18. Lu, R. Methods of Soil Agricultural Chemical Analysis; China Agricultural Science and Technology Press: Beijing, China, 2020. [Google Scholar]
  19. Ettema, C.H.; Wardle, D.A. Spatial soil ecology. Trends Ecol. Evol. 2002, 17, 177–183. [Google Scholar] [CrossRef]
  20. Sun, B.; Zhao, Q. Spatio-temporal variability of red soil ferility in low hilly region. Acta Pedol. Sin. 2002, 39, 190–198. [Google Scholar]
  21. Yan, P.; Zhou, P.; Lei, S.; Tan, Z.; Chen, H.; Huang, J. Spatial Distribution of Soil Nutrients in the Red Beds of Southern China and Their Responses to Different Land Use Types. Forests 2025, 16, 417. [Google Scholar] [CrossRef]
  22. Wang, D.; Huang, Y.; Wang, C.; Jiang, F.; Yan, F.; Yu, Y. Comprehensive evaluation of control benefits in granite areas with severe soil and water loss. Fujian Sci. Technol. Trop. Crops 2006, 31, 4–7. [Google Scholar]
  23. Tang, G.; Yang, X. Experimental Tutorial on Spatial Analysis of ArcGIS Geographic Information System; Science Press: Beijing, China, 2012. [Google Scholar]
  24. Zhang, Q.; Zhou, J.; Li, X.; Yang, Z.; Zheng, Y.; Wang, J.; Lin, W.; Xie, J.; Chen, Y.; Yang, Y. Are the combined effects of warming and drought on foliar C:N:P:K stoichiometry in a subtropical forest greater than their individual effects? For. Ecol. Manag. 2019, 448, 256–266. [Google Scholar] [CrossRef]
  25. Jorquera, M.A.; Martínez, O.A. Effect of nitrogen and phosphorus fertilization on the composition of rhizobacterial communities of two Chilean Andisol pastures. World J. Microbiol. Biotechnol. 2014, 30, 99–107. [Google Scholar] [CrossRef] [PubMed]
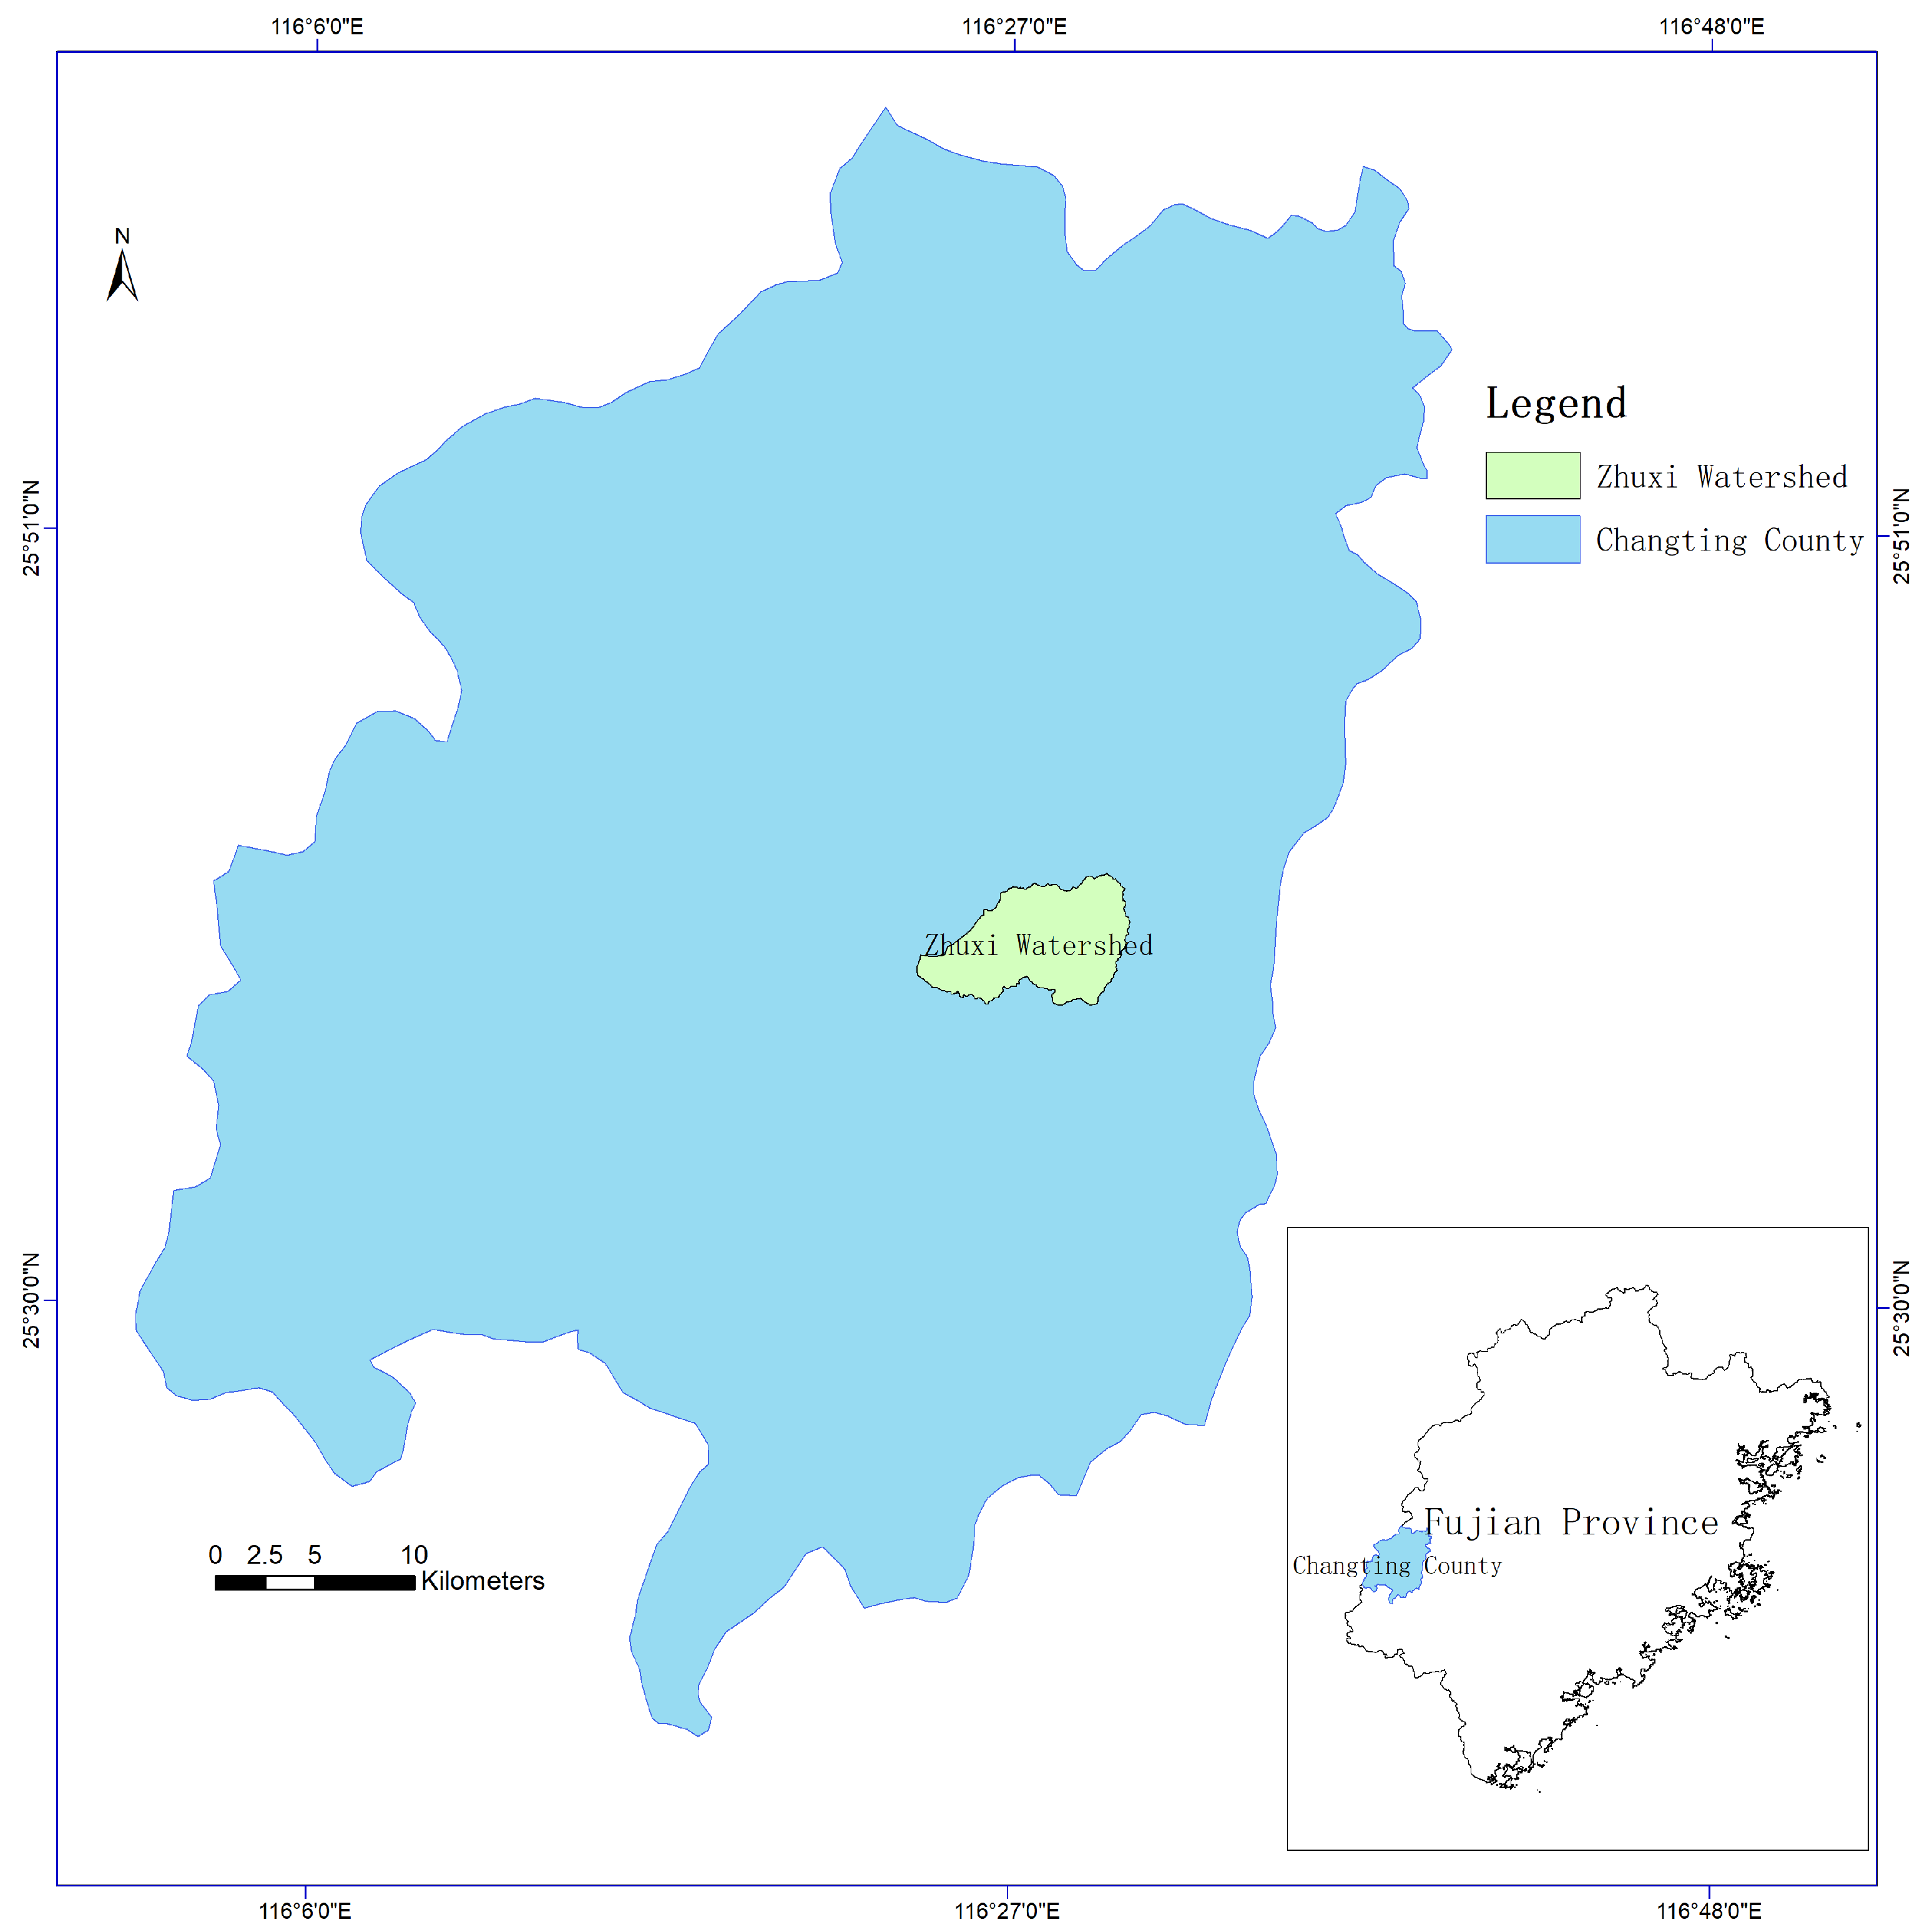
Figure 1. The location of study area.
Nitrogen 06 00077 g001
Figure 2. The map of soil erosion in the Zhuxi watershed.
Nitrogen 06 00077 g002
Figure 3. The distribution of soil sampling site in the Zhuxi watershed.
Nitrogen 06 00077 g003
Figure 4. The trend chart of soil nutrients in the Zhuxi watershed: (a) OM, (b) TN, (c) AN, (d) TP, (e) AP.
Nitrogen 06 00077 g004
Figure 5. The spatial distribution of OM in the Zhuxi watershed.
Nitrogen 06 00077 g005
Figure 6. The spatial distribution of TN in the Zhuxi watershed.
Nitrogen 06 00077 g006
Figure 7. The spatial distribution of AN in the Zhuxi watershed.
Nitrogen 06 00077 g007
Figure 8. The spatial distribution of TP in the Zhuxi watershed.
Nitrogen 06 00077 g008
Figure 9. The spatial distribution of AP in the Zhuxi watershed.
Nitrogen 06 00077 g009
Table 1. The grade of soil erosion in the Zhuxi watershed.
Soil Erosion TypeGradeArea (km2)
Slight erosion127.39
Light erosion211.82
Moderate erosion33.81
Intense erosion41.28
Extreme erosion50.47
Severe erosion60.17
Table 2. The analyzed items and methods.
Analysis ItemsAnalysis Methods
OMHigh-temperature External Heating Potassium Dichromate Oxidation–Volumetric Method
TNKjeldahl Digestion Method
ANAlkali Hydrolysis–Diffusion Method
TPSodium Hydroxide Fusion-Molybdenum–Antimony-Anti Colorimetric Method
APDouble Acid Extraction-Molybdenum–Antimony-Anti Colorimetric Method
Table 3. The statistical characteristics of soil in the Zhuxi watershed.
ItemSampleMeanMinMaxSDCV
(%)
SkewnessKurtosis
OM (g·kg−1)11822.280.2967.3817.290.780.933.15
TN (g·kg−1)1180.420.041.30.340.810.782.51
AN (mg·kg−1)11879.9815.25230.3850.750.630.702.52
TP (g·kg−1)1180.250.040.80.220.881.39/0.47 *3.46/2.34 *
AP (mg·kg−1)11814.030.15620.261.441.17/0.08 *2.59/1.86 *
Note: SD standard deviation, CV coefficient of variation, * the value after natural logarithm transformation.
Table 4. The classification standard of soil nutrient.
GradeOM (g·kg−1)TN (g·kg−1)AN (mg·kg−1)TP (g·kg−1)AP (mg·kg−1)
1>40>2>150>2>40
230–401.5–2120–1501.5–220–40
320–301–1.590–1201–1.510–20
410–200.75–160–900.7–15–10
56–100.5–0.7530–600.4–0.73–5
6<6<0.5<30<0.4<3
Table 5. The semivariance theory model and parameters of soil nutrient in the Zhuxi watershed.
ItemModelNugget (C0)Sill (C0 + C)C0/(C0 + C) (%)Range
(m)
R2
OMSpherical151.94294.700.522655.980.499
TNSpherical0.040.100.391422.390.805
ANExponential1536.102726.000.565333.970.531
TPSpherical0.400.710.562422.900.698
APSpherical357.24470.810.76844.500.699
Table 6. The cross-validation result.
ItemMeanRoot Mean
Square
Mean StandardizedRoot Mean
Square Standardized
Average Standard
Error
OM−0.1537214.86525−0.009610.9306316.14202
TN0.000690.306850.001620.962730.32179
AN−0.4848948.02672−0.008891.0076747.52079
TP0.005230.221420.020230.917480.24351
AP0.0159219.5293−0.000220.9687220.20895
Table 7. Correlation coefficients of soil erosion grade and soil nutrients.
Soil Erosion GradeOMTNANTPAP
Soil erosion grade1−0.292 **−0.369 **−0.412 **0.0420.259 **
OM 10.782 **0.796 **0.315 **0.149 *
TN 10.855 **0.433 **0.216 **
AN 10.389 **0.163 *
TP 10.757 **
AP 1
Note: ** means significant correlation at 0.01 level, * means significant correlation at 0.05 level.
Disclaimer/Publisher’s Note: The statements, opinions and data contained in all publications are solely those of the individual author(s) and contributor(s) and not of MDPI and/or the editor(s). MDPI and/or the editor(s) disclaim responsibility for any injury to people or property resulting from any ideas, methods, instructions or products referred to in the content.