Article

Effect of Biochar-Coated Urea on Soil Nitrogen, Plant Uptake, and Sweet Corn Yield in Sandy Soil

by
Sa’adah Shofiati
1,
Gabryna Auliya Nugroho
2,
Zaenal Kusuma
2 and
Syahrul Kurniawan
2,*
1
Soil and Water Management Study Program, Faculty of Agriculture, Universitas Brawijaya, Malang 65145, Indonesia
2
Department of Soil Science, Faculty of Agriculture, Universitas Brawijaya, Malang 65145, Indonesia
*
Author to whom correspondence should be addressed.
Nitrogen 2025, 6(3), 61; https://doi.org/10.3390/nitrogen6030061
Submission received: 16 June 2025 / Revised: 18 July 2025 / Accepted: 23 July 2025 / Published: 28 July 2025

Abstract

The low nitrogen-use efficiency (NUE) in sandy soils, due to high porosity and poor nutrient retention, necessitates proper management in fertilization. This study aims to evaluate the effect of biochar-coated urea (BCU) with different coating thicknesses and nitrogen doses on soil nitrogen content, nitrogen uptake, NUE, growth, and yield of sweet corn in sandy soil. The experiment used a factorial randomized block design with two factors, including biochar coating thicknesses (i.e., 14% and 29%) and fertilization doses (i.e., 50%, 100%, 150%, 200%, and 250%). The results showed that the 29% biochar coating thickness led to 9.9–21.3% higher plant height, N uptake, and N-use efficiency, but it led to 22.8% lower yield, as compared to the 14% biochar coating thickness. Additionally, the application of BCU doses of 100% and 150% (~161 and 241.5 kg N/ha) led to 9.2–97.3% higher maize growth, yield, N uptake, and NEU as compared to the other doses (i.e., 50%, 100%, 250%). This study confirmed that the combination of a 29% biochar coating thickness with 150% of the recommended BCU dose (~241.5 kg N/ha) was the best combination, resulting in the highest N uptake, growth, and yield of maize.

1. Introduction

Nitrogen is an essential macronutrient required by plants in large quantities, as it plays a key role in the synthesis of amino acids, proteins, enzymes, and chlorophyll—all of which support plant metabolism and both vegetative and generative growth [1,2,3]. However, nitrogen is highly mobile in the soil due to its predominant presence in the form of nitrate ions (NO3), which carry a negative charge and are weakly bound to soil particles, making them susceptible to loss [4,5,6]. Nitrogen loss occurs through various mechanisms, including volatilization as ammonia gas (NH3), leaching as nitrate, and denitrification into dinitrogen (N2) or nitrous oxide (N2O) gases [7,8,9]. As a result, nitrogen uptake by plants is reduced, leading to a decrease in plant growth, yield, and NUE from fertilization [10]. In addition, the high N losses are potentially contributed to environmental pollution (i.e., water and air pollution, climate change, eutrophication, and soil acidification) [6,10].
Sandy soils represent a soil type that is commonly associated with high nutrient losses and poor NUE following fertilization. Sandy soils are characterized by high porosity, low cation exchange capacity (CEC), and low organic matter content [11,12,13]. The high number of soil macropores and the low organic matter in sandy soils accelerate the high N leaching losses from fertilization due to the low nutrient retention and the rapid water movement into deeper layers [14,15,16]. Soil organic matter and clay have a large surface area, which is dominated by negative charges, playing an important role in binding NH4+ from N-fertilizer hydrolysis (i.e., urea), thus slowing down the process of nitration and N leaching [17]. In addition, application of N fertilizer on the soil surface potentially increases N losses through volatilization, especially under warm, dry, and windy conditions. As a result, nitrogen from applied fertilizers cannot be optimally utilized by plants. Jalpa et al. [5] reported that NUE in sandy soils ranges only from 20.68% to 48.93%. Therefore, innovative nitrogen management strategies, especially developing advanced fertilizer and proper fertilization in sandy soils, are needed to minimize N loss and to optimize crop productivity.
Various technologies have been developed to improve NUE, such as the coating of fertilizer with synthetic materials and the addition of inhibitors. Hussain et al. [18] reported that a combination of ammonium thiosulfate (ATS) and nitrapyrin reduced ammonia volatilization from 40.5% to 11.5%. Suwardi et al. [19] reported that polyethylene glycol (PEG) coating effectively delayed nitrogen release for up to 18 weeks. Incrocci et al. [20] showed that urea coated with polyurethane (E-MAX) reduced nitrogen leaching by up to 25% without compromising tomato yield. Although effective, these coating materials are synthetic, are non-biodegradable, and do not improve soil physical properties. This presents an opportunity for the development of fertilizer coatings based on organic materials such as biochar, which is considered more environmentally friendly and capable of supporting nutrient retention and improving soil quality in the long term.
Biochar is a porous carbon-rich material produced through the pyrolysis of biomass at high temperatures [21,22,23]. It is known for its high CEC, large porosity, and ability to retain water and nutrients [24,25,26,27]. These characteristics make biochar a promising coating material for urea fertilizer to slow nitrogen release while simultaneously improving the physico-chemical properties of soil [24,28,29]. Several studies have evaluated the benefits of biochar in improving soil quality and enhancing NUE. In sugarcane, biochar application increased nitrogen uptake by 23.91–45.42% and NUE by up to 30% depending on the variety and stage of growth [30]. In addition, many researchers reported that application of biochar in sandy soils resulted in an increase in soil chemical properties (i.e., pH, electrical conductivity, CEC, soil organic matter) [31,32,33,34]. However, studies about the direct use of biochar as a coating material for urea fertilizer (biochar-coated urea, or BCU) and its effect on soil nutrient content and plant uptake in sandy soils remain limited. Therefore, this study aims to evaluate the effects of different biochar coating concentrations and BCU application rates on nutrient uptake, NUE, growth, and yield of sweet corn (Zea mays saccharata), as well as soil fertility in sandy soil.

2. Materials and Methods
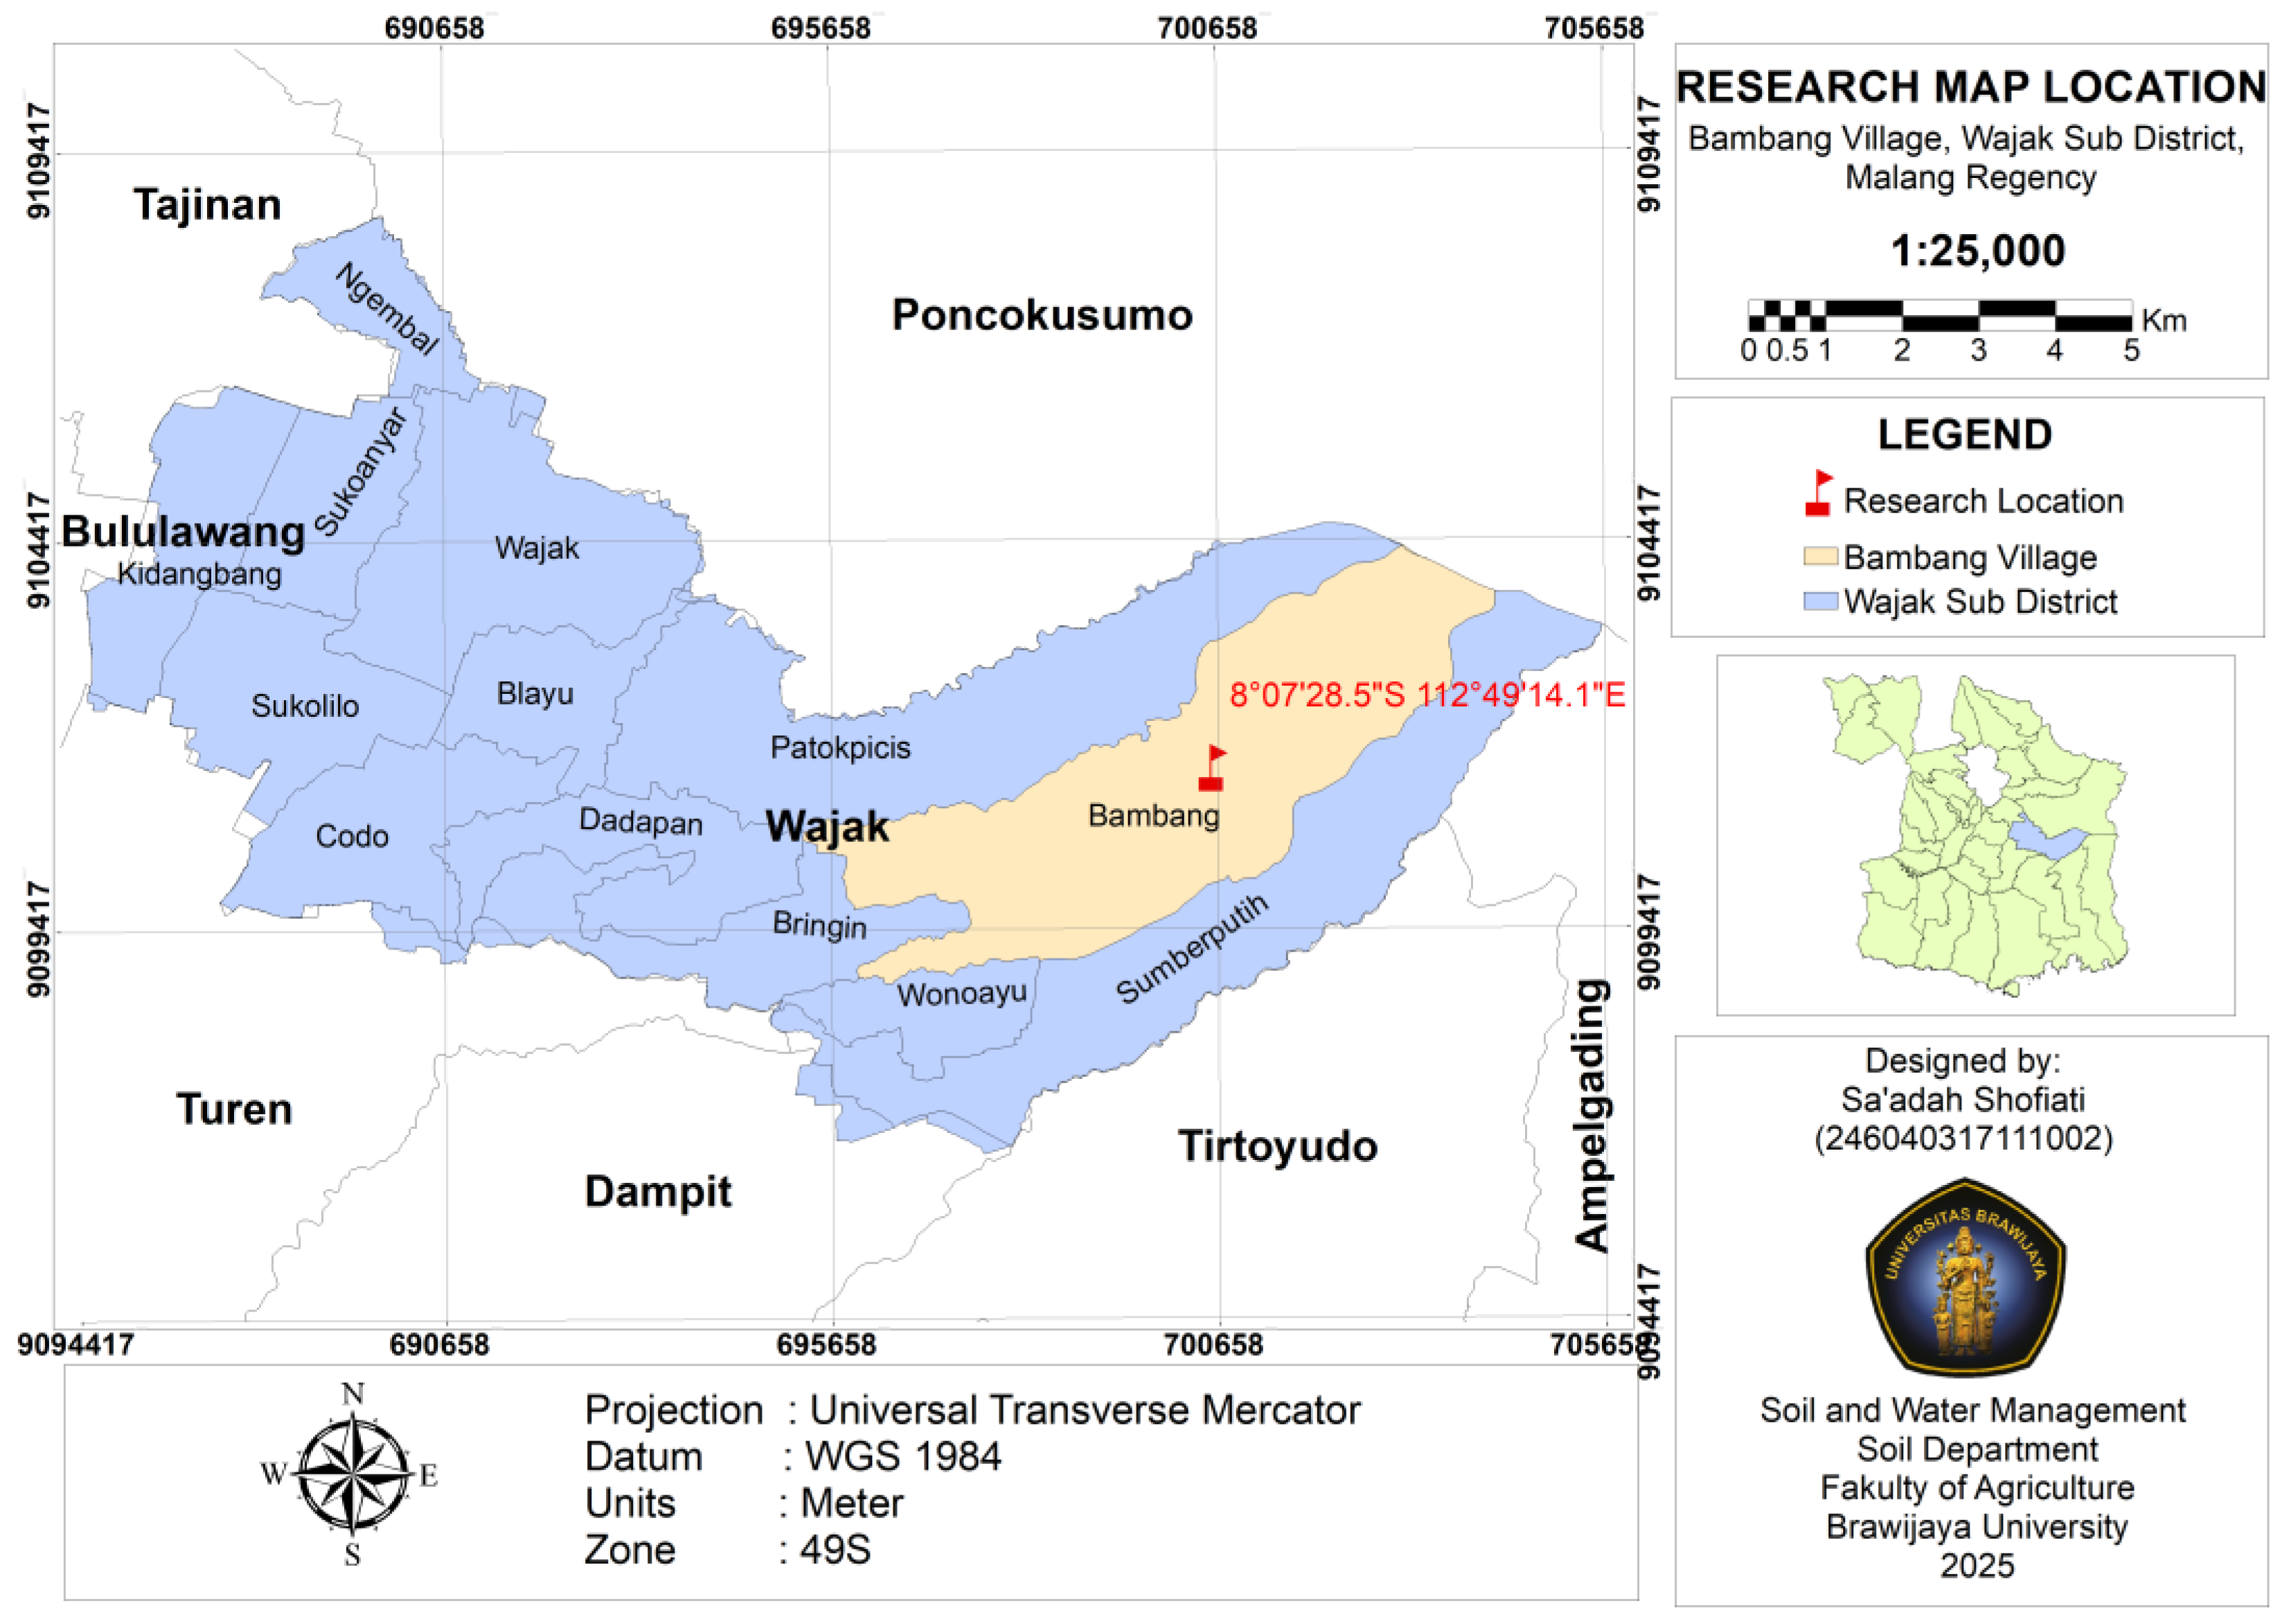
2.1. Study Site

The field experiment was conducted in Bambang Village, Wajak district, Malang Regency, East Java, Indonesia, located at the coordinates 8°07′28.5″ S 112°49′14.1″ E (Figure 1). Meanwhile, laboratory analyses were conducted at the Soil Chemistry and Biology Laboratory, Faculty of Agriculture, Universitas Brawijaya, Malang. The research was conducted from July 2024 to March 2025. The activities of this study consisted of creation of biochar, development of BCU, laboratory analysis of BCU quality, a field experiment, and laboratory analysis for measuring soil N and N uptake.
Wajak Subdistrict is located at an elevation of 400–700 m above sea level, with an average temperature ranging from 22 °C to 32 °C, and average annual rainfall of 2340 mm [35]. The soil was classified as Entisol with a parent material derived from the deposit of Mount Semeru and soil particles dominated by a sand fraction, which is representative of sandy soil [36,37]. Based on a preliminary soil analysis prior to the field experiment, the soil texture at the study site was classified as loamy sand, with 82.6% of the soil fraction composed of sand. The bulk density was 1.37 g cm−3, particle density was 2.24 g cm−3, porosity was 34%, and available water content was 14%. The soil contained very low levels of total nitrogen (0.047%) and organic carbon (0.54%), had a slightly acidic pH (6.2), C/N ratio of 10, available phosphorus (P) of 40.38 mg/kg, potassium (K) of 0.32 me/100 g, sodium (Na) of 0.24 me/100 g, calcium (Ca) of 8.54 me/100 g, magnesium (Mg) of 0.49 me/100 g, and cation exchange capacity (CEC) of 13.10 me/100 g.

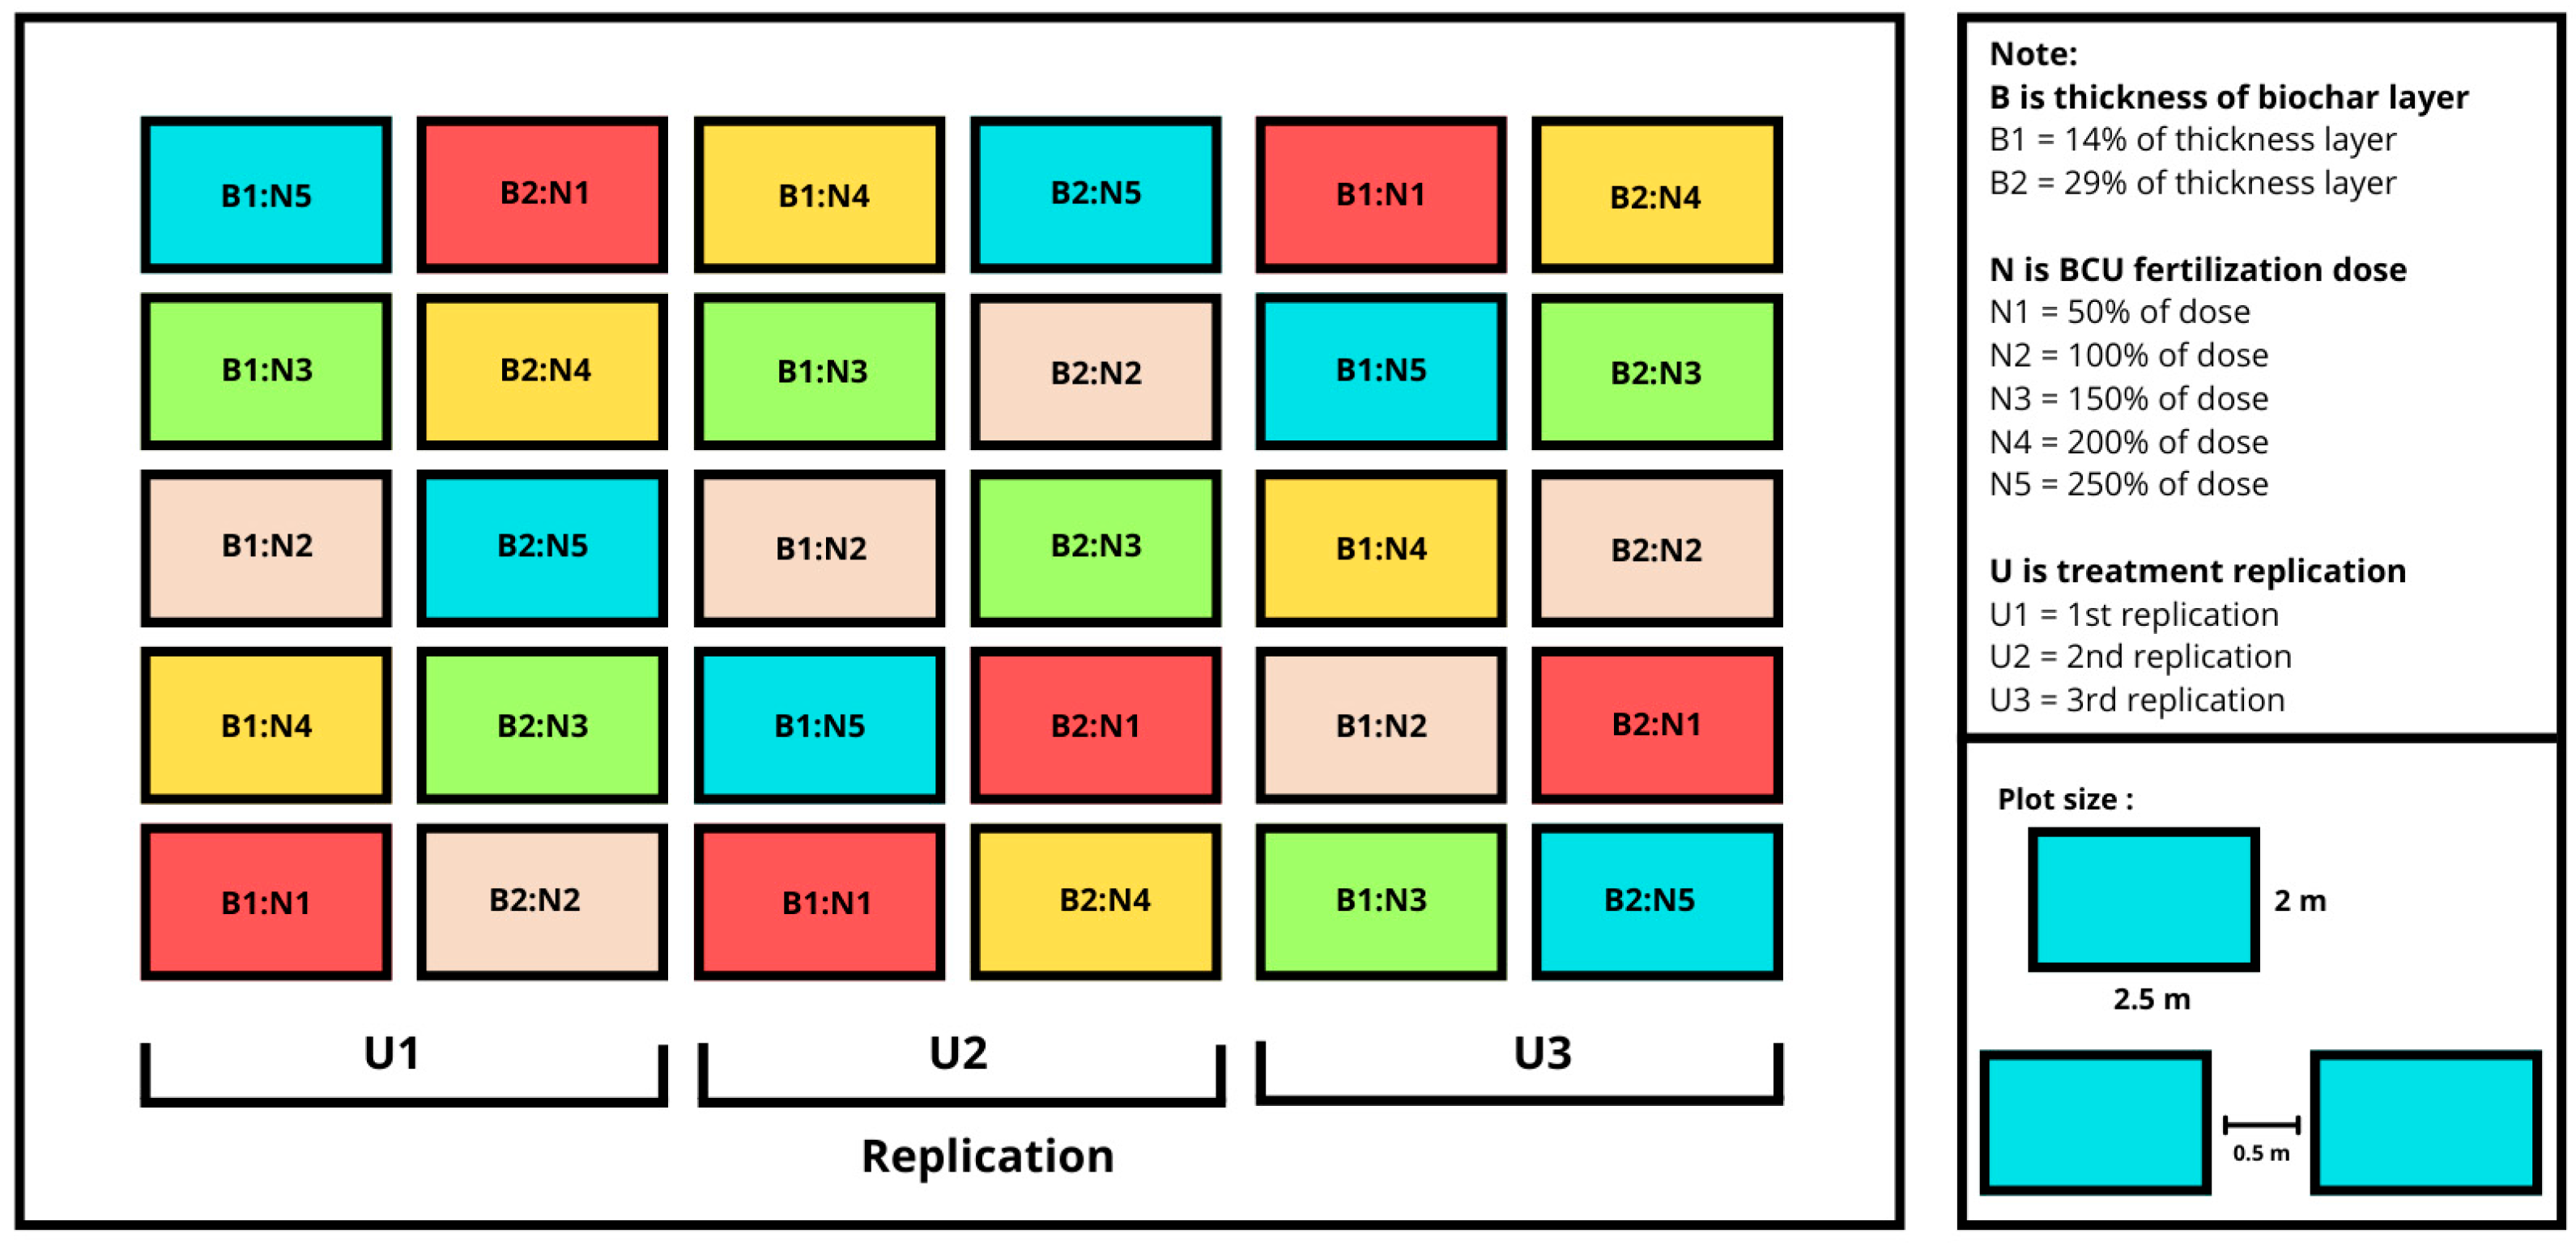
2.2. Experimental Design

This study employed an experimental approach using a factorial randomized block design. The first factor was biochar coating thickness, consisting of two levels—14% (B1) and 29% (B2)—named thin- and thick-layer coating. The second factor was the BCU fertilization dose, comprising five levels: 50% (N1), 100% (N2), 150% (N3), 200% (N4), and 250% (N5). The fertilization rates for the 100% dose were based on the recommendation stated in Minister of Agriculture Regulation No. 13 of 2022, which prescribes 350 kg of urea per ha, equivalent to 161 kg N/ha. These two factors resulted in 10 treatment combinations, each replicated three times. The field layout is presented in Figure 2.

2.3. Biochar Preparation

Biochar was produced in a pyrolizer using the fast pyrolysis method at Science and Technology Park of UNITRI. Fast pyrolysis is a thermochemical process characterized by a high heating rate (>2 °C/s) and operating temperatures ranging from 500 to 1000 °C [38]. The feedstock used for biochar production was coconut shells, which are rich in lignin and therefore ideal for producing high-carbon-content biochar [39]. The pyrolysis process began with drying the material at 155 °C for 4 h, followed by pyrolysis at 500 °C for an hour. The laboratory measurement showed that the biochar in this study had an organic carbon (C-org) content of 2.51%, total nitrogen (N-total) of 0.62%, and moisture content of 4.71%, which contribute to its ability to enhance nutrient retention and improve soil quality.

2.4. BCU Preparation

Biochar-coated urea (BCU) was produced using urea as the core fertilizer material, coconut shell biochar as the coating material, and bentonite and molasses as binders, with molasses diluted in water at a 1:2 ratio (molasses/water). The urea used in this study is standard agricultural-grade urea based on Indonesian National Standard (SNI) 2801:2010. Two different BCU formulations were prepared, BCU 1 (biochar/urea/bentonite = 1:5:1) and BCU 2 (2:5:1). The coating process was carried out using a granulator at Soil Drying Laboratory, Faculty of Agriculture, Universitas Brawijaya. Prior to coating, urea granules were sieved to obtain a uniform particle size of less than 2 mm. The sieved urea was first mixed with bentonite for 3 min. Biochar and molasses solution were then gradually added until the mixture became moist enough to allow the biochar to adhere properly, while the granulator was rotated for 10 min. The coated BCU granules were subsequently dried in an oven at 30 °C for 4 h. Laboratory analysis showed that the resulting BCU had a total nitrogen (N-total) content of 48.9% for BCU with a 14% biochar coating thickness (BCU 1) and 31.6% for BCU with a 29% biochar coating thickness (BCU 2).

2.5. Field Experiment

The field experiment was carried out through manual tillage and application of manure as soil conditioner to maintain soil physical properties (i.e., soil structure, soil water-holding capacity), followed by construction of planting beds measuring 2 m × 2.75 m. Sweet corn seeds were planted on November 2024 (in the beginning of rainy season) using the dibble method with a spacing of 60 cm × 25 cm. Annually, sweet corn is planted one to two times a year, then replaced with chili, cabbage, or eggplant in crop rotation. Fertilization was conducted based on the recommended rates in Minister of Agriculture Regulation No. 13 of 2022. SP-36 (36% P2O5) was applied at planting with a dose 50 kg/ha, whereas KCl (60% K2O) fertilizers were applied at 10 and 30 days after planting (DAP) with a dose of 50 kg/ha for each application. Both SP-36 and KCl were applied for all treatments as a basic fertilizer. Furthermore, the BCU of each treatment was applied one time at 7 DAP. Plant maintenance included irrigation (using rainfall), weeding (conducted manually by removing the weed using a sickle), and pest control (occasionally using insecticide to prevent insect attack). The observed variables included plant growth parameters (i.e., plant height, number of leaves, and stem diameter) measured at 8 weeks after planting (WAP); yield components (i.e., cob weight, cob length, and cob diameter); and total nitrogen content in the plant and soil nitrogen content (total N, ammonium, and nitrate), measured at 8 and 12 WAP.

2.6. Soil Sampling

Soil sampling was conducted prior to BCU application, as well as at 8 and 12 WAP of sweet corn. Samples were collected from a depth of 0–20 cm using a soil auger at five diagonal points within each experimental plot, and then composited. We separated the soil sample that was used to measure soil total N and available N (ammonium and nitrate). The soil sample that was used to measure soil total N was air-dried for a week, and then grounded and sieved at a 2 mm size. For ammonium and nitrate analysis, soil samples were collected before sunrise and immediately stored in a cool box at 4 °C, and then placed in cool storage in the Soil Biology laboratory, Faculty of Agriculture Universitas Brawijaya, to inhibit soil microorganism activity, and preserve the stability and accuracy of the analytical results.

2.7. Soil N Measurement

Soil nitrogen analysis was conducted to evaluate the effect of BCU application on nitrogen dynamics in the soil. The analysis included soil total nitrogen (N-total) and available nitrogen (ammonium and nitrate), based on soil samples collected at 8 and 12 WAP. Specifically, soil available nitrogen was analyzed at 8 WAP, corresponding to the highest peak of nitrogen uptake by sweet corn. Total nitrogen was determined using the Kjeldahl method. Ammonium and nitrate were analyzed by extracting fresh soil using 1 M KCl with a 1:1 ratio of soil to extractant [40]. Then, 2 mL of extract was taken to measure ammonium using the phenate method, while 5 mL of extract was collected to analyze nitrate using the brucine method [41]. To determine ammonium and nitrate concentrations, we used a Shimadzu UV-VIS spectrophotometer (Kyoto, Japan) at wavelengths of 636 and 432 nm, respectively.

2.8. Plant N and N-Use Efficiency Measurement

The analysis of plant nitrogen (N) included plant nitrogen content, plant nitrogen uptake, and NUE. Plant nitrogen content was analyzed using the Kjeldahl method. Plant nitrogen uptake was calculated by multiplying the plant nitrogen content with the plant biomass, as expressed in the following equation:
N   U p t a k e   g / p l a n t = p l a n t   b i o m a s s   g × N   c o n t e n t   ( g 100   g )
NUE refers to the efficiency of nitrogen utilization, which is calculated as the product of nitrogen uptake efficiency (NupE) and nitrogen utilization efficiency (NutE). NupE represents the soil’s ability to absorb nitrogen from fertilizers, whereas NutE refers to the plant’s ability to convert the absorbed nitrogen into yield. The calculation of NUE is expressed in the following equation [42]:
N u p E = N   c o n t e n t   i n   p l a n t N   s u p p l i e d
N u t E = Y i e l d N   c o n t e n t   i n   p l a n t
N U E = N u p E × N u t E

2.9. Growth and Yield Measurement

The analysis of plant growth included measurements of plant height (cm), leaf number, and stem diameter (mm), which were recorded at 8 WAP. The growth analysis was conducted to determine the effect of BCU application on plant growth parameters. In addition to growth analysis, yield analysis was also conducted, which included measurements of corn cob weight (g), corn cob length (cm), corn cob diameter (mm), and yield (t/ha), recorded at 12 WAP or at harvest time. The yield analysis was carried out to assess the effect of BCU application on yield parameters.

2.10. Statistical Analysis

The normality of the obtained data was tested using Shapiro–Wilk’s test. Data that were normally distributed were subsequently analyzed using Analysis of Variance (ANOVA) at a 5% significance level to examine the effect of the treatments. When significant differences were found, the analysis was followed by the Honestly Significant Difference (HSD) test. All analyses were conducted using Rstudio 2024.21.1+563 software. The relationships among parameters were analyzed using the Pearson correlation test, followed by a simple linear regression model if the correlation test showed significant correlation (p ≤ 0.05).

3. Results

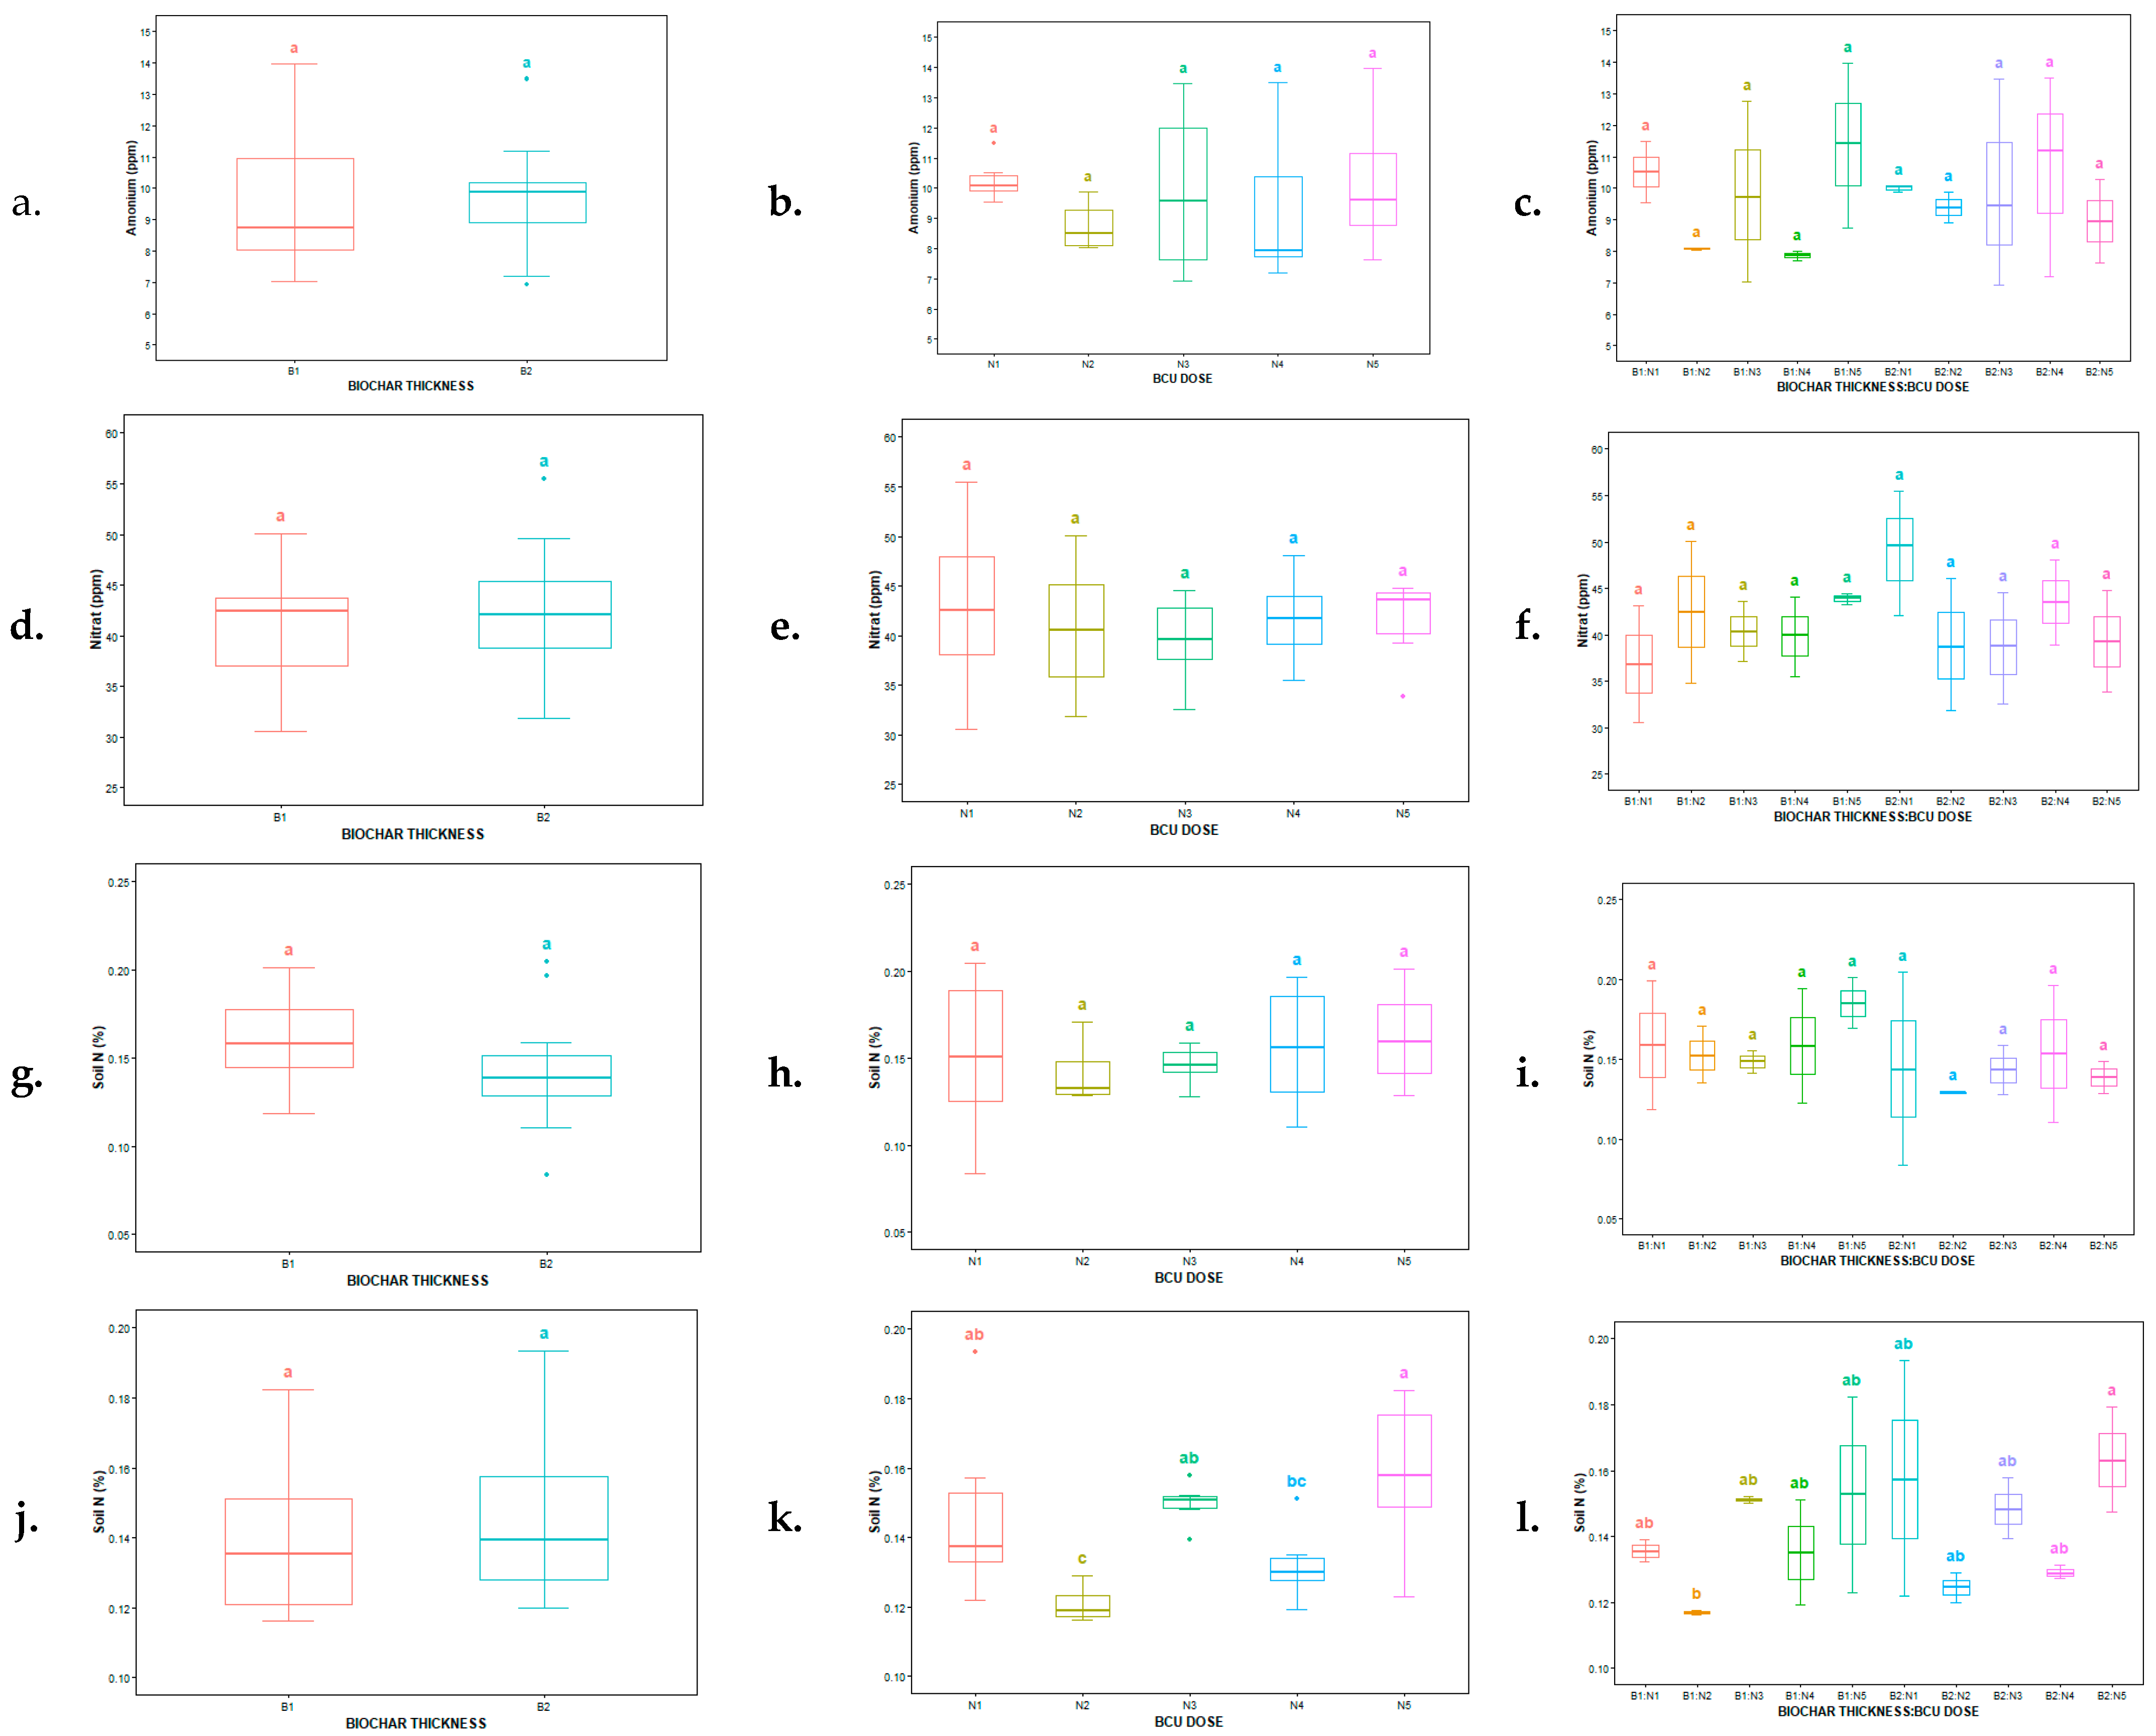
3.1. Effect of Biochar-Coated Urea on Total and Available Soil N

Biochar layer thickness, BCU doses, and interaction between the biochar layer thickness and dose of BCU did not significantly affect ammonium (NH4+) and nitrate (NO3) concentrations at 8 WAP (p ≥ 0.05; Figure 3a–f). The ammonium concentration ranged from 7.86 to 11.38 ppm, while the nitrate concentration ranged from 36.85 to 49.02 ppm. However, the combination of a 29% biochar layer thickness and 200% BCU dose (B2N4) tended to increase the ammonium concentration by 35.3% compared to the combination of a 14% biochar layer thickness and 200% BCU dose (B1N4). This result indicated that the increased biochar layer thickness probably slows down the release of nitrogen, leading to a higher NH4+ concentration in the soil (Figure 3c).
The thickness of biochar coating did not significantly affect total nitrogen (N) content in the soil at 8 and 12 WAP (p ≥ 0.05), with average values relatively stable between B1 and B2 (0.14–0.16%), as shown in Figure 3g,j. In addition, neither the BCU dose nor the interaction with coating thickness had a significant effect (p ≥ 0.05) on soil total N at 8 WAP, with the total nitrogen ranging from 0.13% to 0.19% (Figure 3h,i). However, differences in BCU dose application had a significant effect (p ≤ 0.05) on soil total N at 12 WAP, with the highest value observed at the 250% BCU dose (N5). This treatment increased total nitrogen by 30.6% compared to other treatments (Figure 3k). In addition, the interaction between biochar thickness and BCU doses also had a significant effect on soil total nitrogen at 12 WAP (p ≤ 0.05). The combination of a 29% biochar layer thickness and 250% BCU dose (B2N5) resulted in a 33.3% higher soil total N at 12 WAP compared to the combination of a 14% biochar layer thickness and 100% BCU dose (B1N2).

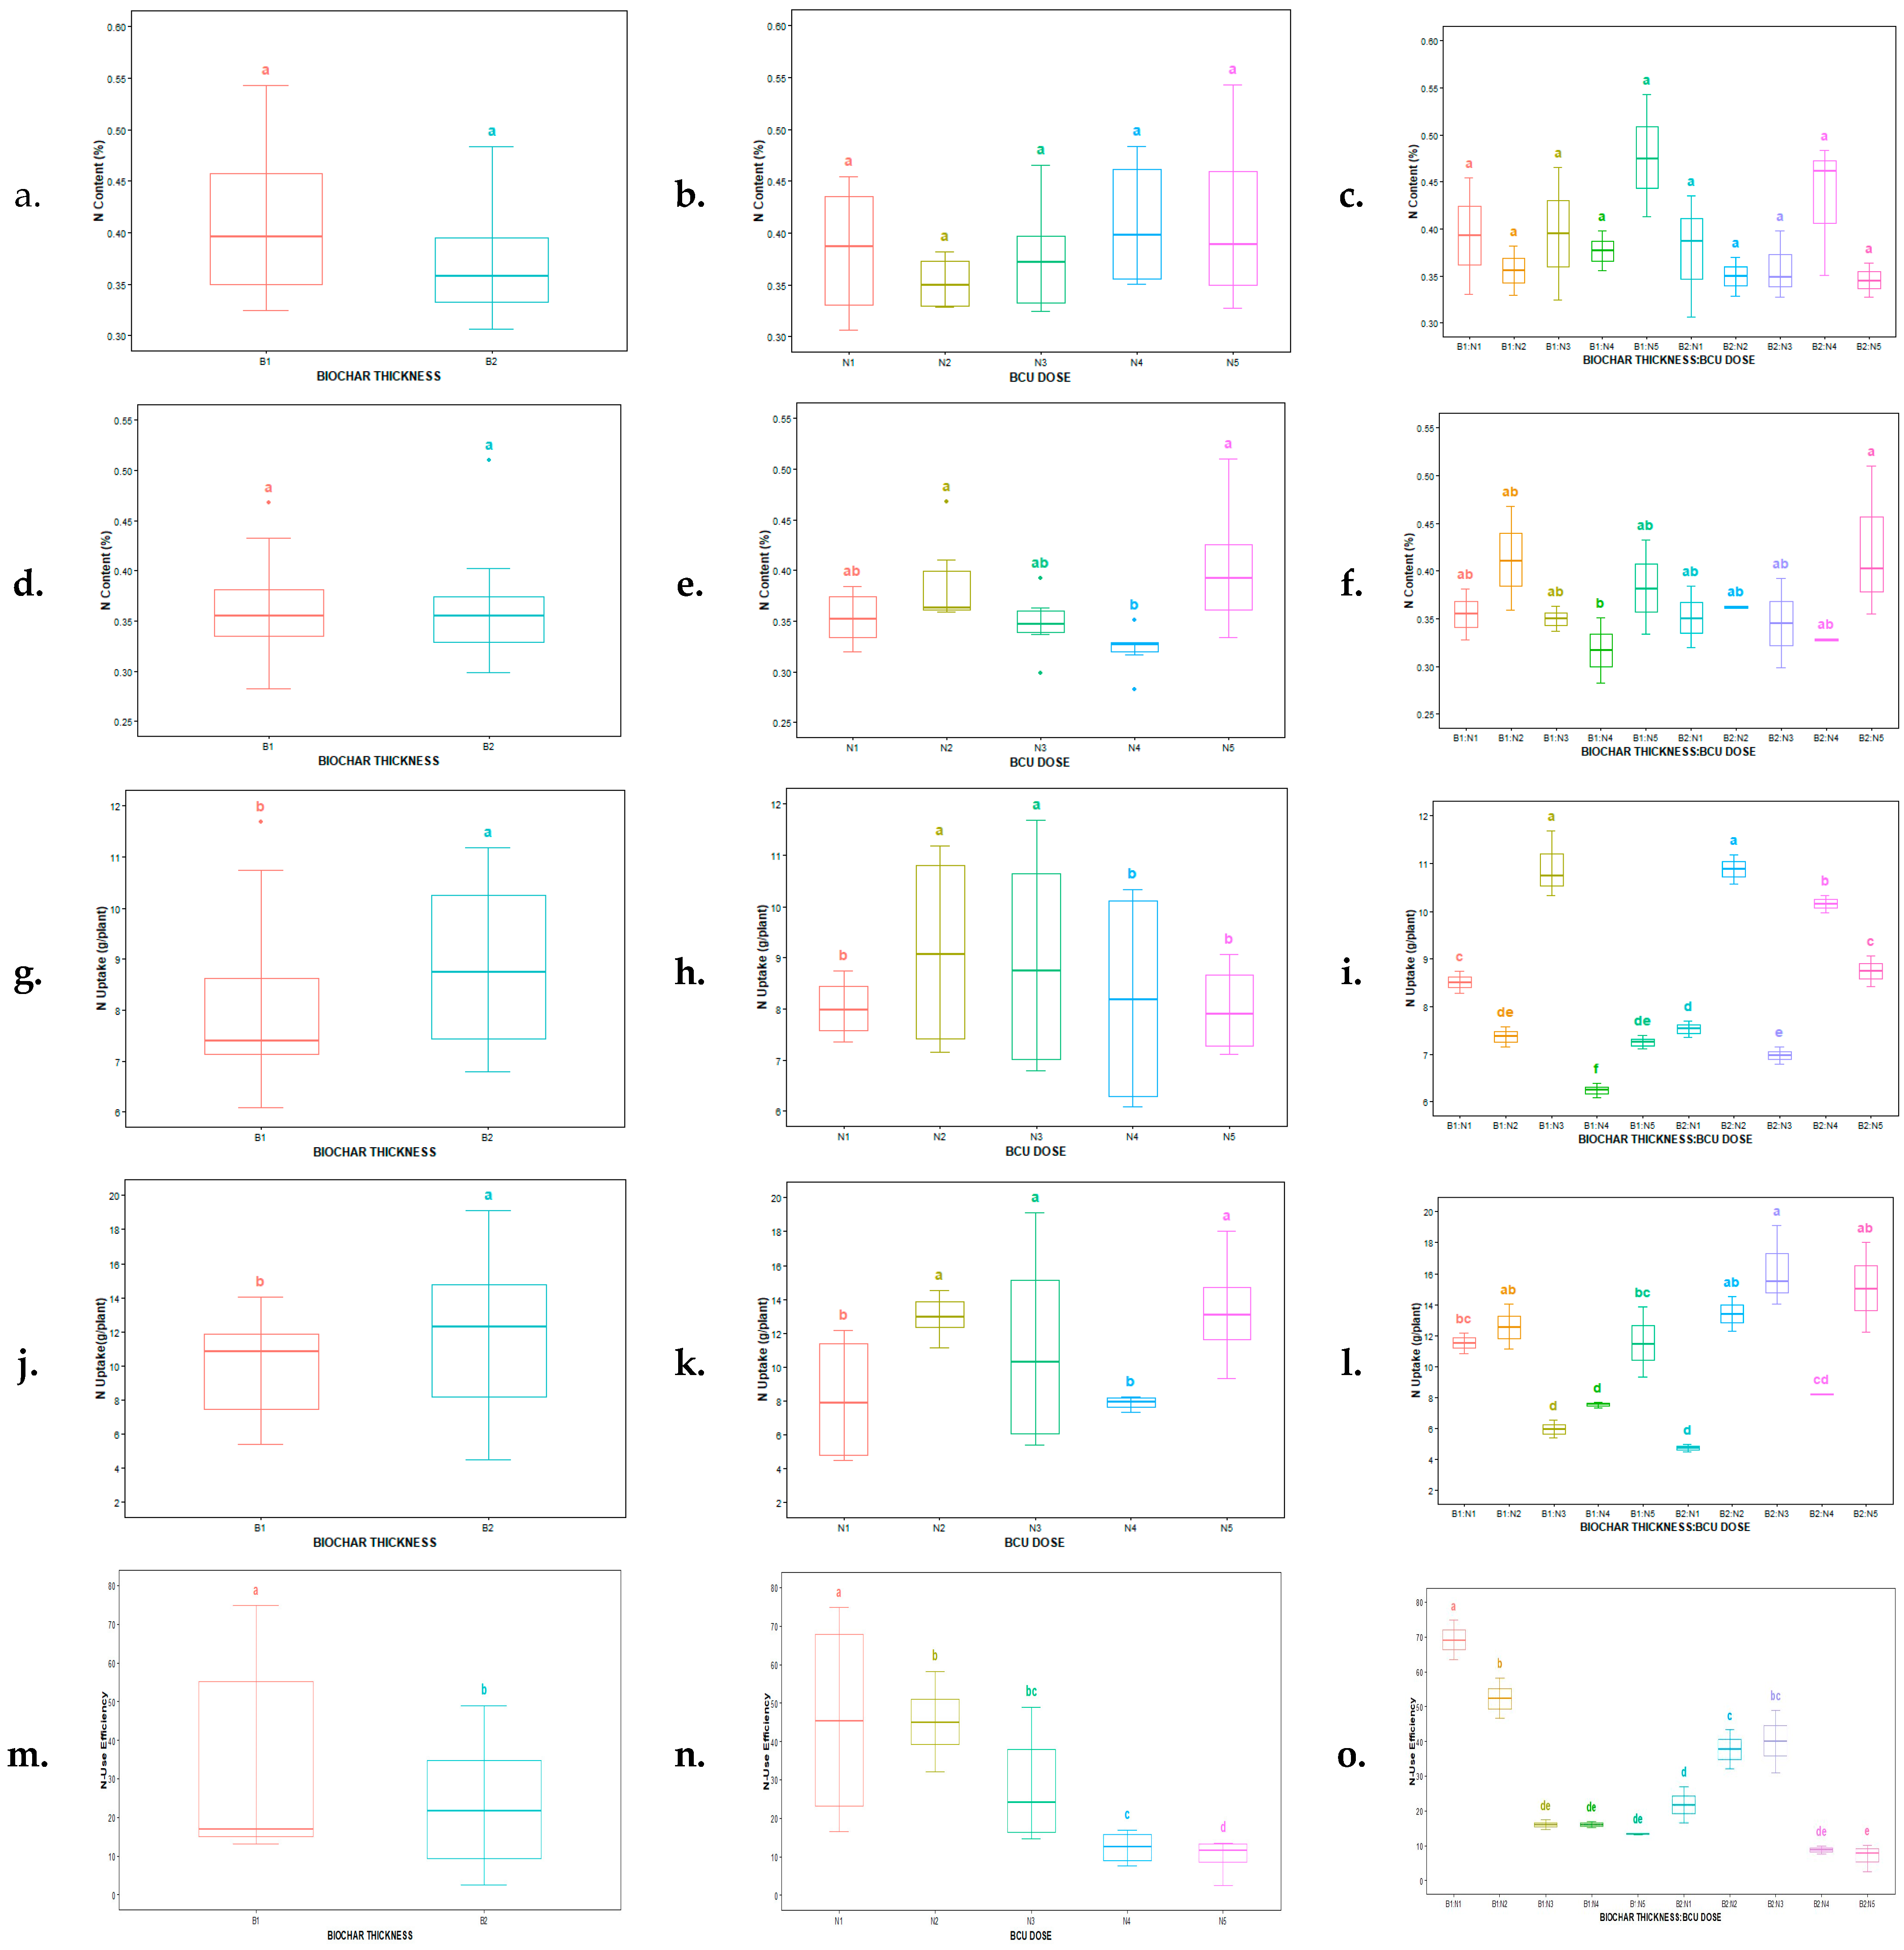
3.2. Effect of Biochar-Coated Urea on N Content, N Uptake, and N-Use Efficiency

The nitrogen content in plants at 8 WAP was not significantly affected by the biochar layer thickness, the BCU dose, and their interaction (p ≥ 0.05). The average N content across treatments was relatively stable—ranging from 0.32% to 0.48%—indicating that the nitrogen supplied, regardless of the dose or release rate, was assimilated similarly into plant tissue (Figure 4a–c). Similarly, there were no significant effects of biochar layer thickness and interaction between the biochar layer thickness and BCU dose on nitrogen content in plants at 12 WAP (p > 0.05). Nevertheless, differences in BCU dose application had a significant effect on total nitrogen in plants (p ≤ 0.05). BCU application at 100% and 250% of the recommended dose resulted in a 20–25% higher N content in plants compared to 200% of the recommended dose (Figure 4e).
Unlike nitrogen content, nitrogen uptake was significantly influenced by biochar thickness and BCU dose at both 8 and 12 WAP (p ≤ 0.05). The thick layer of biochar (29% biochar concentration; B2) resulted in higher nitrogen uptake than the thin layer of biochar (14% biochar concentration) at both 8 and 12 WAP (Figure 4g,j). Moreover, application of the 100% and 150% BCU doses (N2 and N3) resulted in higher N uptake compared to the other treatments (N1, N4, N5) at 8 WAP (Figure 4h). Meanwhile, higher N uptake at 12 WAP was observed with BCU application at 100%, 150%, and 250% doses (N2, N3, N5) compared to the 50% and 200% BCU doses (N1 and N4; Figure 4k). In addition, the interaction between biochar thickness and BCU dose also significantly affected nitrogen uptake at both 8 and 12 WAP (p ≤ 0.05). At 8 WAP, the highest uptake occurred in the combination of a 14% biochar thickness and 150% BCU dose (B1N3), representing a 75% increase, as compared to other treatments (Figure 4i). At 12 WAP, the combination of a 29% biochar thickness and 150% BCU dose (B2N3) exhibited the highest uptake, which was 243% higher than the lowest value (B2N1), as shown in Figure 4l. These results confirm that the combination of an optimal BCU dose and thicker biochar coating prolongs nitrogen availability, synchronizing supply with plant demand, especially during critical growth stages.
NUE was also significantly affected by all factors (p ≤ 0.05) (i.e., biochar thickness, dose, and their interaction) (Figure 4m–o). The significant effect of BCU dose showed that the 100% BCU dose (N2) had the highest NUE (25.86) compared to other BCU dose treatments (Figure 4n). Interestingly, the thinner coating (B1) gave a slightly higher average NUE (15.47) than B2 (13.04), suggesting that a faster release rate may benefit early nutrient uptake when applied in low-to-moderate doses (Figure 4m). Furthermore, the highest NUE was observed in the combination of a 14% biochar thickness and 50% BCU dose (B1N1: 31.03). In contrast, NUE dropped sharply in treatments with excessive nitrogen application (e.g., B2N5: 3.25), showing a decline of nearly 90% compared to the best treatment. This decline likely reflects nitrogen losses through leaching or volatilization due to excess supply.

3.3. Effect of Biochar-Coated Urea on Plant Growth

The thickness of biochar coating significantly affected plant height (p ≤ 0.05). The treatment with a thicker layer of biochar (29% biochar concentration, B2) resulted in a 17.0% higher plant height than those with a thinner layer of biochar (14% biochar concentration, B1). In addition, differences in BCU dose application also showed a significant effect on plant height (p ≤ 0.05). The highest plant height was observed in N2 and N3 (100% and 150% BCU doses) (Table 1). Furthermore, biochar thicknesses and BCU doses showed a significant interaction in increasing plant height (p ≤ 0.05). Application of BCU with a thicker coating of biochar at a dose of 150% (B2N3) had the greatest effect on plant height, which was 86.3% greater than the lowest value, observed in the B1N5 treatment (application of BCU with a thinner coating of biochar at a dose of 250%) (Table 1).
There was no significant difference in the number of leaves and stem diameter between thick and thin coatings of biochar in BCU (B1 and B2) (p ≥ 0.05). However, the application of different BCU doses significantly affected the number of leaves and stem diameter (p ≤ 0.05). The highest number of leaves and stem diameter were recorded in the treatment of applying a 150% BCU dose (N3), which resulted in a 40% higher value than the other BCU dose treatments. However, the stem diameter parameter in the 150% BCU dose (N3) was comparable to the 100% BCU dose (Table 1). Furthermore, the interaction between biochar thickness and BCU dose significantly affected the number of leaves and stem diameter (p ≤ 0.05). Application of BCU with a thicker coating of biochar at a dose of 150% (B2N3) had a 40–80% greater effect on the number of leaves and stem diameter than the other treatments (Table 1).

3.4. Effect of Biochar-Coated Urea on Yield

Differences in biochar coating thickness of BCU did not have a significant effect (p ≥ 0.05) on the performance of corn cobs, including length and diameter of the cob, and weight of the corn cob per plant (Table 2). However, differences in BCU application dose had a significant effect (p ≤ 0.05) on diameter of corn cobs and cob weight per plant. Application of BCU at a 150% dose (~525 kg/ha) resulted in a 9–16% increase in cob diameter and a 56–91% increase in weight per plant compared to BCU application at 50% and 200% doses (~175 kg/ha and 700 kg/ha). Furthermore, biochar thicknesses and BCU doses significantly interacted in increasing corn cob characteristics (i.e., diameter and weight; p ≤ 0.05). The highest cob diameter and weight per plant were found in the application of BCU with a thicker coating of biochar at a dose of 150% (B2N3).
Differences in biochar layer thickness and application doses significantly affected sweet corn yield (p ≤ 0.05; Table 1). A thinner biochar layer (B1) in BCU resulted in a 23% higher yield compared to a thicker biochar layer (B2) in BCU. Additionally, the application of biochar at 100% and 150% doses (N2 and N3) produced 64–97% higher yield compared to other dose applications (Table 2). Furthermore, the biochar thicknesses and BCU doses significantly interacted in increasing sweet corn yield (p ≤ 0.05). Application of BCU with a thicker biochar coating at a 150% dose (B2N3) increased maize yield 60% to 4.5 times more compared to the other treatments (Table 2).

4. Discussion

The biochar coating thickness and application dose of BCU significantly affected nitrogen (N) in the soil, especially total nitrogen at 12 weeks after planting. The highest total N that was found in the treatment of B2N5 (application of BCU with a thicker coating of biochar at a dose of 250%) indicated that the layer thickness of biochar helped in maintaining nitrogen availability over time through its controlled-release mechanism [43]. In addition, the high soil total N at the highest dose of BCU also reflected that an increased BCU dose can provide and store nitrogen in the soil for an extended period. This is probably due to BCU application increasing soil organic matter and decreasing nitrogen loss through leaching [44,45]. However, this study was unable to detect a significant effect of biochar thickness layer and application dose of BCU on ammonium (NH4+) and nitrate (NO3) concentrations at 8 WAP. This was probably due to the thicker layer functioning as a barrier, slowing the hydrolysis of urea and its subsequent conversion to ammonium [46]. The low ammonium concentration probably inhibited nitrification, resulting in a comparable nitrate concentration. This gradual nutrient release likely reduced nitrogen losses while ensuring consistent uptake throughout the plant’s growth stages [47]. This was supported by the Pearson correlation analysis showing a strong positive relationship (r = 0.53, p ≤ 0.01) between ammonium concentration and nitrogen content in the plant (Figure 5a).
The application of BCU doses of 100% and 150% (~161 and 241.5 kg N/ha) was suitable for sweet corn. This was shown by the greater plant growth (i.e., plant height, leaf number, and stem diameter) and yield in the application of BCU doses of 100% and 150% compared to the other BCU dose. The positive correlation between plant height and N uptake at 8 WAP (r = 0.38, p ≤ 0.05) reflected that nitrogen plays an important role in plant growth. Wang et al. [2] reported that nitrogen plays a crucial role in the synthesis of amino acids, proteins, enzymes, and chlorophyll, which may determine plant growth and production. Furthermore, our findings showed that the increases in BCU dose application up to 250% (~402.5 kg N/ha) did not result in high plant growth and yield. This result aligned with Singh and Craswell [48], who stated that the yield of maize did not significantly increase or even decline by application of excessive N fertilizer.
The combination of biochar layer thickness and application dose of BCU also significantly affected nitrogen uptake, NUE, plant growth (i.e., plant height, leaf number, and stem diameter), and yield (i.e., cob diameter, cob weight per plant, and total yield). Overall, the treatment B2N3 (application of BCU with a thicker coating of biochar at a dose of 150%) consistently had the greatest effect on N uptake, plant growth (plant height, number of leaves, and stem diameter), and yield (cob diameter, cob weight, and total yield of sweet corn). This result suggests that the gradual and sustained nitrogen release from BCU with a thicker biochar layer enables plants to access nitrogen throughout the growing season [44]. In addition, with a proper application dose, BCU increased the availability of nitrogen, enhanced nitrogen uptake, and facilitated better photosynthetic capacity and vegetative growth [49,50], resulting in a high yield. These findings align with those of Zhang et al. [51], who reported that BCU treatments led to increased nitrogen absorption by plants, improving growth and yield. Another previous study reported that improved nitrogen uptake supported better nutrient assimilation, contributing to stronger and more vigorous plants [52]. Furthermore, the regression analysis showed that the increased N uptake significantly affected plant height (R2 = 0.142, p ≤ 0.01; Figure 5b), as well as that the high ammonium concentration in the soil increased total N content in the plant (R2 = 0.277, p ≤ 0,01; Figure 5c). These findings confirmed that the sufficient N availability in the soil increased N uptake, resulting in better plant growth. Nevertheless, the higher nitrogen doses beyond 150% tended to reduce N uptake, NUE, and plant growth and yield. This is expected due to nitrogen loss through leaching or volatilization, binding by organic colloids (particularly for NH4+), or nitrogen immobilization.
The highest total yield was recorded with the B2N3 treatment, showing a remarkable 450.6% increase compared to other treatments (Table 2). This yield improvement can be attributed to the enhanced nitrogen availability in the soil and the efficient nitrogen uptake by the plants, which is essential for flowering, fruit set, and grain filling [53]. Although the NUE in B2N3 was lower than in B1N1, we assumed that the increase in NUE by 40% in the treatment B2N3 corroborates the role of BCU in promoting both efficient nitrogen utilization and high yields. In contrast, higher BCU doses (200% and 250%) led to a reduction in both NUE and yield, probably due to excessive N supply from fertilizer increasing nitrogen loss through leaching or volatilization, as observed in sandy soils. This finding is consistent with Zhang et al. [53], who reported that higher doses of nitrogen fertilizer can increase yield but at the expense of nitrogen inefficiency and environmental losses. The regression analysis showed that the high N uptake influenced the increases in maize yield (R2 = 0.375, p ≤ 0.05, Figure 5d). This finding highlights the need for further optimization of NUE to achieve greater improvements in crop productivity.
NUE is an important indicator to evaluate treatment effectiveness in this study. The application of BCU significantly improved NUE by synchronizing nitrogen release with plant uptake dynamics. Furthermore, the high N uptake improved the quality and quantity of corn cobs, shown by the positive significant correlation between NUE and the size of sweet corn cobs (i.e., length of cob, diameter of cob, weight per corn cob) (Figure 5a). The improvement in NUE is not an isolated phenomenon but a direct result of enhanced nitrogen availability in soil, efficient uptake by plants, and better allocation of nitrogen into biomass and reproductive structures [42]. Importantly, NUE also declined when nitrogen supply exceeded plant demand, indicating that beyond a certain threshold, additional nitrogen becomes a liability rather than a benefit [54]. These findings affirm that optimizing both the dose and release profile of nitrogen fertilizers is crucial for maximizing NUE, yield, and nitrogen sustainability in agricultural systems.
In summary, the findings demonstrate that BCU significantly enhances N uptake, NUE, plant growth, and crop yield, particularly in sandy soils. These findings suggest that BCU is a promising solution for enhancing agricultural productivity while minimizing environmental nitrogen loss, crucial for sustainable farming practices. Future research should focus on the long-term effects of BCU on soil health, nitrogen cycling, and crop yield stability under various environmental conditions. Additionally, field trials with different crops and soil types will provide valuable insights into the scalability and versatility of BCU for sustainable agriculture.

5. Conclusions

Biochar layer thickness, the dose of BCU, and their interaction strongly improved nitrogen uptake, nitrogen-use efficiency (NUE), and growth and yield of sweet corn up to 450% in sandy soil. However, the soil total N at the end of this study was not significantly different among treatments. The treatment with 29% biochar layer thickness at 100% and 150% fertilization doses (B2N2 and B2N3) was shown to be the optimum combination to increase N uptake, growth, and yield in sweet corn in sandy soil. These findings underscore the potential of BCU as a sustainable nitrogen management solution, effectively improving nitrogen-use efficiency, reducing nitrogen losses through leaching and volatilization, and significantly boosting crop production in sandy soils.

Author Contributions

Conceptualization, research design, data analysis, writing, review, and finalization of manuscript, S.K.; BCU preparation, field experiment, data collection, data analysis, writing of manuscript, S.S.; BCU preparation, data analysis, G.A.N.; visualization, writing of manuscript, Z.K. All authors have read and agreed to the published version of the manuscript.

Funding

This research received no external funding.

Data Availability Statement

The data is presented in the manuscript.

Acknowledgments

The authors gratefully acknowledge the Master’s Program in Soil and Water Management and the Department of Soil Science, Faculty of Agriculture, Universitas Brawijaya, for their support in providing facilities, technical assistance, and a laboratory technician throughout the research.

Conflicts of Interest

The authors declare no conflicts of interest.

References

  1. Govindasamy, P.; Muthusamy, S.K.; Bagavathiannan, M.; Mowrer, J.; Jagannadham, P.T.K.; Maity, A.; Halli, H.M.G.K.S.; Vadivel, R.T.K.D.; Raj, R.; Pooniya, V.; et al. Nitrogen use efficiency—A key to enhance crop productivity under a changing climate. Front. Plant Sci. 2023, 14, 1121073. [Google Scholar] [CrossRef]
  2. Wang, Q.; Li, S.; Li, J.; Huang, D. The Utilization and Roles of Nitrogen in Plants. Forests 2024, 15, 1191. [Google Scholar] [CrossRef]
  3. Zayed, O.; Hewedy, O.A.; Abdelmoteleb, A.; Ali, M.; Youssef, M.S.; Roumia, A.F.; Seymour, D.; Yuan, Z.-C. Nitrogen Journey in Plants: From Uptake to Metabolism, Stress Response, and Microbe Interaction. Biomolecules 2023, 13, 1443. [Google Scholar] [CrossRef]
  4. Cameron, K.C.; Di, H.J.; Moir, J.L. Nitrogen losses from the soil/plant system: A review. Ann. Appl. Biol. 2013, 162, 145–173. [Google Scholar] [CrossRef]
  5. Jalpa, L.; Mylavarapu, R.S.; Hochmuth, G.J.; Wright, A.L.; van Santen, E. Apparent recovery and efficiency of nitrogen fertilization in tomato grown on sandy soils. HortTechnology 2020, 30, 204–211. [Google Scholar] [CrossRef]
  6. Mahmud, K.; Panday, D.; Mergoum, A.; Missaoui, A. Nitrogen Losses and Potential Mitigation Strategies for a Sustainable Agroecosystem. Sustainability 2021, 13, 2400. [Google Scholar] [CrossRef]
  7. Monib, A.W.; Niazi, P.; Barai, S.M.; Sawicka, B.; Baseer, A.Q.; Nikpay, A.; Saleem Fahmawi, S.M.; Singh, D.; Alikhail, M.; Thea, B. Nitrogen Cycling Dynamics: Investigating Volatilization and its Interplay with N2 Fixation. J. Res. Appl. Sci. Biotechnol. 2024, 3, 17–31. [Google Scholar] [CrossRef]
  8. Wen, S.; Cui, N.; Wang, Y.; Gong, D.; Xing, L.; Wu, Z.; Zhang, Y.; Wang, Z. Determining Effect of Fertilization on Reactive Nitrogen Losses through Nitrate Leaching and Key Influencing Factors in Chinese Agricultural Systems. Agric. Water Manag. 2024, 303, 109055. [Google Scholar] [CrossRef]
  9. Wu, D.; Zhang, Y.; Dong, G.; Du, Z.; Wu, W.; Chadwick, D.; Bol, R. The Importance of Ammonia Volatilization in Estimating the Efficacy of Nitrification Inhibitors to Reduce N2O Emissions: A Global Meta-Analysis. Environ. Pollut. 2021, 271, 116365. [Google Scholar] [CrossRef]
  10. Bhatt, R.; Kunal; Moulick, D.; Bárek, V.; Brestic, M.; Gaber, A.; Skalicky, M.; Hossain, A. Sustainable strategies to limit nitrogen loss in agriculture through improving its use efficiency—Aiming to reduce environmental pollution. J. Agric. Food Res. 2025, 22, 101957. [Google Scholar] [CrossRef]
  11. Abdallah, A.M. The Effect of Hydrogel Particle Size on Water Retention Properties and Availability under Water Stress. Int. Soil Water Conserv. Res. 2019, 7, 275–285. [Google Scholar] [CrossRef]
  12. Arunrat, N.; Kongsurakan, P.; Sereenonchai, S.; Hatano, R. Soil Organic Carbon in Sandy Paddy Fields of Northeast Thailand: A Review. Agronomy 2020, 10, 1061. [Google Scholar] [CrossRef]
  13. Siswanto; Mindari, W.; Santoso, S.B.; Rahayu, R.D. Effectiveness of Ameliorant Humic Acid and Silica Based on Availability of Sandy Soil Nitrogen for Rice. Nusant. Sci. Technol. Proc. 2022, 24, 340–343. [Google Scholar] [CrossRef]
  14. de Jesus Duarte, S.; Glaser, B.; Pellegrino Cerri, C.E. Effect of Biochar Particle Size on Physical, Hydrological and Chemical Properties of Loamy and Sandy Tropical Soils. Agronomy 2019, 9, 165. [Google Scholar] [CrossRef]
  15. Sandhu, V.; Lamba, J.; Kaur, P.; Malhotra, K.; Way, T.R.; Balkcom, K.S.; Prasad, R. Effect of Cover Crops on Phosphorus and Trace Metal Leaching in Agricultural Soils. Agric. Water Manag. 2025, 309, 109343. [Google Scholar] [CrossRef]
  16. Wang, N.; Zhang, T. Soil Pore Structure and Its Research Methods: A Review. Soil Water Res. 2024, 19, 1–24. [Google Scholar] [CrossRef]
  17. Md Motasim, A.; Samsuri, A.W.; Nabayi, A.; Akter, A.; Haque, M.A.; Sukor, A.S.A.; Adibah, A.M. Urea application in soil: Processes, losses, and alternatives—A review. Discov. Agric. 2024, 2, 42. [Google Scholar] [CrossRef]
  18. Hussain, A.; Jahan, N.; Jabeen, Z.; Rehman, K.U.; Rafeeq, H.; Bilal, M.; Iqbal, H.M. Synergistic effect of urease and nitrification inhibitors in the reduction of ammonia volatilization. Water Air Soil Pollut. 2021, 232, 303. [Google Scholar] [CrossRef]
  19. Suwardi; Suryaningtyas, D.T.; Ghofar, A.; Rosjidi, M.; Mustafa, A.; Saputra, H. Effect of polyethylene glycol and humic acid coating on NPK release from controlled-release fertilizer. Sci. World J. 2024, 2024, 5510660. [Google Scholar] [CrossRef]
  20. Incrocci, L.; Maggini, R.; Cei, T.; Carmassi, G.; Botrini, L.; Filippi, F.; Clemens, R.; Terrones, C.; Pardossi, A. Innovative Controlled-Release Polyurethane-Coated Urea Could Reduce N Leaching in Tomato Crop in Comparison to Conventional and Stabilized Fertilizers. Agronomy 2020, 10, 1827. [Google Scholar] [CrossRef]
  21. Amalina, F.; Syukor Abd Razak, A.; Krishnan, S.; Sulaiman, H.; Zularisam, A.W.; Nasrullah, M. Biochar production techniques utilizing biomass waste-derived materials and environmental applications—A review. J. Hazard. Mater. Adv. 2022, 7, 100134. [Google Scholar] [CrossRef]
  22. Kumar, M.; Dutta, S.; You, S.; Luo, G.; Zhang, S.; Show, P.L.; Sawarkar, A.D.; Singh, L.; Tsang, D.C.W. A Critical Review on Biochar for Enhancing Biogas Production from Anaerobic Digestion of Food Waste and Sludge. J. Clean. Prod. 2021, 305, 127143. [Google Scholar] [CrossRef]
  23. Rambhatla, N.; Panicker, T.F.; Mishra, R.K.; Manjeshwar, S.K.; Sharma, A. Biomass Pyrolysis for Biochar Production: Study of Kinetics Parameters and Effect of Temperature on Biochar Yield and Its Physicochemical Properties. Results Eng. 2025, 25, 103679. [Google Scholar] [CrossRef]
  24. Khater, E.-S.; Bahnasawy, A.; Hamouda, R.; Sabahy, A.; Abbas, W.; Morsy, O.M. Biochar Production under Different Pyrolysis Temperatures with Different Types of Agricultural Wastes. Sci. Rep. 2024, 14, 2625. [Google Scholar] [CrossRef] [PubMed]
  25. Lehmann, J.; Joseph, S. (Eds.) Biochar for Environmental Management: Science & Technology; Earthscan: London, UK, 2009; p. 448. [Google Scholar]
  26. Tomczyk, A.; Sokołowska, Z.; Boguta, P. Biochar Physicochemical Properties: Pyrolysis Temperature and Feedstock Kind Effects. Rev. Environ. Sci. Biotechnol. 2020, 19, 191–215. [Google Scholar] [CrossRef]
  27. Varkolu, M.; Gundekari, S.; Omvesh; Palla, V.C.S.; Kumar, P.; Bhattacharjee, S.; Vinodkumar, T. Recent Advances in Biochar Production, Characterization, and Environmental Applications. Catalysts 2025, 15, 243. [Google Scholar] [CrossRef]
  28. Ding, Y.; Liu, Y.; Liu, S.; Li, Z.; Tan, X.; Huang, X.; Zeng, G.; Zhou, L.; Zheng, B. Biochar to improve soil fertility: A review. Agron. Sustain. Dev. 2016, 36, 36. [Google Scholar] [CrossRef]
  29. Khan, S.; Irshad, S.; Mehmood, K.; Hasnain, Z.; Nawaz, M.; Rais, A.; Gul, S.; Wahid, M.A.; Hashem, A.; Abd_Allah, E.F.; et al. Biochar Production and Characteristics, Its Impacts on Soil Health, Crop Production, and Yield Enhancement: A Review. Plants 2024, 13, 166. [Google Scholar] [CrossRef]
  30. Chen, G.; Gui, J.; Qin, C.-X.; Huang, D.-L.; Liao, F.; Yang, L.; Yang, L. Evaluating the impact of biochar on biomass and nitrogen use efficiency of sugarcane using 15N tracer method. Front. Agron. 2022, 4, 989993. [Google Scholar] [CrossRef]
  31. El-Naggar, A.; Awad, Y.M.; Tang, X.-Y.; Liu, C.; Niazi, N.K.; Jien, S.-H.; Tsang, D.C.W.; Song, H.; Ok, Y.S.; Lee, S.-S. Biochar influences soil carbon pools and facilitates interactions with soil: A field investigation. Land Degrad. Dev. 2018, 29, 2162–2171. [Google Scholar] [CrossRef]
  32. Luo, X.; Liu, G.; Xia, Y.; Chen, L.; Jiang, Z.; Zheng, H.; Wang, Z. Use of biochar-compost to improve properties and productivity of the degraded coastal soil in the Yellow River Delta, China. J. Soils Sediments 2017, 17, 780–789. [Google Scholar] [CrossRef]
  33. Oladele, S.O. Changes in physicochemical properties and quality index of an Alfisol after three years of rice husk biochar amendment in rainfed rice–maize cropping sequence. Geoderma 2019, 353, 359–371. [Google Scholar] [CrossRef]
  34. Pandian, K.; Vijayakumar, S.; Abu Firnass Mustaffa, M.R.; Subramanian, P.; Chitraputhirapillai, S. Biochar—A sustainable soil conditioner for improving soil health, crop production and environment under changing climate: A review. Front. Soil Sci. 2024, 4, 1376159. [Google Scholar] [CrossRef]
  35. Badan Pusat Statistik Kabupaten Malang. Data Klimatologi Pos Karangkates; Badan Pusat Statistik Kabupaten Malang: Malang, Indonesia, 2023; Available online: https://malangkab.bps.go.id/id/statistics-table/2/NjQjMg==/data-klimatologi-pos-karangkates.html (accessed on 16 June 2025).
  36. Farni, Y.; Suntari, R.; Prijono, S. Utilization of Tithonia diversifolia and sugarcane leaves to improve soil properties and plant growth on a degraded sandy soil of Malang, East Java. J. Degrad. Min. Lands Manag. 2022, 9, 3227–3236. [Google Scholar] [CrossRef]
  37. Fauzan, M.N.; Dwiastuti, R.; Sujarwo; Kurniawan, S. Changes in soil characteristics and estimated cost on reclamation of former sand mining land. J. Degrad. Min. Lands Manag. 2022, 9, 3533–3543. [Google Scholar] [CrossRef]
  38. Mukherjee, A.; Patra, B.R.; Podder, J.; Dalai, A.K. Synthesis of biochar from lignocellulosic biomass for diverse industrial applications and energy harvesting: Effects of pyrolysis conditions on the physicochemical properties of biochar. Front. Mater. 2022, 9, 870184. [Google Scholar] [CrossRef]
  39. Yadav, K.; Jagadevan, S. Influence of process parameters on synthesis of biochar by pyrolysis of biomass: An alternative source of energy. In Recent Advances in Pyrolysis; IntechOpen: London, UK, 2019. [Google Scholar] [CrossRef]
  40. Kachurina, O.M.; Zhang, H.; Raun, W.R.; Krenzer, E.G. Simultaneous determination of soil aluminum, ammonium- and nitrate- nitrogen using 1 M potassium chloride. Commun. Soil Sci. Plant Anal. 2000, 31, 893–903. [Google Scholar] [CrossRef]
  41. Indonesian Soil Research Institute. Petunjuk Teknis Analisis Kimia Tanah, Tanaman, Air dan Pupuk, 2nd ed.; Indonesian Soil Research Institute: Bogor, Indonesia, 2009. [Google Scholar]
  42. Anas, M.; Liao, F.; Verma, K.K.; Sarwar, M.A.; Mahmood, A.; Chen, Z.-L.; Li, Q.; Zeng, X.-P.; Liu, Y.; Li, Y.-R. Fate of Nitrogen in Agriculture and Environment: Agronomic, Eco-Physiological and Molecular Approaches to Improve Nitrogen Use Efficiency. Biol. Res. 2020, 53, 47. [Google Scholar] [CrossRef]
  43. Pereira, V.V.; Morales, M.M.; Pereira, D.H.; de Rezende, F.A.; de Souza Magalhães, C.A.; de Lima, L.B.; Marimon-Junior, B.H.; Petter, F.A. Activated Biochar-Based Organomineral Fertilizer Delays Nitrogen Release and Reduces N2O Emission. Sustainability 2022, 14, 12388. [Google Scholar] [CrossRef]
  44. Bi, H.; Xu, J.; Li, K.; Li, K.; Cao, H.; Zhao, C. Effects of Biochar-Coated Nitrogen Fertilizer on the Yield and Quality of Bok Choy and on Soil Nutrients. Sustainability 2024, 16, 1659. [Google Scholar] [CrossRef]
  45. Liu, Z.; He, T.; Cao, T.; Yang, T.; Meng, J.; Chen, W. Effects of Biochar Application on Nitrogen Leaching, Ammonia Volatilization and Nitrogen Use Efficiency in Two Distinct Soils. J. Soil Sci. Plant Nutr. 2017, 17, 515–528. [Google Scholar] [CrossRef]
  46. Lapushkin, V.M.; Lapushkina, A.A.; Torshin, S.P. Effect of Coated Urea and NPK-Fertilizers on Spring Wheat Yield and Nitrogen Use Efficiency. Braz. J. Biol. 2024, 84, e279269. [Google Scholar] [CrossRef] [PubMed]
  47. Gamage, A.; Basnayake, B.; De Costa, J.; Merah, O. Effects of Rice Husk Biochar Coated Urea and Anaerobically Digested Rice Straw Compost on the Soil Fertility, and Cyclic Effect of Phosphorus. Plants 2022, 11, 75. [Google Scholar] [CrossRef]
  48. Singh, B.; Craswell, E. Fertilizers and nitrate pollution of surface and ground water: An increasingly pervasive global problem. SN Appl. Sci. 2021, 3, 518. [Google Scholar] [CrossRef]
  49. Chen, Y.; Zhao, H.; Xiao, H.; Xie, T.; Qin, S.; Hu, G. Effects of nitrogen reduction combined with organic materials on crop yield, photosynthetic characteristics, and product quality of corn-cabbage rotation system. Chin. J. Appl. Ecol. 2021, 32, 4391–4400. [Google Scholar] [CrossRef]
  50. Liu, Z.; Gao, F.; Yang, J.; Zhen, X.; Li, Y.; Zhao, J.; Li, J.; Qian, B.; Yang, D.; Li, X. Photosynthetic Characteristics and Uptake and Translocation of Nitrogen in Peanut in a Wheat–Peanut Rotation System under Different Fertilizer Management Regimes. Plants 2019, 10, 86. [Google Scholar] [CrossRef] [PubMed]
  51. Zhang, B.; Liu, C.; Li, Q.; Ye, J.; Lin, Y.; Wang, Y.; Burton, D.L. Evaluating the effect of biochar rate and combination with fertilizer on the dynamics of soil nitrogen supply in tea plantation. Sci. Rep. 2025, 15, 3135. [Google Scholar] [CrossRef]
  52. Qaderi, M.M.; Evans, C.C.; Spicer, M.D. Plant Nitrogen Assimilation: A Climate Change Perspective. Plants 2025, 14, 1025. [Google Scholar] [CrossRef]
  53. Sanagi, M.; Aoyama, S.; Kubo, A.; Lu, Y.; Sato, Y.; Ito, S.; Abe, M.; Mitsuda, N.; Ohme-Takagi, M.; Kiba, T.; et al. Low Nitrogen Conditions Accelerate Flowering by Modulating the Phosphorylation State of FLOWERING BHLH 4 in Arabidopsis. Proc. Natl. Acad. Sci. USA 2021, 118, e2022942118. [Google Scholar] [CrossRef]
  54. Ali, A.; Jabeen, N.; Farruhbek, R.; Chachar, Z.; Laghari, A.A.; Chachar, S.; Ahmed, N.; Ahmed, S.; Yang, Z. Enhancing Nitrogen Use Efficiency in Agriculture by Integrating Agronomic Practices and Genetic Advances. Front. Plant Sci. 2025, 16, 1543714. [Google Scholar] [CrossRef]
Figure 1. The site of the field experiment.
Nitrogen 06 00061 g001
Figure 2. Layout of field experiment.
Nitrogen 06 00061 g002
Figure 3. Effect of biochar thickness, BCU dose, and combination of biochar layer thickness and BCU dose on ammonium at 8 WAP (ac), nitrate at 8 WAP (df), soil N at 8 WAP (gi), and soil N at 12 WAP (jl). Different letters indicate significant differences according to HSD test.
Nitrogen 06 00061 g003
Figure 4. Effect of biochar thickness, BCU dose, and combination of biochar layer thickness and BCU dose on N content at 8 WAP (ac), N content at 12 WAP (df), N uptake at 8 WAP (gi), N uptake at 12 WAP (jl), and N-use efficiency (mo). Different letters indicate significant differences according to HSD test.
Nitrogen 06 00061 g004
Figure 5. Matrix of Pearson correlation test (a); Regression test of: ammonium at 8 WAP and plant uptake at 8 WAP (b); N uptake at 8 WAP and plant height at 8 WAP (c); N uptake at 12 WAP and yield (d).
Nitrogen 06 00061 g005
Table 1. Effect of BCU on plant growth.
Plant Height (cm)BCU Fertilizer DoseThickness of Biochar LayerAverage
B1B2
N146.53 c32.33 d39.43 b
N255.73 ab57.53 ab56.63 a
N349.00 bc60.67 a54.83 a
N431.40 d45.00 c38.20 b
N529.40 d52.60 abc41.00 b
Average42.41 b49.63 a
Average Number of LeavesBCU Fertilizer DoseThickness of Biochar LayerAverage
B1B2
N16 b5 d5 cd
N26 b7 ab6 ab
N37 ab7 a7 a
N45 d5 d5 d
N56 b6 b6 bc
Average66
Stem Diameter (mm)BCU Fertilizer DoseThickness of Biochar LayerAverage
B1B2
N117.53 cd11.33 f14.43 c
N222.33 ab20.33 abc21.33 a
N319.53 bc23.00 a21.27 a
N412.80 f14.00 ef13.40 c
N516.33 de20.53 ab18.43 b
Average17.7117.84
Note: Means followed by different lowercase letters indicate significant differences among treatment (Honestly Significant Difference (HSD) test at p ≤ 0.05).
Table 2. Effect of BCU on yield parameters.
Length of corn cob (cm)BCU Fertilizer DoseThickness of Biochar LayerAverage
B1B2
N113.508.8511.18
N215.5714.8315.20
N313.1717.0015.08
N413.1012.1712.63
N513.6011.1712.38
Average13.7912.80
Diameter of corn cob (mm)BCU Fertilizer DoseThickness of Biochar LayerAverage
B1B2
N140.65 bcde37.20 de38.93 b
N246.35 ab43.75 abc45.05 a
N335.10 e47.55 a41.33 ab
N442.45 abcd40.00 cde41.23 b
N543.50 abc39.17 cde41.33 ab
Average41.6141.53
Weight of corn cob (g/plant)BCU Fertilizer DoseThickness of Biochar LayerAverage
B1B2
N1104.00 abc42.50 c73.25 b
N2157.25 a122.50 ab139.88 a
N369.50 bc163.25 a116.38 ab
N4112.00 abc67.33 bc89.67 b
N5122.00 ab72.33 bc97.17 ab
Average112.9593.58
Yield (t/ha)BCU Fertilizer DoseThickness of Biochar LayerAverage
B1B2
N15.57 cd1.76 e3.67 b
N28.42 ab6.07 bc7.24 a
N33.88 cde9.69 a6.78 a
N45.20 cd2.85 de4.02 b
N55.43 cd2.82 de4.13 b
Average5.70 a4.64 b
Note: Means followed by different lowercase letters indicate significant differences among treatment (Honestly Significant Difference (HSD) test at p ≤ 0.05).
Disclaimer/Publisher’s Note: The statements, opinions and data contained in all publications are solely those of the individual author(s) and contributor(s) and not of MDPI and/or the editor(s). MDPI and/or the editor(s) disclaim responsibility for any injury to people or property resulting from any ideas, methods, instructions or products referred to in the content.

