Article

High-Power Closed-Loop Pilot System for Nitric Acid Production Using Inductively Coupled Microwave Plasma

1
Radom Corporation, N27W23676 Paul Rd., Pewaukee, WI 53072, USA
2
DVO, Inc., 820 W Main St., Chilton, WI 53014, USA
3
Milwaukee School of Engineering, 1025 N Broadway, Milwaukee, WI 53202, USA
*
Author to whom correspondence should be addressed.
Nitrogen 2025, 6(3), 51; https://doi.org/10.3390/nitrogen6030051 (registering DOI)
Submission received: 10 May 2025 / Revised: 13 June 2025 / Accepted: 27 June 2025 / Published: 28 June 2025

Abstract

This work presents the characterization of a large-scale pilot plant for nitric acid production that employs atmospheric-pressure plasma in a closed-loop configuration. The primary objective here is to evaluate the scientific and practical feasibility of using high-power Cerawave™ plasma torch technology, manufactured by Radom Corporation, to enhance the rate of nitric acid production of plasma-assisted nitrogen fixation systems, while achieving specific energy consumption (SEC) comparable to that of smaller-scale setups reported in the literature. We provide a comprehensive overview of the components of the pilot plant, its operational strategy, and the analytical models underlying its processes. Preliminary system optimization results are discussed alongside the outcomes from a controlled batch run. After 30.9 h of operation at 50 kW plasma power, the system produced 198.9 L of nitric acid with a concentration of 28.6% by weight, corresponding to overall SEC of approximately 5.3 MJ/mol. This SEC could be improved to 3.7 MJ/mol using absorption columns with greater than 90% absorption efficiency. Additionally, around 60% of the plasma power was recovered as usable process heat via a heat exchanger. These results demonstrate that plasma-based nitrogen fixation is scientifically and technically viable at higher production scales while maintaining competitive specific energy consumption using microwave plasma.

1. Introduction

Plasma-based nitrogen fixation systems represent a significant departure from the traditional Haber–Bosch and Ostwald processes for ammonia and nitric acid synthesis. In contrast to these processes, which are characterized by high temperatures, catalyzed chemical reactions, pressures exceeding 100 bar, and a substantial carbon footprint [1,2,3,4], plasma-based nitrogen fixation could significantly simplify, modularize, and detoxify the production of nitric acid, especially as access to green energy sources becomes more prevalent. Leveraging the novel Cerawave™ technology [5,6,7], the system in this work demonstrates the high-throughput production of concentrated nitric acid with a minimal environmental impact. In contrast to large-scale embodiments of the Ostwald process, which use air, water, and methane-based ammonia as reagents and a platinum–rhodium catalyst at high temperatures to oxidize nitrogen, plasma-based nitrogen fixation uses air and water as the sole reagents and oxidizes nitrogen directly via plasma-catalyzed reactions [8,9,10,11,12]. The inherent simplicity, the minimal number of processing stages, and the virtually unlimited raw material made this method attractive to scientists, engineers, and industrialists from the late 19th to the early 20th centuries [13,14]. Initially, the production efficiency of nitric acid using high-temperature plasma was suboptimal, presenting challenges related to scalability [15].
Advances in science and engineering over the decades have markedly enhanced the efficiency of plasma-catalyzed nitrogen fixation. For instance, a recent study compared the relative performance of plasma-based nitrogen fixation methods such as dielectric barrier discharge (DBDs), glow discharge, spark discharge, and gliding arc plasma [16]. The input power ranged from 4 to 30 W, with the specific energy consumption (SEC) reportedly varying from 3.86 MJ/mol to 30.2 MJ/mol. Experiments based on pulsed-spark discharge plasma reported SEC of 40 MJ/mol in 2020 when using a 25 W system [17]. A coupled plasma catalyst system [18], with input power of 80 W, demonstrated specific energy consumption of 2.9 MJ/mol in 2022; the presence of platinum catalysts resulted in a 2.6-fold enhancement in NO production. Matveev et al. reported SEC of 2.4 MJ/mol when using a 3–6 kW system that achieved NOx by mass concentration of 6% [19]. Recent research employing rotating gliding arc plasma has achieved a notable advancement in efficiency, improving the SEC to 1.8 MJ/mol due to increased pressure [20]. In work by Kelly and Bogaerts [21], a comprehensive review of diverse plasma generation methodologies was presented. The study discussed various plasma sources, including electric arc discharges, an array of spark discharge mechanisms (encompassing both corona and glow discharges), and microwave-induced plasma systems, and they presented a rigorous analysis of the energy expenditure associated with each plasma source. The findings elucidated the superior potential of microwave plasma sources in optimizing energy efficiency. Specifically, the research identified that, for competitive viability in industrial applications, target SEC of 2.4 MJ/mol is required. Furthermore, the study suggested that this figure could be reduced to an optimal threshold of around 0.7 MJ/mol, thereby significantly enhancing the economic feasibility of plasma-based processes relative to established commercial alternatives.
While prior studies have demonstrated promising results for plasma-based nitrogen fixation, significant challenges remain in scaling these technologies for industrial and agricultural applications, especially those that rely on vacuum pressures, strong magnetic fields, or other technologies that are similarly difficult to scale. Notably, most existing work has focused primarily on NOx generation, with limited attention to the design and integration of plasma systems into complete nitric acid production processes. Moreover, no published studies to date have evaluated the performance or NOx production efficiency of the recently developed 100 kW Cerawave™ microwave plasma torch.
To lay the groundwork for such an evaluation, it is useful to examine the thermal characteristics of atmospheric-pressure plasmas. A 50 kW atmospheric-pressure air plasma operating with 1500 standard liters per minute (slpm) of gas flow in thermal equilibrium implies an average gas temperature increase of approximately 1500 °C, which is insufficient for significant nitrogen oxidation if the input gas temperature is 25 °C. However, since the input power is not evenly distributed throughout the plasma region, portions of the process gas exceed 4000 °C, while other regions remain nearer to a few hundred °C. In the hotter plasma regions, a significant fraction of nitrogen dissociates and oxidizes to form nitrogen monoxide (NO), on the order of a few percent of the overall gas flow [22]. Rapid cooling of the plasma gas by quenching can ensure minimal back-reactions of NO to N2 and O2. This process forms the basis of plasma–chemical methods for atmospheric nitrogen fixation.
Despite growing interest in plasma-assisted nitrogen fixation, few studies have demonstrated the full-scale integration of plasma systems for nitric acid production. This work addresses this gap by exploring the scientific and engineering feasibility of large-scale plasma-assisted nitric acid synthesis using Cerawave™ microwave plasma technology. Specifically, we report (a) the design and operation of a full-scale pilot plant employing microwave-induced plasma for nitric acid synthesis, (b) the implementation of a closed-loop gas processing system that enables a tunable gas composition and pressure while minimizing emissions, (c) a first-of-its-kind experimental assessment of the NOx production efficiency of the 100 kW Cerawave™ torch, and (d) an analysis of the viability and constraints associated with integrating microwave plasma into at-scale nitrogen fixation infrastructure. Together, these contributions advance both the scientific understanding and practical implementation of plasma-enabled nitrogen conversion.

Target Application

Our target application focuses on the sustainable production of nitrogen-enriched fertilizers through the utilization of anaerobic digesters (ADs) on poultry farms. Poultry waste typically contains approximately 25% total solids, a proportion that can increase to 40–60% when bedding is included [23]. Given the high solid content, conventional fluid-based AD systems are ineffective without significant dilution, which is required to reduce the total solids concentration to 7–10%. Achieving this level of dilution necessitates the addition of five to eight times the volume of water, presenting considerable challenges associated with water supply and digestate disposal. A promising solution to this issue is the utilization of recycled, processed digestate, following treatment through a solids separation system. This system effectively reduces the total solids content of the digestate, producing effluent water that can be recycled to dilute the high-solids poultry waste influent.
However, the continuous recycling of digester effluent from poultry ADs poses another challenge: the accumulation of ammonium and ammonia in the liquid. Elevated concentrations of ammonium or ammonia can be toxic to methanogenic bacteria when they exceed 3500 ppm, making their removal essential to prevent the acidification and eventual failure of digesters [24]. To mitigate this issue, a system with an increasing effluent temperature and pH via air bubbling is utilized as a method to convert ammonium to ammonia, which can then be volatilized and extracted from the digester effluent [25]. Heat recovered from the plasma torch in the nitric acid plant presented in this work can be used to maintain the necessary temperature for efficient ammonia removal. The extracted ammonia is then directed to an absorption column, where it reacts with nitric acid to produce a nitrogen-enriched ammonium–nitrate fertilizer. This integrated approach not only addresses the challenges associated with high solids content and ammonia toxicity, but also promotes sustainable nutrient recovery in poultry farming operations.
To give an idea of the scale required, a 600,000-chicken farm with an AD generates about 300 L per minute of digestate and would require 6000 kg of nitric acid (100% basis) per day to neutralize all of the scrubbed ammonia. Figure 1 shows a 1 MW plasma nitrogen fixation plant concept for integration with an AD on a large-scale poultry farm. A 1 MW plasma-based nitrogen fixation system was selected to meet the heat demands of the accompanying ammonia stripping unit, sized for the digestate flow rates typical of medium-to-large chicken farms in the United States.

2. Materials and Methods

2.1. CerawaveTM Plasma Source

The torch used in this work leverages patented Cerawave™ technology to sustain near-atmospheric-pressure plasma using microwave energy from a 100 kW industrial magnetron operating in the 915 MHz industrial–scientific–medical frequency band. Cerawave™ replaces the traditional copper conductor in an inductive coil with rings composed of high-purity advanced technical ceramics carrying large alternating dielectric polarization currents, on the order of thousands of Amperes, with losses that are one hundred times lower than those in a traditional copper conductor. This improved efficiency enables plasma torch operation with dramatically reduced antenna cooling requirements.
In the plasma torch presented here, we use high-purity, high-density alumina rings with a relative dielectric constant of 10.0 and microwave loss tangent of less than 10−5. The rings have dimensions of 5.200 in OD × 2.125 in ID × 2.000 in H and are separated axially by a gap of 1.250 in. The two-ring design allows for an increased residence time for the plasma gas inside the high-field region. The rings are cooled by forced air.
The torch cavity is designed to resonate at a frequency of 911 MHz—the frequency of the incident microwaves. The alternating dielectric polarization current in the Cerawave™ rings drives strong, purely inductive electric fields interior to a 40 mm ID quartz torch, enabling the formation and sustainment of plasma. Plasma homogeneity is also improved given the lack of parasitic capacitively coupled electric fields.
At the maximum magnetron power of 100 kW employed in this work, the temperature of the alumina rings does not exceed 70 °C. 
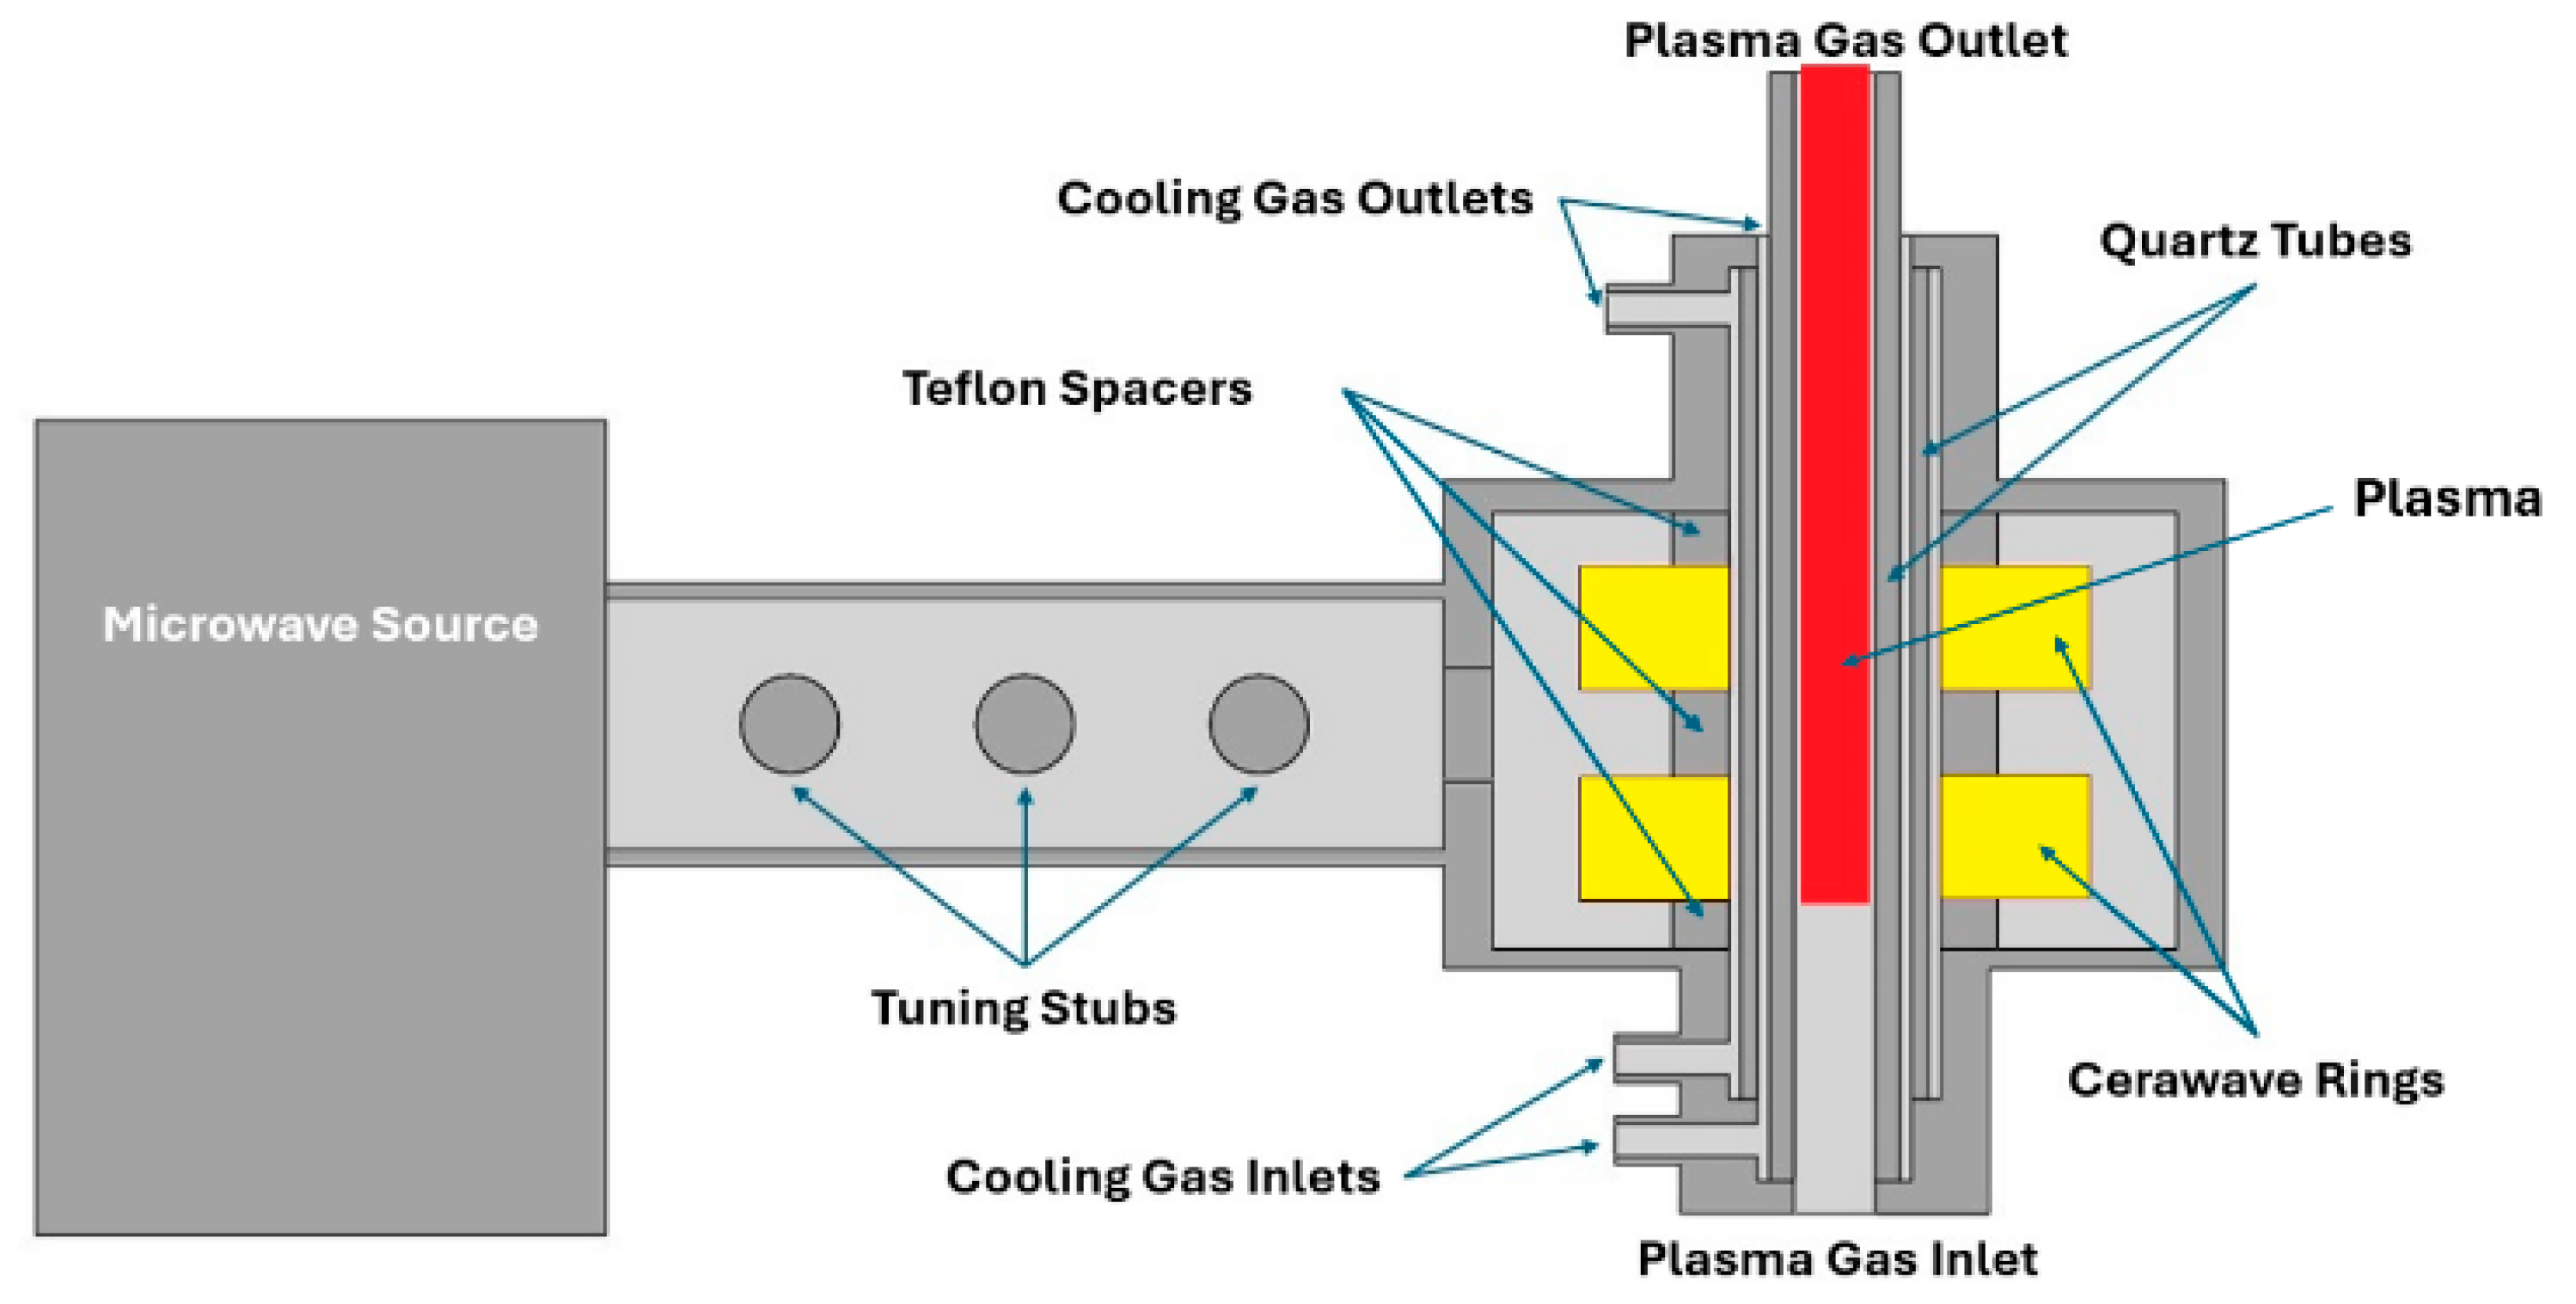
Figure 2 shows a cross-section of the geometry of the 100 kW plasma torch, where the Cerawave™ rings are shown in yellow.
The tuning stubs mitigate the power reflected by the plasma to the microwave generator, optimizing the net power received by the plasma. There are two cooling channels where air passes to keep the quartz tubes, the Cerawave™ rings, and the PTFE spacers cool during operation. These channels are supplied with air by two blowers.
The plasma torch presented here can safely operate continuously at power levels between 50 kW and 100 kW, but 50 kW is used for steady-state operation in this work unless stated otherwise. Note that 50 kW is the power absorbed by the plasma, corresponding to microwave generator input power of 60.5 kW, which implies grid-to-plasma power efficiency of 82.6%. Additionally, the reflected power remains small (less than 500 W) during operation due to the microwave autotuner. 
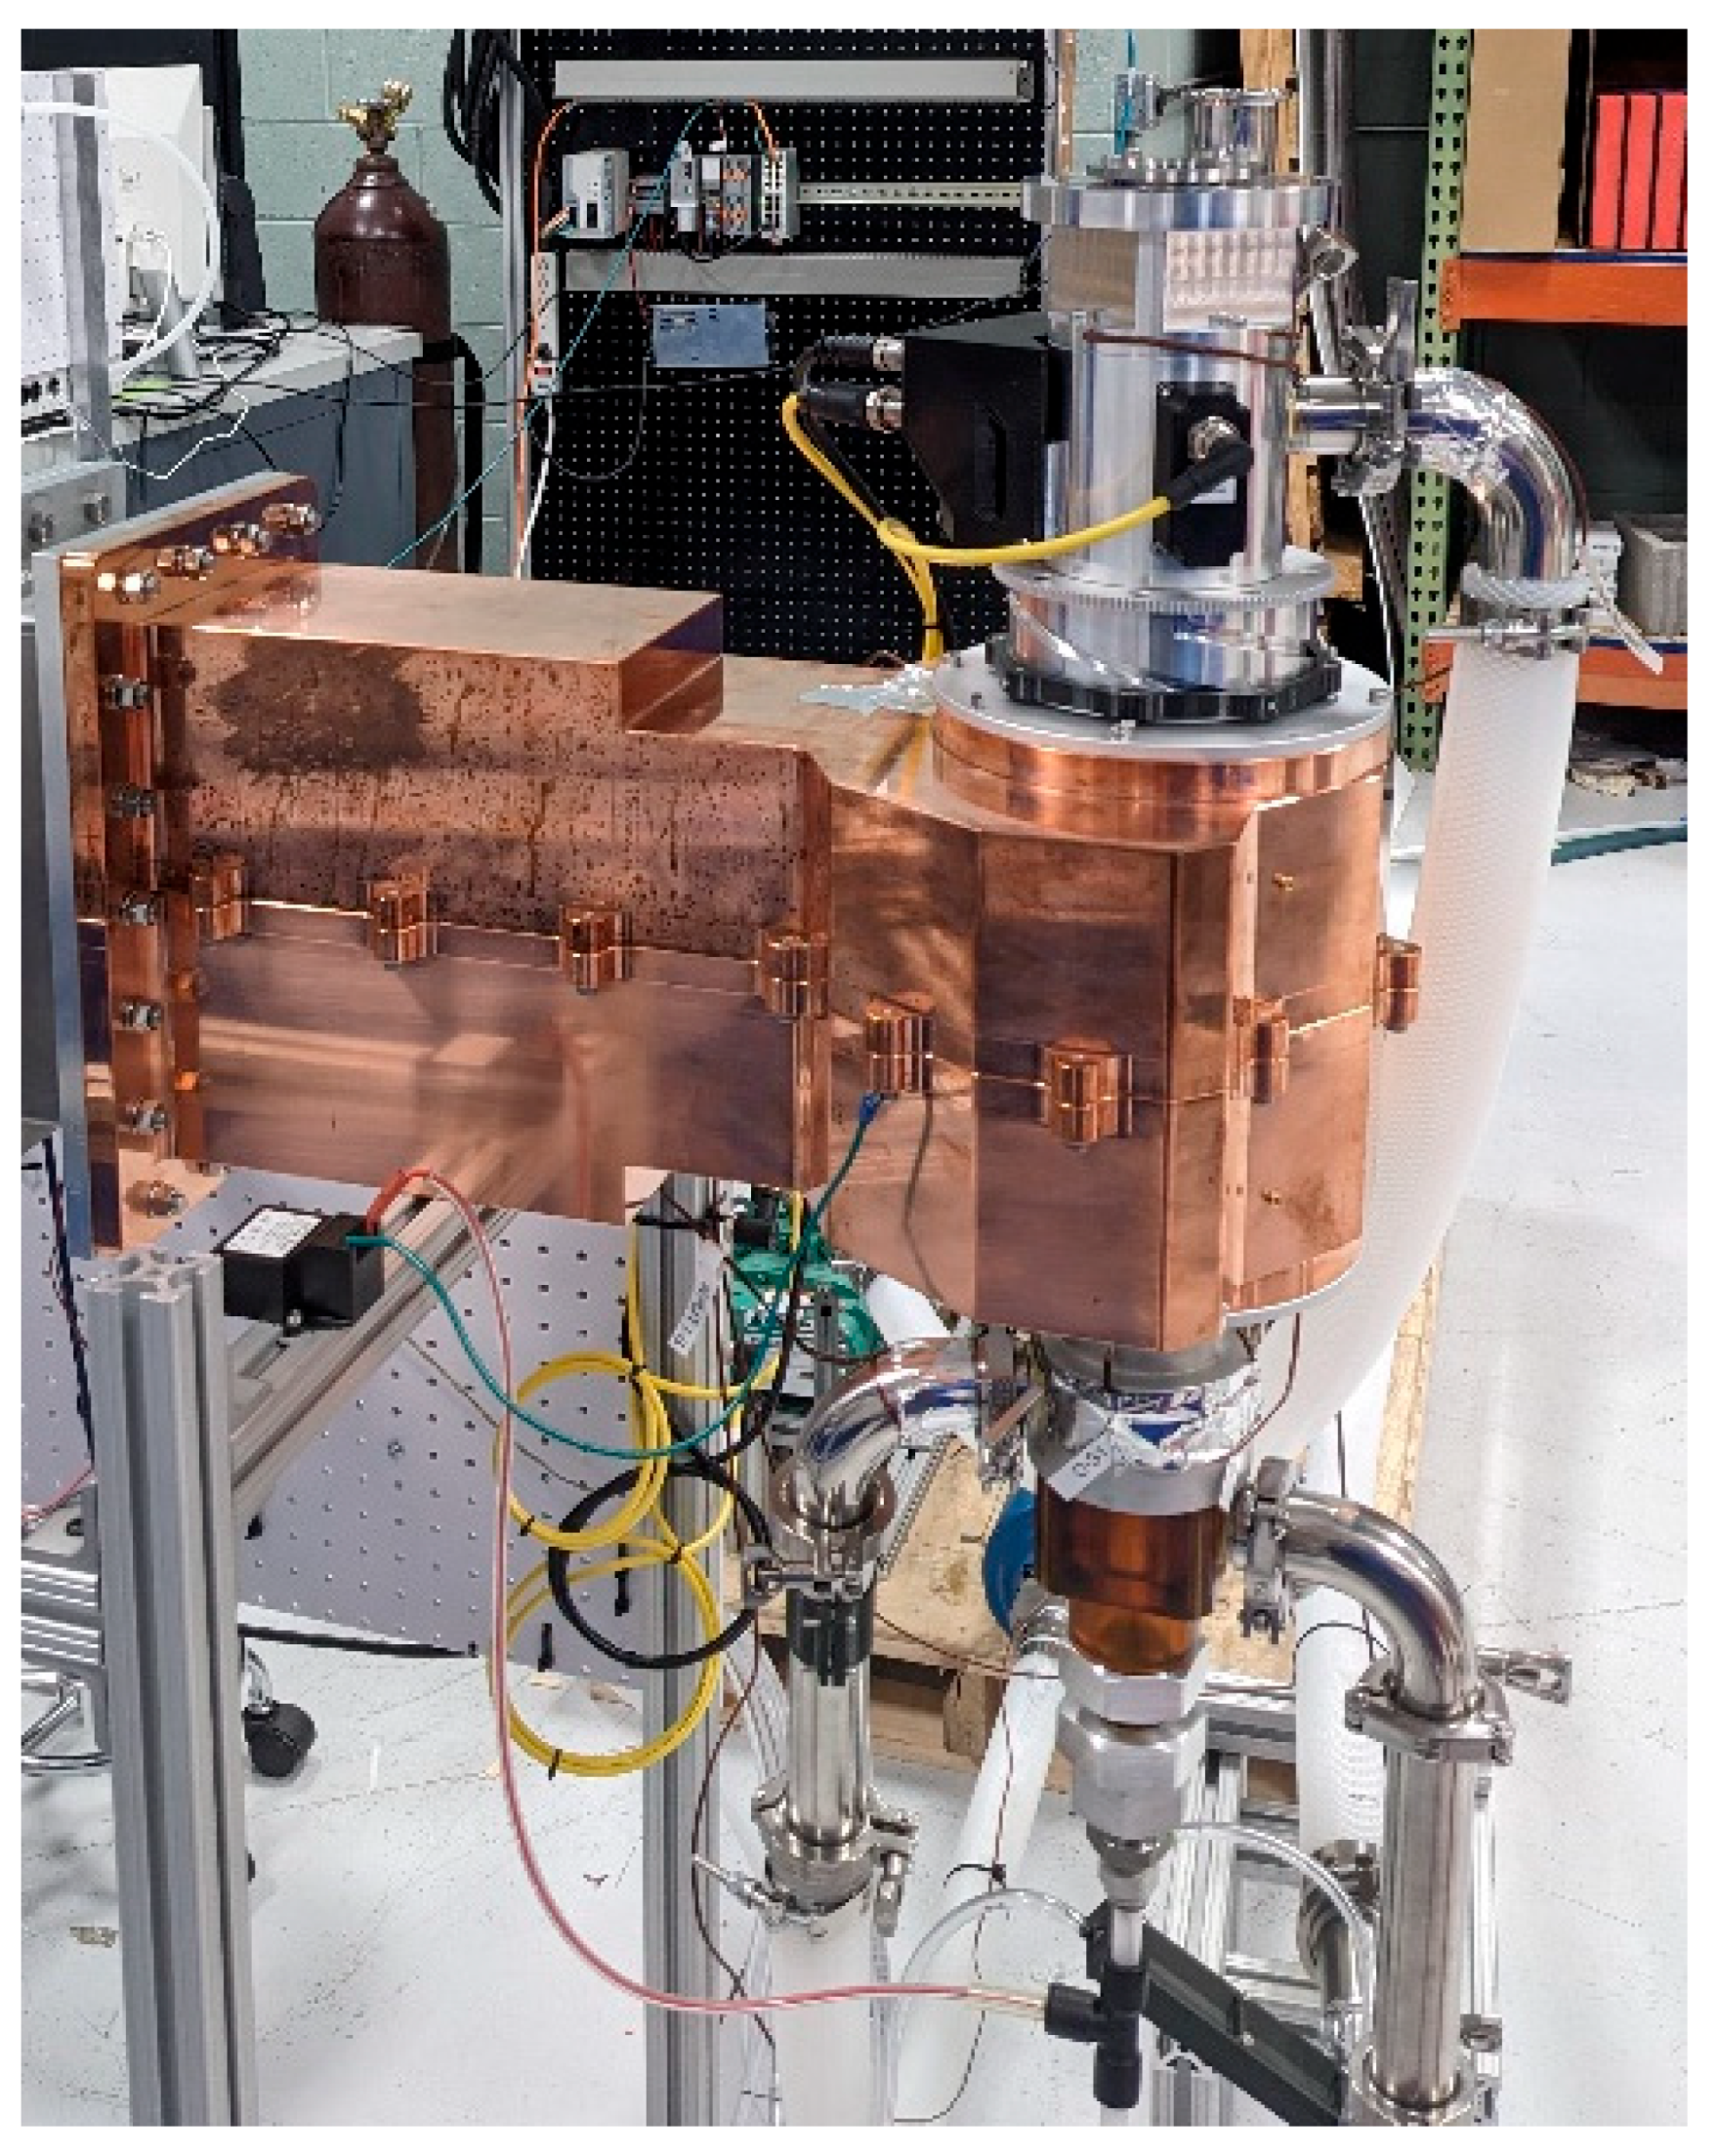
Figure 3 presents an image of the plasma torch used in this work, dismounted from the primary heat exchanger.

2.2. Plant Description

The plant consumes air, water, a small amount of argon (for plasma ignition), and electricity to produce nitric acid and heat. The plant is a closed-loop system consisting of the following components: a plasma torch, a primary heat exchanger, a secondary heat exchanger, four gas blowers (two for process gas and two for cooling gas), a tertiary heat exchanger, an oxidation chamber, two absorption columns, a condenser, a liquid reclamation system, a microwave generator, a microwave autotuner, a pressure swing adsorption (PSA) oxygen generator [26], liquid pumps, sensors, and interlocks [27]. Additional pieces of equipment include filters, mass flow controllers (MFCs), gas analyzers, and a programmable logic controller. This subsection describes each process-related component in detail. 
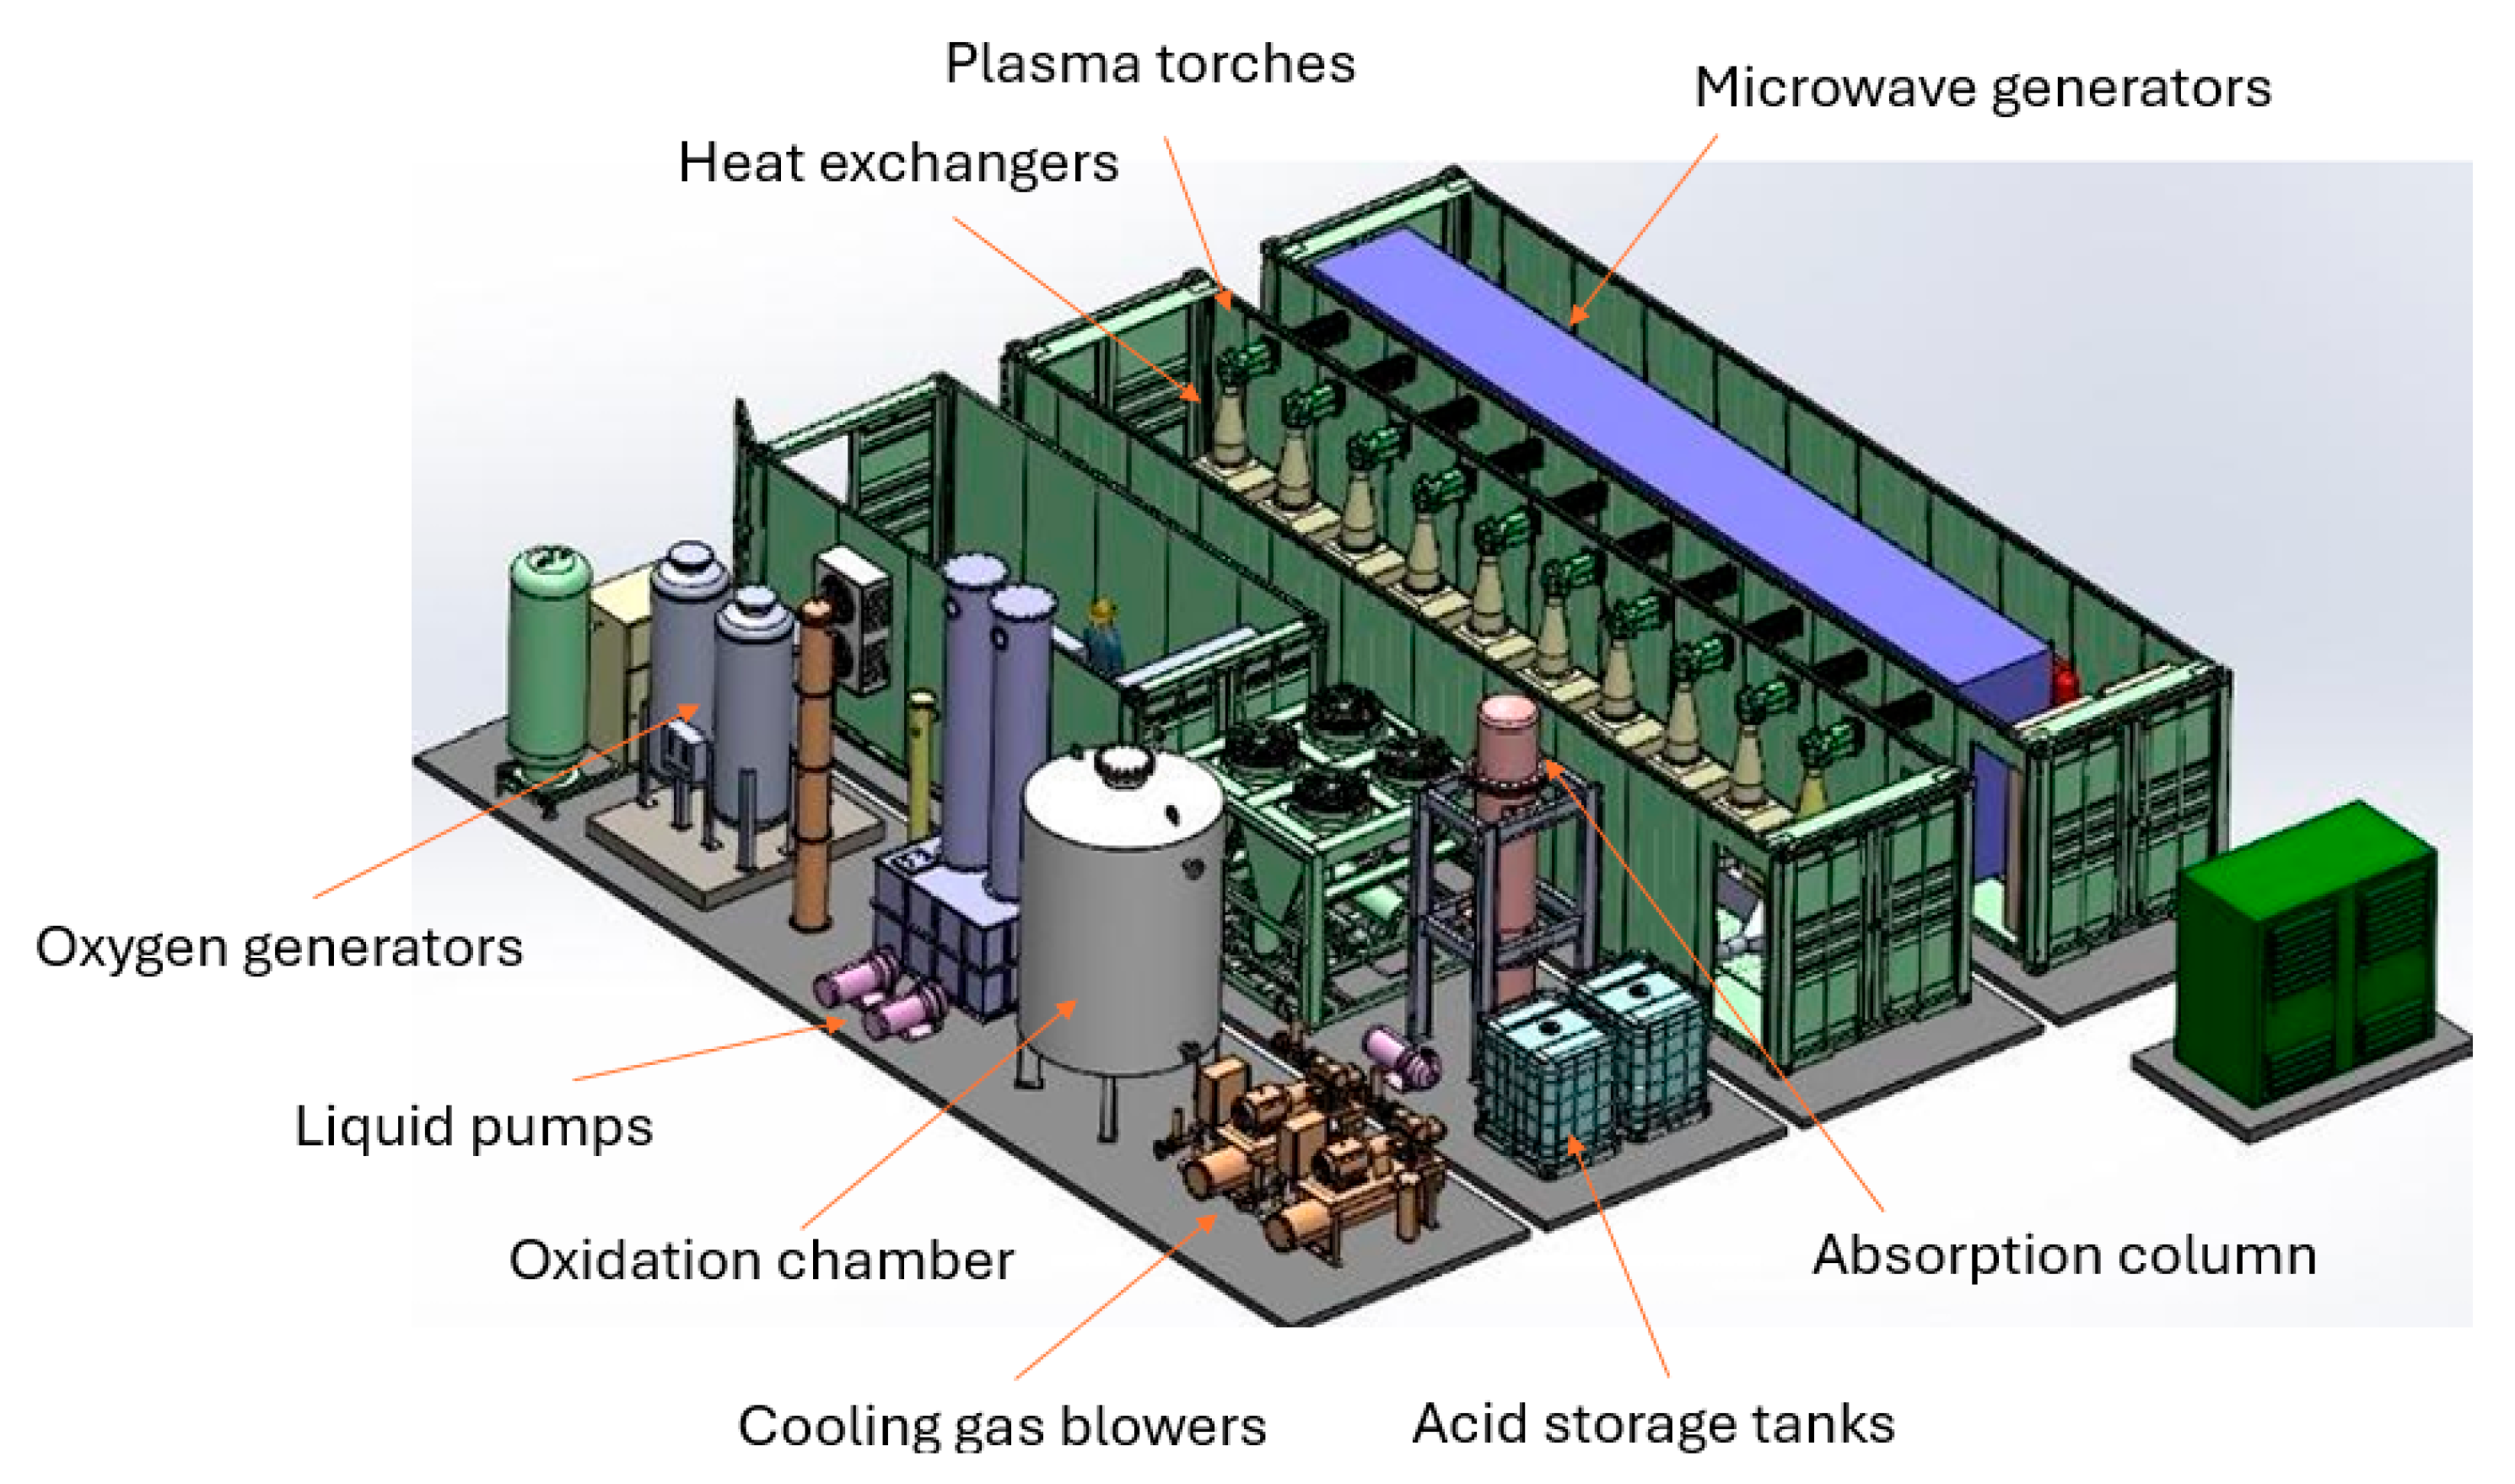
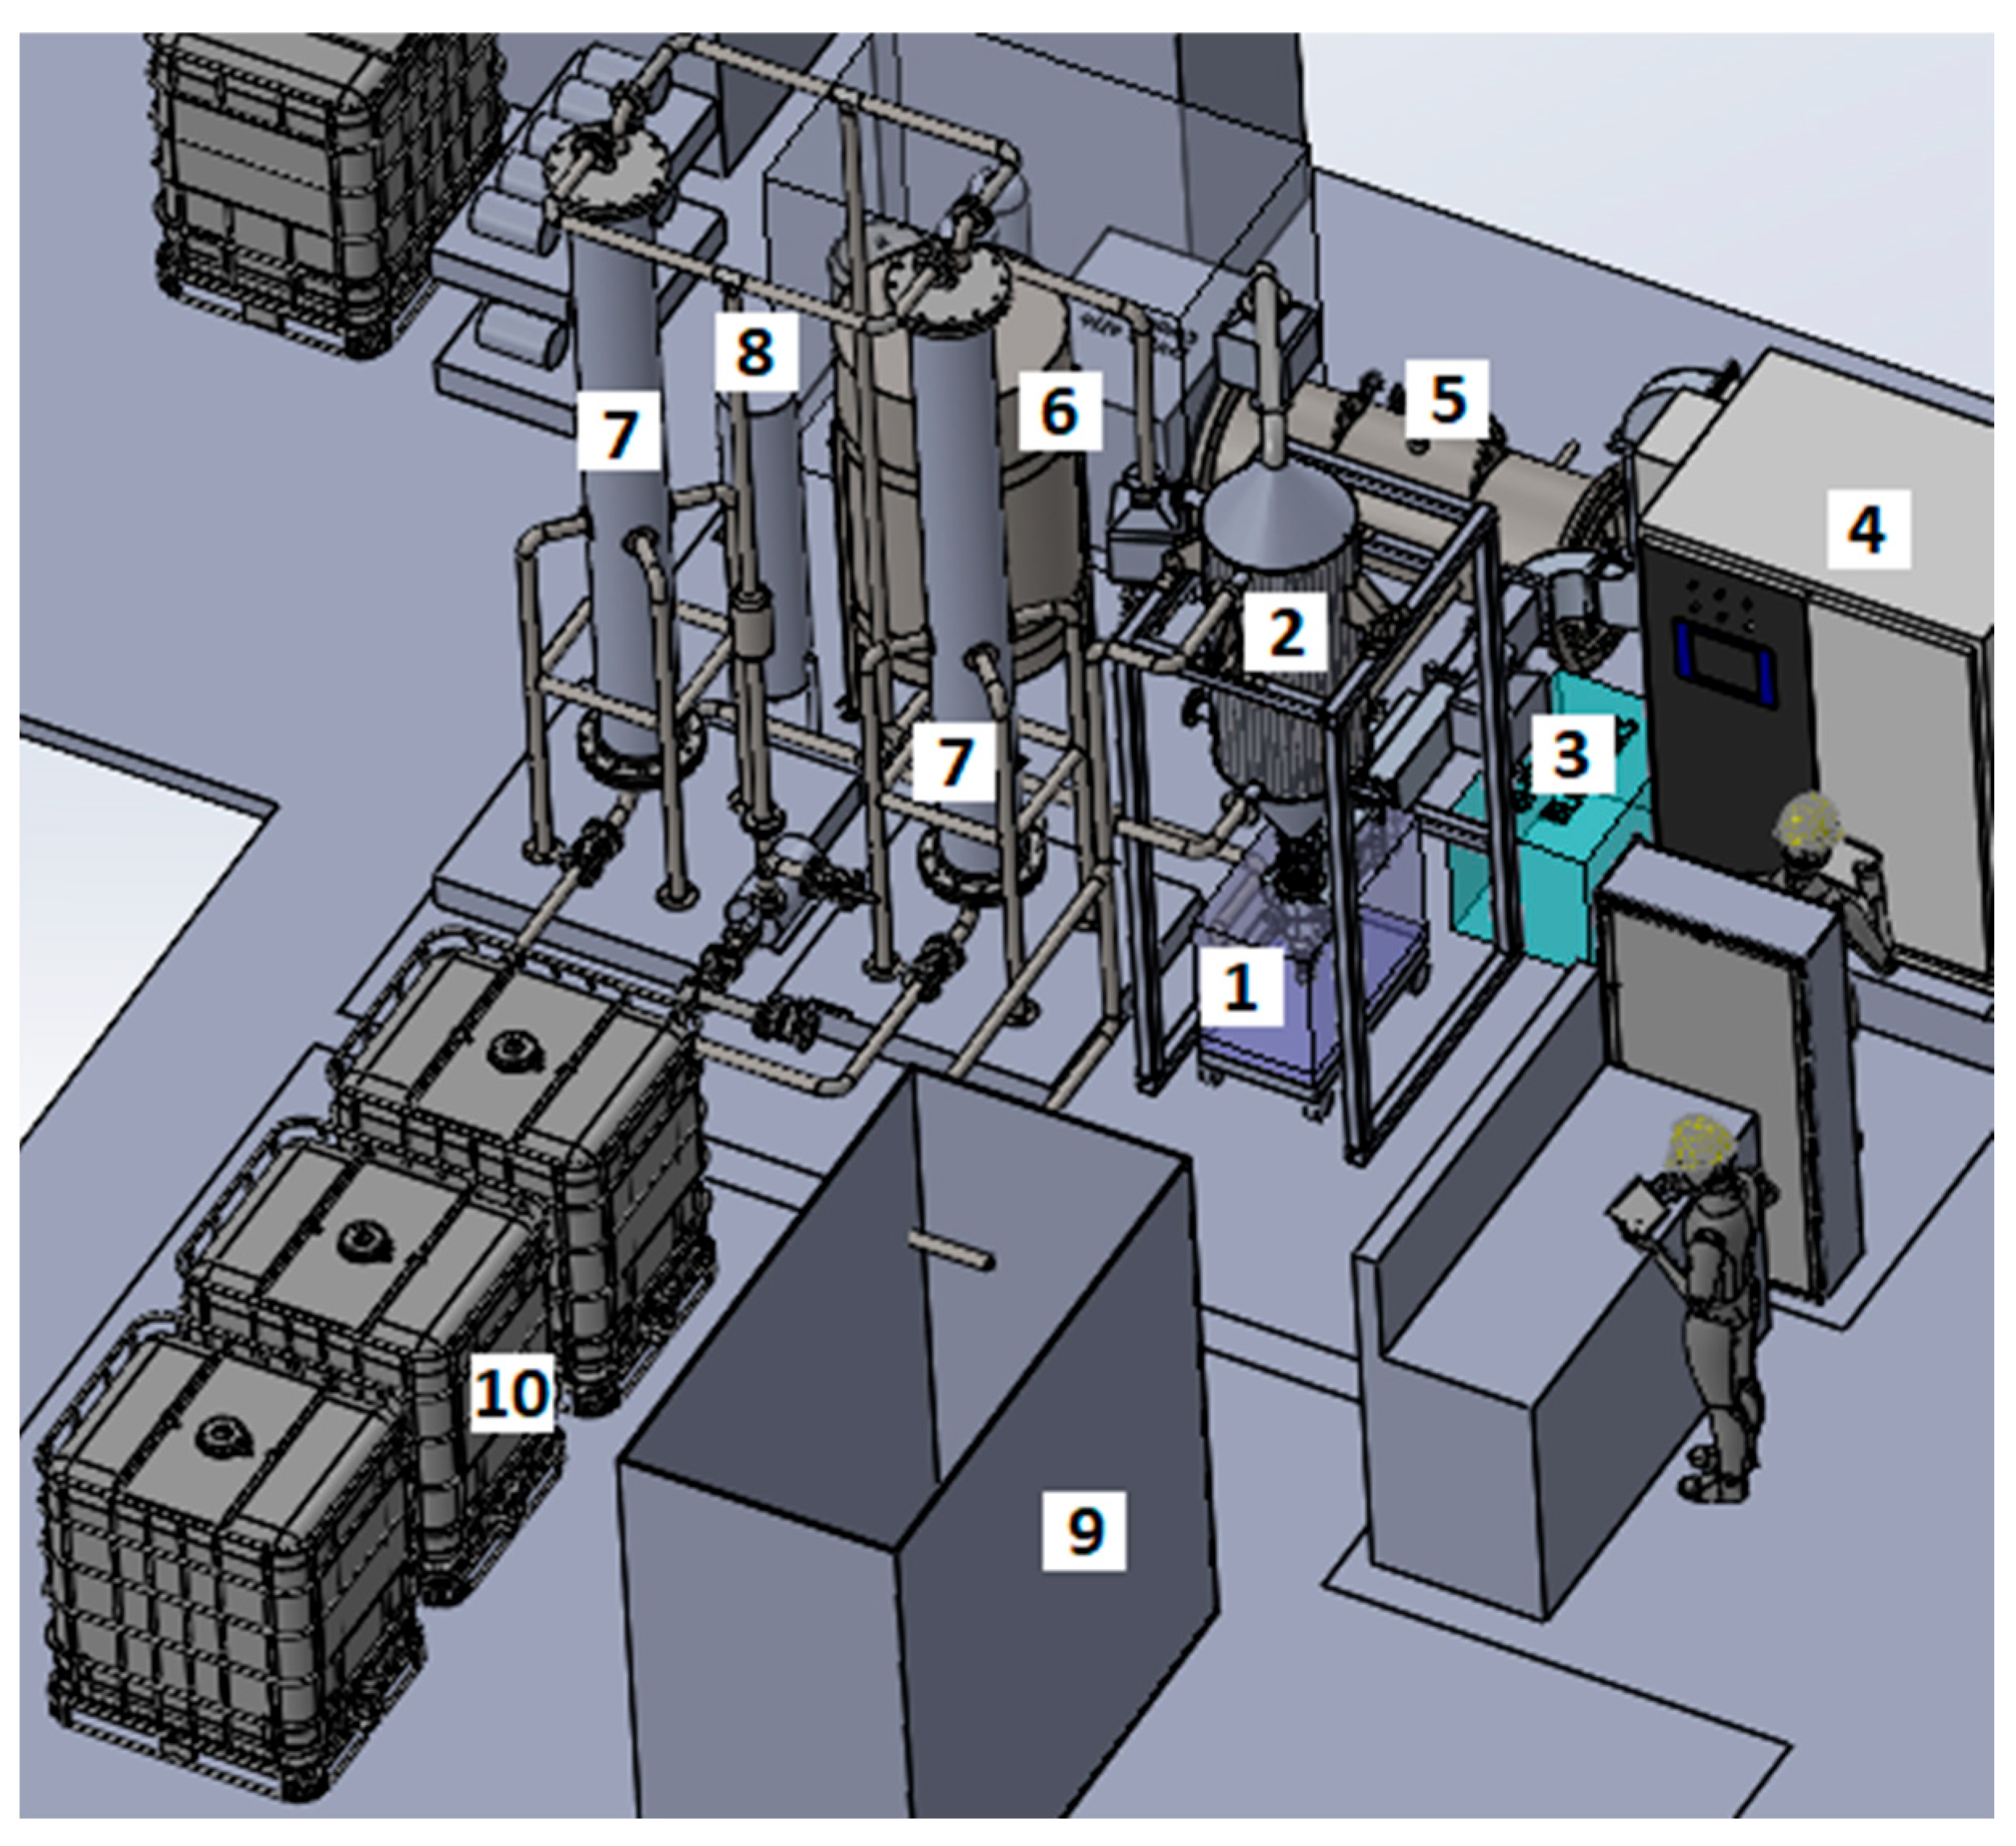
Figure 4 shows a 3D rendering of the plant, highlighting the key components. 
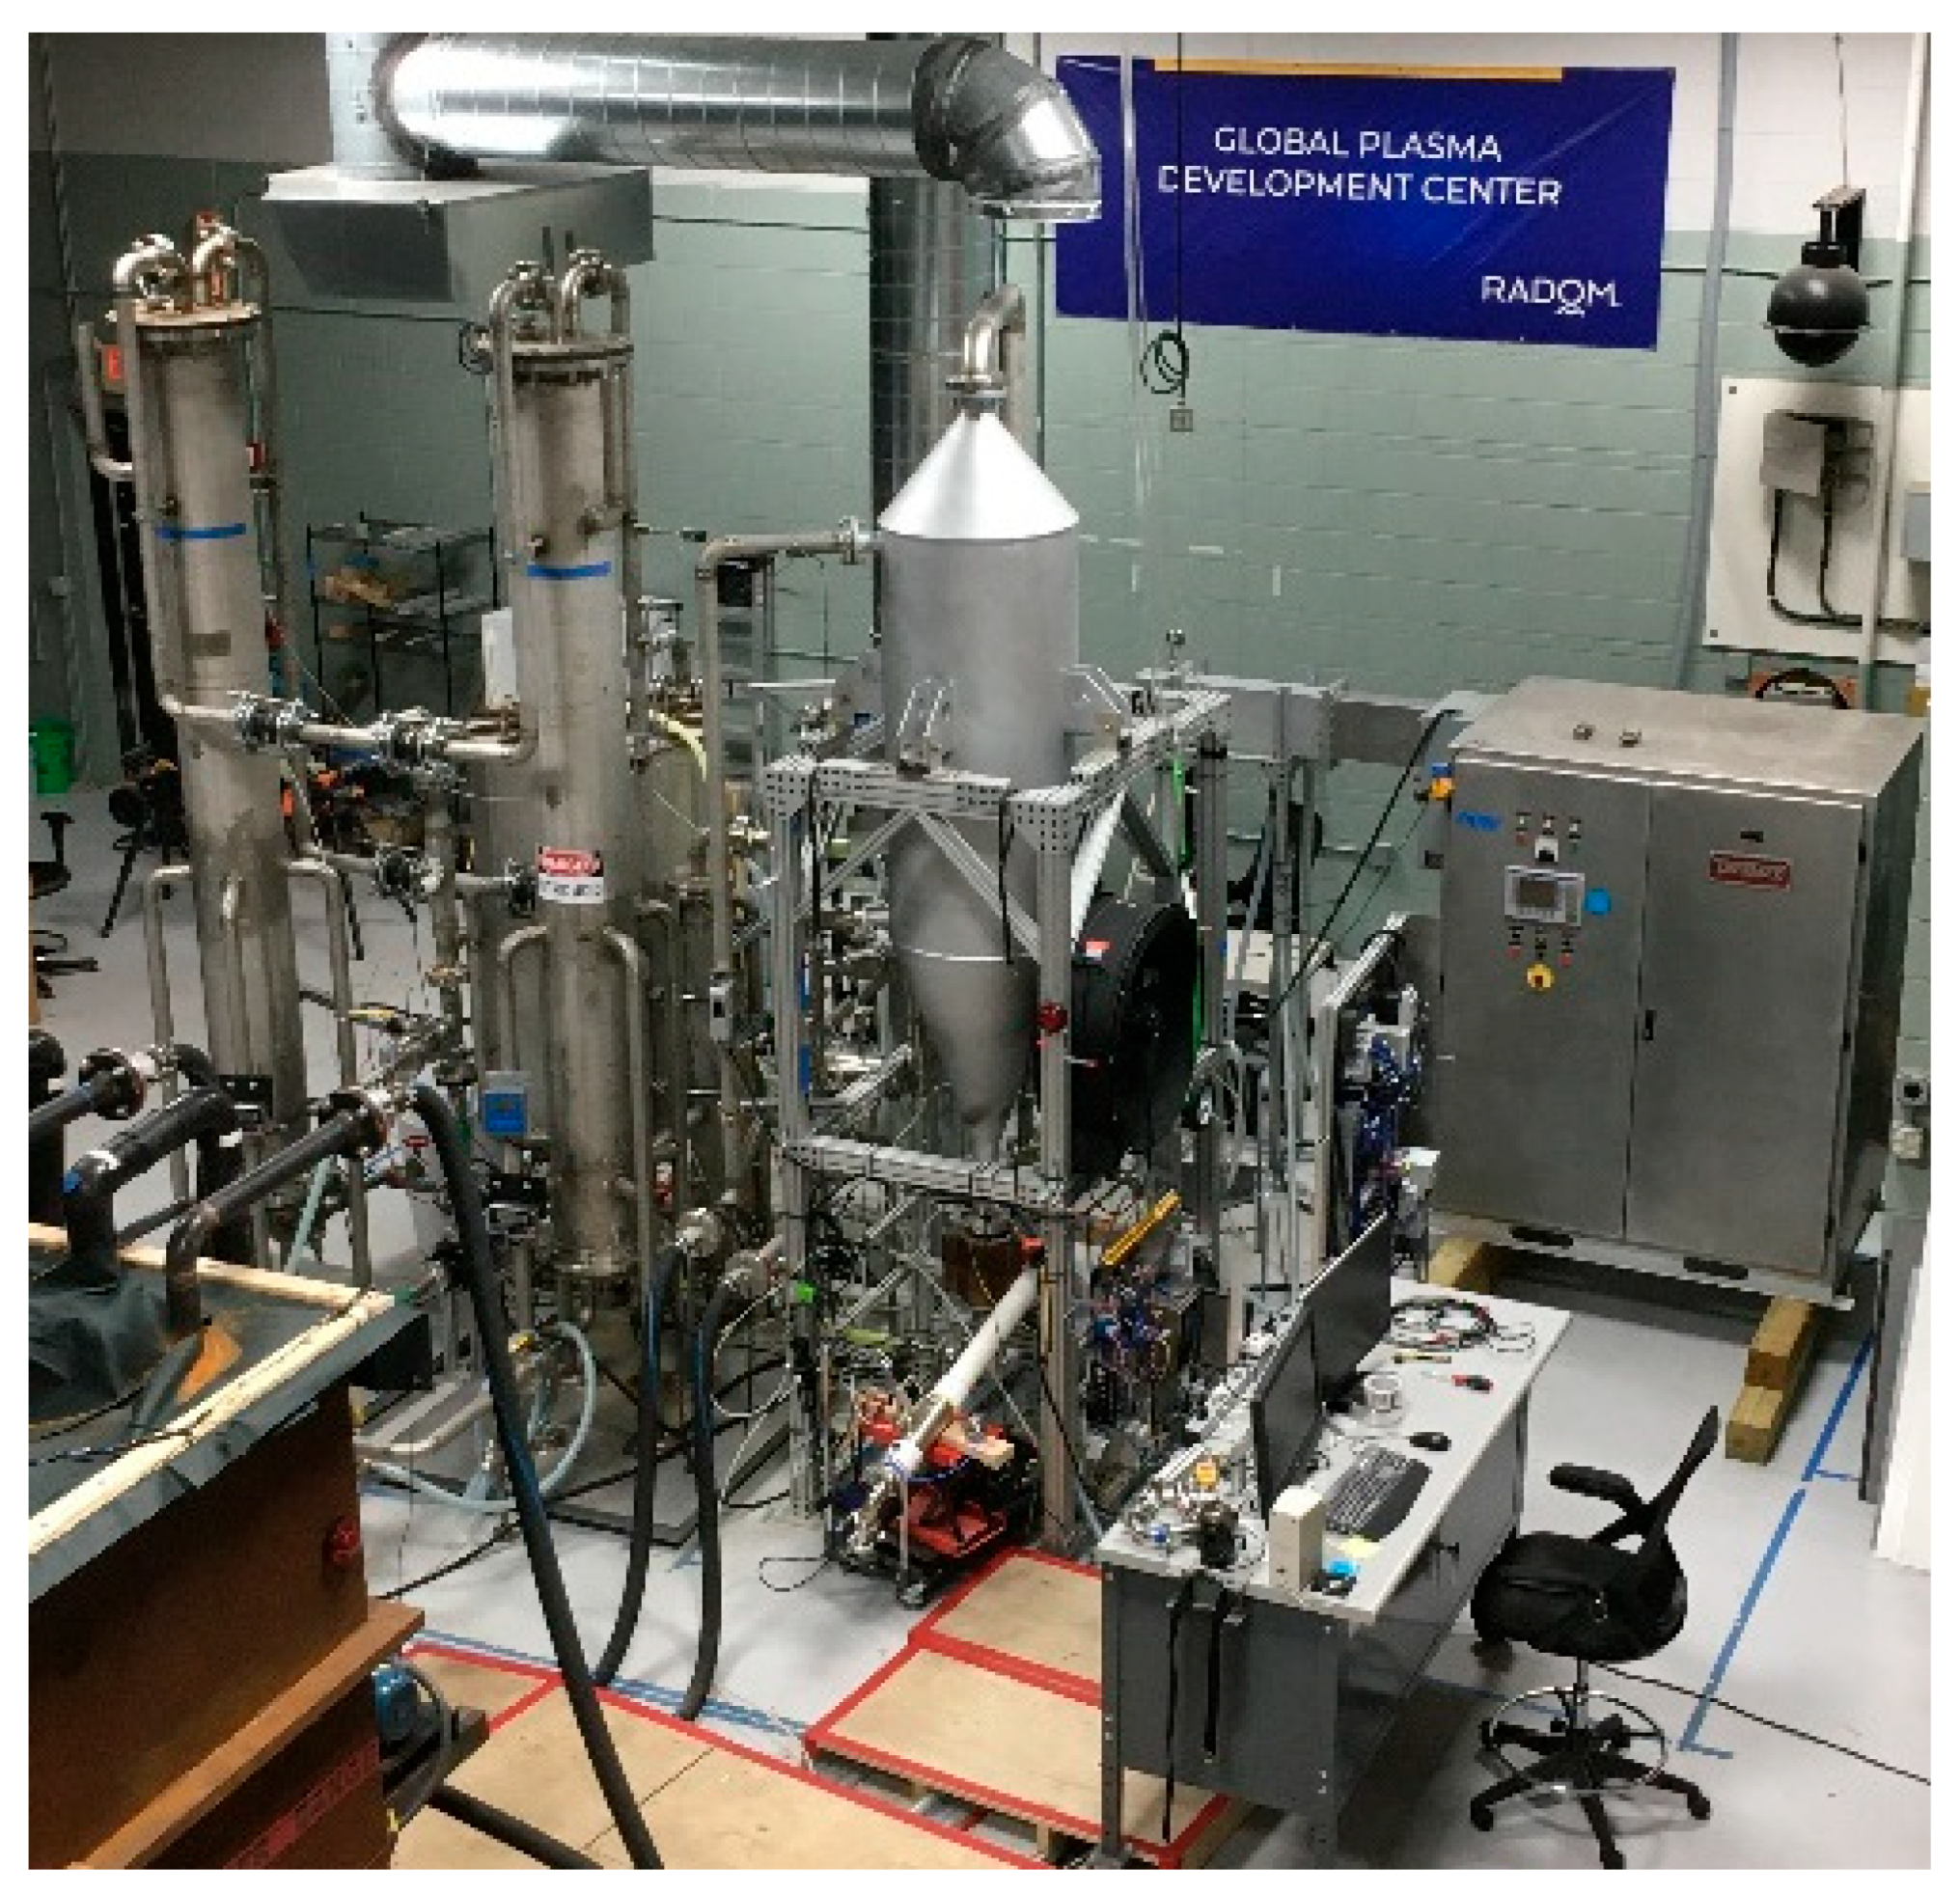
Figure 5 shows the constructed nitrogen fixation plant, in which one can see the absorption columns, oxidation chamber, primary heat exchanger, microwave generator, and plasma torch.
Figure 6 shows a block diagram of the closed-loop gas circuit of the nitrogen fixation plant. The loop gas is processed by the plasma torch, converting a fraction of molecular oxygen and molecular nitrogen into nitrogen monoxide (NO). NO is further oxidized in the oxidation chamber, becoming primarily nitrogen dioxide, before the process gas is introduced to water-filled bubble absorption columns to form concentrated nitric acid. A demister and a condenser are used to limit liquid accumulation anywhere in the system except in the absorption columns. The loop gas is then returned to the plasma torch after being regenerated with the appropriate quantities of N2 and O2 from an air compressor and an oxygen PSA unit.
Stainless-steel components and piping are used to ensure resistance to corrosive gases and liquids. Where necessary, PTFE and acid-resistant flexible tubing are employed as alternatives to stainless steel. The plasma torch heats the loop gas from ambient temperature to a bulk temperature of 1500–3000 °C, depending on the input power. The plasma torch head consists of a copper-plated aluminum body, a pair of Cerawave™ rings, PTFE ring holders, and three quartz tubes. During batch operation, plasma gas, at 1,300 slpm, passes between the auxiliary and inner gas tubes. Auxiliary gas, controlled by MFC at 40 slpm, flows interior to the auxiliary tube. For cooling purposes, air, which does not mix with the loop gas, passes between the inner and outer quartz tubes and between the Cerawave™ rings and the outer tube.
The closed-loop system is equipped with three heat exchangers. A primary heat exchanger, HEX #1, is directly mounted to the top of the plasma torch outlet and features a conical diffuser with a top diameter of approximately 60 cm. The surface of the diffuser cone is currently not part of the heat recovery system and is simply cooled by forced air; its temperature typically ranges from 300 to 450 °C. The primary heat exchanger operates at approximately 100 L of water per minute and recovers approximately 60% of the plasma energy to heat a 7500 L water tank to a temperature of 60 °C. The 7500 L tank is meant to simulate an ammonia stripper in an agricultural setting. A secondary heat exchanger immediately follows the primary heat exchanger to further reduce the loop gas temperature from approximately 100 °C to room temperature. This is necessary to protect the process gas blowers. A tertiary heat exchanger is used to cool the loop gas after compression to improve both the oxidation and absorption efficiencies in the oxidation chamber and absorption columns, respectively.
Two process gas blowers, which are controlled by variable-frequency drives, move gas around the closed-loop system. The plant can be operated in either quench or bypass mode, where Figure 6 shows quench mode. In bypass mode, the output of blower #2 is routed to HEX #3 instead of HEX #1, where it combines with the output from blower #1 before passing through the remainder of the closed loop. Additionally, in bypass mode, a portion of the process gas, after being replenished with air and O2, bypasses the plasma torch and is routed directly to HEX #1 to facilitate the quenching of the plasma gas. Quench mode is utilized primarily in this work because of the improved NOx absorption efficiency of the bubble columns associated with the greater loop gas residence time. Quench mode exhibits a greater loop gas residence time due to the lower loop gas flow rate because only one blower is forcing air around the closed loop, rather than two, as in bypass mode.
The oxidation chamber has a diameter and a height of 90 cm and 1.5 m, respectively, for a total volume of approximately one cubic meter. This implies a loop gas residence time of approximately 45 s for batch operation conditions. The gas pressure in the oxidation chamber is kept at 13.5 psig, enhancing the reaction rate of NO oxidation by approximately a factor of eight relative to ambient pressure. This reduces the necessary volume of the oxidation chamber by the same factor.
There are two bubble absorption columns connected in parallel. The choice of using two absorption columns was made to facilitate improved absorption efficiency given the gas flow requirements of the system set by the torch. The diameter and height of each column are 30 cm and 3 m, respectively. Each column contains 19 sintered stainless-steel gas diffusers, model SS6-7, from Oxidation Technologies. Approximately 100 L of water is added to each column prior to batch operation. Figure 7 shows the NO
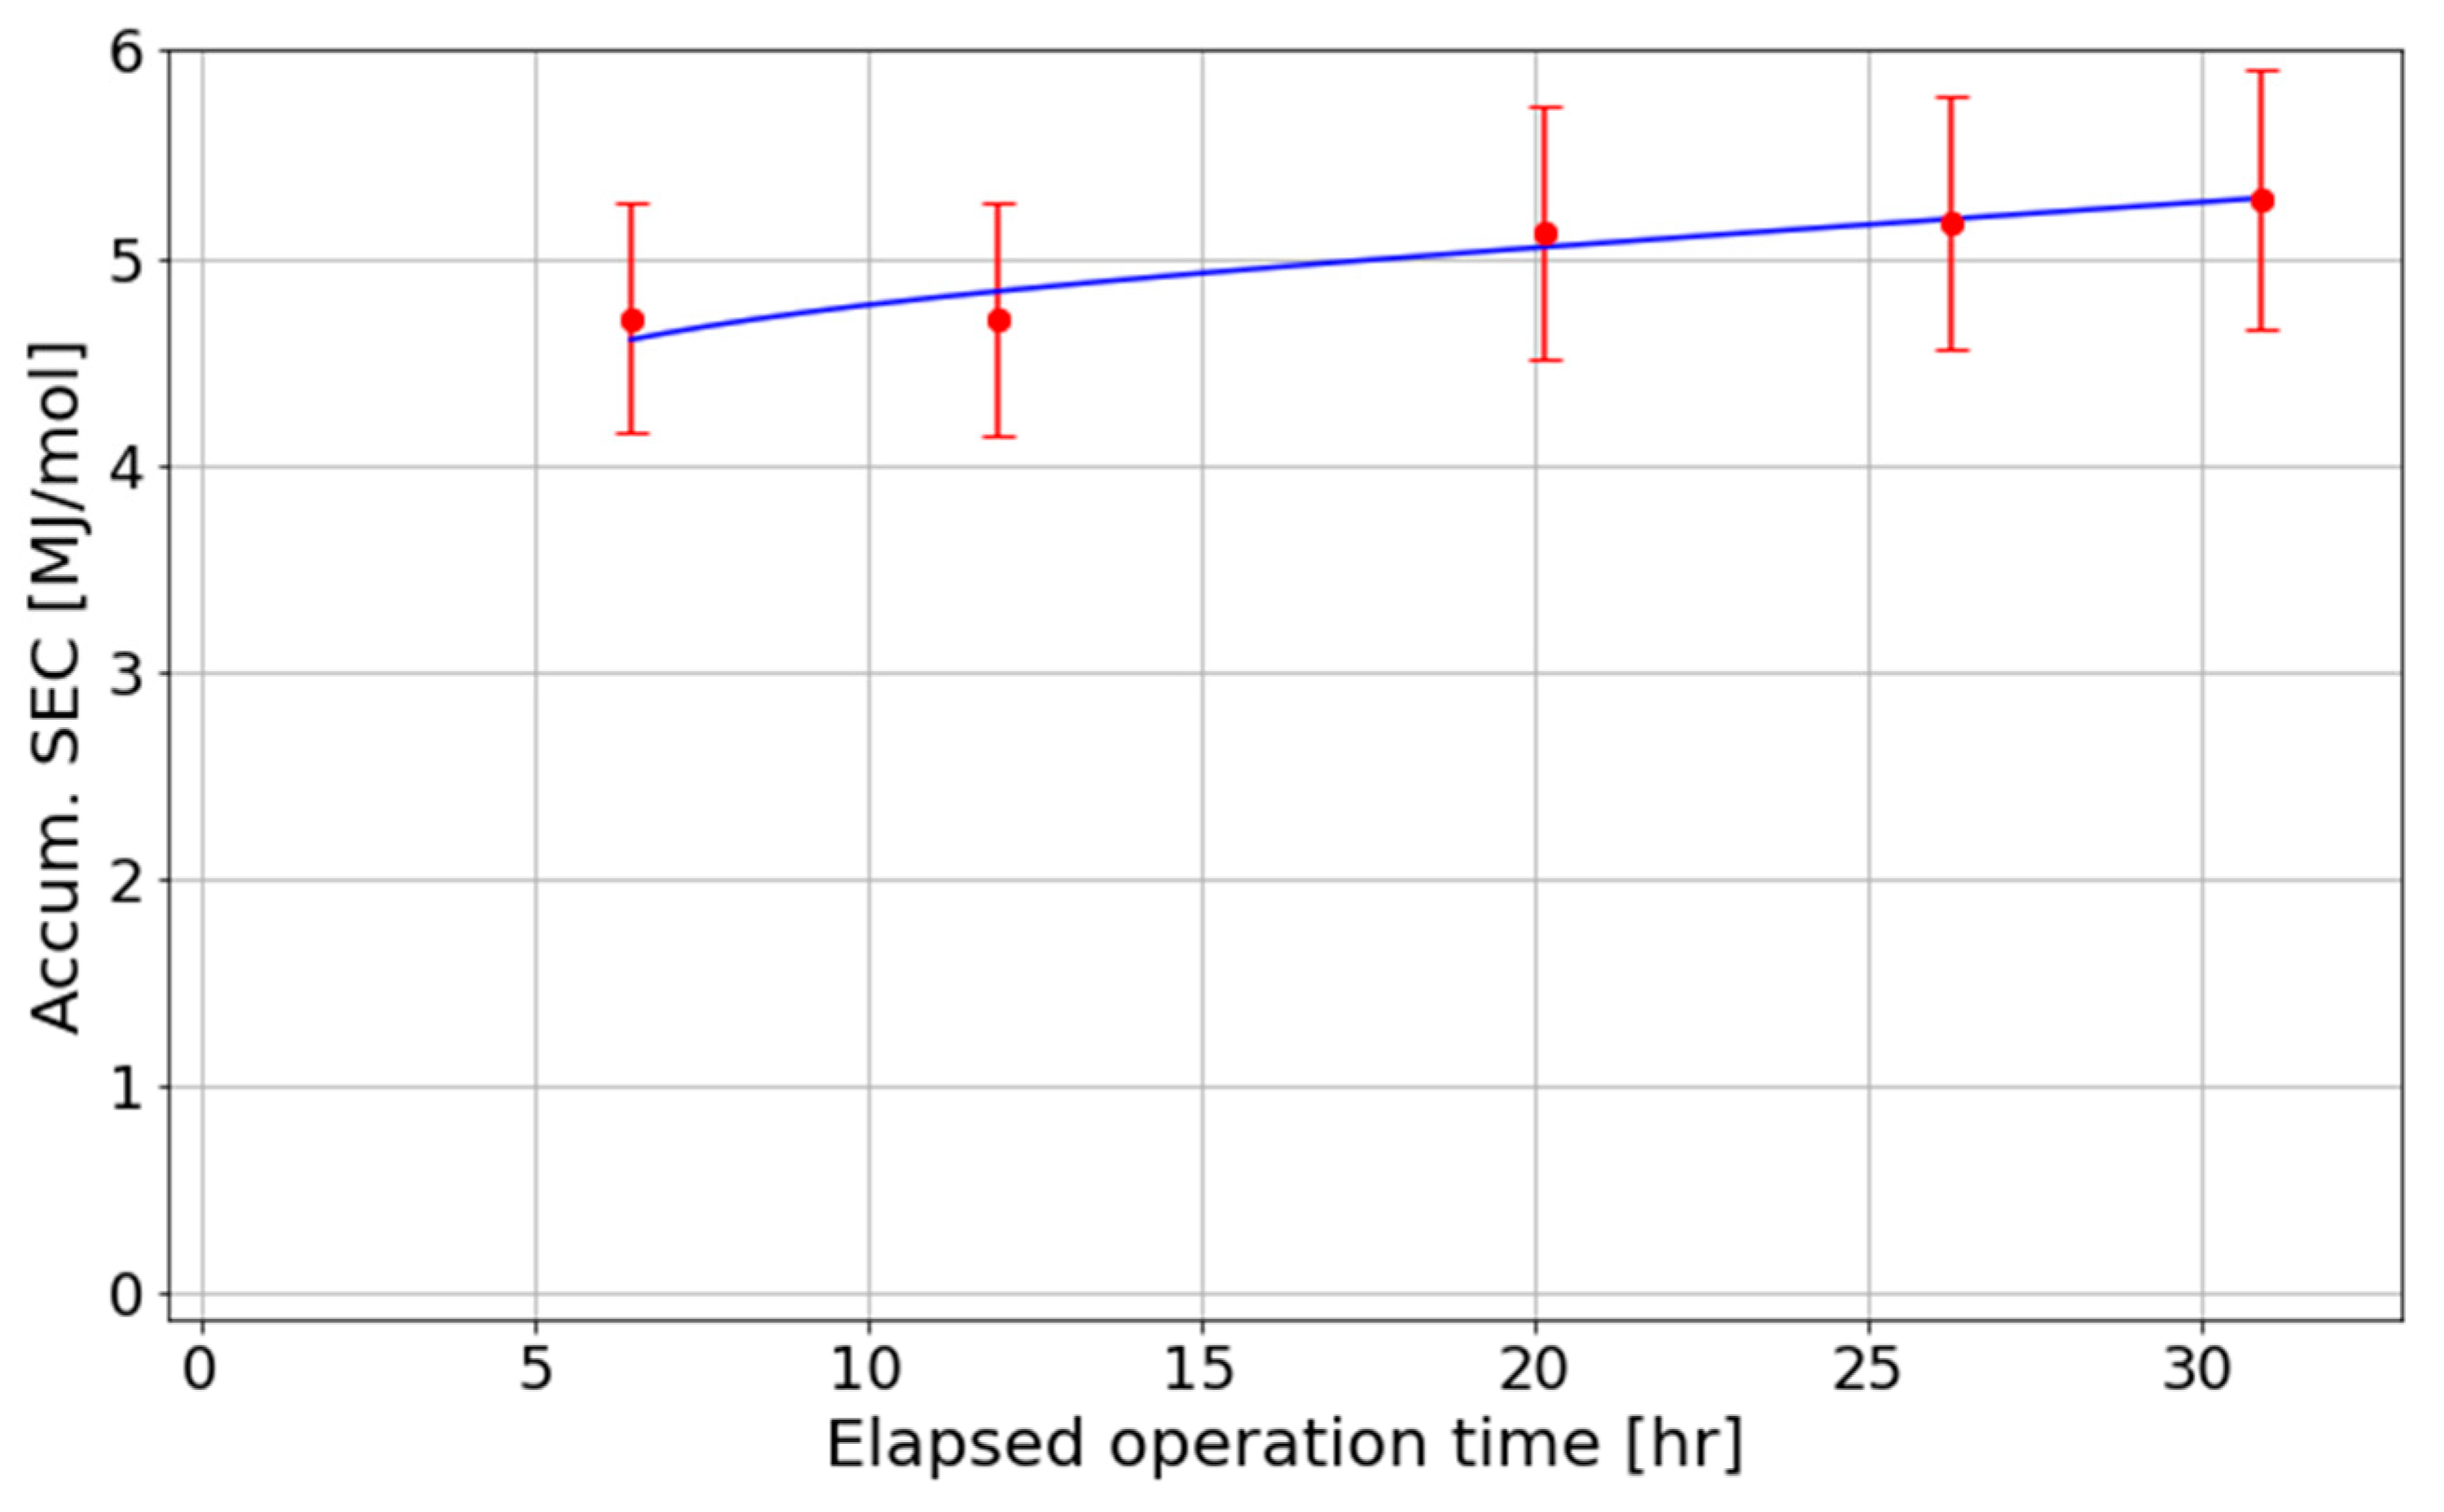
x concentration before and after the absorption columns, implying that the absorption efficiency of the columns employed in this work is only 65% near batch operation conditions, offering a significant opportunity for improvement. Note that the data presented in Figure 7 correspond to the absorption columns containing low-concentration nitric acid (<5%). As the concentration of nitric acid increases, the absorption efficiency decreases, as evidenced by the worsening accumulated SEC of the system presented in Section 3.
Water and acid are introduced, extracted, and recirculated through the absorption columns by an acid-resistant liquid pump to facilitate mixing and safe removal. Air is supplied to the system by an air compressor and routed to the PSA oxygen generator, the air resupply MFC, and the auxiliary gas MFC. Note that, since NOx does not pass through any of the MFCs in the system, gas calibration with respect to NOx is unnecessary. During the oxidation and absorption processes, NO is converted to NO2 before being absorbed by water to form HNO3, effectively removing a portion of N and O from the process gas. Therefore, it is necessary to resupply nitrogen and oxygen to the system to maintain steady-state conditions. To maintain an oxidation chamber pressure of 13.5 psig and an O2 concentration of 20%, the equilibrium air resupply rate is about 50 slpm (40 slpm for auxiliary flow and 10 slpm for the resupply MFC), and the equilibrium oxygen (95% O2, 5% Ar) resupply rate is approximately 18 slpm. An additional challenge within the closed-loop system is the accumulation of argon, an inert gas that remains unaffected by the chemical process and can accumulate to a concentration of 5% or more in the loop. Therefore, purging of the gas is necessary to prevent Ar from concentrating and to maintain system efficiency. The matter of Ar accumulation is addressed in this work by a small process gas leak near the process gas blowers, which is immediately diluted and removed via the exhaust system
Ideally, all liquid in the system remains in the absorption columns. However, droplets and acid vapor can travel throughout the system and condense, causing undesirable liquid accumulation outside the absorption columns. To prevent this, a demister and a condenser are installed directly after the absorption columns. An automated, pressure-based system is used to return liquid collected by the condenser back to the absorption columns after enough liquid is collected.
Given the chemical reactions taking place and the power involved, extensive safety measures are implemented to both mitigate risks and ensure safe operation of the system. The hazards include high-power radio-frequency (RF) emissions, corrosive gases, corrosive liquids, high temperatures, and high pressures. Regarding high-power RF, the plasma torch is equipped with electromagnetic radiation chokes that do not permit, as verified by electromagnetic emissions testing, radiation intensity outputs exceeding one milliwatt per square centimeter. Regarding corrosive gases, industrial-strength exhaust systems are installed above both gas blowers and both absorption columns to capture leaking gas and to refresh the air in the experiment hall. Two NOx gas sensors with sound and vibration alarms are installed on opposite ends of the plant to notify operators of significant gas leaks. Regarding corrosive liquids, appropriate PPE is worn during acid sample acquisition or any other activity that could lead to nitric acid exposure. Liquid and solid sodium bicarbonate are also readily available for acid neutralization. Lastly, communication between operators is facilitated via wireless headsets to minimize the potential for miscommunication in the noisy plant environment.

2.3. Instrumentation

Maintaining critical system parameters, such as oxygen concentration and pressure, at constant levels is essential for optimal performance. To achieve this, the pilot plant is equipped with an array of sensors, meters, gas analyzers, and feedback control loops. These instruments are designed to ensure the safe, reliable, and repeatable operation of the plant. Detailed information about the pressure, oxygen, temperature, NOx concentration, and other relevant measurements will be provided in the following subsection.
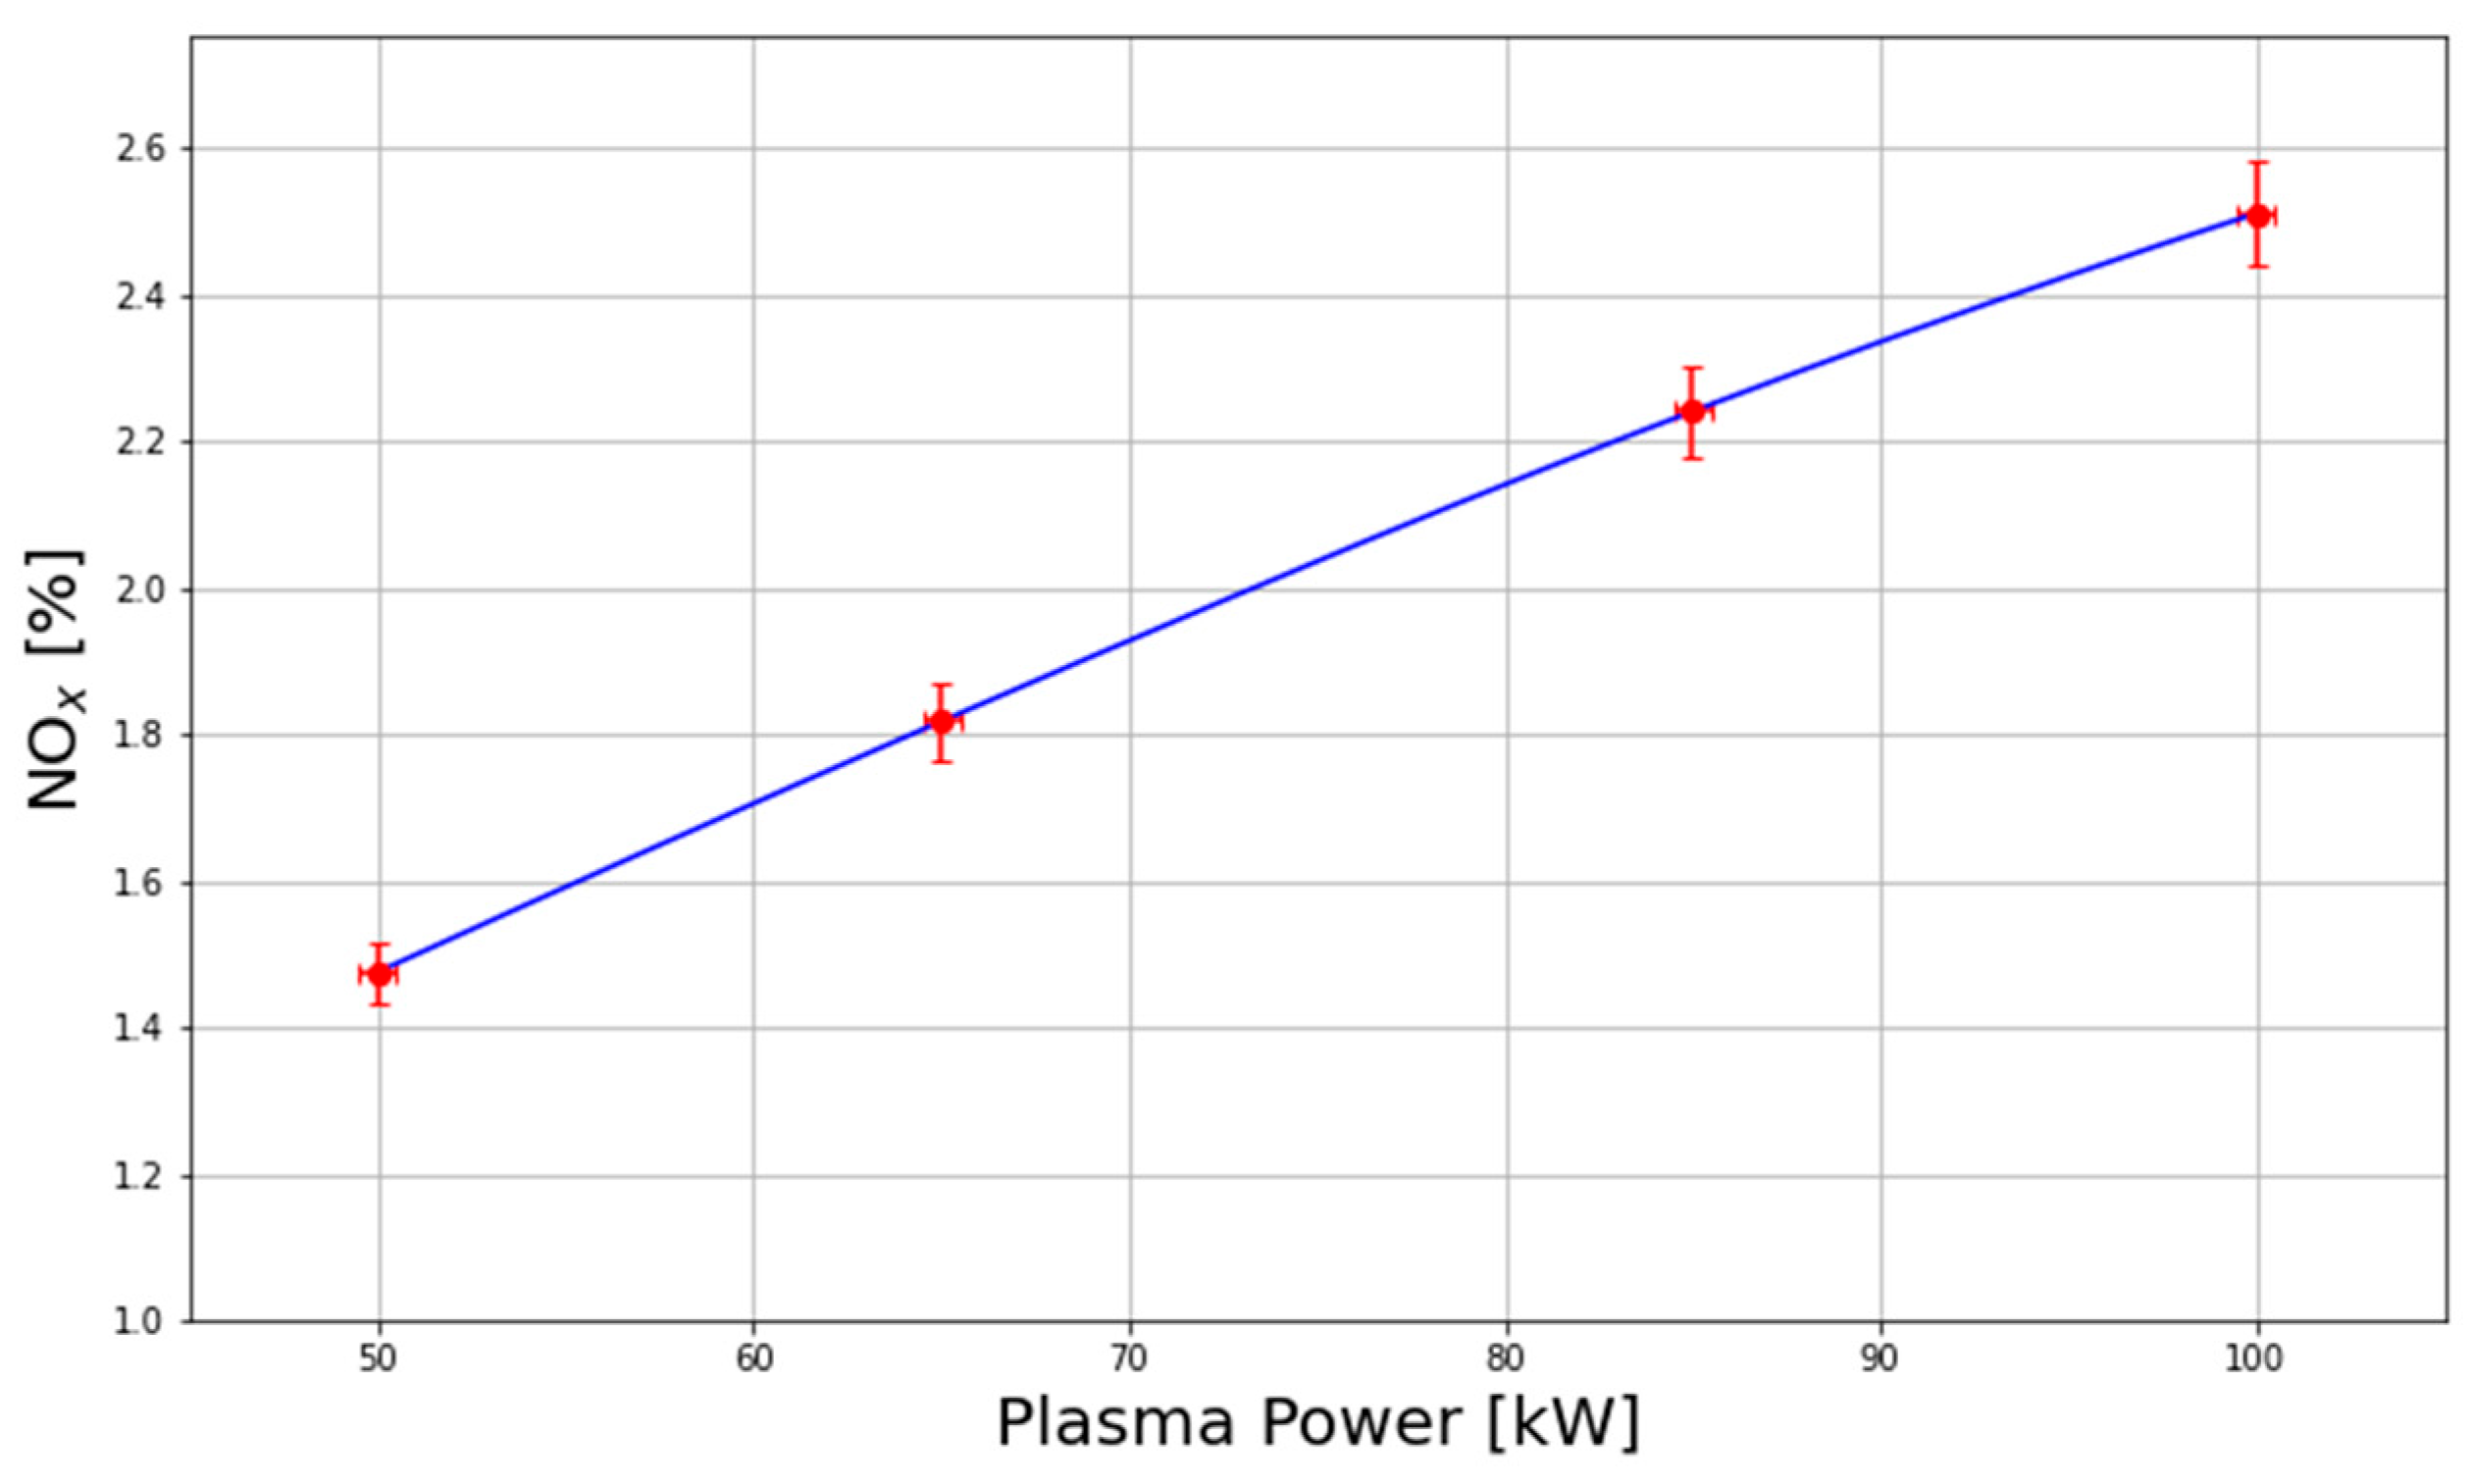
A Thermo Scientific 42iQHL pre-calibrated gas analyzer and an O2 analyzer from Hubei Cubic-Ruiyi Instrument Co., Ltd. were installed at the output of the oxidation chamber to determine the NO, NO2, and O2 gas concentrations. The gas sample was regulated via a needle valve and passed through a series of filtration stages, including water filter traps with charcoal and gravity traps, to protect the equipment from acid droplets and vapor. The NOx concentration was recorded in the internal database of the analyzer, while the O2 measurements from the oxygen analyzer were used as inputs for a proportional–integral–derivative (PID) control system. Due to the limited NOx measurement range (0–5000 ppm) of the gas analyzer, the sampling gas was diluted tenfold with nitrogen. The output gas from the analyzers was routed to the experimental hall exhaust, providing an extra purge for the system. The Thermo Scientific 42iQHL gas analyzer used in this work is used to quantify nitric oxide and nitrogen dioxide based on the principle of chemiluminescence. In this method, NO reacts with ozone to form electronically excited nitrogen dioxide, which subsequently decays to its ground state by emitting a photon in the ultraviolet–visible range. The intensity of the emitted radiation is directly proportional to the NO concentration in the sampled gas. This light is detected and amplified by a photomultiplier tube, which converts the optical signal into an electrical signal for quantitative analysis. Measurement of NO2 is performed indirectly by passing the sample gas through a heated molybdenum converter, where NO2 is reduced to NO. The resulting total NOx (i.e., NO and converted NO2) is then measured using the same chemiluminescence process. The concentration of NO2 is determined by subtracting the directly measured NO from the total NOx. The maximum NOx concentration achieved during plasma operation was approximately 3.0% using 100 kW of absorbed plasma power and low gas flow rates (< 900 slpm).
Gas flows through the absorption columns and torch were monitored using pre-calibrated ProSense FTS and Keyence MPF flow meters. The operational principle of these flow meters renders them insensitive to fluctuations in temperature and pressure. A liquid flow meter from Keyence was used to monitor the water circulation flow rate on the liquid side of the primary heat exchanger. An array of mass flow controllers, specifically the Sevenstar D07 models, was installed to regulate the resupply gas flow rates.
The pressure sensors utilized in the pilot plant were the ProSense EPS25-V145-1001 and the Keyence MP-F models. Pressure drops across various components in the system were continually monitored during steady-state operation, with the primary contributors to the pressure drop being the absorption columns (approximately 5 psi from the liquid height and gas diffusers combined at full flow) and the plasma torch (approximately 7 psi of pressure drop at full flow). Type K thermocouples were employed to monitor the temperatures of various torch components and provided real-time feedback to the PLC system for the activation of interlocks if the gas temperatures exceeded the safety thresholds. The absorption columns were welded to two load cells to measure changes in weight due to increased acid concentrations. As the concentration of the nitric acid increases, the density of the solution correspondingly increases, providing an additional way to monitor the progress of nitric acid production.
The concentration of nitric oxides was continuously monitored during plasma operation, as outlined previously. The efficiency of the absorption columns was also ascertained by sampling the process gas both upstream and downstream of the absorption columns, as shown in Figure 7. Additionally, after extended periods of plant operation, the concentration of nitric acid was determined through titrimetric analysis to determine the rate of acid accumulation. Titrimetric analysis was performed in triplicate for each sample using either 0.1 M NaOH or 2 M NaOH as the titrant, depending on the stage of plasma operation; specifically, 0.1 M NaOH was employed for samples collected at the beginning of the plasma process, while 2 M NaOH was used for samples obtained at later stages, where higher acid concentrations were expected. The concentration of HNO3 in each sample was determined by averaging the results of the three titrations. The resulting data are presented in Section 3. Prior to sampling, the liquid within the absorption columns was thoroughly homogenized by operating the liquid pump connected to the absorption columns and evacuating a substantial volume of liquid to ensure that the sample represented a pure, homogeneous liquid. The performance of the pilot plant was subsequently evaluated by means of two independent measurements: one based on the decrease in the NOx concentration across the absorption column at a given gas flow rate and the other from the results of titrimetric tests. The efficiency of oxidation of NO could also be ascertained by observing the relative contributions of NO and NO2 to the overall NOx post-oxidation chamber. The findings from these gas composition analyses are detailed in the Results section.

2.4. Process Modeling

This section presents numerical models that were developed for the dynamical analysis of the plasma-based nitric acid production process operating in a closed-loop configuration. The analysis yields time-dependent concentrations of individual gas species, models pressure drops across loop components, and provides an estimate of the absorption efficiency for bubble columns. The model was found to be useful in plant design and in programming automated process controls, allowing for a knowledge-driven approach to optimizing the performance of the nitrogen fixation system.
A simplified mass balance model of the closed-loop system was developed, as shown in Figure 8. NO is generated in the plasma torch from N2 and O2. The gas exiting the torch is compressed by a blower and directed to an oxidation chamber, where it is assumed that all NO is converted to NO2 via oxidation with O2. Subsequently, the gas flows into an absorption column, where NO2 is absorbed with specified absorption efficiency. To prevent the accumulation of argon in the loop from the PSA resupply gas, a portion of the loop gas is purged following the absorption column. Compressed air and oxygen are then resupplied to the process gas, which is returned to the torch.
The model considers five gas components: NO, NO2, N2, O2, and Ar. A steady-state condition is determined using mass balance equations. To describe the dynamic behavior of the process, both the pressure drop and equipment volume must be included. The oxidation chamber and absorption column, due to their significant volumes, contribute significantly to the dynamic capacitance of the system. Their sizes are incorporated into the dynamic model. Valves are included in the model between all components, except between the torch and oxidation chamber, to account for pressure variations. The pressure differential between the torch and oxidation chamber is managed by a compressor, whose flow rate–pressure relationship is determined experimentally. The equations for the mass balance and pressure drop of each unit are formulated as follows.
Valve:
N ˙ i , i n = N ˙ i , o u t
P i n P o u t = f N ˙ i , i n
Compressor:
N ˙ i , i n = N ˙ i , o u t
P o u t = K · P i n R · N ˙ i , i n
Torch:
N ˙ N O , o u t = x N O · N ˙ i , i n
N ˙ N O 2 , o u t = 0
N ˙ N 2 , o u t = N ˙ N 2 , i n + 0.5 N ˙ N O 2 , i n 0.5 N ˙ N O , o u t N ˙ N O , i n
N ˙ O 2 , o u t = N ˙ O 2 , i n + N ˙ N O 2 , i n 0.5 N ˙ N O , o u t N ˙ N O , i n
N ˙ A r , o u t = N ˙ A r , i n
P o u t = P i n .
Oxidation chamber:
d P N O , o x d t = R T N ˙ N O , o u t V o x
d P N O 2 , o x d t = R T N ˙ N O , i n N ˙ N O 2 , o u t V o x
d P N 2 , o x d t = R T N ˙ N 2 , i n N ˙ N 2 , o u t V o x
d P O 2 , o x d t = R T N ˙ O 2 , i n N ˙ O 2 , o u t 0.5 N ˙ N O , i n V o x
d P A r , o x d t = R T N ˙ A r , i n N ˙ A r , o u t V o x
P o u t = P i n
P o u t N ˙ i , o u t N ˙ i , o u t = P i , o x .
Absorption column:
d P N O , a b d t = R T 0.5 η N ˙ N O 2 , i n N ˙ N O , o u t V a b
d P N O 2 , a b d t = R T N ˙ N O 2 , i n 1.5 η N ˙ N O 2 , i n N ˙ N O 2 , o u t V a b
d P N 2 , a b d t = R T N ˙ N 2 , i n N ˙ N 2 , o u t V a b
d P O 2 , a b d t = R T N ˙ O 2 , i n N ˙ O 2 , o u t V a b
d P A r , a b d t = R T N ˙ A r , i n N ˙ A r , o u t V a b
P o u t = P i n
P o u t N ˙ i , o u t N ˙ i , o u t = P i , o x
Purge:
N ˙ N O , o u t = 1 p N ˙ N O , i n
N ˙ N O 2 , o u t = 1 p N ˙ N O 2 , i n
N ˙ N 2 , o u t = 1 p N ˙ N 2 , i n
N ˙ O 2 , o u t = 1 p N ˙ O 2 , i n
N ˙ A r , o u t = 1 p N ˙ A r , i n
P o u t = P i n .
Resupply:
N ˙ N O , o u t = N ˙ N O , i n
N ˙ N O 2 , o u t = N ˙ N O 2 , i n
N ˙ N 2 , o u t = N ˙ N 2 , i n + x N 2 , a i r N ˙ A i r + x N 2 , P S A N ˙ P S A
N ˙ O 2 , o u t = N ˙ O 2 , i n + x O 2 , a i r N ˙ A i r + x O 2 , P S A N ˙ P S A
N ˙ A r , o u t = N ˙ A r , i n + x A r , a i r N ˙ A i r + x A r , P S A N ˙ P S A
P o u t = P i n ,
where N ˙ i,in and N ˙ i,out are the molar flow rates of component i at the inlet and outlet of each unit, respectively. Pin and Pout are the pressures at the inlet and outlet of each unit, respectively. f is the friction coefficient used to calculate the pressure drop from the molar flow rate for the valves. K1 and K2 are coefficients used to calculate the pressure drop of the compressor. xNO is the mole fraction of NO in the torch outlet gas. η is the absorption efficiency. p is the purge fraction. xi,air and xi,PSA are the mole fractions of component i in the resupply air and the PSA gas, respectively. Pi,ox and Pi,ab are the partial pressures of component i in the oxidation chamber and the absorption column, respectively. Vox and Vab are the volumes of the oxidation chamber and the absorption column, respectively.
To ensure the smooth operation of the nitrogen fixation process, it is essential to maintain both the pressure and oxygen concentration within the oxidation chamber. Figure 8 illustrates the fundamental control structure for this system (dashed lines). The pressure is regulated by adjusting the flow rate of compressed air, whereas the oxygen concentration is controlled by modulating the flow rate of oxygen produced by the PSA system. Two PID controllers are employed to manage these controls.
The absorption efficiency serves as an input for the closed-loop model and can be predicted using a separate model specifically for the absorption column. The absorption of NOx in the bubble columns is a crucial step in converting gaseous NOx, generated by plasma, into a liquid product of nitric acid at the desired concentration. To achieve a more comprehensive understanding of NOx absorption within a bubble column, we have developed a dedicated model to elucidate this process.
The absorption of NOx in a bubble column is a complex process that encompasses multiphase fluid flow, mass transfer, and chemical reactions. The model considers several components, including nitric oxide, nitrogen dioxide (NO2), dinitrogen trioxide (N2O3), dinitrogen tetroxide (N2O4), nitrous acid (HNO2), nitric acid (HNO3), oxygen (O2), and water (H2O). If ozone is present in the gas phase, it can react with NO2 to form nitrogen trioxide radical (NO3) and O2. The NO3 radical can subsequently react with additional NO2 to produce dinitrogen pentoxide (N2O5) [28]. However, due to the negligible concentration of ozone under the current conditions, the formation of both NO3 and N2O5 is insignificant. Therefore, these species are not included in the present model.
The gas phase is governed by a set of complex equilibria, described by Equations (37)–(40). During the absorption process, NO2, N2O4, and N2O3 are absorbed into the aqueous phase (Equations (41)–(43)), where they react with water to form HNO2 and HNO3 (Equations (44)–(46)). The generated HNO2 subsequently decomposes in the liquid phase, releasing NO (Equation (47)), which then desorbs back into the gas phase (Equation (48)). The desorbed NO can react with O2 to regenerate NO2 (Equation (49)); however, this is a relatively slow reaction. The resulting change in the NO2 concentration can shift the equilibrium of other gas-phase components.
2NO2(g) ⇌ N2O4(g)
NO(g) + NO2(g) ⇌ N2O3(g)
NO(g) + NO2(g) + H2O(g) ⇌ 2HNO2(g)
3NO2(g) + H2O(g) ⇌ 2HNO3(g) + NO(g)
NO2(g) ⇌ NO2(l)
N2O4(g) ⇌ N2O4(l)
N2O3(g) ⇌ N2O3(l)
2NO2(l) + H2O(l) ⇌ HNO3(l) + HNO2(l)
N2O4(l) + H2O(l) ⇌ HNO3(l) + HNO2(l)
N2O3(l) + H2O(l) ⇌ 2HNO2(l)
3HNO2(l)⇌ HNO3(l) + 2NO(l) + H2O(l)
NO(l) ⇌ NO(g)
2NO2(g) + O2(g) ⇌ NO2(g)
The model is based on the following assumptions:
  • The gas phase exhibits plug flow behavior;
  • The liquid holdup is uniform throughout the column, leading to a consistent effective interfacial area and uniform mass transfer coefficients across the column;
  • The gases follow ideal gas behavior;
  • There are no radial concentration gradients in the gas phase;
  • There are no concentration gradients in the liquid phase in either the radial or axial directions;
  • The column operates under steady-state conditions;
  • The process is maintained under isothermal conditions.
The governing equations that describe the mass balance for the gases bubbling through the liquid in the bubble column are expressed as follows.
Divalent nitrogen balance:
d Y N O * d h = S G k 1 p N O 2 p O 2 ε G R T R a N O , G + R a N 2 O 3 , G + 1 2 R a H N O 2 , G 1 2 R a H N O 3 , G
Reactive nitrogen balance:
d Y N * d h = S G R a N O , G + R a N O 2 , G + 2 R a N 2 O 4 , G + 2 R a N 2 O 3 , G + R a H N O 2 , G + R a H N O 3 , G
Water vapor balance:
d Y H 2 O * d h = S G R a H 2 O , G + R a H N O 3 , G + R a H N O 2 , G
Oxygen balance:
d Y O 2 d h = 1 2 S G k 1 p N O 2 p O 2 ε G R T ,
where YNO*, YN*, YH2O*, and YO2 represent the concentrations (in kmol per kmol of inert) of divalent nitrogen species, reactive nitrogen species, water (including oxyacids and free water vapor), and oxygen, respectively. h denotes the height from the bottom of the bubble column, and S is the column’s cross-sectional area. G represents the inert gas flow rate, R is the universal gas constant, and T is the temperature. k1 is the reaction rate constant for the oxidation of NO, while pNO and pO2 are the partial pressures of NO and O2, respectively. εG denotes the gas holdup. The terms RaNO,G, RaNO2,G, RaN2O3,G, RaN2O4,G, RaHNO2,G, RaHNO3,G, and RaH2O,G represent the gas-phase mass transfer rates of NO, NO2, N2O3, N2O4, HNO2, HNO3, and H2O, respectively. These equations are coupled linear differential equations. By solving them simultaneously, the absorption efficiency is determined based on the calculated outlet NOx concentration and the predetermined inlet NOx concentration. The method for the calculation of each term within the governing equations is comprehensively outlined in Suchak et al. [29]. Additionally, the volumetric mass transfer coefficients for both gas and liquid phases in a bubble column are detailed in Liu et al. [30].

3. Results

3.1. Process Optimization

In preparation for the first extended batch run, experiments were conducted in which the steady-state conditions of the system were changed to observe the effect on the overall nitric oxide production. The key parameters that varied were the plasma power, plasma gas flow rate, and oxygen concentration.
The impact of the plasma power was investigated by varying the power while keeping other parameters as constant as practicable. Four levels of plasma power were tested: 50, 65, 85, and 100 kW. The oxygen concentration was maintained at approximately 20%, and the oxidation chamber pressure was approximately 13.5 psig. The plasma gas flow rate varied slightly between 1270 and 1350 slpm. The resulting NOx concentration is shown in Figure 9. Both the NOx concentration and the SEC were found to increase with increasing plasma power at a fixed plasma gas flow rate.
We expect that a decreasing gas flow rate at a constant power level should have a similar effect because the NOx concentration is determined by the specific power input to the gas. This is confirmed by the experimental results shown in Figure 10.
One of the advantages of a closed-loop system is the ability to vary both the composition and pressure of the gas inside the process loop with relatively small flow rates of resupply air and oxygen. Different oxygen concentrations in the loop gas were tested while maintaining the plasma power at 50 kW. The measured NOx concentrations at 15%, 25%, and 30% oxygen fractions were 1.44%, 1.55%, and 1.61%, respectively. These results indicate that the oxygen concentration has a minor influence on the NOx levels; when the oxygen concentration was doubled from 15% to 30%, the NOx concentration increased by 12%. Although in general agreement with similar results reported in the literature, it should be noted that this change in the NOx concentration is comparable with the uncertainty in the gas analyzer measurements and therefore would require further investigation for confirmation.

3.2. Batch Run

The goal of completing a batch run was to demonstrate the feasibility of operating the nitrogen fixation pilot plant for an extended duration by producing 198.9 L of nitric acid at a concentration of 28.6% by weight starting from fresh water. This was accomplished by operating the plant for 30.9 h (or roughly 40% of the working hours) during the testing period.
During operation, the steady-state gas pressure in the oxidation chamber and the steady-state oxygen concentration were 13.5 psig and 20%, respectively. Several acid samples were collected and titrated during the batch run. Figure 11 shows the average molarity over a set of three titrations of each acid sample.
The concentration of nitric acid increases approximately linearly until a molar concentration of 2.4 M is achieved, upon which the rate of increase begins to decrease. This is consistent with the understanding that NO2 absorption in water is less efficient in the presence of nitric acid. Figure 12 shows the specific energy consumption determined from the acid titration measurements. The decrease in the rate of increase in the acid concentration versus the elapsed time shown in Figure 11 corresponds to an analogous rise in the cumulative specific energy consumption in Figure 12. Overall, the batch run was successful in demonstrating the feasibility of plasma-based nitric acid production at a reasonable scale and efficiency. Additionally, the SEC of NOx production alone in the Cerawave™ torch is approximately 3.5 MJ/mol, a figure that is comparable to those presented in the literature [16,17,18,19,20,21].

4. Discussion

Here, we summarize the results of the batch run and the modeling and optimization of the process. In batch operation at 50 kW plasma power, 66.5 kg of nitric acid (100% basis) was produced over the course of 30.9 operating hours of the nitrogen fixation plant, using 1545 kWh (5562 MJ) of energy. The overall specific energy consumption (SEC) of the batch, as determined by acid titration, was approximately 5.3 MJ/mol when considering only the electrical power delivered to the plasma. In lieu of titration, the change in the NOx concentration across the absorption column was also used to provide an independent estimate of the SEC. From the loop gas flow rate of 1300 slpm and the NOx concentrations both before and after the absorption columns from Figure 7, the SEC is approximately 5.93 MJ/mol, which is within 12% of the SEC obtained by titration. Given the uncertainty in various measurements—titration, the gas flow rate, and the NOx concentration—this difference can be considered reasonable.
The SEC worsened (increased) both at greater power levels (for a constant plasma gas flow rate) and at lower plasma gas flow rates (for constant plasma power). The absorption efficiency of the absorption columns was 65%, indicating a potential avenue for significant improvement for the system. Approximately 60% of the input power was recovered via a primary heat exchanger to maintain a 7500 L water tank at 60 °C, simulating a digestate ammonia stripper. Increasing the steady-state oxygen content in the loop gas from 15% to 30% yielded an improvement in NO production of 12%. No argon poisoning was observed after more than six hours of steady-state operation. Given the closed-loop nature of the pilot plant, no treatment of exhausted nitric oxide gas was necessary aside from the natural dilution that occurred due to the large exhaust volumetric flow rate of the facility and the small amount of purge gas. Finally, no detectable amount (<1 ppm) of nitrous oxide (N2O) is created or exhausted by the plant, as determined by direct gas measurement using a Thermo Scientific model 46i-HL nitrous oxide analyzer.
Significant modeling was also completed in this work toward the goal of advancing the understanding of two processes in the system: (i) NO2 uptake in the absorption columns and (ii) the time-dependent concentrations of each gas species across each system component. The primary results of the modeling work are as follows. The absorption column model predicts that the absorption efficiency decreases from 66% to 57% as the weight percentage of nitric acid increases from 0% to 28.6%, a result consistent with experimental findings. The average absorption efficiency determined from modeling was 63%, while the observed efficiency in the batch test was 65%, representing strong agreement between the simulation and experiment. Incorporating the total gas flow rate, the resupply air flow rate, and the PSA gas flow rate as inputs, along with other relevant parameters, such as the torch efficiency and absorption efficiency, the mass balance model can accurately predict the gas flow rate, composition, and pressure at each unit within the system and assist in programming the PID control logic that maintains steady-state system conditions during batch operation.
An improvement of up to 30% in the specific energy consumption, to 3.7 MJ/mol, can be expected if the bubble columns of low absorption efficiency (65%) utilized in this work are replaced with a high-absorption-efficiency packed-bed column (90%). As the optimization experiments have demonstrated, further improvements in efficiency should be possible by maximizing the gas flow rate at a set plasma power level, which was limited in our experiments by the capacity of the blowers. In addition, the heat recovery, currently at 60% of plasma power, can be further increased by recovering heat from the surface of the conical diffuser between the torch and the primary heat exchanger. If one assumes 25% conversion efficiency of the heat recovered by HEX #1 to usable electricity, then the potentially achievable SEC of 3.7 MJ/mol (by improving the absorption columns) could be further improved to 3.15 MJ/mol.

5. Conclusions

This work demonstrated the first successful batch operation of a large-scale pilot plant for nitric acid production from air, water, and electricity using a Cerawave™ microwave plasma torch. The plant operates at up to 100 kW of plasma power and features closed-loop gas processing, enabling the independent control of the pressure and gas composition with minimal gas losses—key attributes of a sustainable, scalable plasma-assisted nitrogen fixation system. The results presented here help to fill at least two scientific and engineering gaps in the literature: the scaling up of plasma-assisted NO generation and absorption technology to industrially relevant throughputs and the characterization of the 100 kW Cerawave™ microwave plasma torch as a high-throughput oxidizer for air-based nitrogen fixation.
This pilot system was designed and experimentally validated as a potential zero-carbon and modularizable alternative to conventional nitric acid production, which emits substantial CO2 and N2O and requires large distribution networks. To support this goal, we developed and applied a dynamic mass balance model for the closed-loop gas system, allowing for the determination of time-dependent gas concentrations across process components. Optimization experiments also informed key strategies for improvements in system efficiency, including the tuning of the flow rate, O2 concentration, and operating pressure. Together, these modeling and experimental advances provide a framework for the optimization of the operation of plasma-based nitrogen fixation systems.
The pilot system achieved 198.9 L of 28.6%, by weight, nitric acid in 30.9 h of operation at 50 kW, representing one of the highest reported throughputs for plasma-based nitric acid systems, while maintaining an overall specific energy consumption of 5.3 MJ/mol [21]. Regarding future increases in scale to meet the large industrial and agricultural demands for nitric acid, it should be pointed out that although single microwave plasma torch units are limited to 100 kW due to the power limits of industrial magnetrons, combining the gas input and outputs of multiple torches in parallel with a single closed-loop chemical plant of the type described in this paper could offer a 10- to 100-fold increase in scale at a reduced per-unit cost. Figure 1 shows a concept of a 1MW plasma nitric acid plant utilizing a containerized battery of ten 100 kW microwave generators connected to a battery of ten containerized Cerawave™ torches, whose plasma gas output is processed by a single closed-loop chemical plant. The entire installation is estimated to occupy an area of 15 m by 15 m, with almost 20% of the area occupied by the ten 100 kW microwave generators. In conclusion, this work establishes the scientific and experimental feasibility and scalability of high-power microwave-plasma-based nitrogen fixation systems, providing a potential avenue toward industrial implementation.

6. Patents

This work resulted in the following patent application, submitted on 10 September 2024: McKinney, I.; Barthel, C.; Grushnikova, E.; Rao, Q.; Ushiroda, K.; Koller, J.; Mantych, N.; Pikelja, V.; Menon, A.; Jevtic, J.; High-Yield Atmospheric Nitric Acid Generator for Agricultural Waste Treatment 2024, US Patent Application No. 18/830,067.

Author Contributions

Conceptualization, I.M., Q.R., E.G., K.U. and J.J.; data curation, I.M., Q.R., E.G. and J.J.; formal analysis, I.M., Q.R., E.G. and J.J.; funding acquisition, S.D. and J.J.; investigation, I.M., Q.R., E.G., K.U. and J.J.; methodology, I.M., Q.R., E.G., K.U. and J.J.; project administration, J.J.; resources, T.K., S.D. and J.J.; software, I.M., Q.R., E.G. and J.J.; supervision, J.J.; validation, I.M., Q.R., E.G., K.U. and J.J.; visualization, I.M., Q.R. and E.G.; writing—original draft, I.M., Q.R. and E.G.; writing—review and editing, I.M., Q.R., E.G., K.U., T.K., S.D. and J.J. All authors have read and agreed to the published version of the manuscript.

Funding

This research was financially supported by the Radom Corporation and DVO, Inc.

Data Availability Statement

The data can be made available by contacting the corresponding author.

Acknowledgments

The authors would like to thank Cory Barthel, John Koller, Josh Reed, and Luka Zekanovic for their contributions in the engineering design and construction of the nitrogen fixation plant discussed here.

Conflicts of Interest

I.J. McKinney, Q. Rao, E. Grushnikova, K. Ushiroda, and J.O. Jevtic are employed by the Radom Corporation. T.K. and S.D. are employed by DVO, Inc. These affiliations are disclosed to maintain transparency.

Abbreviations

The following abbreviations are used in this manuscript:
SECSpecific energy consumption
ADAnaerobic digester
slpmStandard liters per minute
NONitric oxide
DBDDielectric barrier discharge
DCDirect current
ACAlternating current
PSAPressure swing adsorption
MFCMass flow controller
RFRadio frequency
PIDProportional–integral–derivative
NOxNitrogen oxide

References

  1. Smith, C.; Hill, A.K.; and Torrente-Murciano, L. Current and Future Role of Haber-Bosch Ammonia in a Carbon-free Energy Landscape. Energy Environ. Sci. 2019, 13, 331–344. [Google Scholar] [CrossRef]
  2. Grande, C.A.; Andreassen, K.A.; Cavka, J.H.; Waller, D.; Lorentsen, O.-A.; Øien, H.; Zander, H.-J.; Poulston, S.; García, S.; Modeshia, D. Process Intensification in Nitric Acid Plants by Catalytic Oxidation of Nitric Oxide. Ind. Eng. Chem. Res. 2018, 57, 10180–10186. [Google Scholar] [CrossRef]
  3. Goodwin, C.M.; Lömker, P.; Degerman, D.; Davies, B.; Shipilin, M.; Garcia-Martinez, F.; Koroidov, S.; Mathiesen, J.K.; Rameshan, R.; Rodrigues, G.L.S.; et al. Operando Probing of the Surface Chemistry during the Haber-Bosch Process. Nature 2024, 625, 282–286. [Google Scholar] [CrossRef]
  4. Humphreys, J.; Lan, R.; Tao, S. Development and Recent Progress on Ammonia Synthesis Catalysts for Haber-Bosch. Process. Adv. Energy Sustain. Res. 2020, 2, 2000043. [Google Scholar] [CrossRef]
  5. Serrano, R.; Grindlay, G.; Gras, L.; Mora, J. Microwave-sustained Inductively Coupled Atmospheric-pressure Plasma (MICAP) for elemental analysis of complex matrix samples. Talanta 2024, 271, 125666. [Google Scholar] [CrossRef]
  6. Schwartz, A.J.; Cheung, Y.; Jevtic, J.; Pikelja, V.; Menon, A.; Ray, S.J.; Hieftje, G.M. New Inductively Coupled Plasma for Atomic Spectrometry: The Microwave-sustained, Inductively Coupled, Atmospheric-pressure Plasma (MICAP). J. Anal. At. Spectrom. 2016, 31, 440–449. [Google Scholar] [CrossRef]
  7. Wiltsche, H.; Wolfgang, M. Merits of Microwave Plasmas for Optical Emission Spectrometry—Characterization of an Axially Viewed Microwave-sustained, Inductively Coupled, Atmospheric-pressure Plasma (MICAP). J. Anal. At. Spectrom. 2020, 35, 2369–2377. [Google Scholar] [CrossRef]
  8. Kogelschatz, U. Dielectric-barrier Discharges: Their History, Discharge Physics, and Industrial Applications. Plasma Chem. Plasma Process. 2003, 23, 1–46. [Google Scholar] [CrossRef]
  9. Eliasson, B.; Kogelschatz, U. Nonequilibrium Volume Plasma Chemical Processing. IEEE Trans. Plasma Sci. 1991, 19, 1063–1077. [Google Scholar] [CrossRef]
  10. Fridman, A.; Nester, S.; Kennedy, L.A.; Saveliev, A.; Mutaf-Yardimci, O. Gliding Arc Gas Discharge. Prog. Energy Combust. Sci. 1999, 25, 212–231. [Google Scholar] [CrossRef]
  11. Sabo, M.; Musset, O.; Sorensen, S. Plasma Chemical Generation of Nitric Oxide (NO). Plasma Chem. Plasma Process. 1997, 17, 1–14. [Google Scholar]
  12. Yin, S.; Nishiki, Y.; Nakajima, T.; Mizuno, T. Nitric Oxide Synthesis using a Pulsed Plasma Process at Atmospheric Pressure. Energy 2000, 25, 1215–1221. [Google Scholar]
  13. Birkeland, K.R. On the Oxidation of Atmospheric Nitrogen in Electric Arcs. Trans. Faraday Soc. 1906, 2, 98–116. [Google Scholar] [CrossRef]
  14. Eyde, H.S. The manufacture of Nitrates from the Atmosphere by the Electric Arc—Birkeland-Eyde Process. J. R. Soc. Arts 1909, 57, 568–576. [Google Scholar]
  15. Patil, B.; Wang, Q.; Hessel, V.; Lang, J. Plasma N2-fixation: 1900–2014. Catal. Today 2015, 256, 49–66. [Google Scholar] [CrossRef]
  16. Pei, X.; Gidon, D.; Yang, Y.-J.; Xiong, Z.; Graves, D.B. Reducing Energy Cost of NOx Production in Air Plasmas. Chem. Eng. J. 2019, 362, 217–228. [Google Scholar] [CrossRef]
  17. Li, J.; Yao, S.; Wu, Z. NOx Production in Plasma Reactors by Pulsed Spark Discharges. J. Phys. D Appl. Phys. 2020, 53, 385201. [Google Scholar] [CrossRef]
  18. Ma, H.; Sharma, R.K.; Welzel, S.; van de Sande, M.C.M.; Tsampas, M.N.; Schneider, W.F. Observation and Rationalization of Nitrogen Oxidation Enabled Only by Coupled Plasma and Catalyst. Nat. Commun. 2022, 13, 402. [Google Scholar] [CrossRef] [PubMed]
  19. Matveev, I.B.; Serbin, S.I.; Zinchenko, A.E. A High-Concentration NOx Production System—Part 2: Optimization of the Nitrogen Oxides Yield. IEEE Trans. Plasma Sci. 2022, 50, 1635–1639. [Google Scholar] [CrossRef]
  20. Tsonev, I.; O’Modhrain, C.; Bogaerts, A.; Gorbanev, Y. Nitrogen Fixation by an Arc Plasma at Elevated Pressure to Increase the Energy Efficiency and Production Rate of NOx. ACS Sustain. Chem. Eng. 2023, 11, 1888–1897. [Google Scholar] [CrossRef]
  21. Kelly, S.; Bogaerts, A. Nitrogen Fixation in an Electrode-free Microwave Plasma. Joule 2021, 5, 3006–3030. [Google Scholar] [CrossRef]
  22. Varatharajan, K.; Cheralathan, M. Influence of fuel properties and composition on NOx emissions from biodiesel powered diesel engines: A review. Renew. Sustain. Energy Rev. 2012, 16, 3702–3710. [Google Scholar] [CrossRef]
  23. Lorimor, J.; Powers, W. Manure Characteristics—Manure Management Systems Series, MWPS-18 Section 1, 2nd ed.; MidWest Plan Service, Iowa State University: Ames, IA, USA, 2004; pp. 50011–53080. [Google Scholar]
  24. Yenigün, O.; Demirel, B. Ammonia Inhibition in Anaerobic Digestion: A Review. Process Biochem. 2013, 48, 901–911. [Google Scholar] [CrossRef]
  25. Zhao, Q.; Dvorak, S.W.; Chen, S.; Frear, C.; VanLoo, B.J. Nutrient Recovery Systems and Methods. U.S. Patent 10,556,804 B2, 11 February 2020. [Google Scholar]
  26. Jee, J.G.; Kim, M.B.; Lee, C.H. Pressure Swing Adsorption Processes to Purify Oxygen Using a Carbon Molecular Sieve. Chem. Eng. Sci. 2005, 3, 869–882. [Google Scholar] [CrossRef]
  27. McKinney, I.; Barthel, C.; Grushnikova, E.; Rao, Q.; Ushiroda, K.; Koller, J.; Mantych, N.; Pikelja, V.; Menon, A.; Jevtic, J. High-Yield Atmospheric Nitric Acid Generator for Agricultural Waste Treatment. U.S. Patent 18/830,067, 10 September 2024. [Google Scholar]
  28. Cox, R.A.; Coker, G.B. Kinetics of the reaction of nitrogen dioxide with ozone. J. Atmos. Chem. 1983, 1, 53–63. [Google Scholar] [CrossRef]
  29. Suchak, N.J.; Jethani, K.R.; Joshi, J.B. Modeling and Simulation of NOx Absorption in Pilot-scale Packed Columns. AIChE J. 1991, 37, 323–339. [Google Scholar] [CrossRef]
  30. Liu, D.; Li, W.; Cheng, Q.; Jin, J.; Chen, J. Measurement and Modeling of Nitrogen Oxides Absorption in a Pressurized Reactor Relevant to CO2 Compression and Purification Process. Int. J. Greenh. Gas Control 2020, 100, 103117. [Google Scholar] [CrossRef]
Figure 1. A rendering of a 1 MW nitrogen fixation plant concept. The economy of scale is favorable since only a single oxidation chamber and set of absorption columns are necessary. Ten plasma torches are needed since industrial continuous-wave magnetrons are limited to 100 kW in power. In the upper-right portion of the figure are ten 100 kW microwave generators (blue) connected to ten plasma torches (green) and their associated heat exchangers (tan). The absorption column (coral), oxidation chamber (gray), acid storage tanks (teal), cooling gas blowers (gold), liquid pumps (pink), oxygen generators (gray), and other equipment are shown in the bottom-left portion of the figure.
Nitrogen 06 00051 g001
Figure 2. A diagram of the 100 kW plasma torch used in the nitrogen fixation pilot plant. The Cerawave™ rings and plasma are shown in yellow and red, respectively. The microwave source, tuning stubs, PTFE spacers, cooling gas inlets and outlets, plasma gas inlet and outlet, and quartz tubes are labeled. The auxiliary gas quartz tube is not shown.
Nitrogen 06 00051 g002
Figure 3. An image of the 100 kW Cerawave™ plasma torch used in this work. A cross-section of the torch is shown in Figure 2.
Nitrogen 06 00051 g003
Figure 4. A 3D rendering of the nitrogen fixation plant, with labels highlighting the locations of the plasma torch (1), primary heat exchanger (2), microwave autotuner (3), microwave generator (4), loop gas blowers (5), oxidation chamber (6), absorption columns (7), PSA oxygen generator (8), 7500 L digestate simulation tank (9), and acid storage and neutralization tanks (10).
Nitrogen 06 00051 g004
Figure 5. The nitrogen fixation plant, as constructed. The key components of the plant are identified in Figure 4.
Nitrogen 06 00051 g005
Figure 6. A block diagram of the nitrogen fixation plant. Three non-electrical inputs are shown: water (blue), argon (green), and compressed air (purple). Two outputs are shown: NOx and O2 measurements (orange) via gas analyzers. The products of the plant are nitric acid, extracted from the absorption columns, and heat, extracted from HEX #1.
Nitrogen 06 00051 g006
Figure 7. Measured concentration of NOx in the loop gas before and after the bubble absorption columns. The corresponding absorption efficiency is only about 65%, an aspect of the system that offers significant space for improvement.
Nitrogen 06 00051 g007
Figure 8. A schematic of the mass balance model.
Nitrogen 06 00051 g008
Figure 9. Measured NOx concentration as a function of plasma power. Error bars represent one standard deviation for the NOx concentration measurements and +/−0.5 kW uncertainty in plasma power. Measurements are shown as red circles, and a quadratic line of best fit is shown as a blue line. The doubling of the power does not lead to the doubling of the NOx concentration, an indication that the overall efficiency worsens at higher power for a fixed flow rate of plasma gas.
Nitrogen 06 00051 g009
Figure 10. Measured NOx concentration as a function of the loop gas flow rate for fixed power of 50 kW. Error bars represent one standard deviation. Measurements are shown as red circles, and a quadratic line of best fit is shown as a blue line. An increase in the loop gas flow rate does not correspond to a proportional decrease in the NOx concentration, indicating that a higher flow rate at a given power level yields increased NOx production and improves the SEC.
Nitrogen 06 00051 g010
Figure 11. The titrated acid sample molarity as a function of the elapsed operation time for the duration of the batch. Error bars represent one standard deviation. Measurements are shown as red circles, and a quadratic line of best fit is shown as a blue line. The rate of increase in the nitric acid concentration decreases as the batch progresses, a result of worsening NO2 absorption in the bubble columns at higher nitric acid concentrations.
Nitrogen 06 00051 g011
Figure 12. Accumulative specific energy consumption determined from titration measurements as a function of the elapsed operation time. Error bars represent one standard deviation, where the error arises due to titration and power. The measured data are shown as red circles, and a line of best fit is shown in blue. The cumulative specific energy consumption for the whole batch is approximately 5.3 MJ/mol.
Nitrogen 06 00051 g012
Disclaimer/Publisher’s Note: The statements, opinions and data contained in all publications are solely those of the individual author(s) and contributor(s) and not of MDPI and/or the editor(s). MDPI and/or the editor(s) disclaim responsibility for any injury to people or property resulting from any ideas, methods, instructions or products referred to in the content.

