Article

Fertilizer Use Efficiency and Profitability of Maize Varieties with Different Maturity Classes in Semi-Arid Ghana

by
Dilys Sefakor MacCarthy
1,*,
Bright Salah Freduah
1,
Yvonne Ohui Kugblenu Darrah
1,
Samuel Godfried Adiku
2,
Daniel Etsey Dodor
2,
Joseph Kugbe
3 and
Alpha Yaya Kamara
4
1
Soil and Irrigation Research Centre, School of Agriculture, University of Ghana, Kpong EL-0633-5197, Ghana
2
Department of Soil Science, School of Agriculture, University of Ghana, Legon, Accra GA-489-9979, Ghana
3
Department of Soil Science, Faculty of Agriculture and Consumer Science, University for Development Studies, Tamale NT-0272-1946, Ghana
4
R4D Unit, International Institute of Tropical Agriculture, Kano 700241, Nigeria
*
Author to whom correspondence should be addressed.
Nitrogen 2025, 6(3), 48; https://doi.org/10.3390/nitrogen6030048
Submission received: 19 April 2025 / Revised: 6 June 2025 / Accepted: 12 June 2025 / Published: 24 June 2025

Abstract

Optimizing the efficiency of fertilizer use is critical for sustainable maize production and food security, particularly in smallholder systems. Sub-optimal application rates pose a significant risk of soil nutrient depletion and low productivity. Split plot experiments were conducted across four locations in Ghana’s Guinea Savannah using seven maize varieties from three different maturity classes. The study assessed the response to nitrogen fertilizer applications (0, 60, 90, and 120 kg N ha−1) regarding yield, Agronomic Efficiency (AEN), Water Use Efficiency (WUE), and economic feasibility. Grain yields across locations and varieties demonstrated a strong linear response to nitrogen fertilization. The 90 kg N ha−1 application generally produced the highest AEN for all sites and varieties. Gross Revenue (GR) and WUE increased with higher N rates, with Value-to-Cost Ratios (VCR) consistently exceeding 2. Applying 90 kg N ha−1 resulted in statistically similar Gross Revenues (GRs) to the 120 kg N ha−1 fertilization. Different maturity classes significantly impacted fertilizer efficiency in semi-arid Ghana, with intermediate varieties outperforming extra-early ones. Though a 90 kg N ha−1 rate was generally identified as the economically optimal rate of N fertilization for the locations, targeted fertilizer recommendations based on maize maturity groups and location are strongly advised.

1. Introduction

The demand for food is projected to rise by 60% by 2050 over the 2005/2007 baseline worldwide. This will further increase the global food security challenges, with the demand from Sub-Saharan Africa (SSA) expected to exceed the world target due to the relatively high population growth rate and low crop productivity [1].
Maize is an important staple crop in SSA and many countries worldwide. Together with rice and wheat, they constitute two-thirds of the world’s food group and are relied on by more than 4 billion people as a source of food and livelihood. In Africa, it feeds over 300 million people and accounts for up to 50% of the caloric intake of its people and, hence, is described as a food security crop. The per capita consumption is high in Africa and ranges from 52 to 450 g/person/day compared to 50 to 267 g/person/day in Latin America [2].
Despite the heavy reliance on maize as a major source of calories and livelihood for a significant number of people, its productivity across SSA remains low (2100 kg ha−1), well below the world average of 5750 kg ha−1 [3]. The major constraints that limit the productivity of maize in SSA and, for that matter, Ghana, include low soil fertility coupled with low use of fertilizers, over-reliance on weather, which is becoming increasingly erratic, pests and diseases, use of inappropriate genetic materials, and other socio-economic factors. These contribute to a wide yield gap in maize production that has been reported in the literature [1,4], and with the demand for maize in SSA expected to triple [1], it is crucial to close the significant yield gaps on farmers’ fields and bridge the disparity between current low yields and potential yields. The application of inorganic fertilizers significantly improves yields; however, their use is limited in SSA. Reports indicate that average application rates of nitrogen, a macronutrient required by crops such as maize in large quantities for optimal crop productivity, are less than 15 kg N ha−1 yr−1, which is insufficient to meet crop nutrient demands and, hence, limits crop yields and further exacerbates soil nutrient depletion [5]. These application rates of nitrogen fertilizer are rather low compared to those applied (about 170 kg N ha−1) in other places such as China [6].
Important factors that deter farmers from patronizing the use of fertilizers are the high cost of fertilizer, low nutrient use efficiency, and variable yield response due to erratic rainfall distributions. Studies have indicated that farmers in SSA face low nutrient efficiencies and poor crop responses to fertilizers across various soil types. The situation in Ghana is similar to that in other locations in SSA [7]. For instance, many studies [8,9,10] have reported low nitrogen use efficiencies in maize in the northern part of Ghana. In certain locations, the risk of non-responsiveness is particularly high due to variations in soil organic matter [11], leading to high input costs and potentially reducing farmers’ willingness to invest in fertilizers [12]. These findings further emphasize the impact of location-specific variations in soil factors, such as mineralogy and parent material composition, which influence nutrient use efficiency and inorganic nitrogen fertilizer responsiveness across the region. Some studies have recommended inorganic nitrogen fertilizer application rates between 60 and 90 kg N ha−1 with a wide range of nitrogen use efficiencies in northern Ghana [9].
Genotypic differences also play a key role in nitrogen use efficiency. For instance, morphological and physiological traits like root architecture, leaf area, biomass distribution, photosynthetic efficiency, and nutrient remobilization influence nitrogen uptake and utilization [13,14]. Additionally, phenological factors such as maturity class, flowering synchrony, and grain-filling period affect nutrient partitioning [15]. Thus, matching varieties to nitrogen application is important for optimizing nitrogen use efficiency and improving crop productivity.
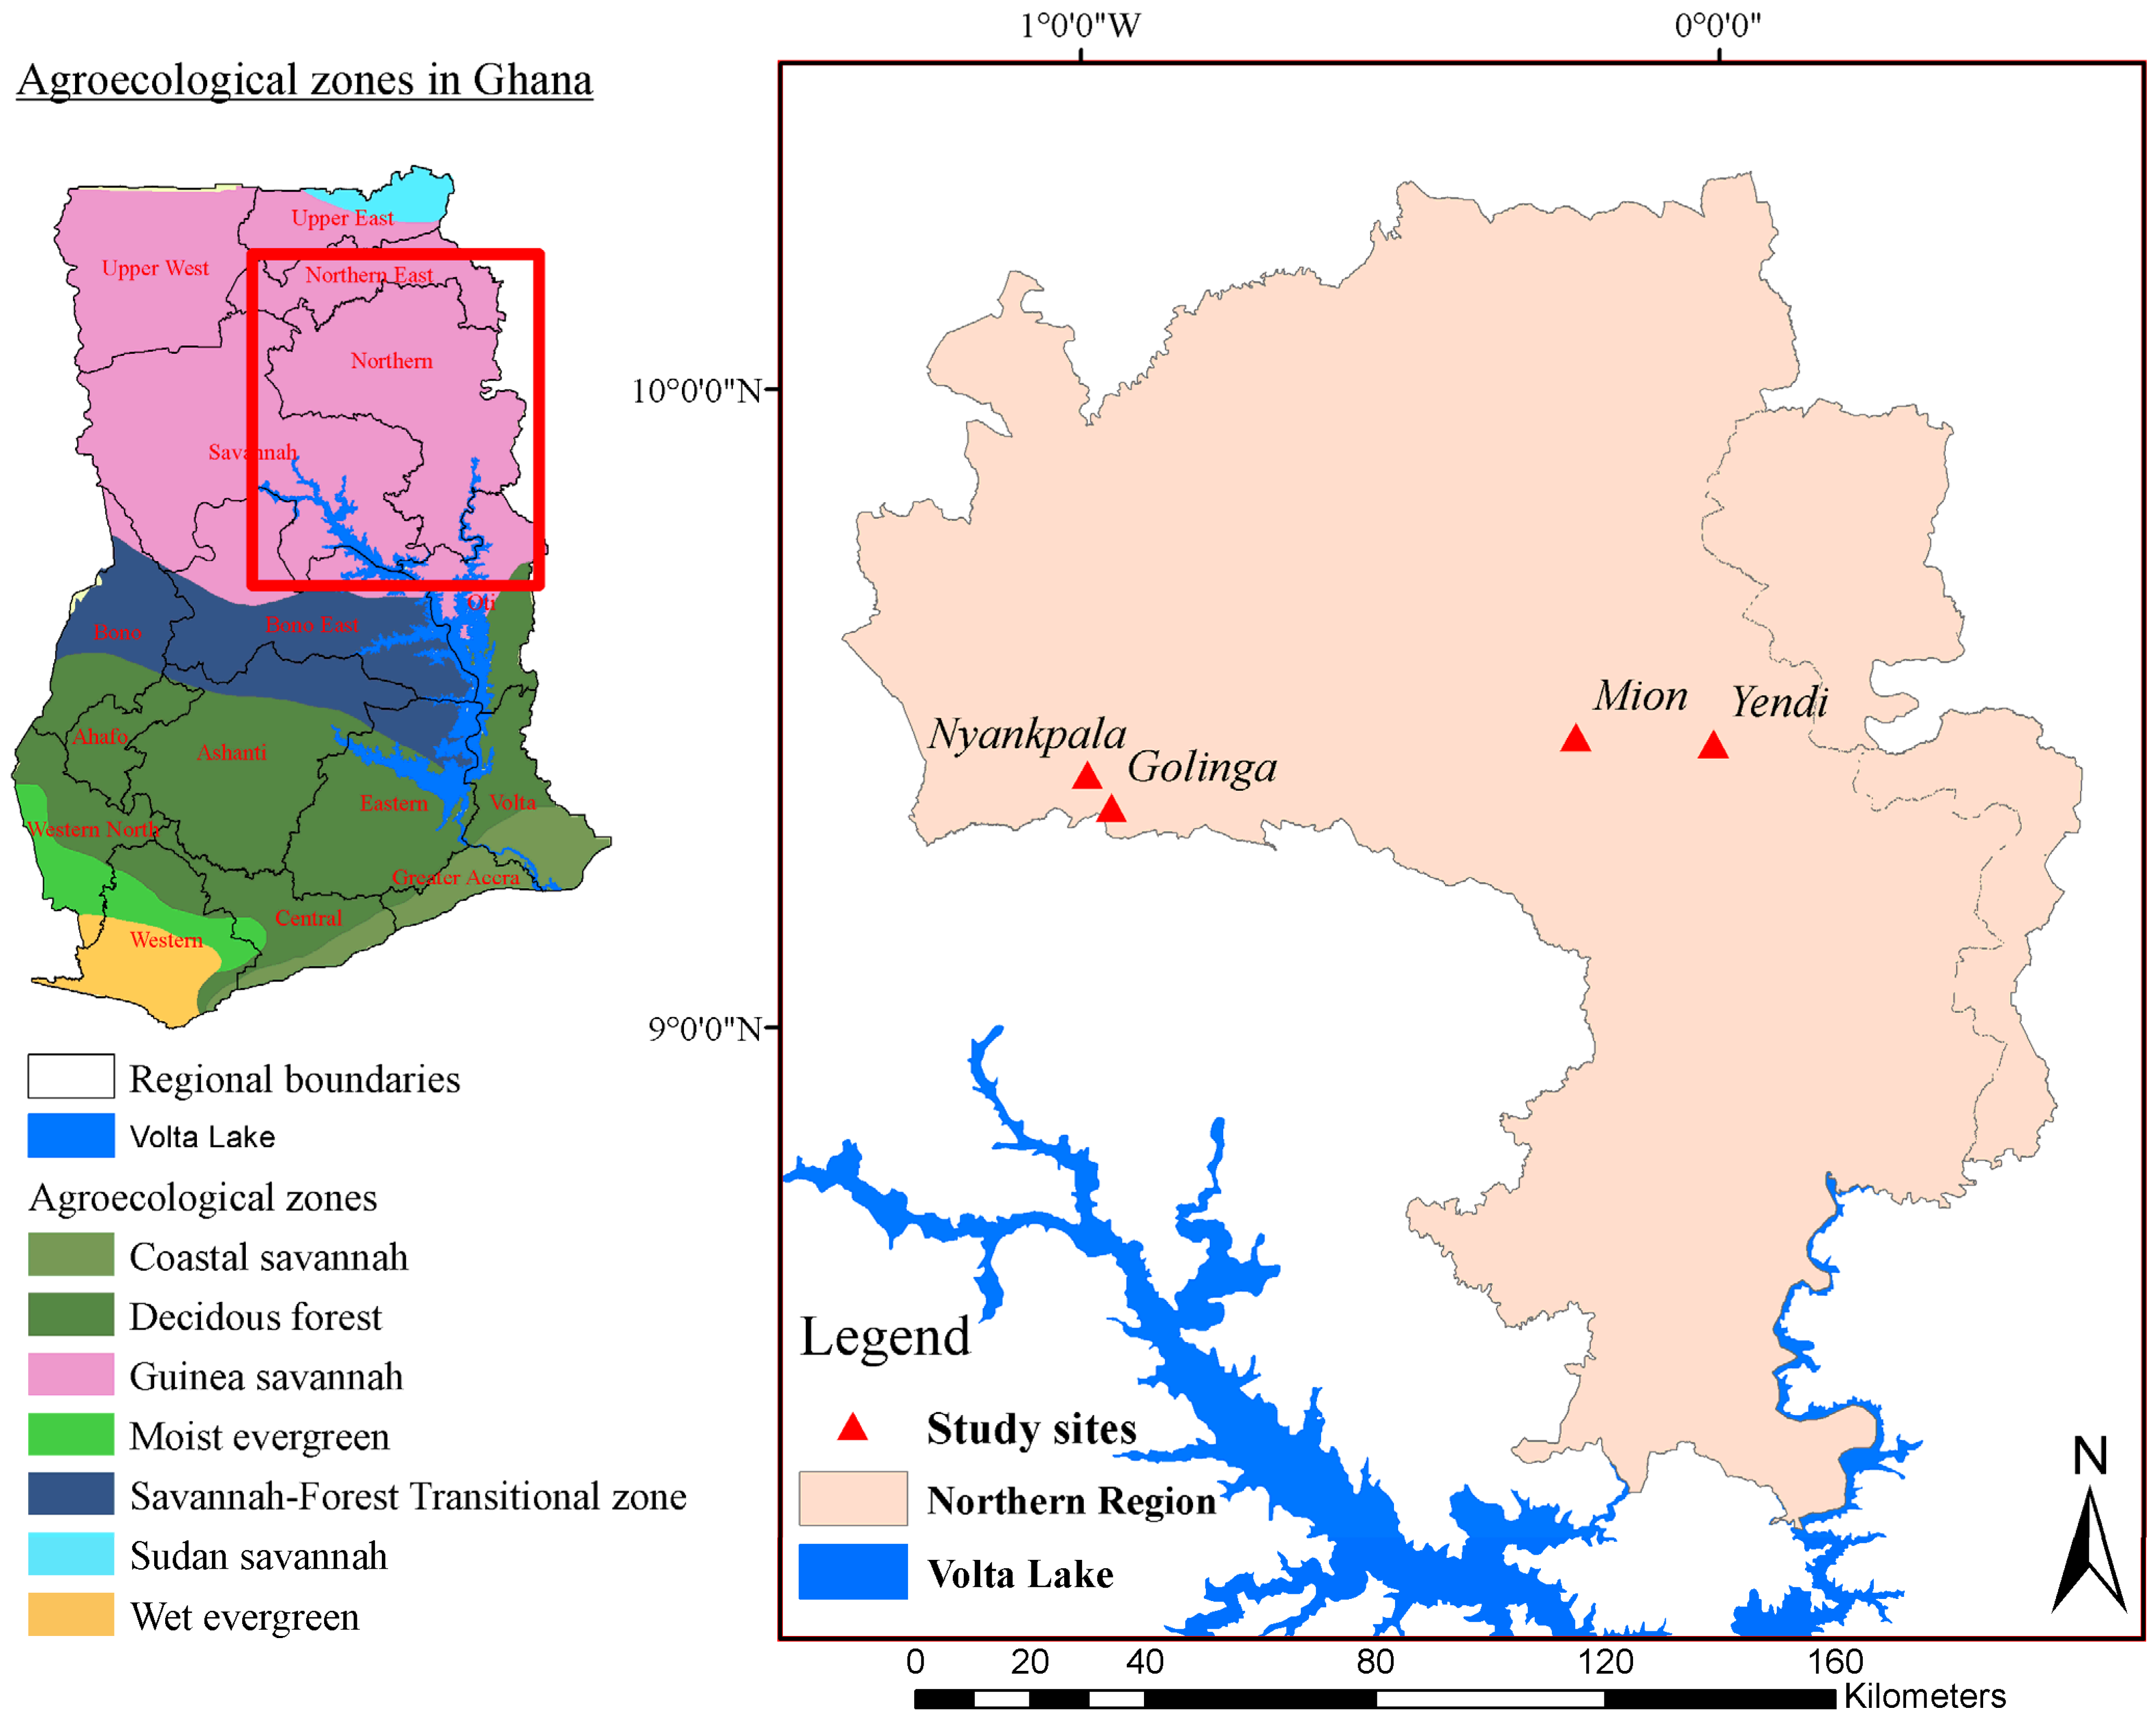
Though many studies have reported on maize yield in response to nitrogen fertilization, there is inadequate information on how the response to nitrogen fertilizer is influenced by the maturity class of maize in Ghana. Thus, we hypothesize that maize varieties with varying maturity periods would respond differently to nitrogen fertilization, both in terms of agronomic and economic performance. Thus, the study aims to assess the response of different maize varieties with varying maturity classes to nitrogen fertilization at multiple locations to assess their nitrogen use efficiency, water use efficiency and the economic feasibility.

2. Materials and Methods

2.1. Study Area

The study was conducted in four communities, namely Nyankpala, Golinga, Mion, and Yendi, in the Northern region of Ghana, which falls within the Guinea Savannah Agroecological zone (Figure 1). The vegetation is characterized by grassland with scattered trees and shrubs. It has a unimodal rainfall pattern with annual total rainfall amounts ranging between 1000 and 1300 mm with an annual average of 1100 mm [16]. The rainy season begins in May/June and ends in September/October, giving way to the dry season, which spans between 5 and 6 months. Average annual temperatures range between 27 °C and 36 °C [17]. The soils are generally coarse-textured and characterized by erosion, rendering the soil depth shallow in many locations (Table 1). They are also generally characterized by impervious Fe and Al concretions at depths between 30 and 50 cm, influencing their water-holding capacity.

2.2. Experimental Design and Treatments

In the rainy season of 2016, seven maize varieties with different maturity classes (indicated in brackets), namely, Abontem (87), 99EDVT (91), 2009EDVT (92), Omankwa (92), Obatanpa (104), IWD SYN (107), and Comp 1 SYN 5 (104) were planted at the four locations. The Abontem, 99EDVT, and 2009EDVT are extra-early maturity varieties, Omankwa is an early variety, while Obatanpa, IWD SYN, and Comp1 SYN 5 are intermediate varieties. The experiment was laid out as a split-plot design with four levels of nitrogen (0, 60, 90 and 120 kg ha−1) as the main plots and seven maize varieties as subplots replicated three times. The plot sizes were each 6 × 6 m2, and each variety was planted on 18 June 2016 at a spacing of 75 × 40 cm at four seeds per hill and thinned to two per hill on the 7th day after emergence (DAE). Phosphorus and potassium fertilizers were applied at 45 kg P2O5 ha−1 and 45 kg K2O ha−1 on the 10th DAE in the form of Triple Super Phosphate and Muriate of Potash, respectively. The nitrogen fertilizer was applied at 10 and 30 DAE (using Urea, which contains 46% nitrogen) in a ratio of 2:3, respectively. Weed control was performed manually in the second and fifth weeks after emergence.

2.3. Plant Sampling

Plants at physiological maturity were harvested from an area of 3 × 3 m2 within each plot. Grains harvested was weighed, and sub-samples were taken, weighed, and oven-dried to a constant weight at 70 °C. The dried weight of the sub-sample was used to extrapolate to a hectare basis.

2.4. Soil Sampling and Analysis

Prior to planting, soils at each location were sampled at different depths (Table 1), air-dried, ground, sieved (2 mm), and analyzed for pH, organic carbon, and particle size distribution. The pH of the samples was determined in water 1:10 w/v soil-water extract. Organic carbon was determined using the Walkley-Black method after expelling carbonates from the sample with HCl. The modified Bouyoucos method [18] was used to determine the particle size distribution. Undisturbed samples were also taken with a core sampler with known volume to determine the bulk density of the soils. The samples were weighed and dried to a constant weight at 105 °C. The dried weight was divided by the core volume to determine the bulk density. All analyses were carried out at the Department of Soil Science, University of Ghana.

2.5. Fertilizer and Water Use Efficiency

To determine nitrogen fertilizer use efficiency, the agronomic efficiency of nitrogen (AEN) and the partial factor productivity of nitrogen fertilizer (PFPN) were assessed. The AEN is defined as:
A E N k g   g r a i n   k g 1 N = G Y N G Y 0 F N
where GYN, GY0 and FN are grain yield at a fertilizer N rate (kg ha−1), grain yield without fertilizer applied (kg ha−1), and the amount of fertilizer N applied (kg ha−1), respectively. The PFPN is defined as:
P F P N = G Y N F N

2.6. Economic Analysis

The profitability of fertilizer use was assessed using the value-to-cost ratio (VCR) and the Gross Revenue (GR). The GR is defined as the product of grain yield (GY) and the unit selling price (SP) less the sum of the variable cost (VC) and fixed cost (FC). Variable cost constitutes the cost of fertilizer and its application, whereas fixed cost constitutes the cost of renting land, land preparation, harvesting, transportation, seed, and herbicides.
G R G H   S h a 1 = G Y × S P V C + F C
V C R = G r a i n   y i e l d C o n t r o l G r a i n   y i e l d t r e a t m e n t × G r a i n   p r i c e C o s t   o f   a p p l i e d   t r e a t m e n t

2.7. Statistical Analysis

A two-stage analytical procedure was used on each parameter (grain yield, AEN, VCR, GR, PFPN, and WUE). In the first stage, the main effects of and the interactions between N, location, and variety were assessed using a linear mixed-effects model, considering N, location, and variety as fixed effects and replicates nested within location as random (model 1). Analysis of Deviance was then used to assess the statistical significance of the parameters and their interactions. The second-stage analysis was conducted only when the three-way interaction was found to be significant at a 0.05 probability level in the analysis of Deviance. In the second stage, a linear mixed effects model (model 2) was used to partition the interaction between N, location, and maize varieties. The N was used as the fixed effect, while location, variety, and replicates were the random effects in model 2. Model 2 maintained the main effect of N from model 1 and, in addition, allowed the intercepts and slopes of the varieties to vary in each location for N. The R statistical software version 4.5.1 (13 June 2025) with packages lme4, car, rsq and tidyverse was used for data analysis and visualization [19,20,21].
y ~ N × L o c a t i o n × V a r i e t y + 1 L o c a t i o n : R e p l i c a t e m o d e l   1
y ~ N + ( N | L o c a t i o n : V a r i e t y ) + 1 L o c a t i o n : R e p l i c a t e m o d e l   2
where y = response variable

3. Results

Weather data for the experimental period (Figure 1) showed Nyankpala receiving the highest total rainfall (1091.3 mm), with Yendi receiving the least (916 mm) for the 2016 cropping season. These rainfall amounts are within the range (900–1400 mm) typically observed for the region [4]. The average daily temperature across the four locations ranged from 28.1 to 29.1 °C, with Mion having the lowest and Nyankpala recording the highest daily temperature. All four locations experienced varying rainfall distributions (Figure 2) and an initial dry spell (Figure 3) over the growing season.

3.1. Grain Yield Response to Nitrogen Fertilization

Grain yield was significantly influenced by the interactions among locations × N applied × variety, the interactions between each pair of factors (except location × variety) and the sole effects of N rate and variety (Table 2). The trend in yield response to N applied was generally similar across locations and varieties, but the magnitude of the responses (slopes) varied significantly (Figure 4), with the intermediate-maturing varieties recording the highest response to nitrogen fertilization. Yield response to a unit of N fertilizer applied ranged between 19 kg grains kg−1 N for Abontem to 31 kg grains kg−1 N for the Obatanpa variety. Generally, the magnitude of response to N fertilization among the varieties varied across locations. Averaged across locations, yield increases among the varieties at 60 kg N ha−1 ranged between 146 and 176%, and for 90 kg N ha−1 between 216 and 269% over their respective controls for the 2009EDVT and Obatanpa varieties, respectively. The additional yield gain from raising nitrogen levels from 90 to 120 kg N ha−1 was marginal (ranging between 15 and 28%).
Generally, the yields obtained from the longer-maturity class varieties (IWD, Comp, and Obatanpa) were higher compared to those obtained for shorter-maturity varieties. The yield gains in response to N fertilization also varied across varieties and locations. For instance, whereas yield gains averaged across varieties were 254, 302 and 336% with the application of 60, 90 and 120 kg ha−1 N fertilizers, respectively, at the Nyankpala location, the respective yield gains at Golinga were 109, 175 and 196% for the same N application rates. There was a strong linear relationship (within the range of N applied) between N rate and grain yield. The coefficient of determination (R2) suggested that nitrogen alone accounted for 86% variation in grain yield, and the interaction between N, variety and location accounted for 7% of the variation in grain yield (Table A1). Hence, N and its interaction with variety and location accounted for 93% of all the variation in grain yield.

3.2. Nutrient Use Efficiency

To evaluate the efficiency of the seven varieties in utilizing the inorganic fertilizer applied, the agronomic efficiency of nitrogen (AEN) and partial factor productivity of nitrogen (PFPN) were used as indicators. The AEN was generally higher at 60 kg N ha−1 for all the varieties in Nyankpala, while in Yendi and Golinga, it was typically higher at 90 kg N ha−1, with inconsistent trends observed in Mion. It ranged from a minimum of 10.1 kg grains kg−1 N applied with the 99EDVT variety fertilized at 60 kg N ha−1 to 40.8 kg grain kg−1 N applied, which was obtained with the Obatanpa variety fertilized at 90 kg N ha−1, both at Yendi (Figure 5). The agronomic efficiency of nitrogen use of the varieties was significantly influenced by location, variety, nitrogen rate, and the interactions among these factors (Table A2). For instance, whereas the AEN of Obatanpa at Mion at 60 kg N ha−1 was about 45 and 29% higher than what was obtained at Golinga and Yendi, respectively, it was about 18% lower than what was obtained at Nyankpala at the same nitrogen fertilization rate.
Additionally, whereas AEN was highest under 60 kg N ha−1 among most of the varieties at Nyankpala, the efficiency of the applied nitrogen was most efficient at the 90 kg N ha−1 rate at the remaining three locations. Except for the longer maturity varieties (Obatanpa, Comp, and IWD), the AEN was lowest at Yendi compared to the other three locations, whereas the AEN of the shorter maturity varieties was highest at Nyankpala.
PFPN was generally highest at 60 kg N ha−1 for all the varieties at all locations except Yendi, where 90 kg N ha−1 generally produced the highest PFPN (Figure 6). Values ranged from 26 obtained at Nyankpala for Abontem at 120 kg N ha−1 to a maximum of 59 kg yield kg−1 N at Nyankpala when 60 kg N ha−1 of fertilization was applied for Obatanpa. PFPN were significantly influenced by location, variety, nitrogen rate, and the interactions among these factors. Considering Omankwa, the highest PFPN was obtained at Mion (54), which was 8.6, 14.3, and 33.9% higher than the values obtained at Nyankpala, Golinga and Yendi, respectively, when 60 kg N ha−1 was applied. PFPN was higher for the longer maturity varieties at all the locations. An average PFPN of 52 kg yield kg−1 N was obtained across Obatanpa, IWD, and Comp across all four locations, which was 7.7 and 20.6% higher than the values obtained for the early (Omankwa) and extra early (Abontem, 99EDVT, and 2009EDVT) maturity class varieties, respectively. Whereas N alone accounted for 54% of the PFPN, the interaction between location and variety accounted for an additional 33% of the variation in PFPN (Table A3).

3.3. Water Use Efficiency

Figure 7 illustrates the WUE of the different maize varieties under different N rates at each of the four study sites. The largest WUE gains occurred at the lower nitrogen levels (0 to 60 kg N ha-1), and this was prominent in Nyankpala, Golinga and Mion, meaning that initial fertilizer application provided the most significant improvement. As nitrogen levels increased beyond 60 kg N ha-1, the rate of WUE improvement slowed down, indicating diminishing returns.
As with grain yield, the efficiency with which the maize varieties utilized water was influenced by the interactions among the factors location × N rate × variety, the interaction between each pair of factors, as well as their sole effects (Table 1). Whereas the Obatanpa variety recorded the highest WUE at 120 kg N ha−1 at Yendi, the 2009EDVT variety recorded the highest WUE at Golinga. Again, whereas WUE at 60 and 90 kg N ha−1 were similar for each variety at Nyankpala, they were different at the other three locations.
Generally, WUE increased with increasing N rates, with the 120 kg N ha−1 rate producing the highest WUE at all locations except for Nyankpala, where the WUE of 60 and 90 kg N ha−1 were similar across the seven varieties. Averaged across varieties, WUE under the control treatments ranged between 2.5 in Nyankpala to 3.8 kg grain mm−1 water at Golinga. Applying N resulted in an increase in WUE (averaged across varieties) by between 190 and 294% at Yendi and Nyankpala, respectively, under the 120 kg N ha−1 rate. The coefficient of variation among the varieties at the locations ranged between 7 and 23% under the control treatments and increased to between 11 and 40% under the 120 kg N ha−1. Thus, applying N fertilizer increased the variation in WUE among the varieties. The application of N explained 87% of the variation in WUE, and an additional 5% was explained by the interaction between location and varieties (Table A4).

3.4. Economic Indicators

Value-to-cost ratio (VCR) and gross revenue (GR) were the economic indicators used to assess the benefits of using nitrogen fertilizer. The value-to-cost ratio (VCR) varied among the seven varieties, locations, and nitrogen fertilizer application rates from 1.6 with the 99EDVT variety at 60 kg N ha−1 to 6.7 for the Obatanpa variety under 90 kg N ha−1 (Figure 8). The trend in VCR varied among locations, varieties, and N rates in this study. Generally, the longer maturity varieties (IWD, Obatanpa, and Comp) produced the highest VCR, while the extra early varieties, such as Abontem, consistently produced the least VCR. The interactions among location, variety, and N rate significantly influenced the value-to-cost ratios of producing maize in this study. For instance, whereas the VCR for Obatanpa was significantly higher in Mion under 60 kg N ha−1 fertilizer application than at Golinga and Yendi, the reverse was the case for Nyankpala, where the VCR of Obatanpa was 19% higher than that in Mion under this fertilizer rate. However, the trends described here are not consistent with those under the other two N application rates. Except for Nyankpala, where the 60 kg N ha−1 yielded the highest VCR across the varieties, the 90 kg N ha−1 yielded the highest VCR for the other three locations. The contribution of the interaction between location and variety on the response of N to VCR was significant, explaining 58% of the variations, while the main effect of N alone explained an additional 10% of the variation (Table A5).
As with grain yield, the gross revenue (GR) was also significantly influenced by the interaction among location × variety × N rate. The variation in GR among the locations was not significantly (p = 0.05) different. Generally, increasing the N rate resulted in increased GR. The magnitude of yield gains due to fertilizer application varied significantly among the varieties, with the intermediate varieties obtaining higher gains compared to the extra short-maturity varieties. For instance, the GR increase of between 244 and 310% was obtained among the varieties over their respective control grain yields for the 2009EDVT and Obatanpa varieties, respectively, when 60 kg N ha−1 was applied. Applying fertilizer at 90 kg N ha−1 generally resulted in higher GR compared to the control and 60 kg N ha−1 but was similar to 120 kg N ha−1, suggesting 90 kg N ha−1 to be the economically optimum rate of N fertilization for the four locations (Figure 9). Nitrogen alone accounted for 79% of the variation in GR, and the interaction between N, variety, and location accounted for an additional 11% of the variation (Table A6). Hence, N and its interaction with variety and location accounted for 90% of all the variations in GR.

4. Discussion

Nitrogen is an important nutrient required by plants for optimum growth and yield. It is, however, the most limiting nutrient in soils in SSA and, for that matter, in Ghana, and the response of maize to its application is variable. As observed in this study, other studies [22,23,24] have also reported significant yield responses of maize varieties to N fertilization. For instance, Tahiru et al. [25] reported yield increases between 84 and 90% when nitrogen fertilizer was applied to maize in the northern region of Ghana. Generally, the rate of increase in yield was not significant beyond 90 kg N ha−1, implying that 90 kg N ha−1 is the optimal agronomic fertilizer application rate for these locations. This is within the 60–120 kg N ha−1 rate reported for northern Ghana [26] as the recommendation for maize production in the northern sector of Ghana. Atakora et al. [27] also reported 60 kg N ha−1 as the recommended rate for smallholders in the northern region of Ghana, which is lower than our findings. The higher optimum rate of N fertilization in our study can be attributed to the higher (relative to those used by most smallholders) fertility status of the soils used for this experiment, with soil depths beyond 75 cm compared to much lower soil depths that characterize most farmers’ fields [28]. Additionally, the study was a researcher-managed experiment that ensured appropriate management practices, such as timing of fertilizer application and optimal planting density, were undertaken, whereas smallholder fields are often not optimally managed, with reports demonstrating double the responsiveness to nutrient application compared to farmers’ fields [12]. It would be beneficial, therefore, to replicate this work on poorly managed farmers’ fields to gain a better understanding of the fertilizer response.
It is also interesting to note that grain yield response to N fertilization varied with the maturation duration of the variety. The extra-early varieties had the lowest yield response, while the intermediate varieties produced the highest grain yield in response to nitrogen fertilization. This is similar to results obtained by Aigbe et al. [29], who found that yields of late and intermediate maize varieties outperformed early and extra-early varieties when grown in a rainforest ecology. The differences in the responses of maize varieties to nitrogen fertilizer could be attributed to differences in nutrient uptake and use efficiencies [30]. Van Grinsven et al. [31] explained that the varied yield response is a reflection of the differences in the mechanisms by which crops intercept and utilize the applied nitrogen. Additionally, the longer the crops remain on the field, the more resources (such as nutrients and water) they can take up to enhance their growth and yield, and hence their nutrient use efficiency. Thus, the rate of yield gain per unit of nitrogen fertilization was higher for the longer-maturity varieties, making them more efficient in the use of the applied nitrogen. In contrast, short-duration varieties may not allow sufficient time for nutrient uptake, particularly in nutrient-depleted soils, as reflected in the limited yield gains observed [32]. Nevertheless, short-duration maize varieties remain crucial in drought-prone regions, providing farmers with a food security buffer under challenging environmental conditions [33].
Under no fertilization treatments, varietal differences were suppressed and only became apparent at higher N levels. Generally, yield gains were high at 60 kg N ha−1, but they declined beyond 90 kg N ha−1. This is contrary to many studies that report significant yield increases even beyond 150 kg N ha−1, suggesting that other yield-limiting factors may have reduced the response of maize to a higher level of fertilization in this study. In a meta-analysis to evaluate the global factors influencing the N fertilizer response of wheat, climatic conditions and soil properties were identified to play a key role in the response of wheat to N [34].
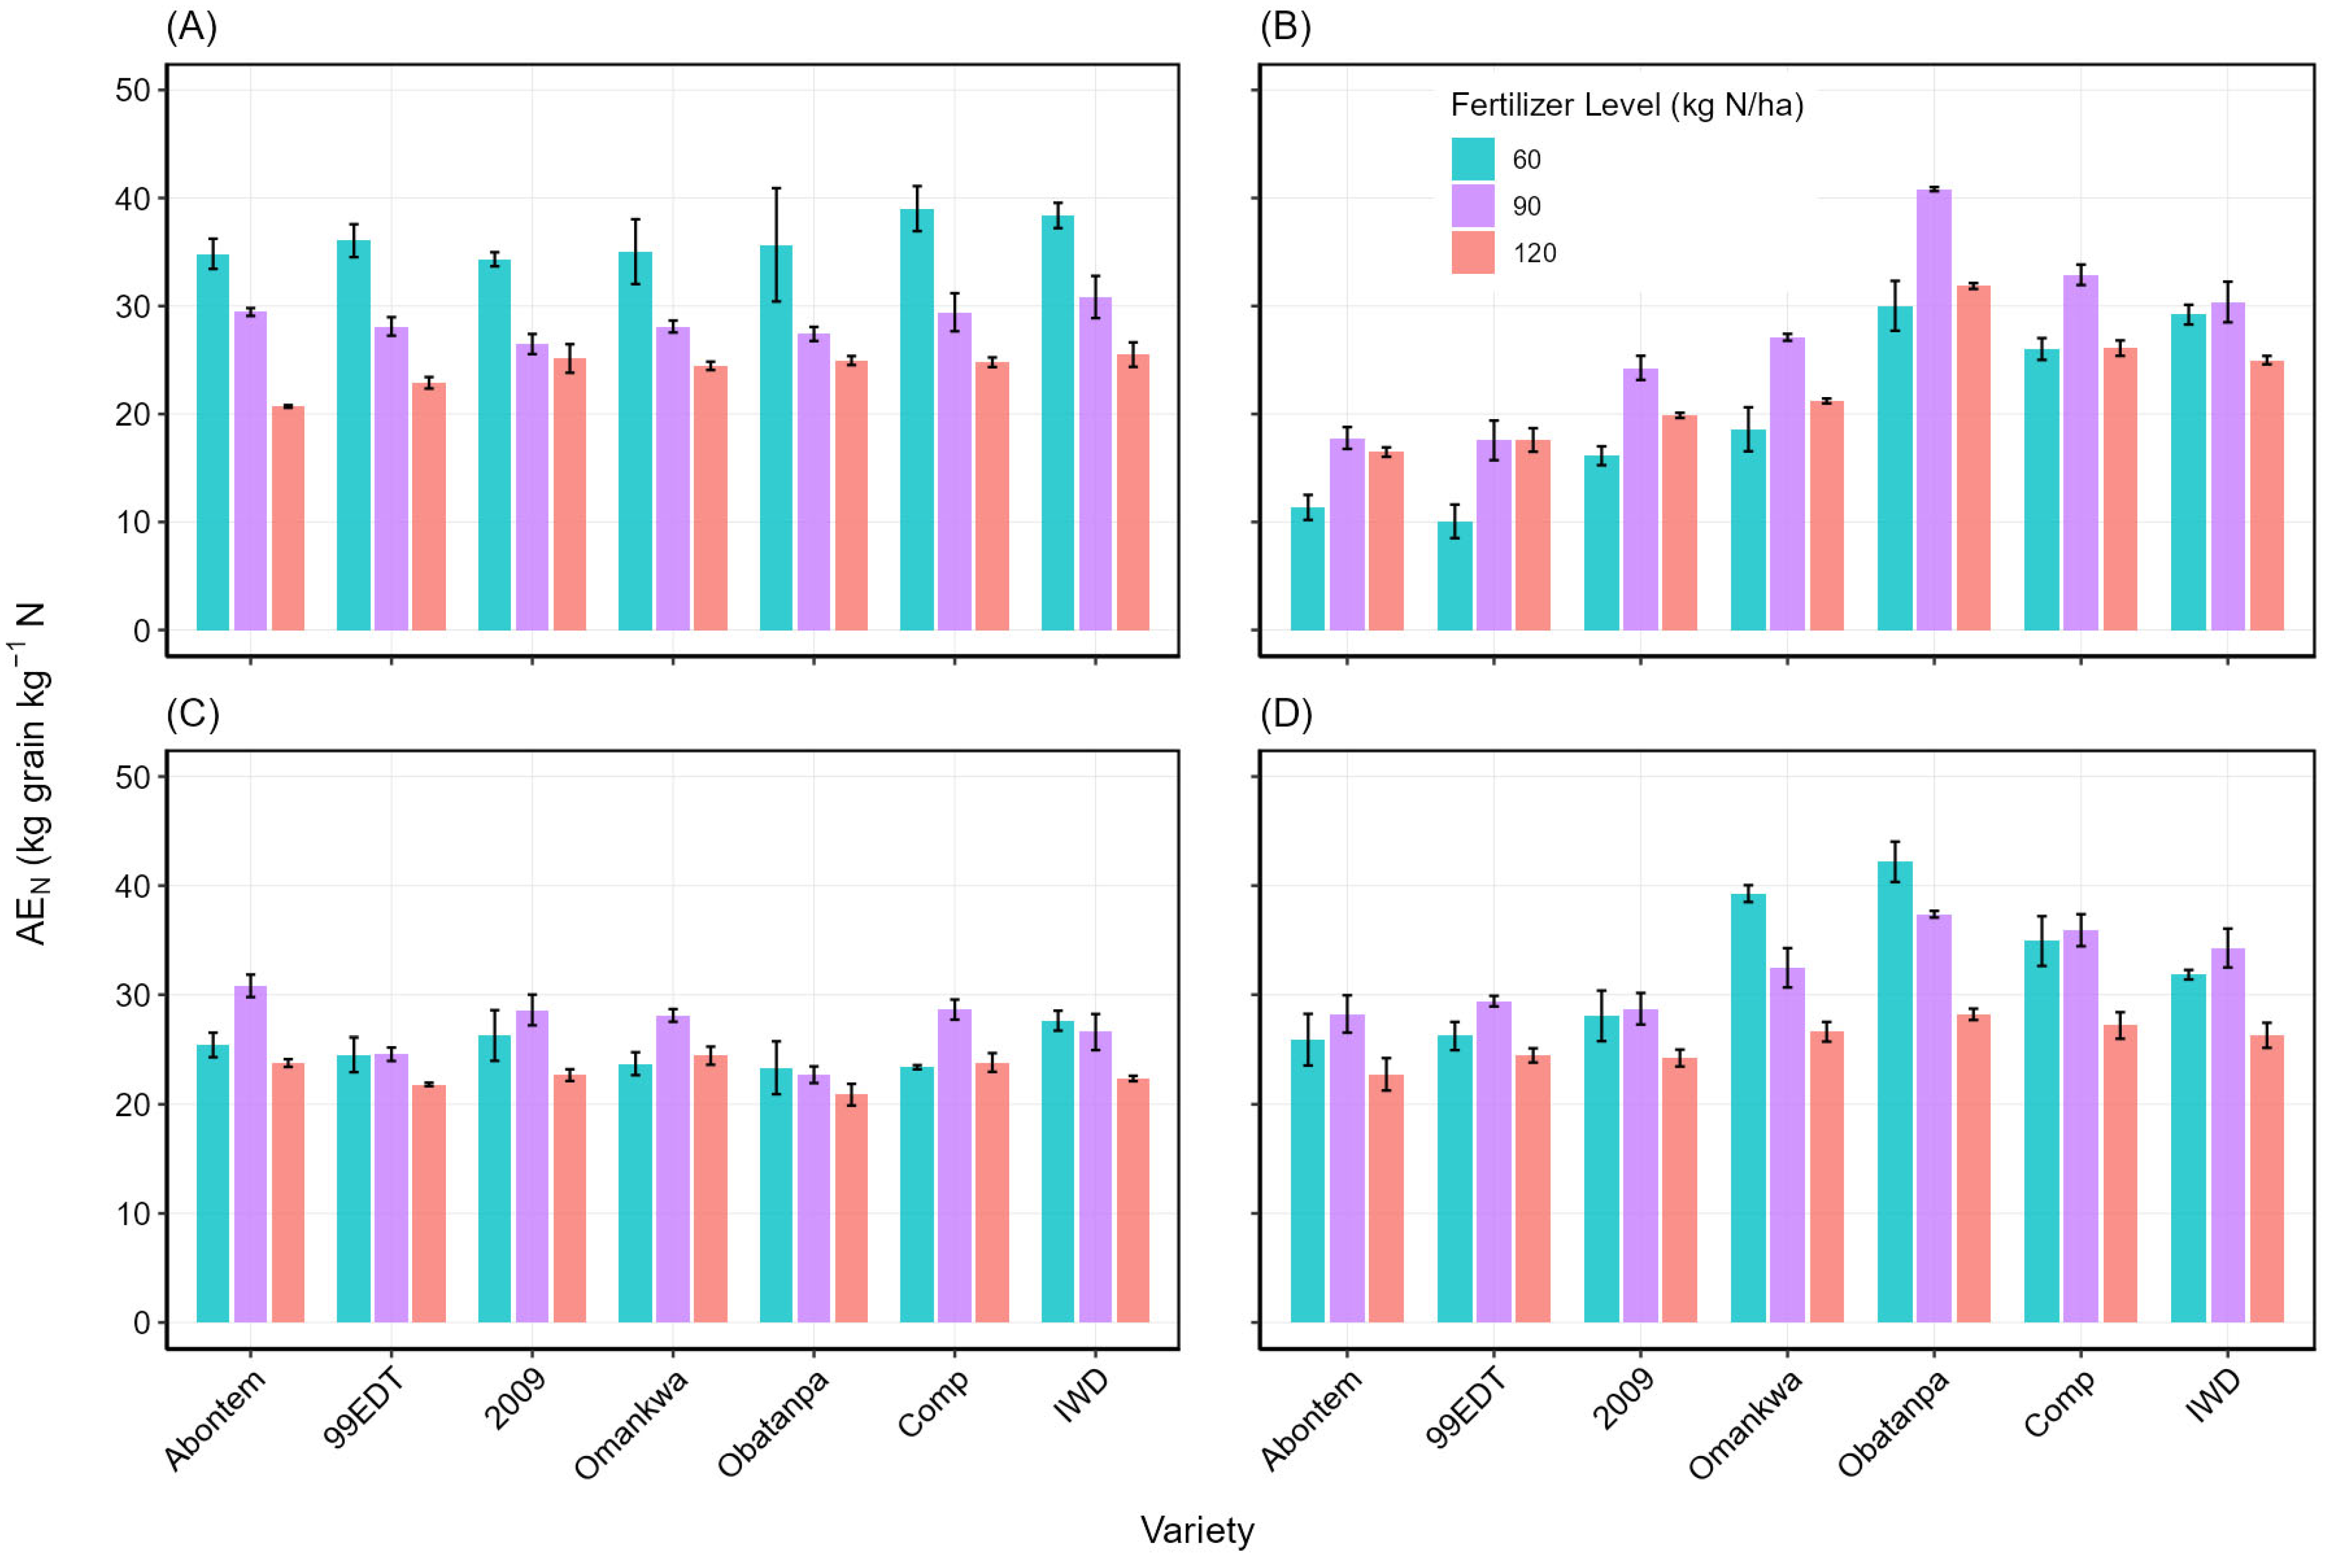
As with grain yield, the efficiency of nutrient use was higher in the higher-maturity class varieties compared to the shorter-maturity ones. The range of AEN of the varieties was largely above the 24 kg−1 grain kg N−1 fertilizer average reported for cereals in Africa [35], falling within those reported for well-managed systems and much above those reported for maize-growing zones in Nigeria. The AEN obtained in this study were within the range of 15 to 30 kg grain kg−1 N reported by Fixen et al. [35], suggesting the experiments were well managed and conducted on soils with recommended phosphorus and Potassium applied.
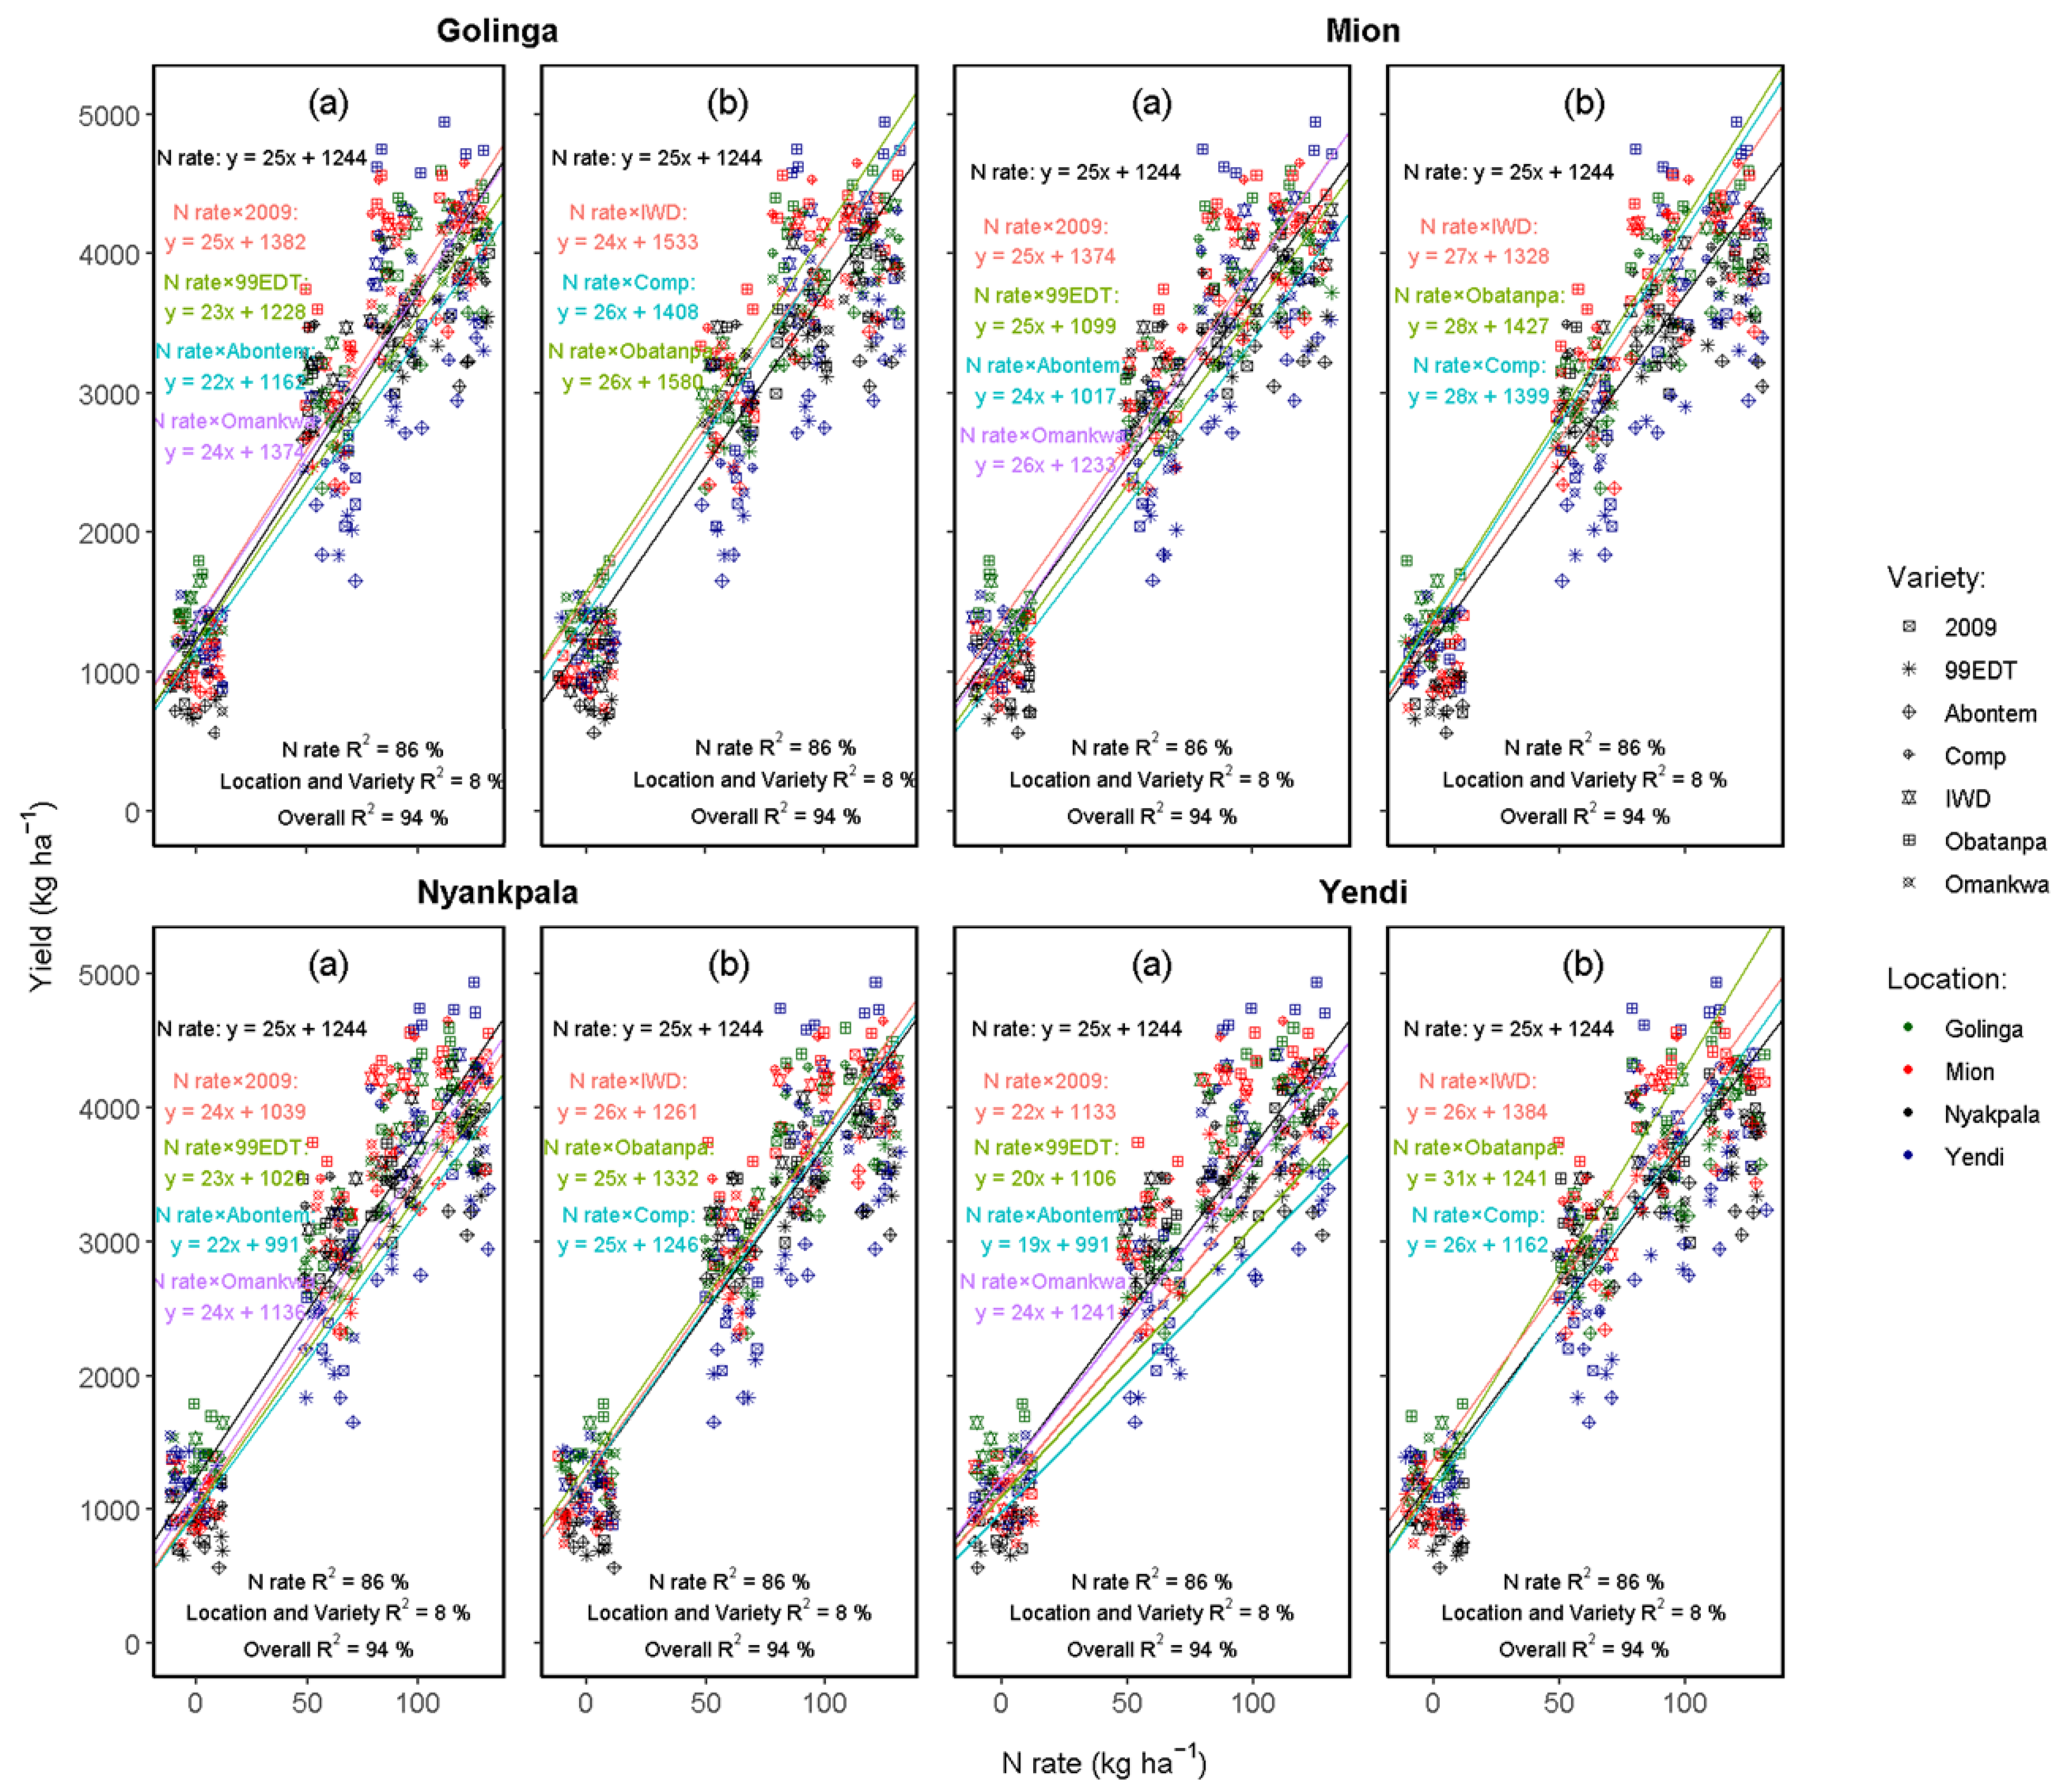
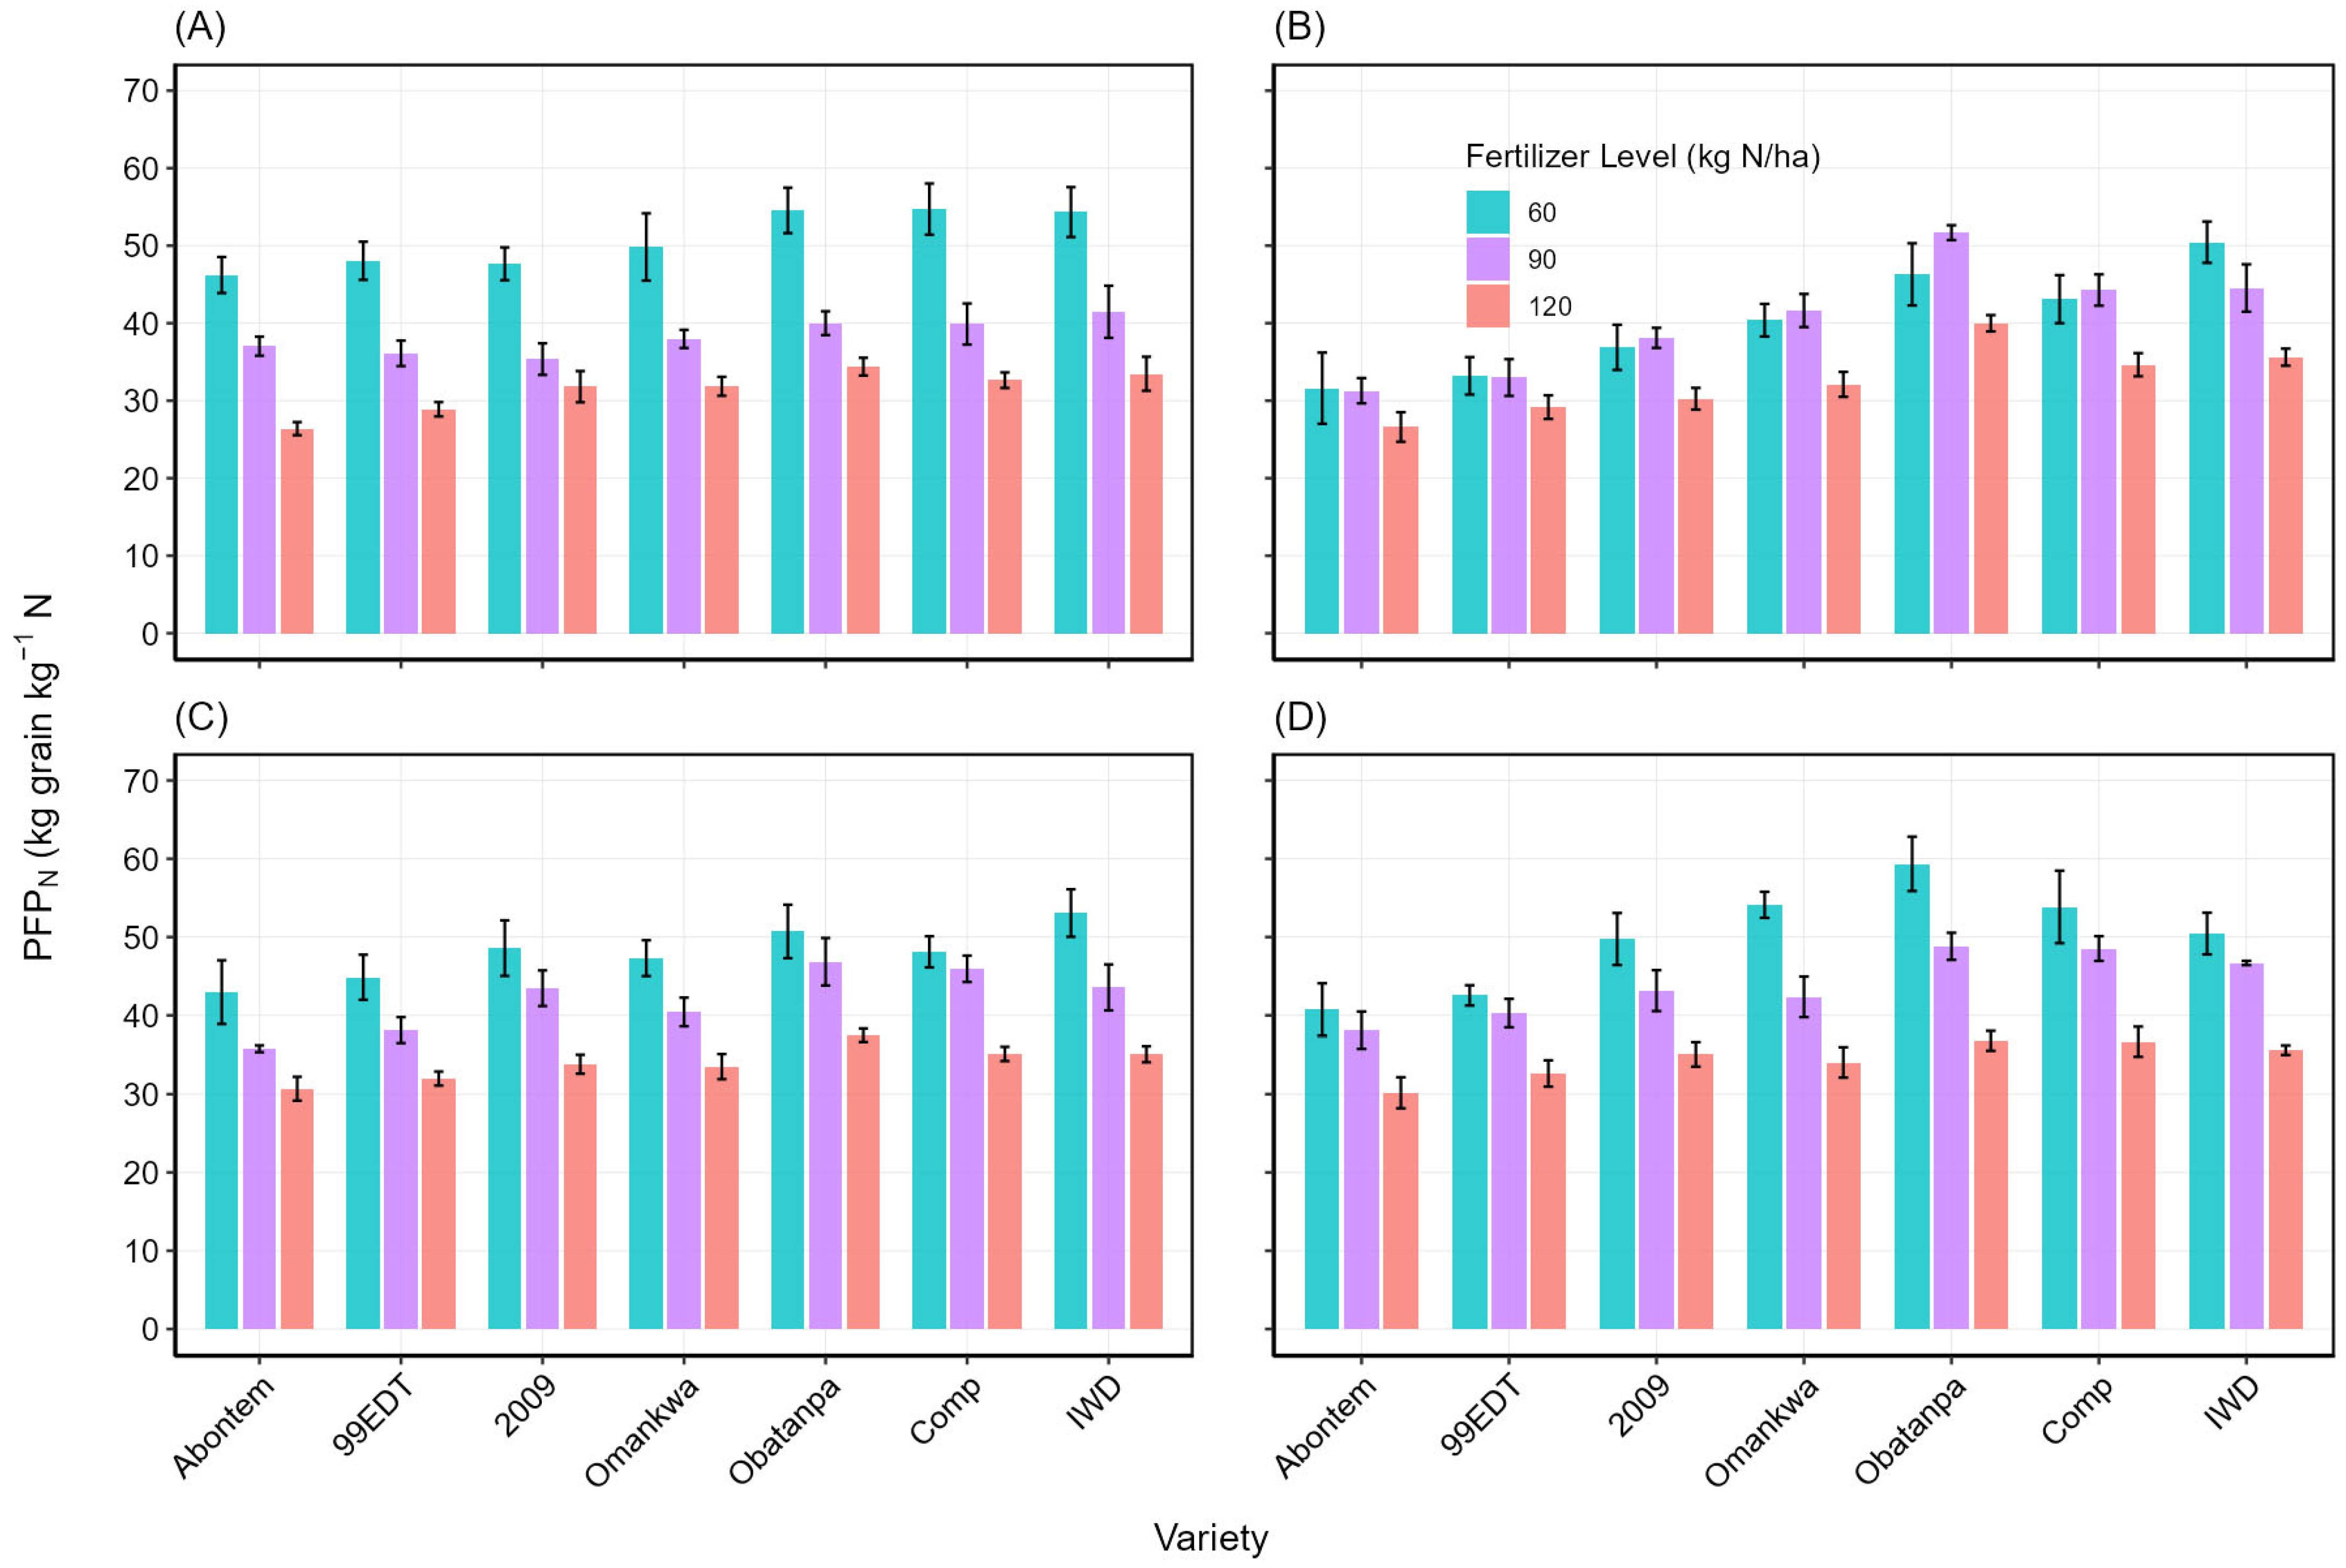
The rate of yield response to nitrogen fertilization varied among the varieties and locations and was similar (19 to 31 kg grains per kg N applied) to those reported by Ragasa & Chapoto [36], who reported statistically significant yield response of between 22 and 26 kg increase in maize yield in response to a kg of inorganic fertilizer application for Ghana. This falls within the range of 11 to 40 kg of maize grain per kg of inorganic N fertilizer applied. The higher range reported in this study is attributed to the different maturity classes of maize varieties used, each with its unique yield potential.
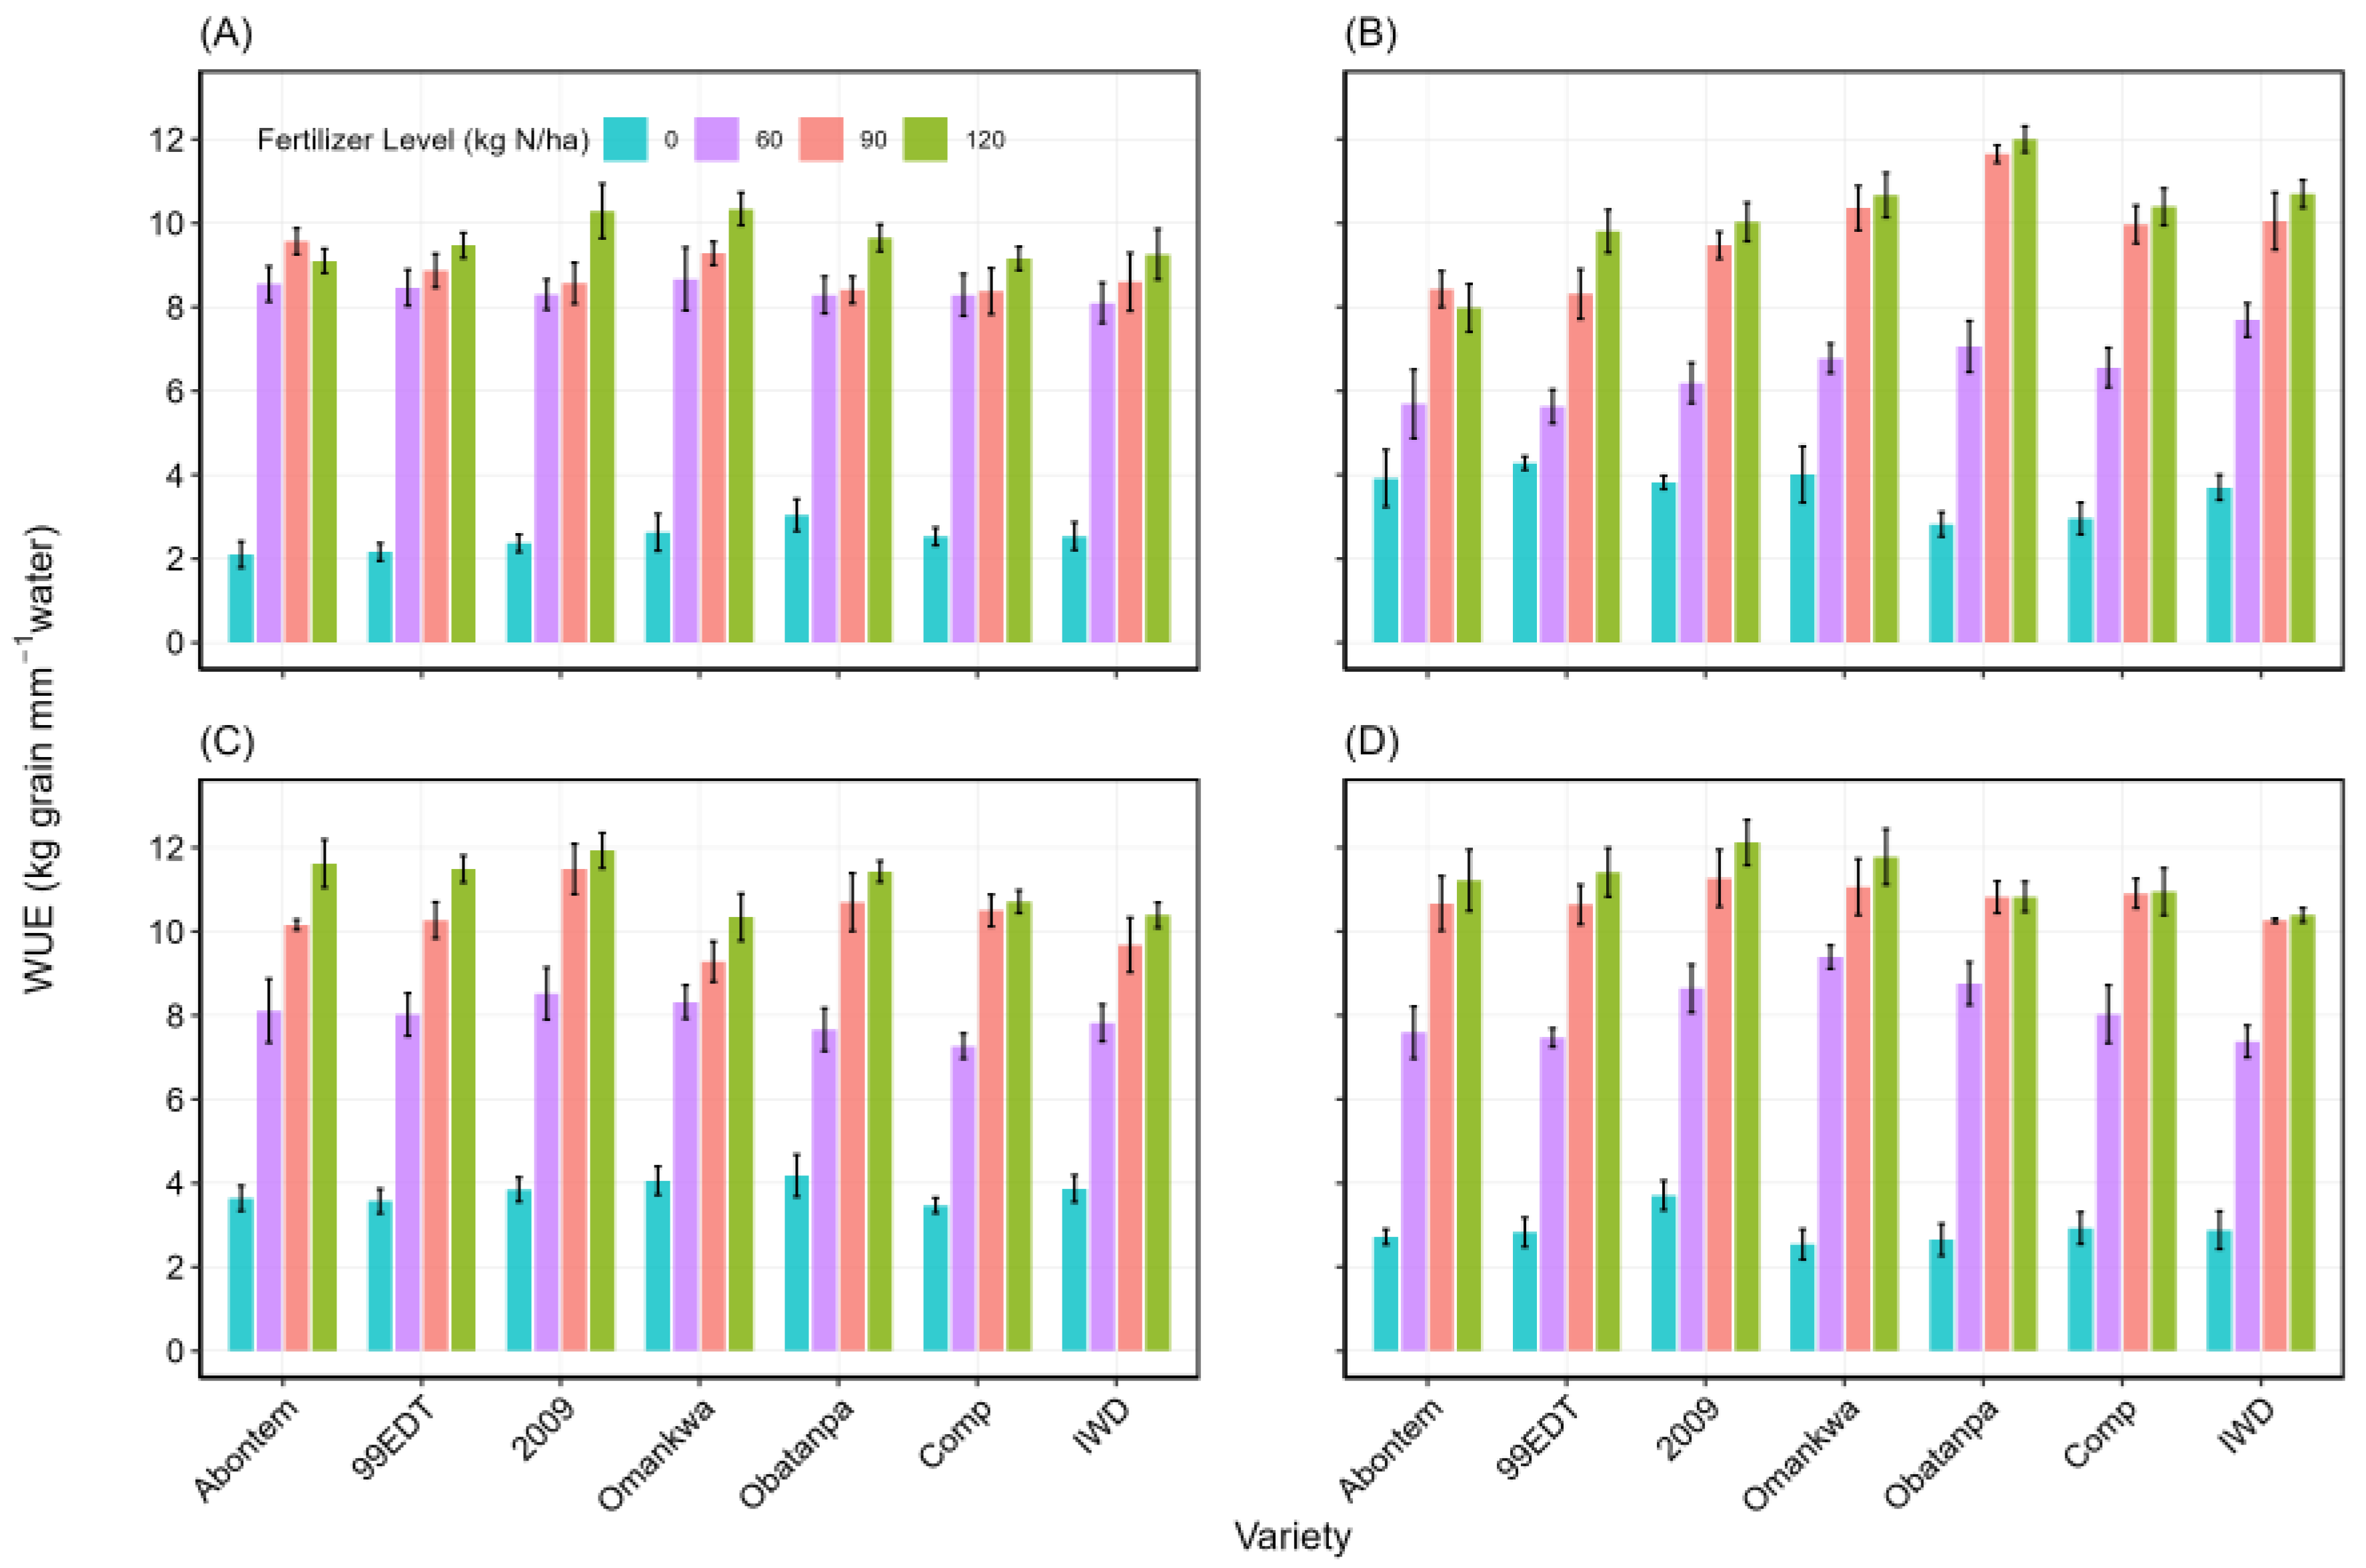
Water use efficiency also increased as nitrogen levels increased, and the performance gaps between varieties became more pronounced, with some varieties demonstrating not only higher yield potential but superior water use efficiency as well. This suggests that improved maize varieties require sufficient nitrogen input to optimize resource uptake and maximize productivity. Hence, fertilizer application is crucial in revealing varietal advantages that may remain unrealized under nutrient-deficient conditions.
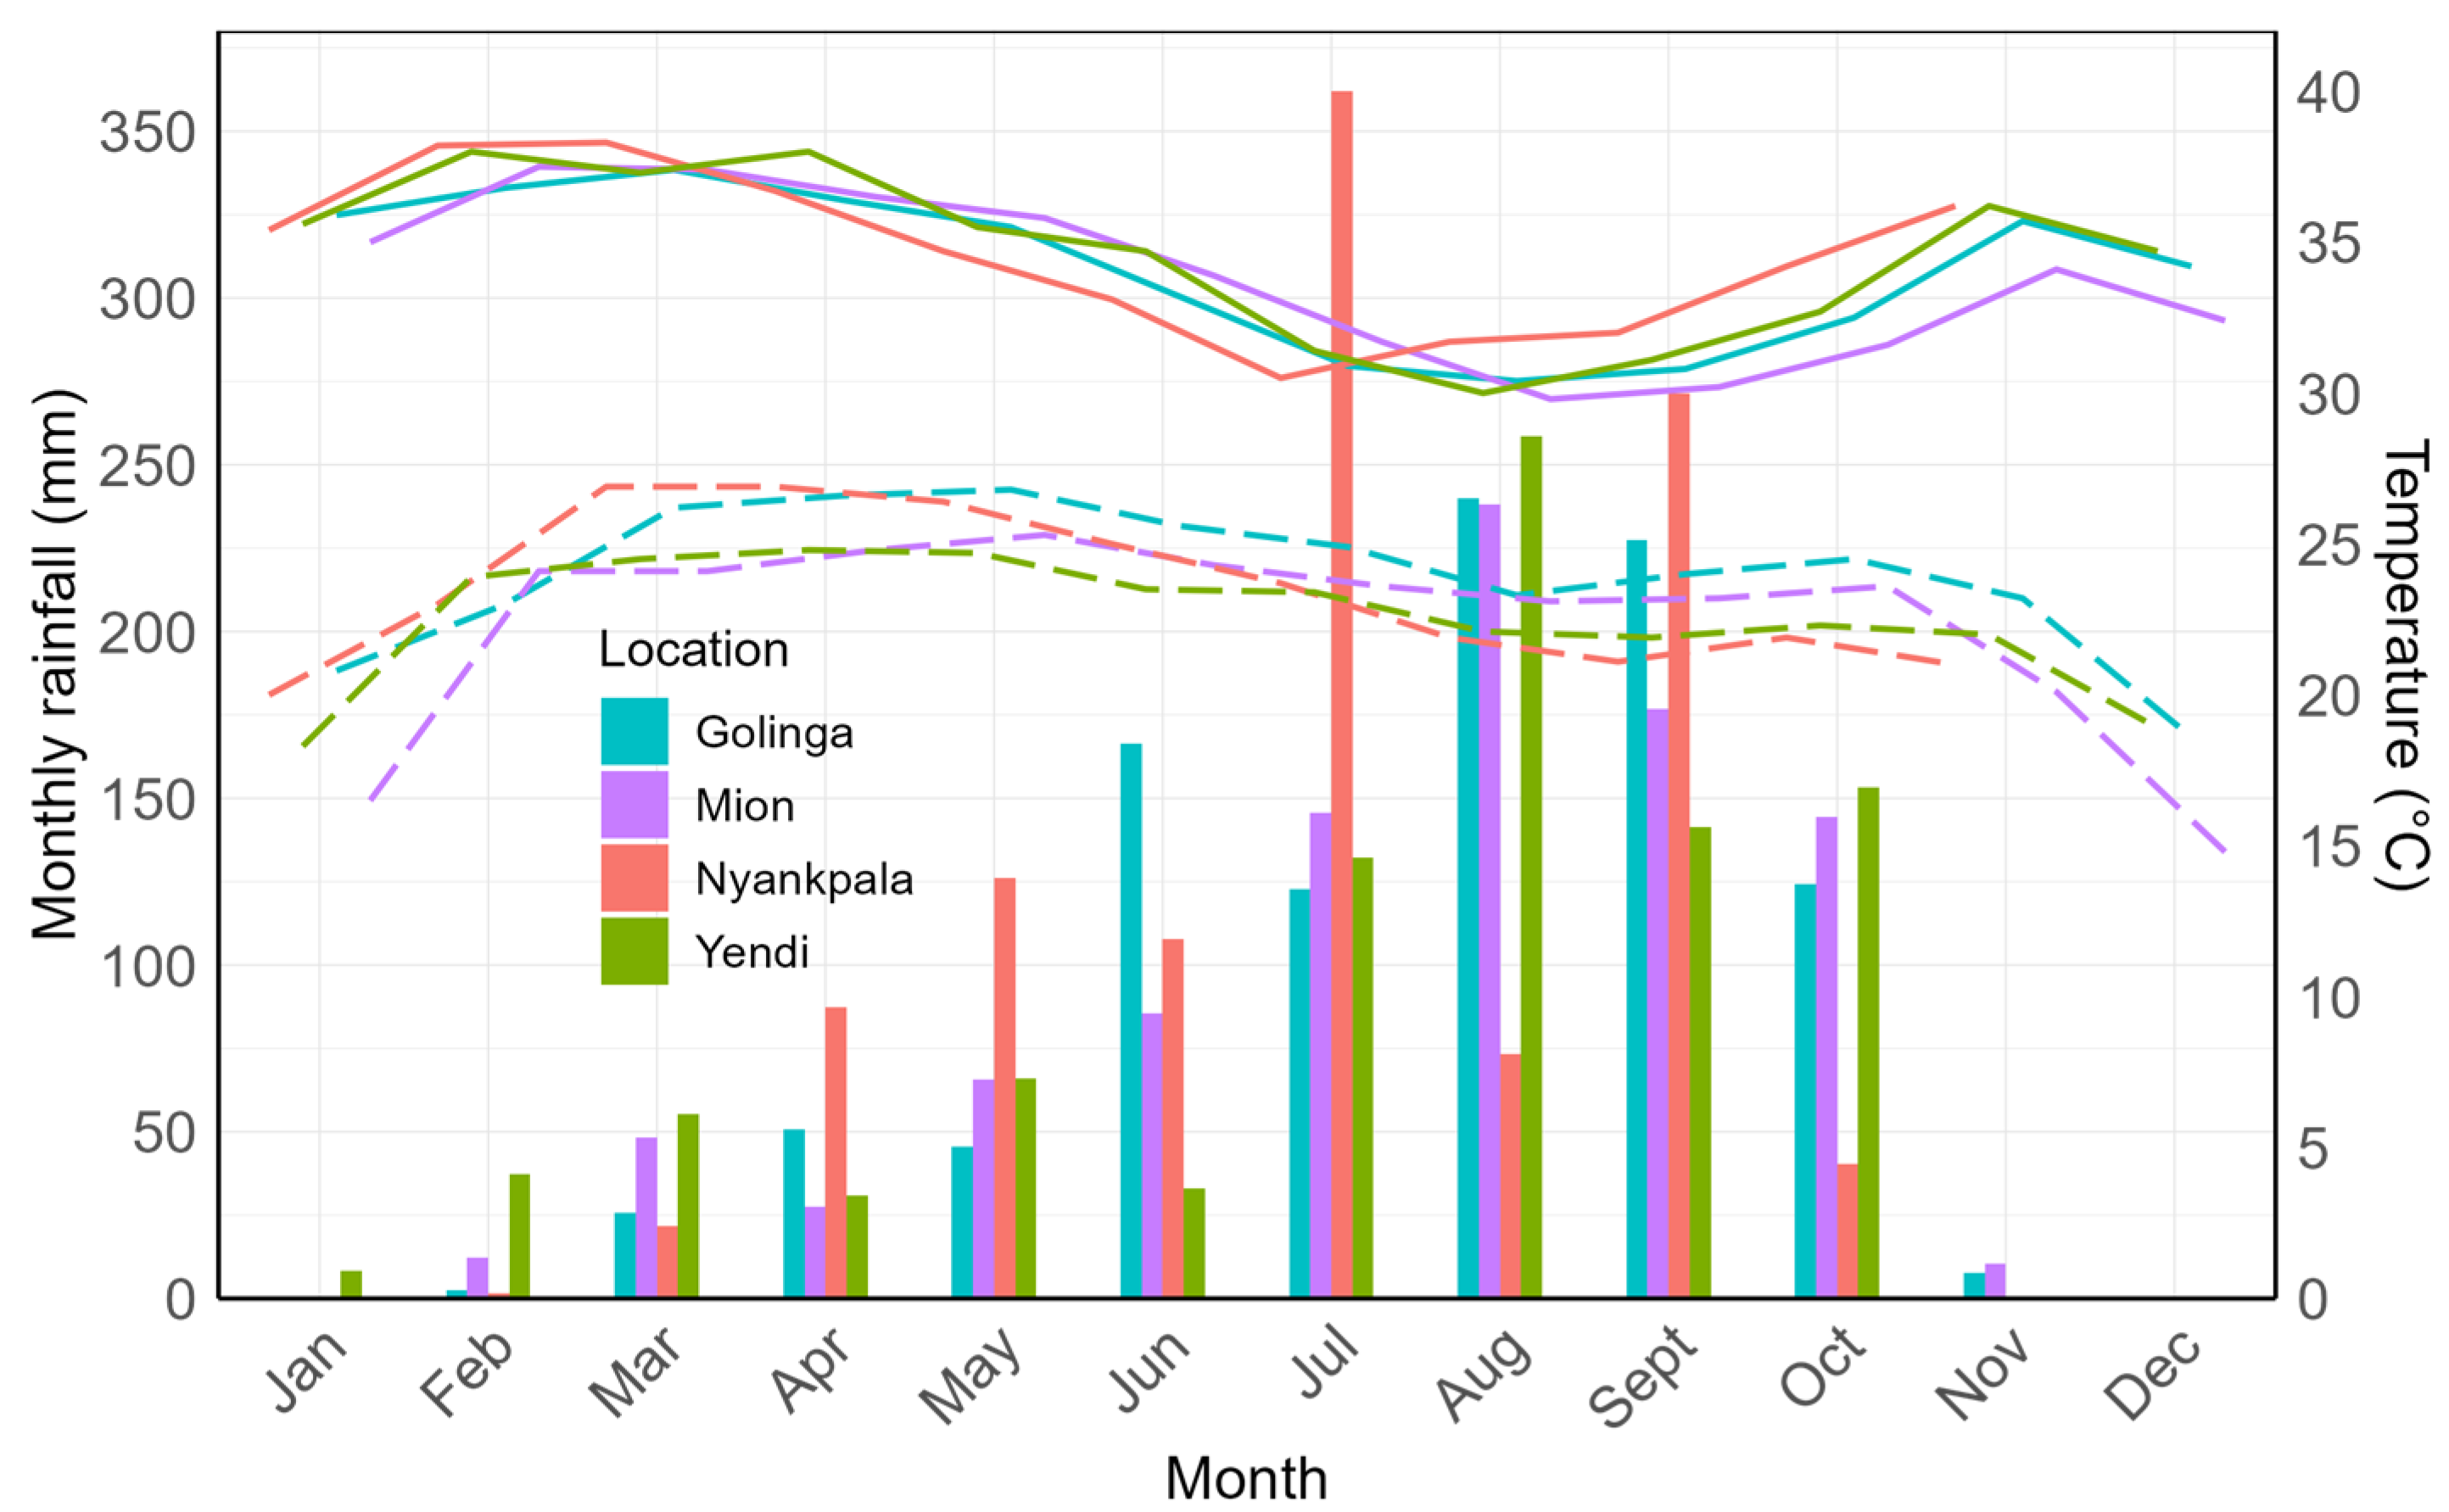
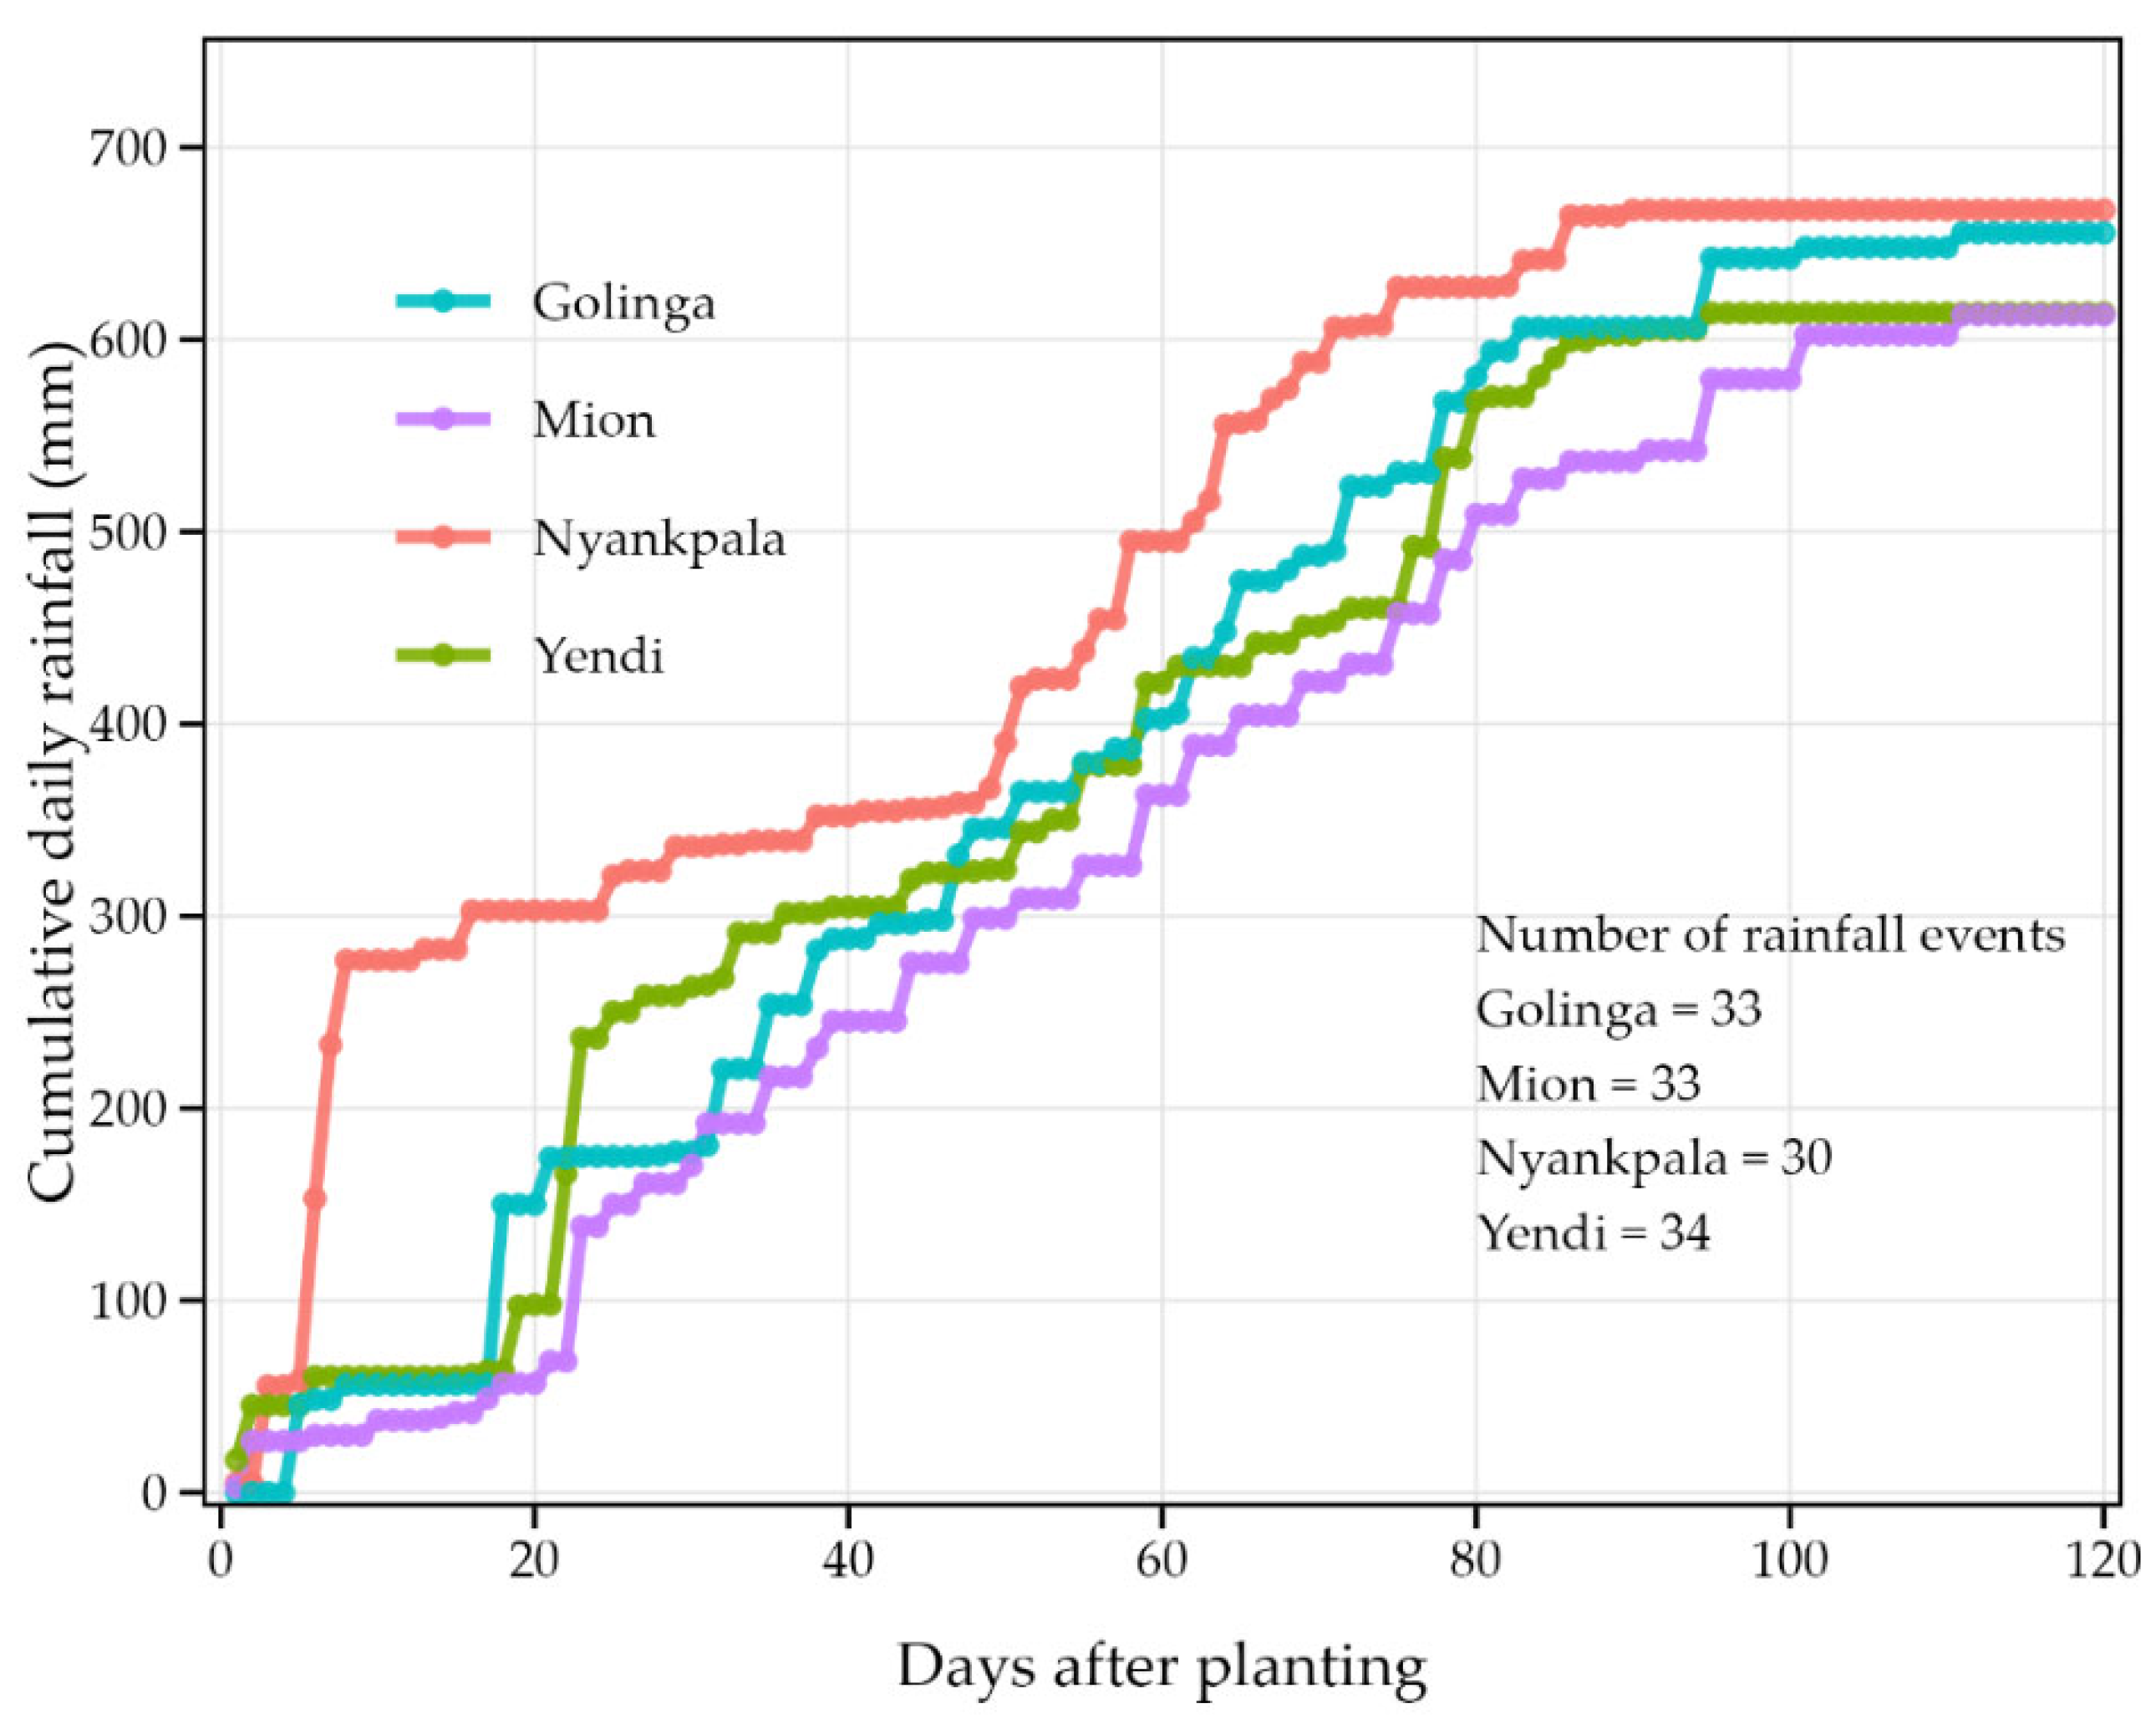
Additionally, the variations in water use efficiency across the four study locations highlight the significant influence of environmental factors on maize production. Differences in rainfall patterns, soil properties, and evapotranspiration at these sites played a key role in shaping water use efficiency [37], making location-specific responses evident. These findings emphasize the importance of tailoring fertilizer recommendations to each agroecological zone to optimize water use efficiency and maize productivity. This underscores the need for site-specific management strategies that consider both environmental conditions and maize variety characteristics.
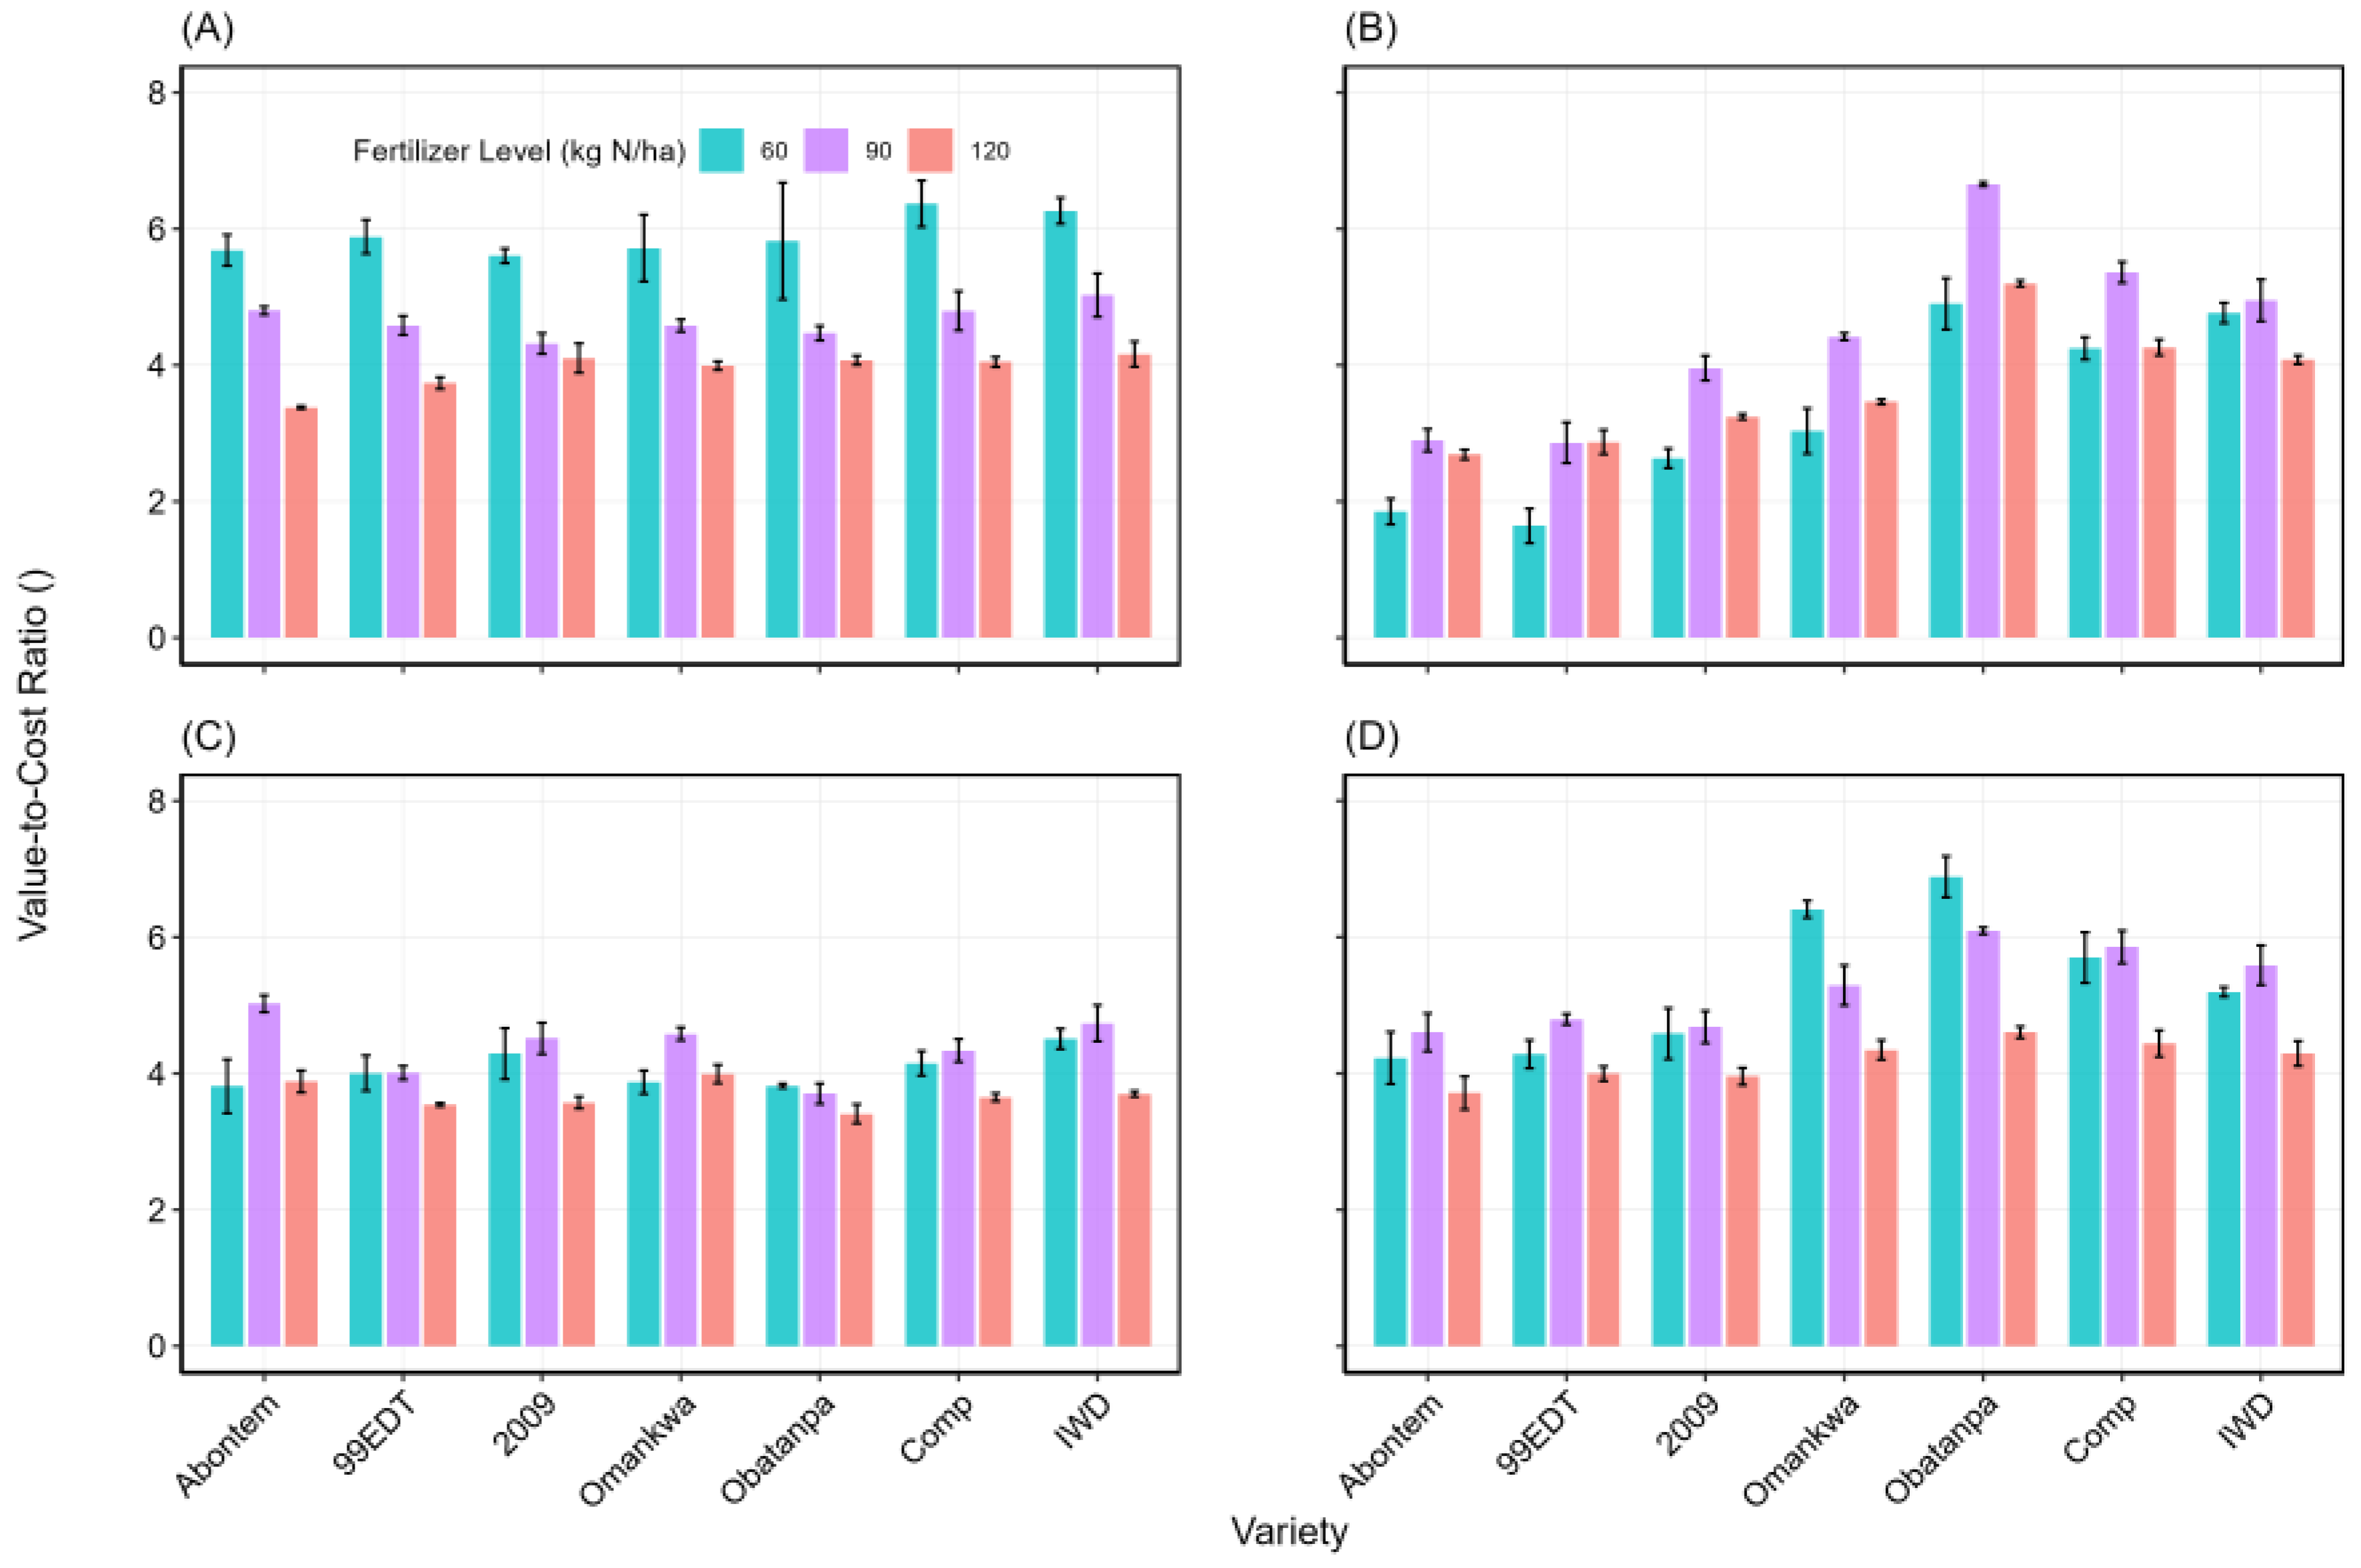
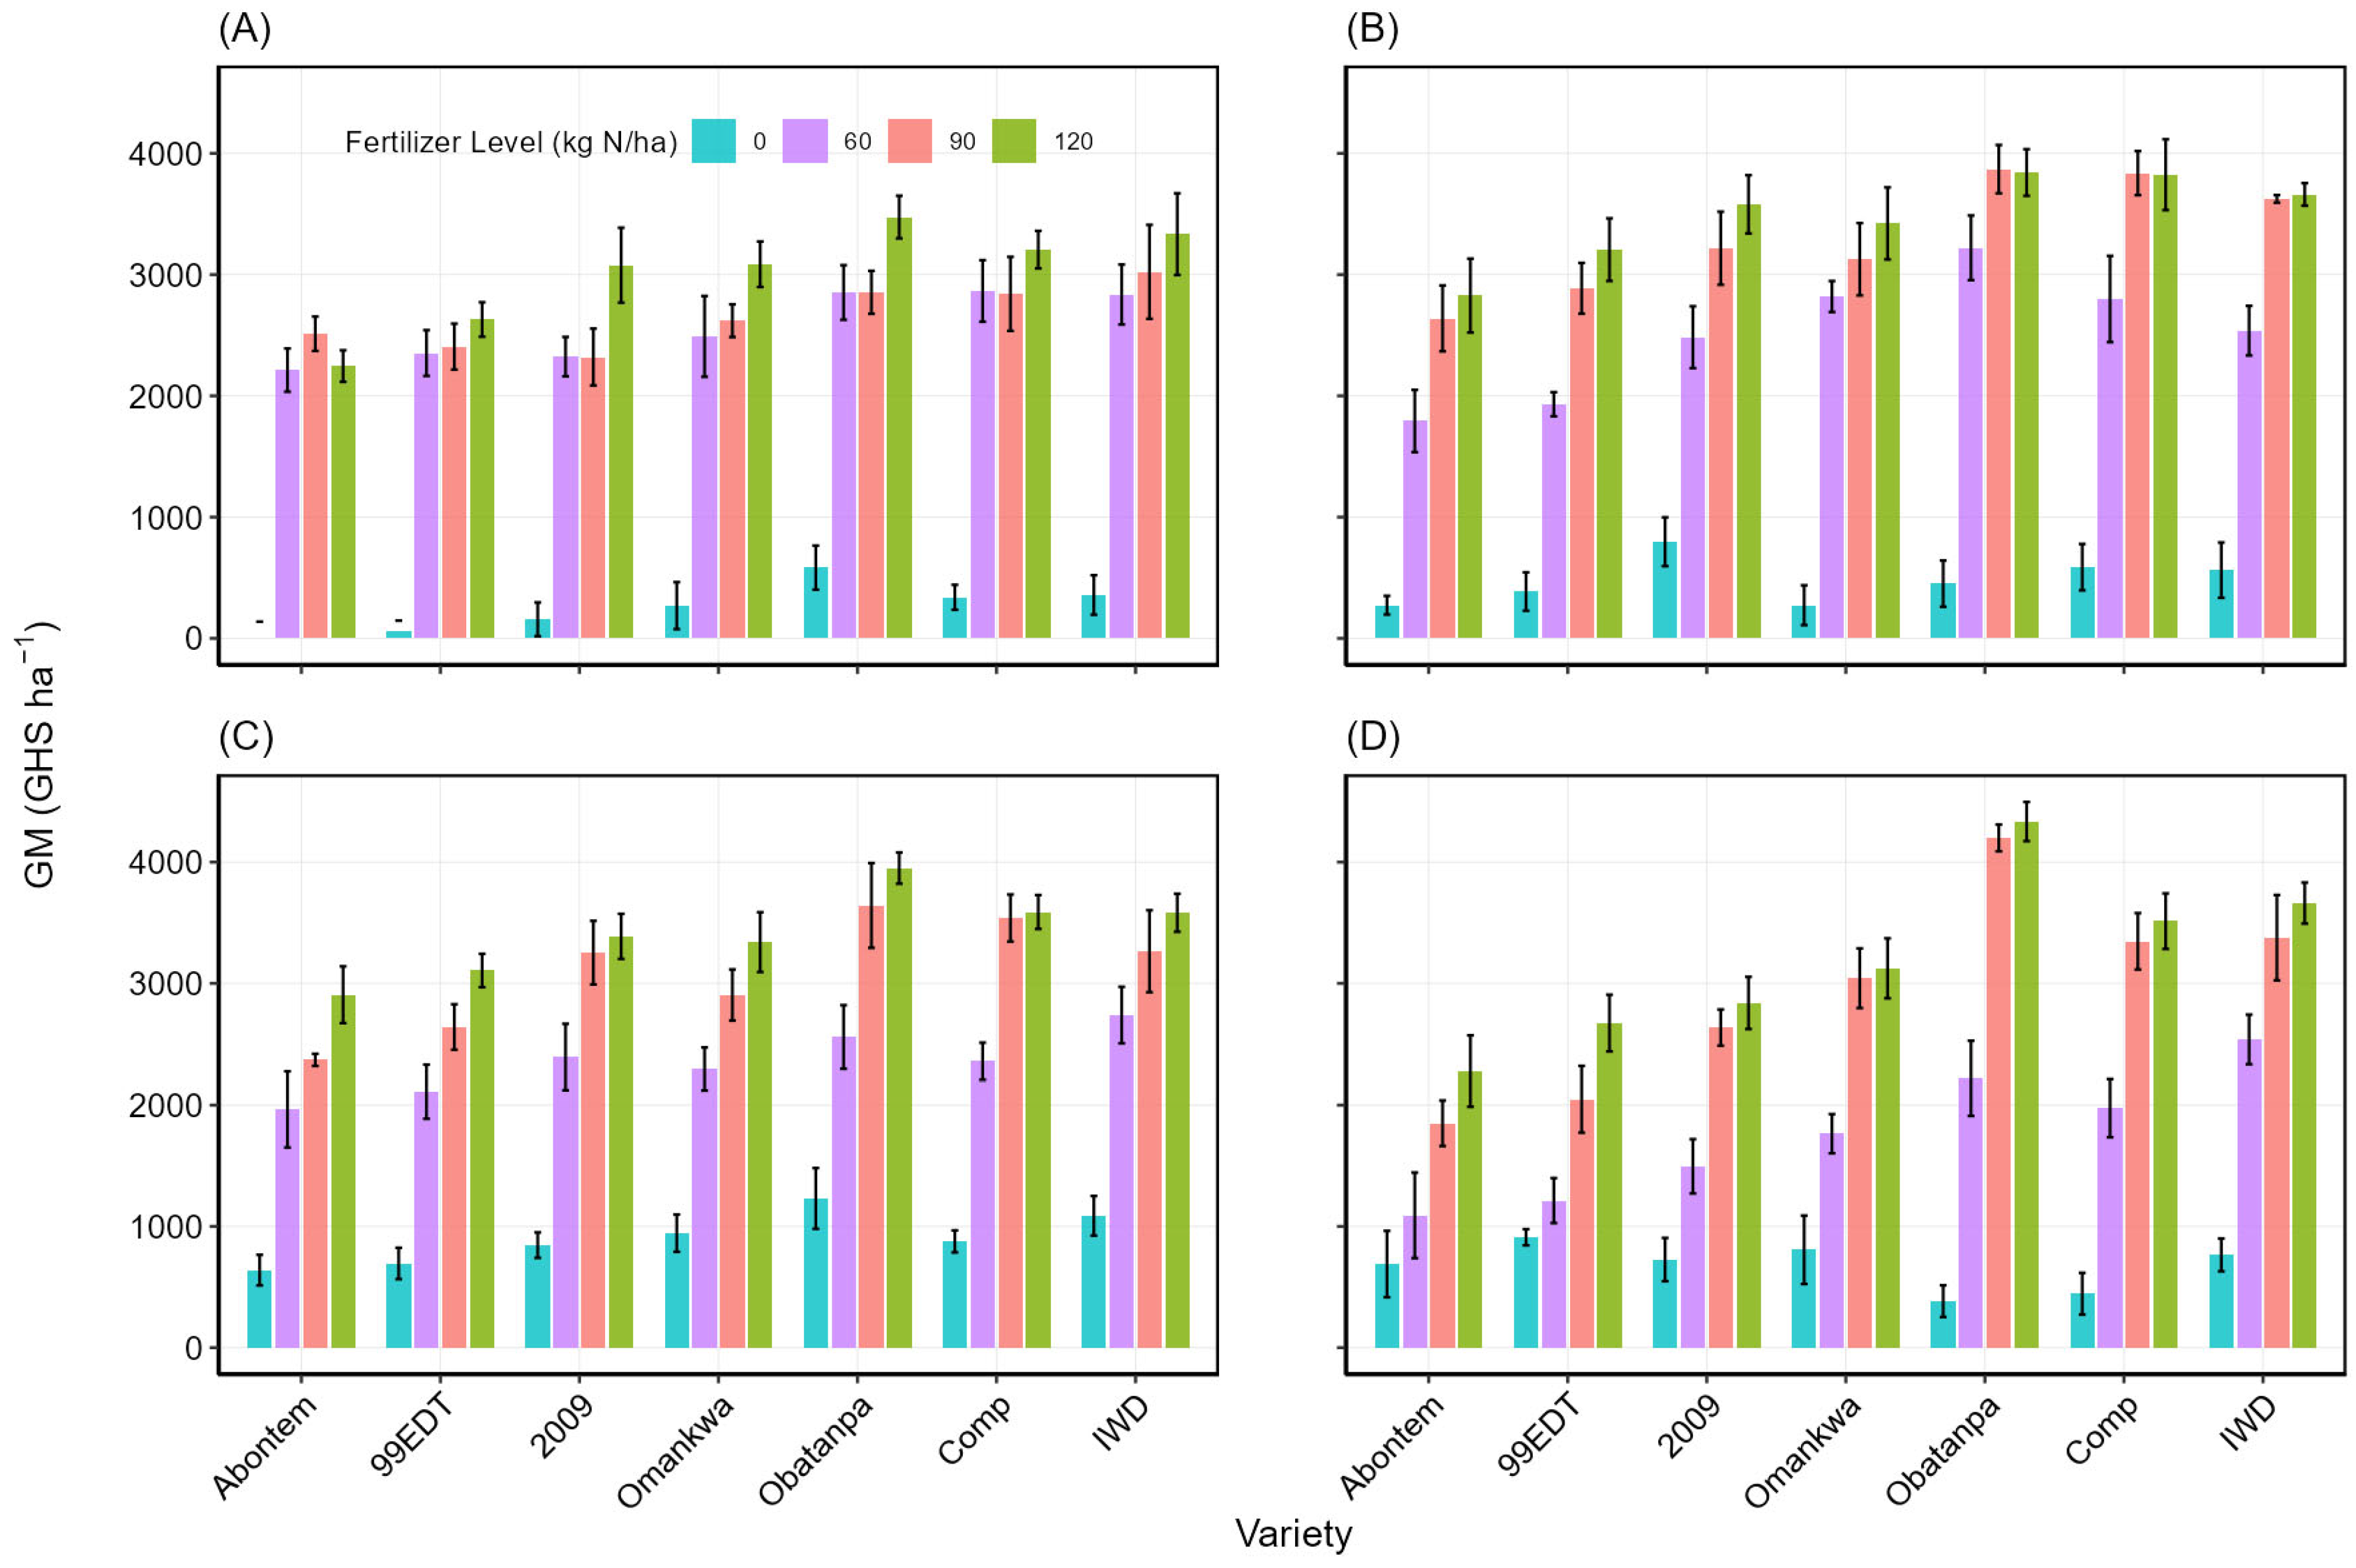
As in this study, many others have reported high profitability from inorganic fertilizer use in maize production in Ghana [8,36]. Generally, the VCR was above 2, a threshold set for risk-averse farmers to mitigate yield uncertainties, particularly associated with smallholder production systems where crop production is mainly rainfed. In spite of the high profitability presented in this study, the patronage of inorganic fertilizers for maize production remains low. Farmers who intend to sell their crops for cash are more likely to invest resources in fertilizers and other resources like irrigation, which serves as a risk-reducing strategy. Despite the benefits of nitrogen fertilization, there are key challenges that limit its widespread adoption, prominent among which is the lack of access to financial support to invest in farming, access to markets to sell produce, overbearing influences of market women who dictate unfair prices, and generally poor infrastructure in farming communities. A limitation of this study is the single-season nature of the experiments, in spite of the fact that they were conducted in 4 different locations. Thus, the effect of inter-annual variability weather, particularly rainfall, and how it impacts the response to nitrogen fertilization was not adequately captured. Future research should aim at exploring the effect of climate variability and integrated soil fertility management practices to provide a holistic approach integrating agronomic, economic, and environmental considerations while closing the maize yield gaps. This will be key to sustaining maize production, improving farmer livelihoods, and strengthening food security.

5. Conclusions

In this study, inorganic fertilizer significantly influenced the grain yield of all seven varieties of maize at all the locations, reinforcing the critical role of nitrogen fertilization in improving maize productivity, particularly in smallholder farming systems where soil fertility depletion remains a key constraint.
Intermediate maize varieties exhibited better AEN, PFPN, and WUE than extra-early varieties, with their full potential realized only under an adequate nitrogen supply. This demonstrates that maize varieties exhibit varying responses to nitrogen application, with variations in grain yield, nitrogen use efficiency (AEN), and economic performance across multiple locations, indicating that genotype-by-environment interactions significantly influence nutrient uptake and crop response to fertilizers. While the results indicate that nitrogen application can be profitable, the magnitude of returns depends on location (rainfall distribution, soil conditions) and maize variety, which emphasizes the importance of site-specific recommendations to maximize the value-cost ratio (VCR) of fertilizer investments.
Future research aimed at exploring the combined use of organic and inorganic fertilizers while accounting for the long-term effect of climate variability and soil health will provide a holistic approach integrating agronomic, economic, and environmental considerations while closing the maize yield gaps will be key to enhancing sustainable maize production, improving farmer livelihoods, and strengthening food security.

Author Contributions

Conceptualization, D.S.M. and A.Y.K.; Data curation, D.S.M., B.S.F. and D.E.D.; Formal analysis, D.S.M., B.S.F. and Y.O.K.D.; Funding acquisition, S.G.A. and A.Y.K.; Investigation, D.S.M., B.S.F., Y.O.K.D., J.K. and A.Y.K.; Methodology, D.S.M., S.G.A., D.E.D., J.K. and A.Y.K.; Project administration, D.S.M.; Resources, D.S.M. and A.Y.K.; Supervision, D.S.M., S.G.A. and A.Y.K.; Validation, D.S.M., S.G.A., J.K. and A.Y.K.; Visualization, B.S.F. and D.E.D.; Writing—original draft, D.S.M., B.S.F. and Y.O.K.D.; Writing—review and editing, D.S.M., B.S.F., Y.O.K.D., S.G.A., D.E.D., J.K. and A.Y.K. All authors have read and agreed to the published version of the manuscript.

Funding

This research was funded by CRPMAIZE, CIMMYT/CGIAR (A4032.09.34), and SARD-SC projects.

Data Availability Statement

Data are available upon reasonable request from the corresponding author.

Conflicts of Interest

The authors declare no conflicts of interest. The funders had no role in the design of the study; in the collection, analyses, or interpretation of data; in the writing of the manuscript; or in the decision to publish the results.

Abbreviations

The following abbreviations are used in this manuscript:
WUEWater use efficiency
AENAgronomic efficiency
GRGross revenue
VCRValue-to-Cost Ratio
PFPNPartial factor of productivity of nitrogen
SSASub-Sahara Africa

Appendix A

Table A1. Summary of slopes and intercepts of varieties in tested locations across levels of nitrogen for grain yield in semi-arid Ghana.
LocationVarietyEquationR2
Main effect of N 86
All locationsAll varietiesy = 25x + 1244
Interraction effect of location and variety 8
Golinga2009y = 25x + 1382
99EDTy = 23x + 1228
Abontemy = 22x + 1162
Compy = 26x + 1408
IWDy = 24x + 1533
Obatanpay = 26x + 1580
Omankway = 24x + 1374
Mion2009y = 25x + 1374
99EDTy = 25x + 1099
Abontemy = 24x + 1017
Compy = 28x + 1399
IWDy = 27x + 1328
Obatanpay = 28x + 1427
Omankway = 26x + 1233
Nyankpala2009y = 24x + 1039
99EDTy = 23x + 1020
Abontemy = 22x + 991
Compy = 25x + 1246
IWDy = 26x + 1261
Obatanpay = 25x + 1332
Omankway = 24x + 1136
Yendi2009y = 22x + 1133
99EDTy = 20x + 1106
Abontemy = 19x + 991
Compy = 26x + 1162
IWDy = 26x + 1384
Obatanpay = 31x + 1241
Omankway = 24x + 1241
Table A2. Summary of slopes and intercepts of varieties in tested locations across levels of nitrogen for agronomic efficiency (AEN) in semi-arid Ghana.
LocationVarietyEquationR2
Main effect of N10
All locationAll varietiesy = −0.080x + 34.136
Interaction effect of location and variety58
Golinga2009y = −0.068x + 32.097
99EDTy = −0.055x + 28.905
Abontemy = −0.049x + 27.156
Compy = −0.059x + 31.888
IWDy = −0.078x + 32.698
Obatanpay = −0.041x + 28.979
Omankway = −0.049x + 28.160
Mion2009y = −0.074x + 33.631
99EDTy = −0.074x + 32.005
Abontemy = −0.065x + 31.550
Compy = −0.119x + 42.778
IWDy = −0.098x + 39.210
Obatanpay = −0.170x + 50.460
Omankway = −0.150x + 45.884
Nyankpala2009y = −0.114x + 38.825
99EDTy = −0.140x + 41.666
Abontemy = −0.144x + 41.424
Compy = −0.154x + 44.785
IWDy = −0.147x + 44.571
Obatanpay = −0.126x + 40.583
Omankway = −0.124x + 40.323
Yendi2009y = −0.001x + 20.737
99EDTy = 0.041x + 12.412
Abontemy = 0.025x + 14.022
Compy = −0.054x + 32.852
IWDy = −0.081x + 35.266
Obatanpay = −0.064x + 38.880
Omankway = −0.016x + 24.061
Table A3. Summary of slopes and intercepts of varieties in tested locations across levels of nitrogen for Partial factor of productivity of nitrogen (PFPN) in semi-arid Ghana.
LocationVarietyEquationR2
Main effect of N54
All locationAll varietiesy = −0.236x + 61.810
Interaction effect of location and variety33
Golinga2009y = −0.247x + 64.089
99EDTy = −0.215x + 57.847
Abontemy = −0.204x + 55.038
Compy = −0.230x + 63.527
IWDy = −0.289x + 69.762
Obatanpay = −0.238x + 66.078
Omankway = −0.232x + 61.259
Mion2009y = −0.248x + 64.827
99EDTy = −0.182x + 54.918
Abontemy = −0.184x + 53.100
Compy = −0.287x + 71.804
IWDy = −0.254x + 66.872
Obatanpay = −0.353x + 79.773
Omankway = −0.311x + 71.492
Nyankpala2009y = −0.249x + 60.909
99EDTy = −0.285x + 63.682
Abontemy = −0.290x + 63.044
Compy = −0.331x + 72.313
IWDy = −0.319x + 71.830
Obatanpay = −0.311x + 70.964
Omankway = −0.278x + 65.030
Yendi2009y = −0.136x + 47.461
99EDTy = −0.097x + 40.861
Abontemy = −0.103x + 39.587
Compy = −0.172x + 55.960
IWDy = −0.252x + 66.024
Obatanpay = −0.162x + 59.957
Omankway = −0.162x + 52.671
Table A4. Summary of slopes and intercepts of varieties in tested locations across levels of nitrogen for water use efficiency (WUE) in semi-arid Ghana.
LocationVarietyEquationR2
Main effect of N87
All locationAll varietiesy = 0.064x + 3.548
Interaction effect of location and variety5
Golinga2009y = 0.076x + 3.548
99EDTy = 0.069x + 3.548
Abontemy = 0.070x + 3.548
Compy = 0.065x + 3.548
IWDy = 0.063x + 3.548
Obatanpay = 0.070x + 3.548
Omankway = 0.073x + 3.548
Mion2009y = 0.076x + 3.548
99EDTy = 0.069x + 3.548
Abontemy = 0.069x + 3.548
Compy = 0.069x + 3.548
IWDy = 0.064x + 3.548
Obatanpay = 0.070x + 3.548
Omankway = 0.076x + 3.548
Nyankpala2009y = 0.060x + 3.548
99EDTy = 0.058x + 3.548
Abontemy = 0.059x + 3.548
Compy = 0.055x + 3.548
IWDy = 0.055x + 3.548
Obatanpay = 0.057x + 3.548
Omankway = 0.066x + 3.548
Yendi2009y = 0.057x + 3.548
99EDTy = 0.052x + 3.548
Abontemy = 0.045x + 3.548
Compy = 0.061x + 3.548
IWDy = 0.065x + 3.548
Obatanpay = 0.073x + 3.548
Omankway = 0.064x + 3.548
Table A5. Summary of slopes and intercepts of varieties in tested locations across levels of nitrogen for Value-to-cost ratio (VCR) in semi-arid Ghana.
LocationVarietyEquationR2
Main effect of N10
All locationAll varietiesy = −0.013x + 5.570
Interaction effect of N, location and variety58
Golinga2009y = −0.011x + 5.237
99EDTy = −0.009x + 4.719
Abontemy = −0.008x + 4.435
Compy = −0.010x + 5.198
IWDy = −0.013x + 5.339
Obatanpay = −0.007x + 4.722
Omankway = −0.008x + 4.596
Mion2009y = −0.012x + 5.486
99EDTy = −0.010x + 5.217
Abontemy = −0.011x + 5.147
Compy = −0.019x + 6.976
IWDy = −0.016x + 6.393
Obatanpay = −0.028x + 8.235
Omankway = −0.025x + 7.492
Nyankpala2009y = −0.019x + 6.341
99EDTy = −0.023x + 6.811
Abontemy = −0.024x + 6.775
Compy = −0.025x + 7.319
IWDy = −0.024x + 7.280
Obatanpay = −0.021x + 6.629
Omankway = −0.020x + 6.587
Yendi2009y = −0.000x + 3.380
99EDTy = 0.007x + 2.023
Abontemy = 0.004x + 2.290
Compy = −0.009x + 5.349
IWDy = −0.013x + 5.751
Obatanpay = −0.010x + 6.319
Omankway = −0.003x + 3.920
Table A6. Summary of slopes and intercepts of varieties in tested locations across levels of nitrogen for gross revenue (GR) in semi-arid Ghana.
LocationVarietyEquationR2
Main effect of N79
All locationAll varietiesy = 23x + 715
Interaction effect of location and variety11
Golinga2009y = 24x + 787
99EDTy = 21x + 680
Abontemy = 20x + 629
Compy = 26x + 818
IWDy = 25x + 865
Obatanpay = 27x + 913
Omankway = 23x + 764
Mion2009y = 25x + 795
99EDTy = 22x + 642
Abontemy = 20x + 576
Compy = 28x + 852
IWDy = 26x + 800
Obatanpay = 29x + 876
Omankway = 25x + 738
Nyankpala2009y = 21x + 600
99EDTy = 20x + 572
Abontemy = 19x + 541
Compy = 24x + 721
IWDy = 24x + 740
Obatanpay = 24x + 769
Omankway = 22x + 654
Yendi2009y = 20x + 613
99EDTy = 17x + 562
Abontemy = 15x + 486
Compy = 25x + 702
IWDy = 26x + 811
Obatanpay = 30x + 818
Omankway = 22x + 693

References

  1. Van Ittersum, M.K.; Van Bussel, L.G.; Wolf, J.; Grassini, P.; Van Wart, J.; Guilpart, N.; Claessens, L.; De Groot, H.; Wiebe, K.; Mason-D’Croz, D. Can Sub-Saharan Africa Feed Itself? Proc. Natl. Acad. Sci. USA 2016, 113, 14964–14969. [Google Scholar] [CrossRef] [PubMed]
  2. Ekpa, O.; Palacios-Rojas, N.; Kruseman, G.; Fogliano, V.; Linnemann, A.R. Sub-Saharan African Maize-Based Foods-Processing Practices, Challenges and Opportunities. Food Rev. Int. 2019, 35, 609–639. [Google Scholar] [CrossRef]
  3. Erenstein, O.; Jaleta, M.; Sonder, K.; Mottaleb, K.; Prasanna, B.M. Global maize production, consumption and trade: Trends and R&D im-plications. Food Secur. 2022, 14, 1295–1319. [Google Scholar] [CrossRef]
  4. MacCarthy, D.S.; Adiku, S.G.; Freduah, B.S.; Gbefo, F.; Kamara, A.Y. Using CERES-Maize and ENSO as Decision Support Tools to Evaluate Climate-Sensitive Farm Management Practices for Maize Production in the Northern Regions of Ghana. Front. Plant Sci. 2017, 8, 31. [Google Scholar] [CrossRef] [PubMed]
  5. Uwiragiye, Y.; Ngaba, M.J.Y.; Yang, M.; Elrys, A.S.; Chen, Z.; Zhou, J. Spatially Explicit Soil Acidification under Optimized Fertilizer Use in Sub-Saharan Africa. Agronomy 2023, 13, 632. [Google Scholar] [CrossRef]
  6. Zou, Y.; Li, L.; Wang, Y.; Duan, R.; Dong, H.; Zhang, Y.; Du, Z.; Chen, F. Growth and Yield of Maize in Response to Reduced Fertilizer Application and Its Impacts on Population Dynamics and Community Biodiversity of Insects and Soil Microbes. Front. Plant Sci. 2024, 15, 1362905. [Google Scholar] [CrossRef] [PubMed]
  7. Asei, R.; Abaidoo, R.C.; Opoku, A.; Adjei-Nsiah, S. Nutrient Inputs for Rehabilitation of Non-Responsive Soils in the Guinea and Sudan Savannah Agroecological Zones of Ghana: Impact on Grain Yield and Soil Quality. Front. Sustain. Food Syst. 2022, 6, 796878. [Google Scholar] [CrossRef]
  8. Adzawla, W.; Setsoafia, E.D.; Setsoafia, E.D.; Amoabeng-Nimako, S.; Atakora, W.K.; Camara, O.; Jemo, M.; Bindraban, P.S. Fertilizer Use Efficiency and Economic Viability in Maize Production in the Savannah and Transitional Zones of Ghana. Front. Sustain. Food Syst. 2024, 8, 1340927. [Google Scholar] [CrossRef]
  9. Adu, G.; Alidu, H.; Amegbor, I.; Abdulai, M.; Nutsugah, S.; Obeng-Antwi, K.; Kanton, R.; Buah, S.; Kombiok, M.; Abudulai, M. Performance of Maize Populations under Different Nitrogen Rates in Northern Ghana. Ann. Agric. Sci. 2018, 63, 145–152. [Google Scholar] [CrossRef]
  10. Boullouz, M.; Bindraban, P.S.; Kissiedu, I.N.; Kouame, A.K.; Devkota, K.P.; Atakora, W.K. An Integrative Approach Based on Crop Modeling and Geospatial and Statistical Analysis to Quantify and Explain the Maize (Zea mays) Yield Gap in Ghana. Front. Soil Sci. 2022, 2, 1037222. [Google Scholar] [CrossRef]
  11. Kassim, Y.B.; Pinto Espinosa, F.; MacCarthy, D.S.; Bindraban, P.; Chirinda, N.; Stomph, T.; Struik, P.C. Can Drone Images Predict Within-Field Variability in Soil Fertility?-A Case Study in the Northern Region of Ghana. Front. Soil Sci. 2025, 5, 1548645. [Google Scholar] [CrossRef]
  12. Sileshi, G.W.; Kihara, J.; Tamene, L.; Vanlauwe, B.; Phiri, E.; Jama, B. Unravelling Causes of Poor Crop Response to Applied N and P Fertilizers on African Soils. Exp. Agric. 2022, 58, e7. [Google Scholar] [CrossRef]
  13. Zhang, F.-L.; Niu, X.-K.; Zhang, Y.-M.; Xie, R.-Z.; Xin, L.; Li, S.-K.; Gao, S.-J. Studies on the Root Characteristics of Maize Varieties of Different Eras. J. Integr. Agric. 2013, 12, 426–435. [Google Scholar] [CrossRef]
  14. Chen, Y.; Xiao, C.; Chen, X.; Li, Q.; Zhang, J.; Chen, F.; Yuan, L.; Mi, G. Characterization of the Plant Traits Contributed to High Grain Yield and High Grain Nitrogen Concentration in Maize. Field Crops Res. 2014, 159, 1–9. [Google Scholar] [CrossRef]
  15. Qiang, S.; Zhang, Y.; Fan, J.; Zhang, F.; Xiang, Y.; Yan, S.; Wu, Y. Maize Yield, Rainwater and Nitrogen Use Efficiency as Affected by Maize Genotypes and Nitrogen Rates on the Loess Plateau of China. Agric. Water Manag. 2019, 213, 996–1003. [Google Scholar] [CrossRef]
  16. MacCarthy, D.S.; Adiku, S.G.K.; Kamara, A.Y.; Freduah, B.S.; Kugbe, J.X. The Role of Crop Simulation Modeling in Managing Fertilizer Use in Maize Production Systems in Northern Ghana. In Enhancing Agricultural Research and Precision Management for Subsistence Farming by Integrating System Models with Experiments; Timlin, D.J., Anapalli, S.S., Eds.; Wiley: Hoboken, NJ, USA, 2022; pp. 48–68. ISBN 978-0-89118-390-7. [Google Scholar]
  17. Incoom, A.B.M.; Adjei, K.A.; Odai, S.N. Rainfall Variabilities and Droughts in the Savannah Zone of Ghana from 1960–2015. Sci. Afr. 2020, 10, e00571. [Google Scholar] [CrossRef]
  18. Day, P.R. Particle Fractionation and Particle-size Analysis. In Methods of Soil Analysis: Part 1 Physical and Mineralogical Properties, Including Statistics of Measurement and Sampling; Wiley: Hoboken, NJ, USA, 1965; Volume 9, pp. 545–567. [Google Scholar]
  19. Bates, D.; Maechler, M.; Bolker, B.; Walker, S.; Christensen, R.H.B.; Singmann, H.; Dai, B.; Scheipl, F.; Grothendieck, G.; Green, P.; et al. Lme4: Linear Mixed-Effects Models Using “Eigen” and S4. 2019. Available online: https://CRAN.R-project.org/package=lme4 (accessed on 19 June 2025).
  20. Fox, J.; Weisberg, S.; Price, B.; Adler, D.; Bates, D.; Baud-Bovy, G.; Bolker, B.; Ellison, S.; Firth, D.; Friendly, M.; et al. Car: Companion to Applied Regression. An R Companion to Applied Regression, Third Edition, Sage, 2019. Available online: https://cran.r-project.org/web/packages/car/index.html. (accessed on 19 June 2025).
  21. R Core Team R: A Language and Environment for Statistical Computing 2025. Available online: https://www.R-project.org/ (accessed on 19 June 2025).
  22. Abera, T.; Debele, T.; Wegary, D. Effects of Varieties and Nitrogen Fertilizer on Yield and Yield Components of Maize on Farmers Field in Mid Altitude Areas of Western Ethiopia. Int. J. Agron. 2017, 2017, 4253917. [Google Scholar] [CrossRef]
  23. MacCarthy, D.S.; Adam, M.; Freduah, B.S.; Fosu-Mensah, B.Y.; Ampim, P.A.; Ly, M.; Traore, P.S.; Adiku, S.G. Climate Change Impact and Variability on Cereal Productivity among Smallholder Farmers under Future Production Systems in West Africa. Sustainability 2021, 13, 5191. [Google Scholar] [CrossRef]
  24. Rawal, N.; Vista, S.P.; Khadka, D.; Paneru, P. Grain Yield, Nitrogen Accumulation, and Its Use Efficiency of Maize (Zea mays L.) as Influenced by Varying Nitrogen Rates. Int. J. Agron. 2024, 2024, 4104123. [Google Scholar] [CrossRef]
  25. Tahiru, F.; Fosu, M.; Gaiser, T.; Becker, M.; Inusah, B.I.; Mutari, A.; Buah, S.; Atakora, W.K.; Mohammed, A.M. Fertilizer and Genotype Effects on Maize Production on Two Soils in the Northern Region of Ghana. Sustain. Agric. Res. 2015, 4. [Google Scholar] [CrossRef]
  26. Njoroge, S.; Haruna, A.; Mohammed, A.M.; Aziz, A.L.A.; Zingore, S. Maize Cropping Guide 4R Nutrient Management and Best Agronomic Practices Northern Ghana; African Plant Nutrition Institute (APNI), Benguérir, Morocco and CSIR—Savanna Agricultural Research Institute (SARI): Nyankpala, Ghana, 2023. [Google Scholar]
  27. Atakora, W.K.; Kwakye, P.K.; Weymann, D.; Brüggemann, N. Stimulus of Nitrogen Fertilizers and Soil Characteristics on Maize Yield and Nitrous Oxide Emission from Ferric Luvisol in the Guinea Savanna Agro-Ecological Zone of Ghana. Sci. Afr. 2019, 6, e00141. [Google Scholar] [CrossRef]
  28. Tetteh, F.; Larbi, A.; Nketia, K.A.; Senayah, J.K.; Hoeschle-Zeledon, I.; Abdulrahman, N. Suitability of Soils for Cereal Cropping in Northern Ghana; International Institute of Tropical Agriculture (IITA): Ibadan, Nigeria, 2016; Available online: https://hdl.handle.net/10568/96198 (accessed on 19 June 2025).
  29. Aigbe, U.; Ewansiha, S.; Osaigbovo, A.; Meseka, S. Agronomic Performance of Maize of Contrasting Maturities at Varying Rates of Nitrogen Fertilizer Application in a Tropical Rainforest Agroecology. Agro-Science 2023, 22, 23–28. [Google Scholar] [CrossRef]
  30. Boateng, A.S.; Afreh, D.N.; Asomaning, S.K.; Adarkwah, C.; Adjei, R.R.; Santo, K.G.; Sarkodie-Addo, J. Yield and Nitrogen Use Efficiency of Maize (Zea mays L.) Following the Application of Various Nitrogen Sources under Rainfed Conditions in the Bono Region of Ghana. Agric. Sci. Dig.-A Res. J. 2023, 43, 306–310. [Google Scholar] [CrossRef]
  31. van Grinsven, H.J.; Ebanyat, P.; Glendining, M.; Gu, B.; Hijbeek, R.; Lam, S.K.; Lassaletta, L.; Mueller, N.D.; Pacheco, F.S.; Quemada, M. Establishing Long-Term Nitrogen Response of Global Cereals to Assess Sustainable Fertilizer Rates. Nat. Food 2022, 3, 122–132. [Google Scholar] [CrossRef]
  32. Triveni, U.; Rani, Y.S.; Patro, T.; Anuradha, N.; Divya, M. Fertilizer Responsiveness of Short Duration Improved Finger Millet Genotypes to Different Levels of NPK Fertilizers. Indian J. Agric. Res. 2018, 52, 97–100. [Google Scholar] [CrossRef]
  33. Anami, S.; De Block, M.; Machuka, J.; Van Lijsebettens, M. Molecular Improvement of Tropical Maize for Drought Stress Tolerance in Sub-Saharan Africa. Crit. Rev. Plant Sci. 2009, 28, 16–35. [Google Scholar] [CrossRef]
  34. Yokamo, S.; Irfan, M.; Huan, W.; Wang, B.; Wang, Y.; Ishfaq, M.; Lu, D.; Chen, X.; Cai, Q.; Wang, H. Global Evaluation of Key Factors Influencing Nitrogen Fertilization Efficiency in Wheat: A Recent Meta-Analysis (2000–2022). Front. Plant Sci. 2023, 14, 1272098. [Google Scholar] [CrossRef]
  35. Fixen, P.; Brentrup, F.; Bruulsema, T.; Garcia, F.; Norton, R.; Zingore, S. Nutrient/Fertilizer Use Efficiency: Measurement, Current Situation and Trends. Manag. Water Fertil. Sustain. Agric. Intensif. 2015, 270, 1–30. [Google Scholar]
  36. Ragasa, C.; Chapoto, A. Moving in the Right Direction? The Role of Price Subsidies in Fertilizer Use and Maize Productivity in Ghana. Food Secur. 2017, 9, 329–353. [Google Scholar] [CrossRef]
  37. Yin, R.; Gu, X.; Cheng, Z.; Li, W.; Wang, Y.; Zhao, T.; Cai, W.; Du, Y.; Cai, H. Optimizing Nitrogen Application Patterns and Amounts to Improve Maize Yield and Water-Nitrogen Use Efficiencies in the Loess Plateau of China: A Meta-Analysis. Field Crops Res. 2024, 318, 109599. [Google Scholar] [CrossRef]
Figure 1. Map of Ghana showing the study sites.
Nitrogen 06 00048 g001
Figure 2. Observed rainfall (bars), and maximum and minimum temperatures (solid and dashed lines, respectively) for the locations in the experimental year (2016).
Nitrogen 06 00048 g002
Figure 3. Cumulative daily rainfall distribution and number of rainfall events at each location during the growing season (2016).
Nitrogen 06 00048 g003
Figure 4. The trend in grain yield in response to nitrogen fertilizer applied at the different locations for the seven different maize varieties where the regression line for the extra early and early are shown in (a) and those of the intermediate maturing (b) duration varieties. Each panel contains maize yield data points in response to nitrogen fertilizer in all locations to facilitate easy comparison in yield response between locations.
Nitrogen 06 00048 g004
Figure 5. Agronomic efficiency of nitrogen fertilizer for the different varieties at varying nitrogen rates and different locations. (AD) are Nyankpala, Yendi, Golinga and Mion, respectively.
Nitrogen 06 00048 g005
Figure 6. The partial factor productivity of nitrogen for the different varieties at Nyankpala (A), Yendi (B), Golinga (C) and Mion (D).
Nitrogen 06 00048 g006
Figure 7. Water use efficiency of different maize varieties at varying nitrogen rates and different locations. (AD) are Nyankpala, Yendi, Golinga and Mion, respectively.
Nitrogen 06 00048 g007
Figure 8. Value to cost ratio of using different rates of nitrogen fertilizer for different varieties and at different locations in the northern region of Ghana. (AD) are Nyankpala, Yendi, Golinga and Mion, respectively.
Nitrogen 06 00048 g008
Figure 9. Gross Revenue (GR) was obtained by using different rates of nitrogen fertilizer for different varieties at Nyankpala (A), Yendi (B), Golinga (C), and Mion (D) in the northern region of Ghana.
Nitrogen 06 00048 g009
Table 1. Selected physical and chemical properties of the soils in the four study locations in semi-arid Ghana. L, BD, and OC represent depth, bulk density and organic carbon, respectively.
LocationLBDSiltClayOCSoil pH
cmg/cm3%%%
Yendi151.6110300.76.2
301.6110300.665.3
451.6110300.585.5
Nyankpala151.39718.20.416.2
301.5911.324.50.326.2
451.591527.90.285.8
Mion151.4928320.76.6
301.5122300.56.2
451.5329180.45.8
Golinga151.492832.20.86.4
301.523290.66.2
451.529180.55.8
Table 2. Influence of location, nitrogen applied, variety, and interaction of these factors on grain yield.
VariablesSources of Variation (p Values)
Location (L)N Rate (N)Variety (V)L × NL × VN × VL × N × V
Grain yield (kg ha−1)ns<0.001<0.001<0.010ns<0.001<0.050
WUE (kg grain mm−1 water)<0.001<0.001<0.001<0.001<0.001ns<0.001
AEN (kg grain kg−1 N applied)<0.001<0.001<0.001<0.001<0.001<0.050<0.001
PFPN (kg grain kg−1 N applied)<0.050<0.001<0.001<0.001<0.001<0.001<0.001
GR (GHS ha−1)ns<0.001<0.001<0.001ns<0.001<0.010
VCR (-)<0.001<0.001<0.001<0.001<0.001<0.050<0.001
ns means not significant.
Disclaimer/Publisher’s Note: The statements, opinions and data contained in all publications are solely those of the individual author(s) and contributor(s) and not of MDPI and/or the editor(s). MDPI and/or the editor(s) disclaim responsibility for any injury to people or property resulting from any ideas, methods, instructions or products referred to in the content.

