1. Introduction
Recent issues in agriculture like food security and low crop productivity are linked with integrated nutrient management. The application of balanced nutrients at a proper dose is essential for higher crop yield [
1]. Nitrogen is a key nutrient for proper plant growth, being an important component of amino acids, proteins, enzymes and chlorophyll [
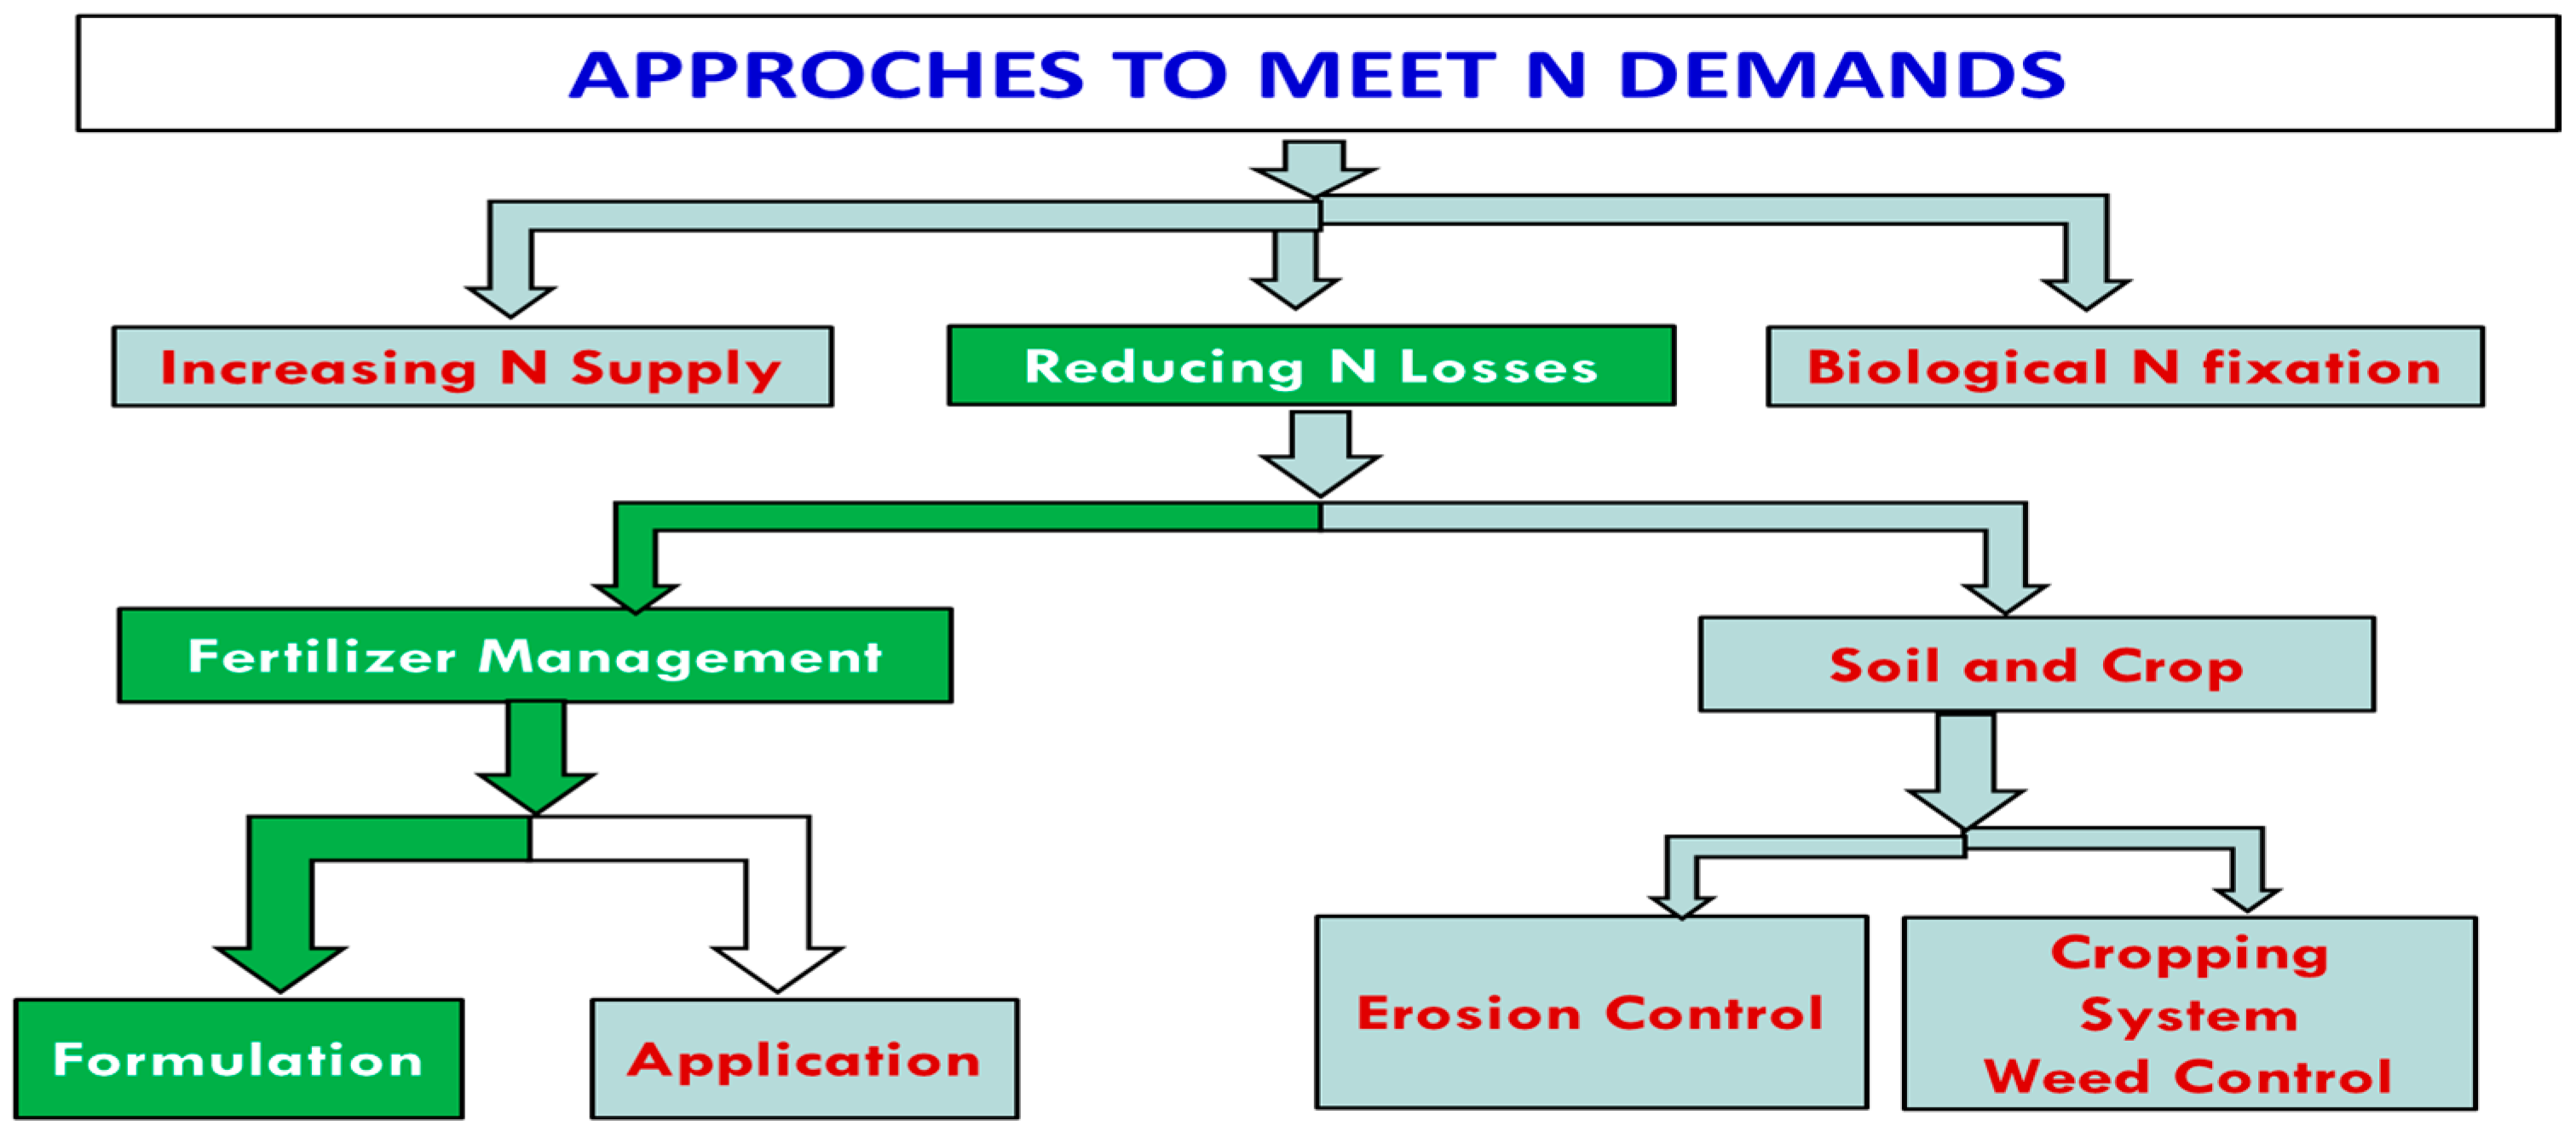
2]. Demand for N can be managed by increasing the supply of N or decreasing N losses or adding more N through biological fixation (
Figure 1). It is reported that losses of N can be reduced through proper management of soil, crop and fertilizer [
3].
In addition to this, inclusion of restorative crops and soil management by adoption of erosion control measures prevent loss of productive soil layer [
4]. The application of fertilizer at a proper depth and at the proper time is an important factor to meet N demand of the crop [
5]. However, modifications in the formulation of fertilizer were effective to meet N demand and to enhance nutrient use efficiency of the fertilizer [
6].
A major portion (40% to 70%) of N is lost as a result of volatilization and leaching resulting in low nutrient use efficiency of N fertilizer [
7]. So, it is required to develop a new designer or smart N fertilizer technology to meet crop needs without polluting the environment. A lot of work was carried out for the development of fertilizers from 1950 to 1970. Now, work is being conducted on developing new products by using alternate sources of nutrients and the use of mineral with fertilizers.
Use of aluminosilicates with urea is an effective approach to reduce losses of N fertilizers. Zeolites can be used as a carrier and dispenser of plant nutrients. Zeolites are used for better crop production due to their ability to decrease leaching losses [
8]. However, sole zeolites cannot fulfill nutrient demands of a crop but, when these are applied in combination with fertilizers, they enhance nutrient use efficiency by slow releasing.
Zeolites enhance the nutrient use efficiencies of macro- as well as micronutrients when used with fertilizers. Grain yield and biological yield of brassica increased by 43.8% and 73.9% when zeolite 15 t ha
−1 was applied with 0.1% zinc sulfate [
9].
Efficiency of nitrogenous fertilizer can be enhanced by modifying the nutrient release patterns. Coating urea with suitable materials decreases its solubility. Coating urea prills significantly slowed down the process of urea release in soil [
10]. Nonuniformity of coating film makes it easy to break, leading to quick release of the material. Similarly high cost and non-biodegradability of coating materials are major drawbacks for the coating of urea [
11]. It is the need of the hour for the formulation of blends of urea [
12]. Impregnation of urea with zeolite is a simple and low-cost technique.
Zeolitic fertilizer supplies N for a longer period of time, so even a reduced dose of N from zeolitic fertilizer produces a similar effect to that of conventional fertilizer. Application of 75% N from zeolitic fertilizer gave a similar nutrient uptake, plant biomass and grain yield to that of 100% N from urea fertilizer applied in maize crop under acidic soil conditions [
13]. Limited information is available in the literature about the efficiency and retention of urea-impregnated zeolite in soil and its availability to plants. So, this study was designed to evaluate effect of zeolite-blended N fertilizer on soil N retention and crop yield of wheat.
2. Materials and Methods
In order to prepare zeolitic urea fertilizer, natural zeolite was obtained from Mehran mining company, Peshawar. It was grinded and passed through 60-mesh sieves. Twenty parts of urea fertilizer and one part of water was mixed on weight basis and heated at 105 °C to 115 °C to change into molten form. Grinded zeolite at 1:1 of the liquefied mixture on weight basis was added and mixed until the liquefied material was completely absorbed by zeolite. Then, temperature was lowered to solidify the mixture [
14].
Zeolitic urea was applied in a two-year field experiment with wheat variety Faisalabad 08 as the test crop as a source of N in addition to urea. N was applied at 114 kg ha
−1 in sandy clay loam soil (pH
1:2.5 = 7.9, total N (%) = 0.04, NO
3-N (mg kg
−1) = 3.7, Olsen P (mg kg
−1) = 7.7, extractable K (mg kg
−1) = 84). Treatments were applied in 4 m × 3 m plots according to Randomized Complete Block Design (RCBD) and replicated thrice. Details of treatments are presented in
Table 1.
Soil was collected from the field at tillering, booting and maturity stages to analyze for total N, nitrate-N and ammonium-N. Nitrate-N was determined by following the method of Cataldo et al., 1975 [
15], while ammonium-N was determined by following that of Anderson and Ingram, 1993 [
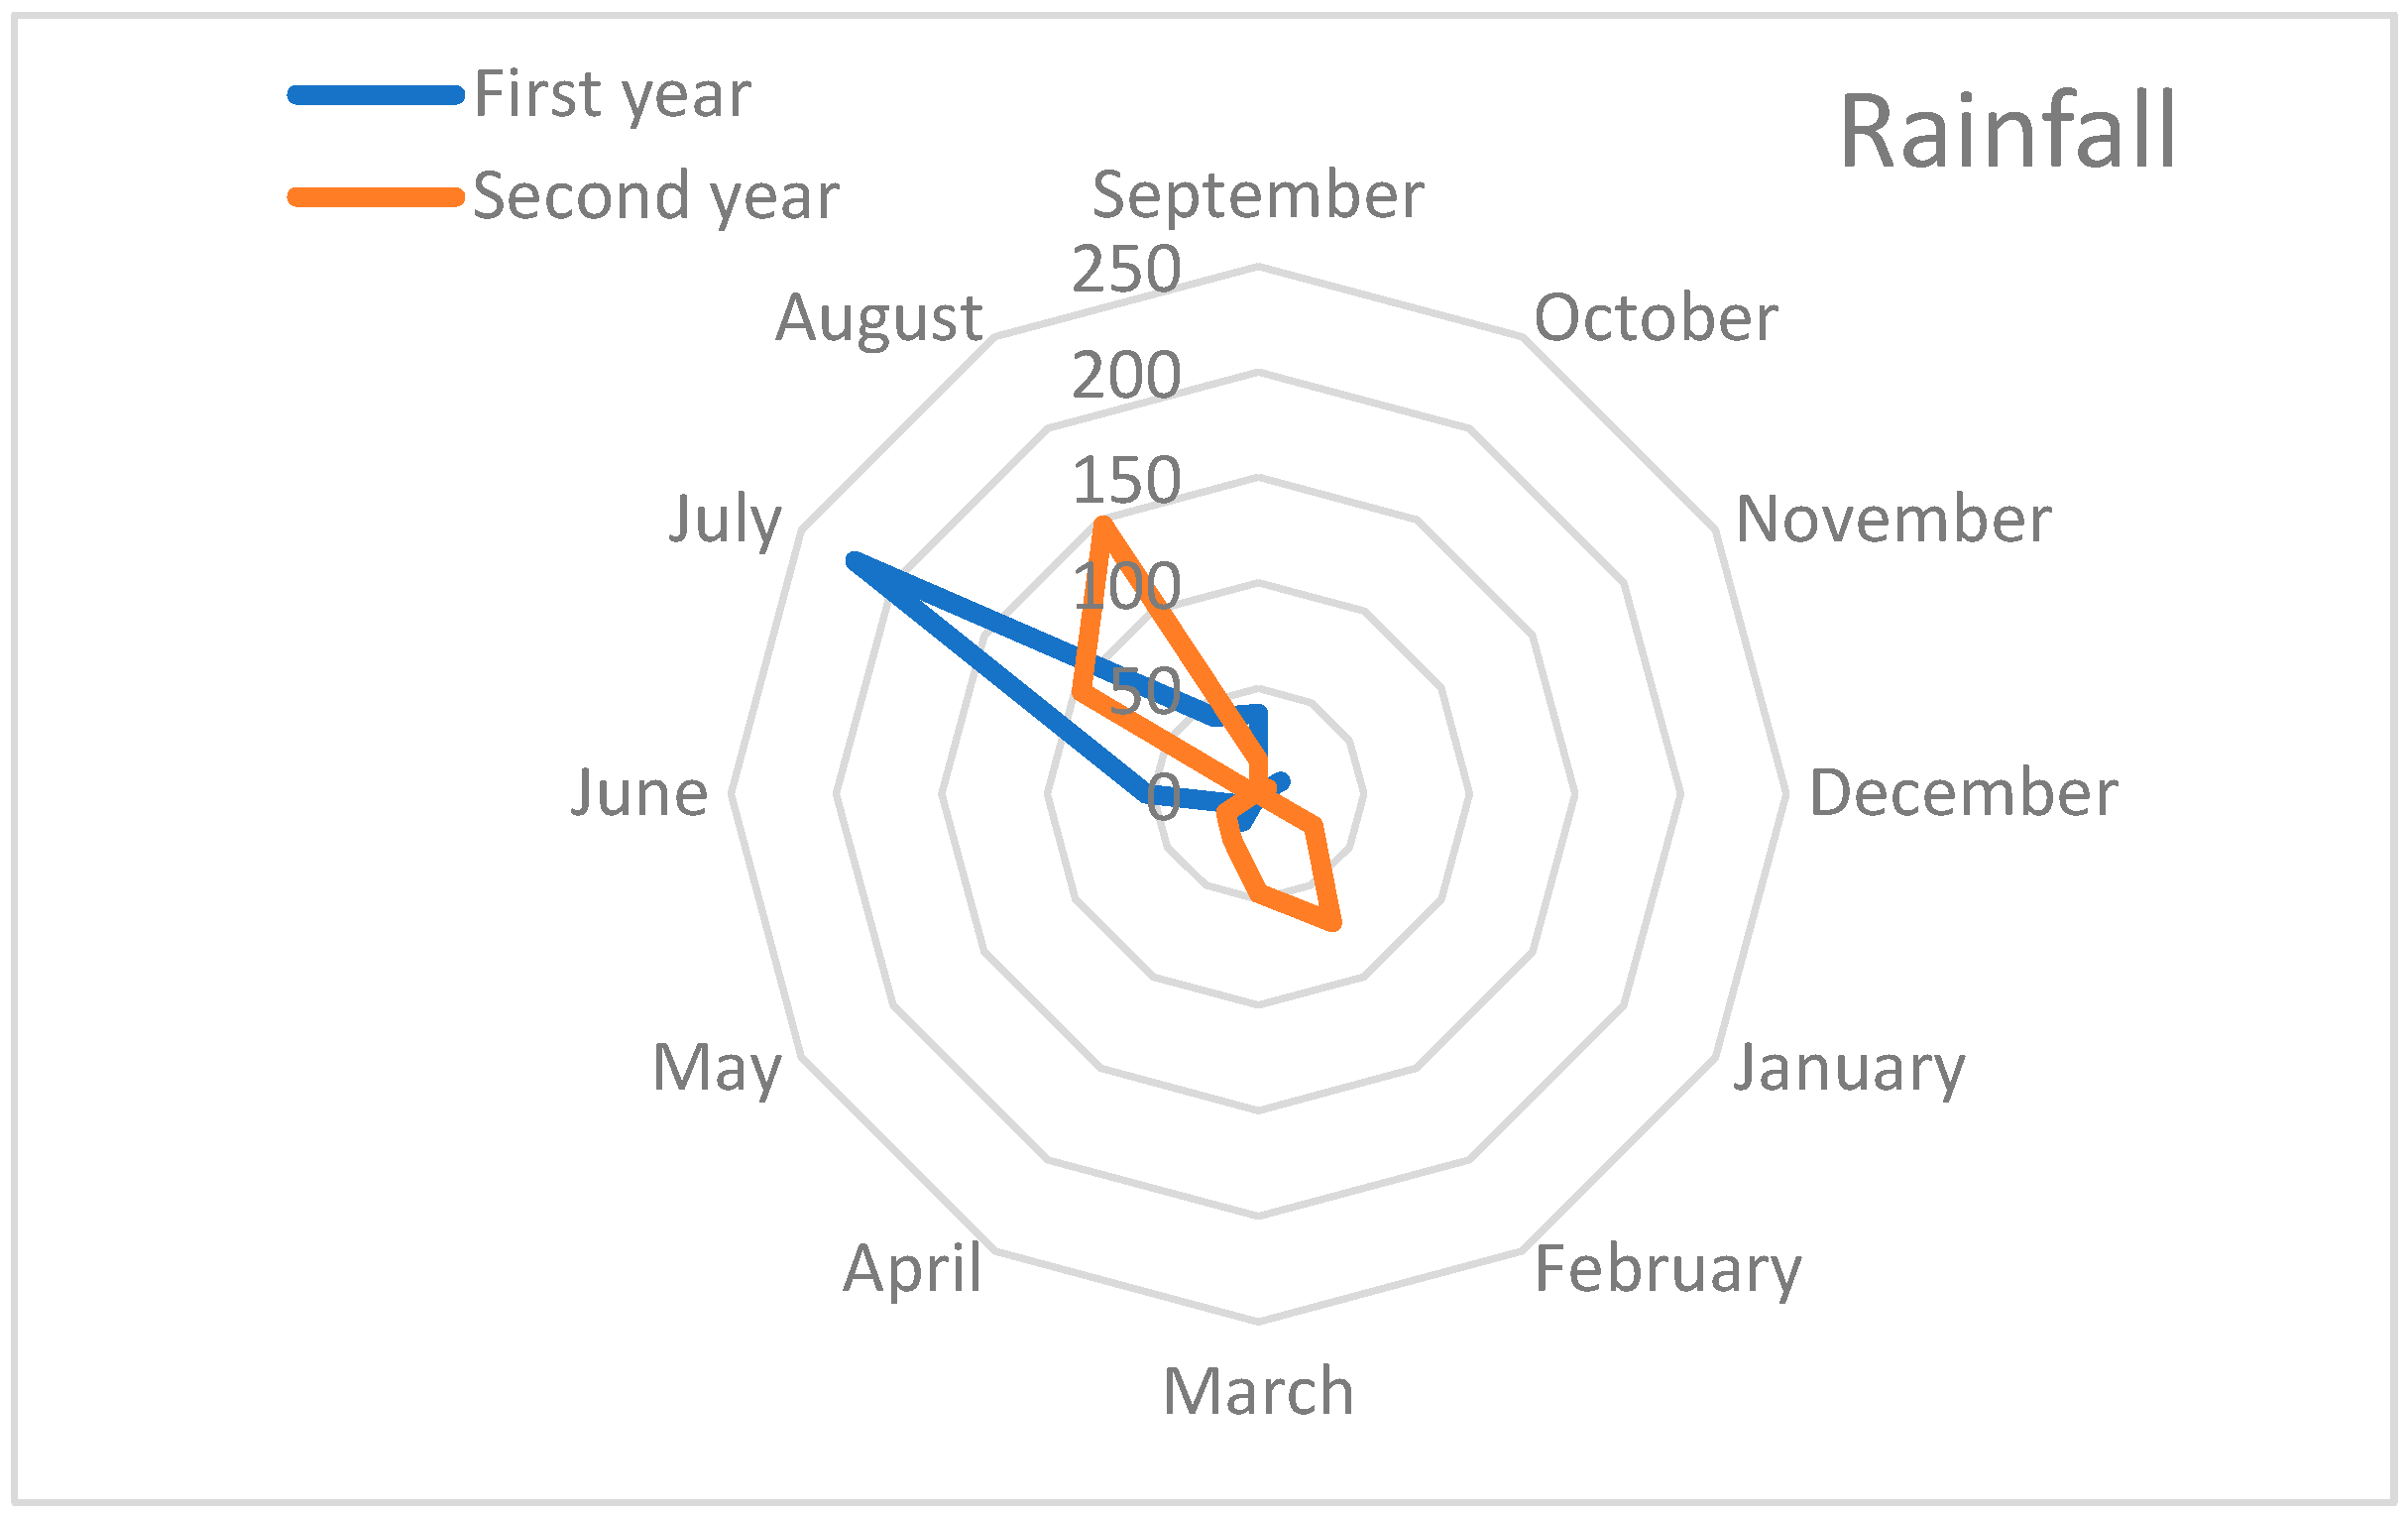
16]. N uptake was determined by the product of plant dry weight and its N contents. Nitrogen use efficiency was calculated on the basis of N uptake and applied N. Plant samples were collected at maturity to determine plant uptake. Rainfall data was obtained from the office of Assistant Director Agriculture (Ext) Phalia and data is presented graphically (
Figure 2).
Yield-related parameters of wheat were determined by using a 1 m
2 quadrate at three random points in each replication. Total N plant concentration and grain yield were determined by using standard methods. The data collected for various characteristics was subjected to analysis of variance (ANOVA) and means were compared at 5% level of significance by Least Significance Difference (LSD) test [
17].
3. Results
Tillering, booting and maturity stages of wheat crop are the critical stages where any delay or unavailability of nutrients significantly affects growth and yield of the crop.
3.1. NH4-N Concentration in Soil at Critical Growth Stages of Wheat
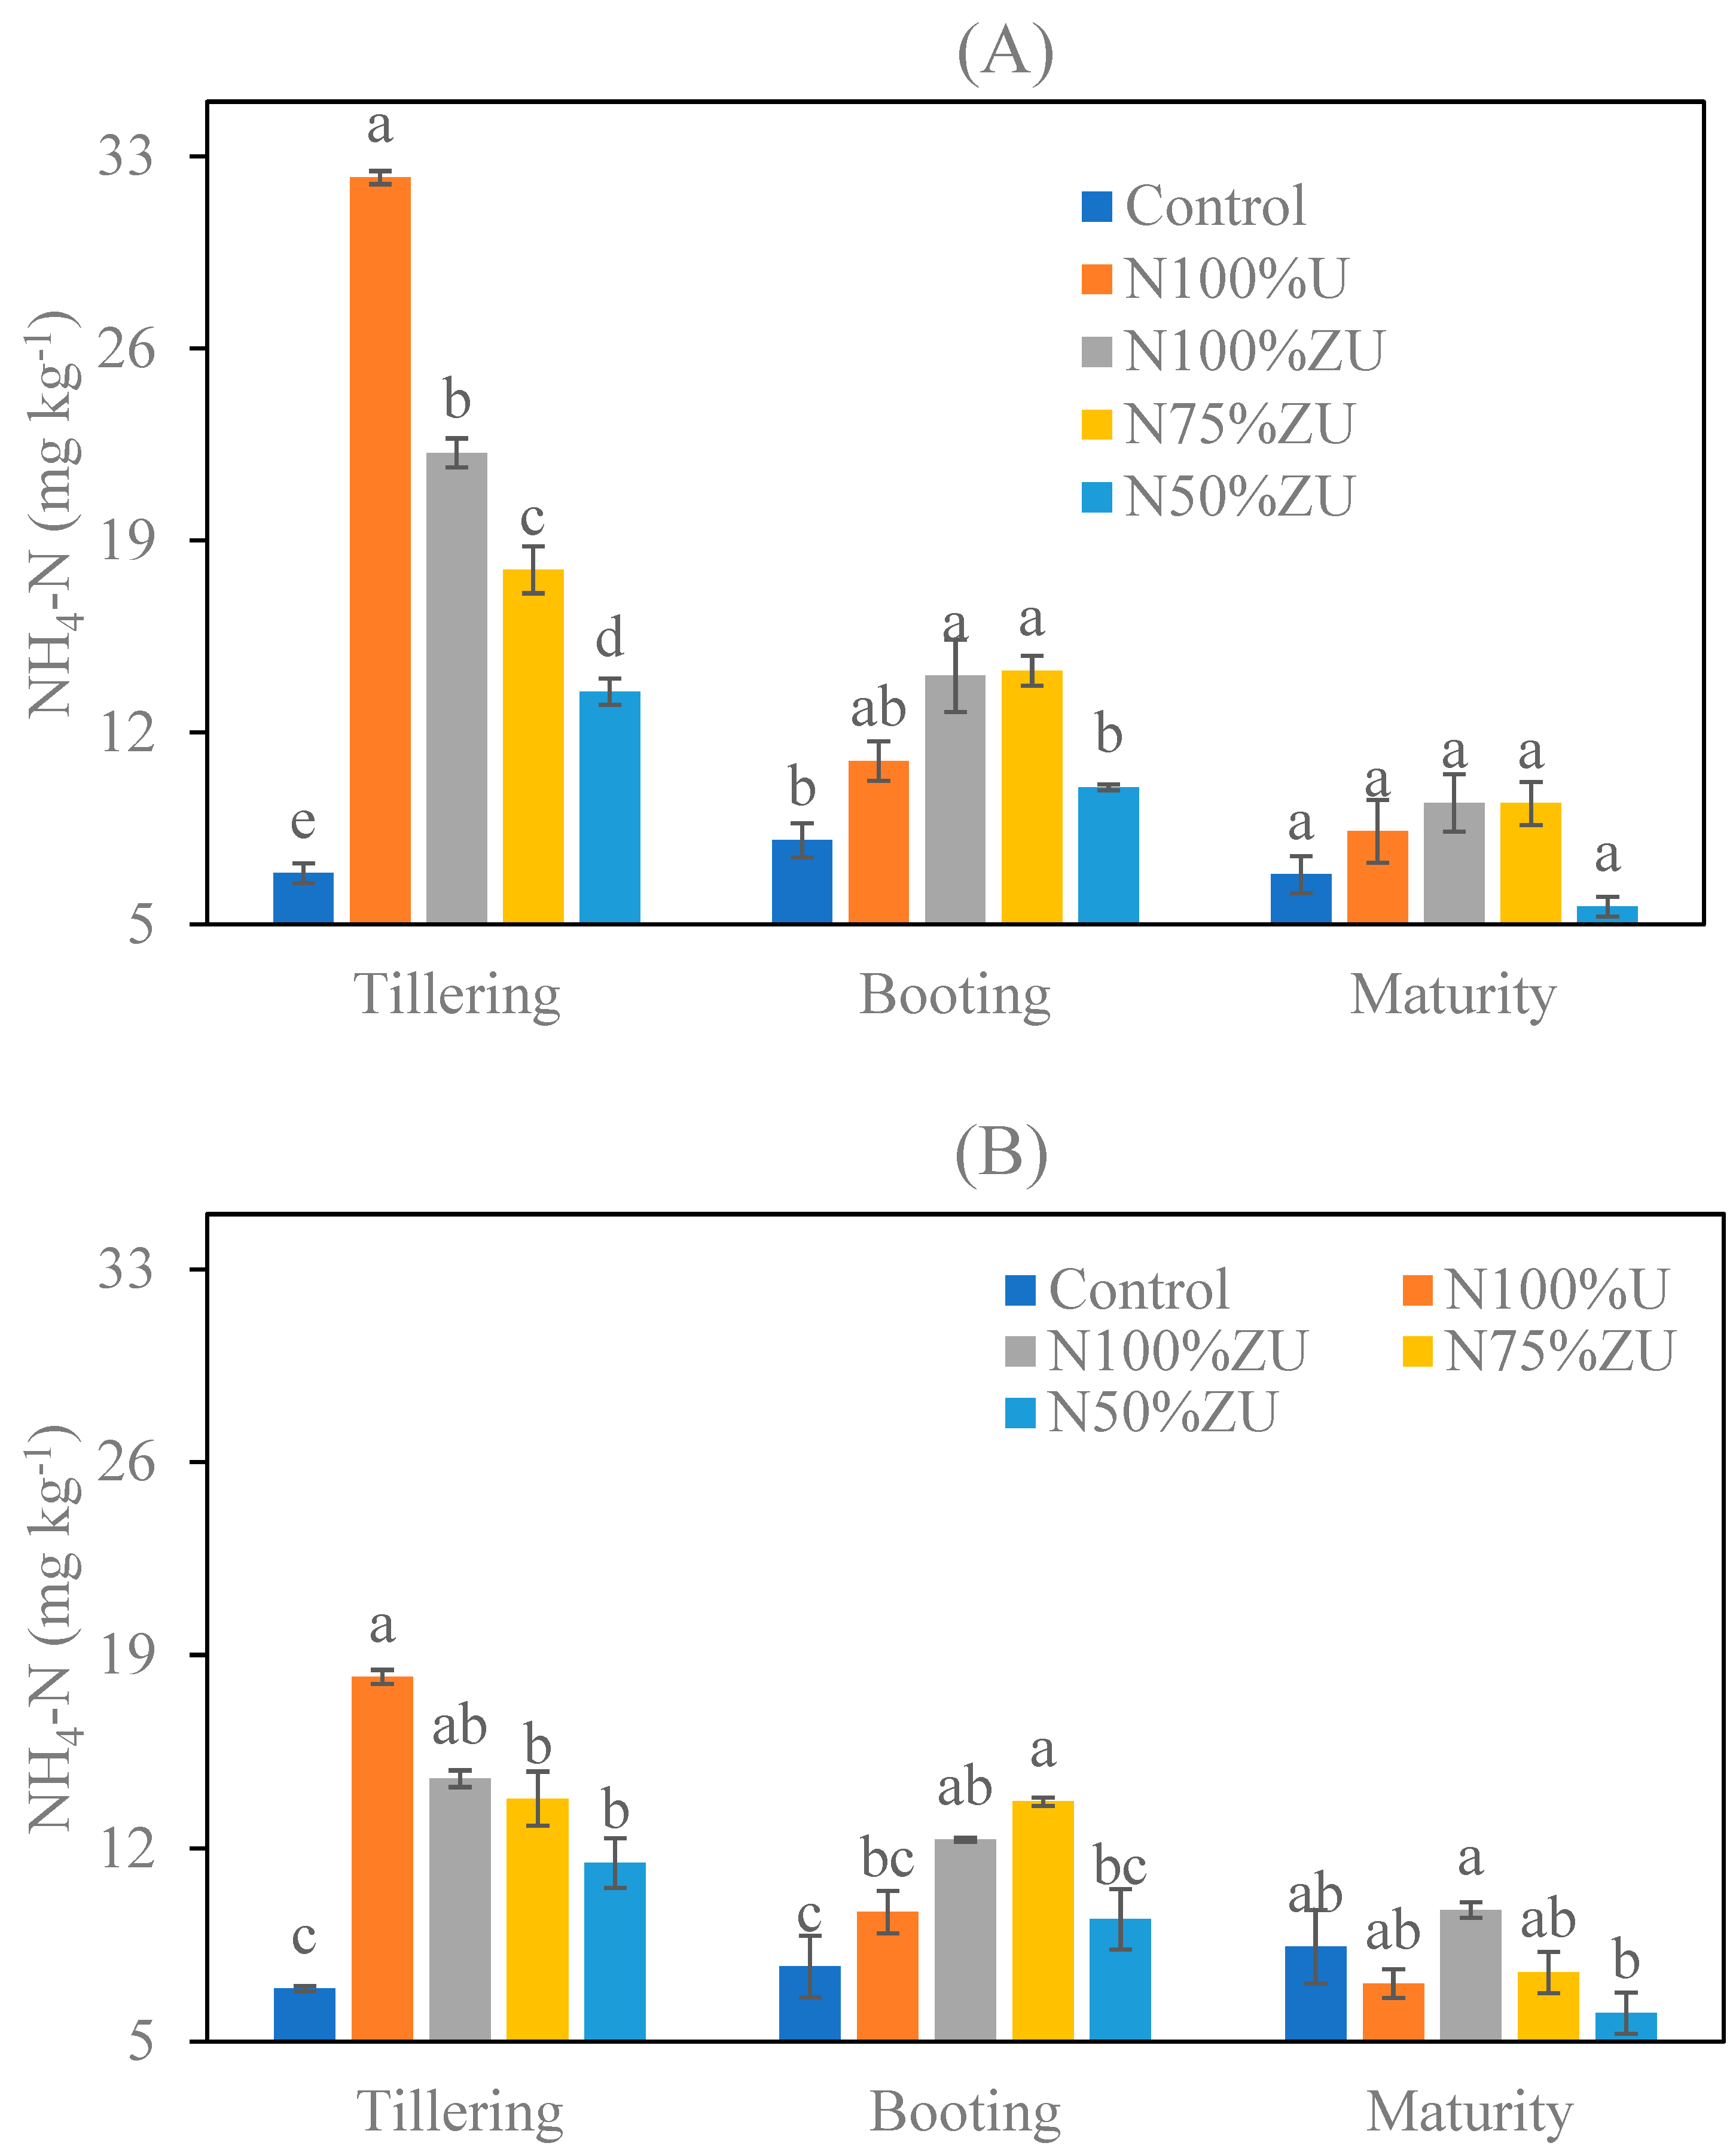
Figure 3 shows soil NH
4-N concentration at three growth stages of wheat, i.e., tillering, booting and maturity as affected by N from urea and zeolitic urea. At the tillering stage, the highest NH
4-N content was recorded with N
100% from urea. The order of other treatments for NH
4-N concentration in soil was N
100%ZU > N
75%ZU > N
50%ZU > control. At the booting stage N
100% and N
75% from zeolitic urea gave the highest NH
4-N concentration that was, on average, 29% higher than N
100% from urea.
At the maturity stage NH
4-N concentration was similar in N
100% and N
75% from zeolitic urea and N
100% from urea, while it was significantly lower in N
50%ZU and control. Overall NH
4-N concentration in soil gradually decreased from the tillering stage to maturity stage. The effect of treatments on retention of NH
4-N in soil during the second year is presented in
Figure 1. A similar trend was recorded at the tillering stage, i.e., the highest (18.2 mg kg
−1) NH
4-N was recorded with N
100%U at the tillering stage. However, at the booting stage, it was the highest with N
75%ZU. At the maturity stage, the highest concentration of NH
4-N was recorded with N
100%ZU as compared with other treatments. However, it was statistically similar to that of control.
Among the treatments, the highest NH4-N was with the 100% recommended N dose from urea (N100%U) at the tillering stage of wheat crop. However, at the booting stage of the crop, 100% and 75% recommended N dose from zeolitic urea (N100%ZU and N75%ZU) gave higher NH4-N as compared with urea alone, probably due to slow release of N. At the maturity stage, N100%U and N75%ZU retained similar NH4-N, which was lower than with N100%ZU.
3.2. NO3-N Concentration in Soil at Critical Growth Stages of Wheat
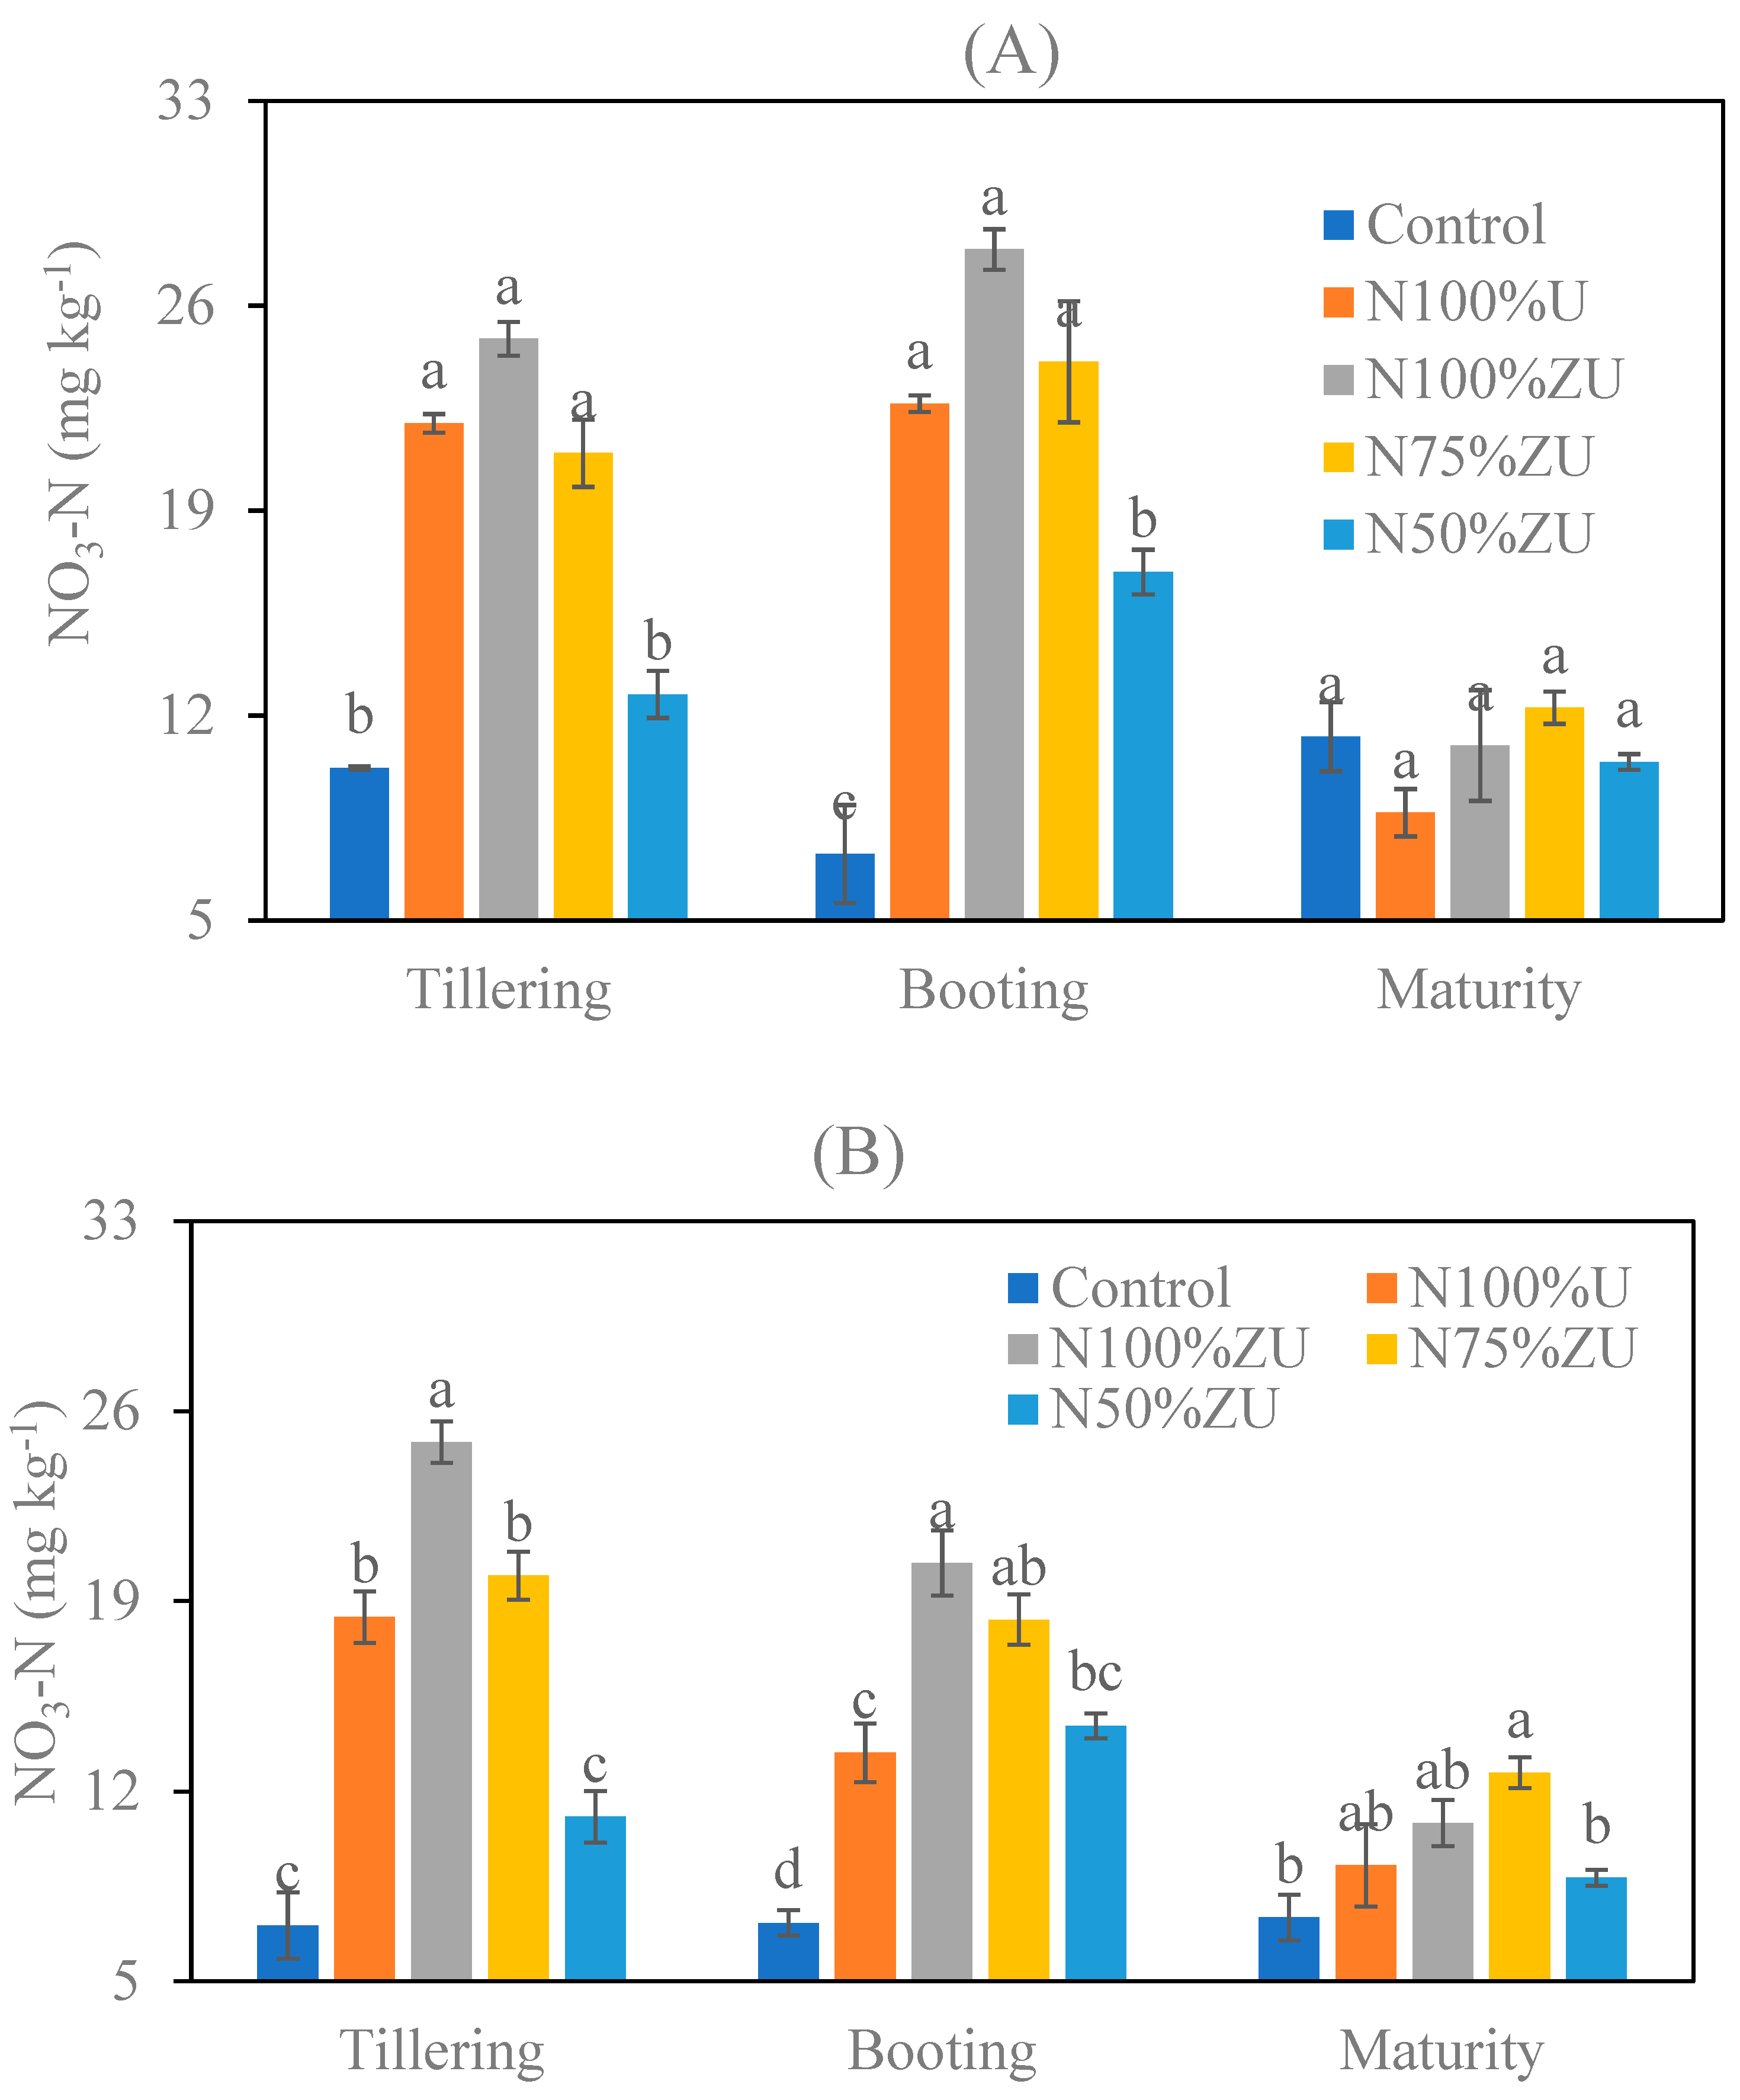
Figure 4 shows the concentration of soil NO
3-N at tillering, booting and maturity stages of wheat. Our results during the first year showed that soil NO
3-N contents were the highest with N
100%ZU at tillering and booting stages; however, it was at par with N
100% and N
75%ZU. At the maturity stage, differences in nitrate N were non-significant among all treatments. During the second year, soil nitrate-N concentration was lower than the first year, probably due to heavy rainfall, which may have flushed nitrates to a deeper soil layer. At the tillering stage, significantly higher NO
3-N concentration was recorded with the 100% recommended N dose from zeolitic urea. However, at the booting stage, 100% of recommended N rates applied from zeolitic urea (N
75%ZU) gave the highest concentrations of NO
3-N, closely followed by N
75%ZU (
Figure 2). At the maturity stage, nitrate-N content decreased from 75%ZU to 50%ZU.
3.3. Total N in Soil at Critical Growth Stages of Wheat
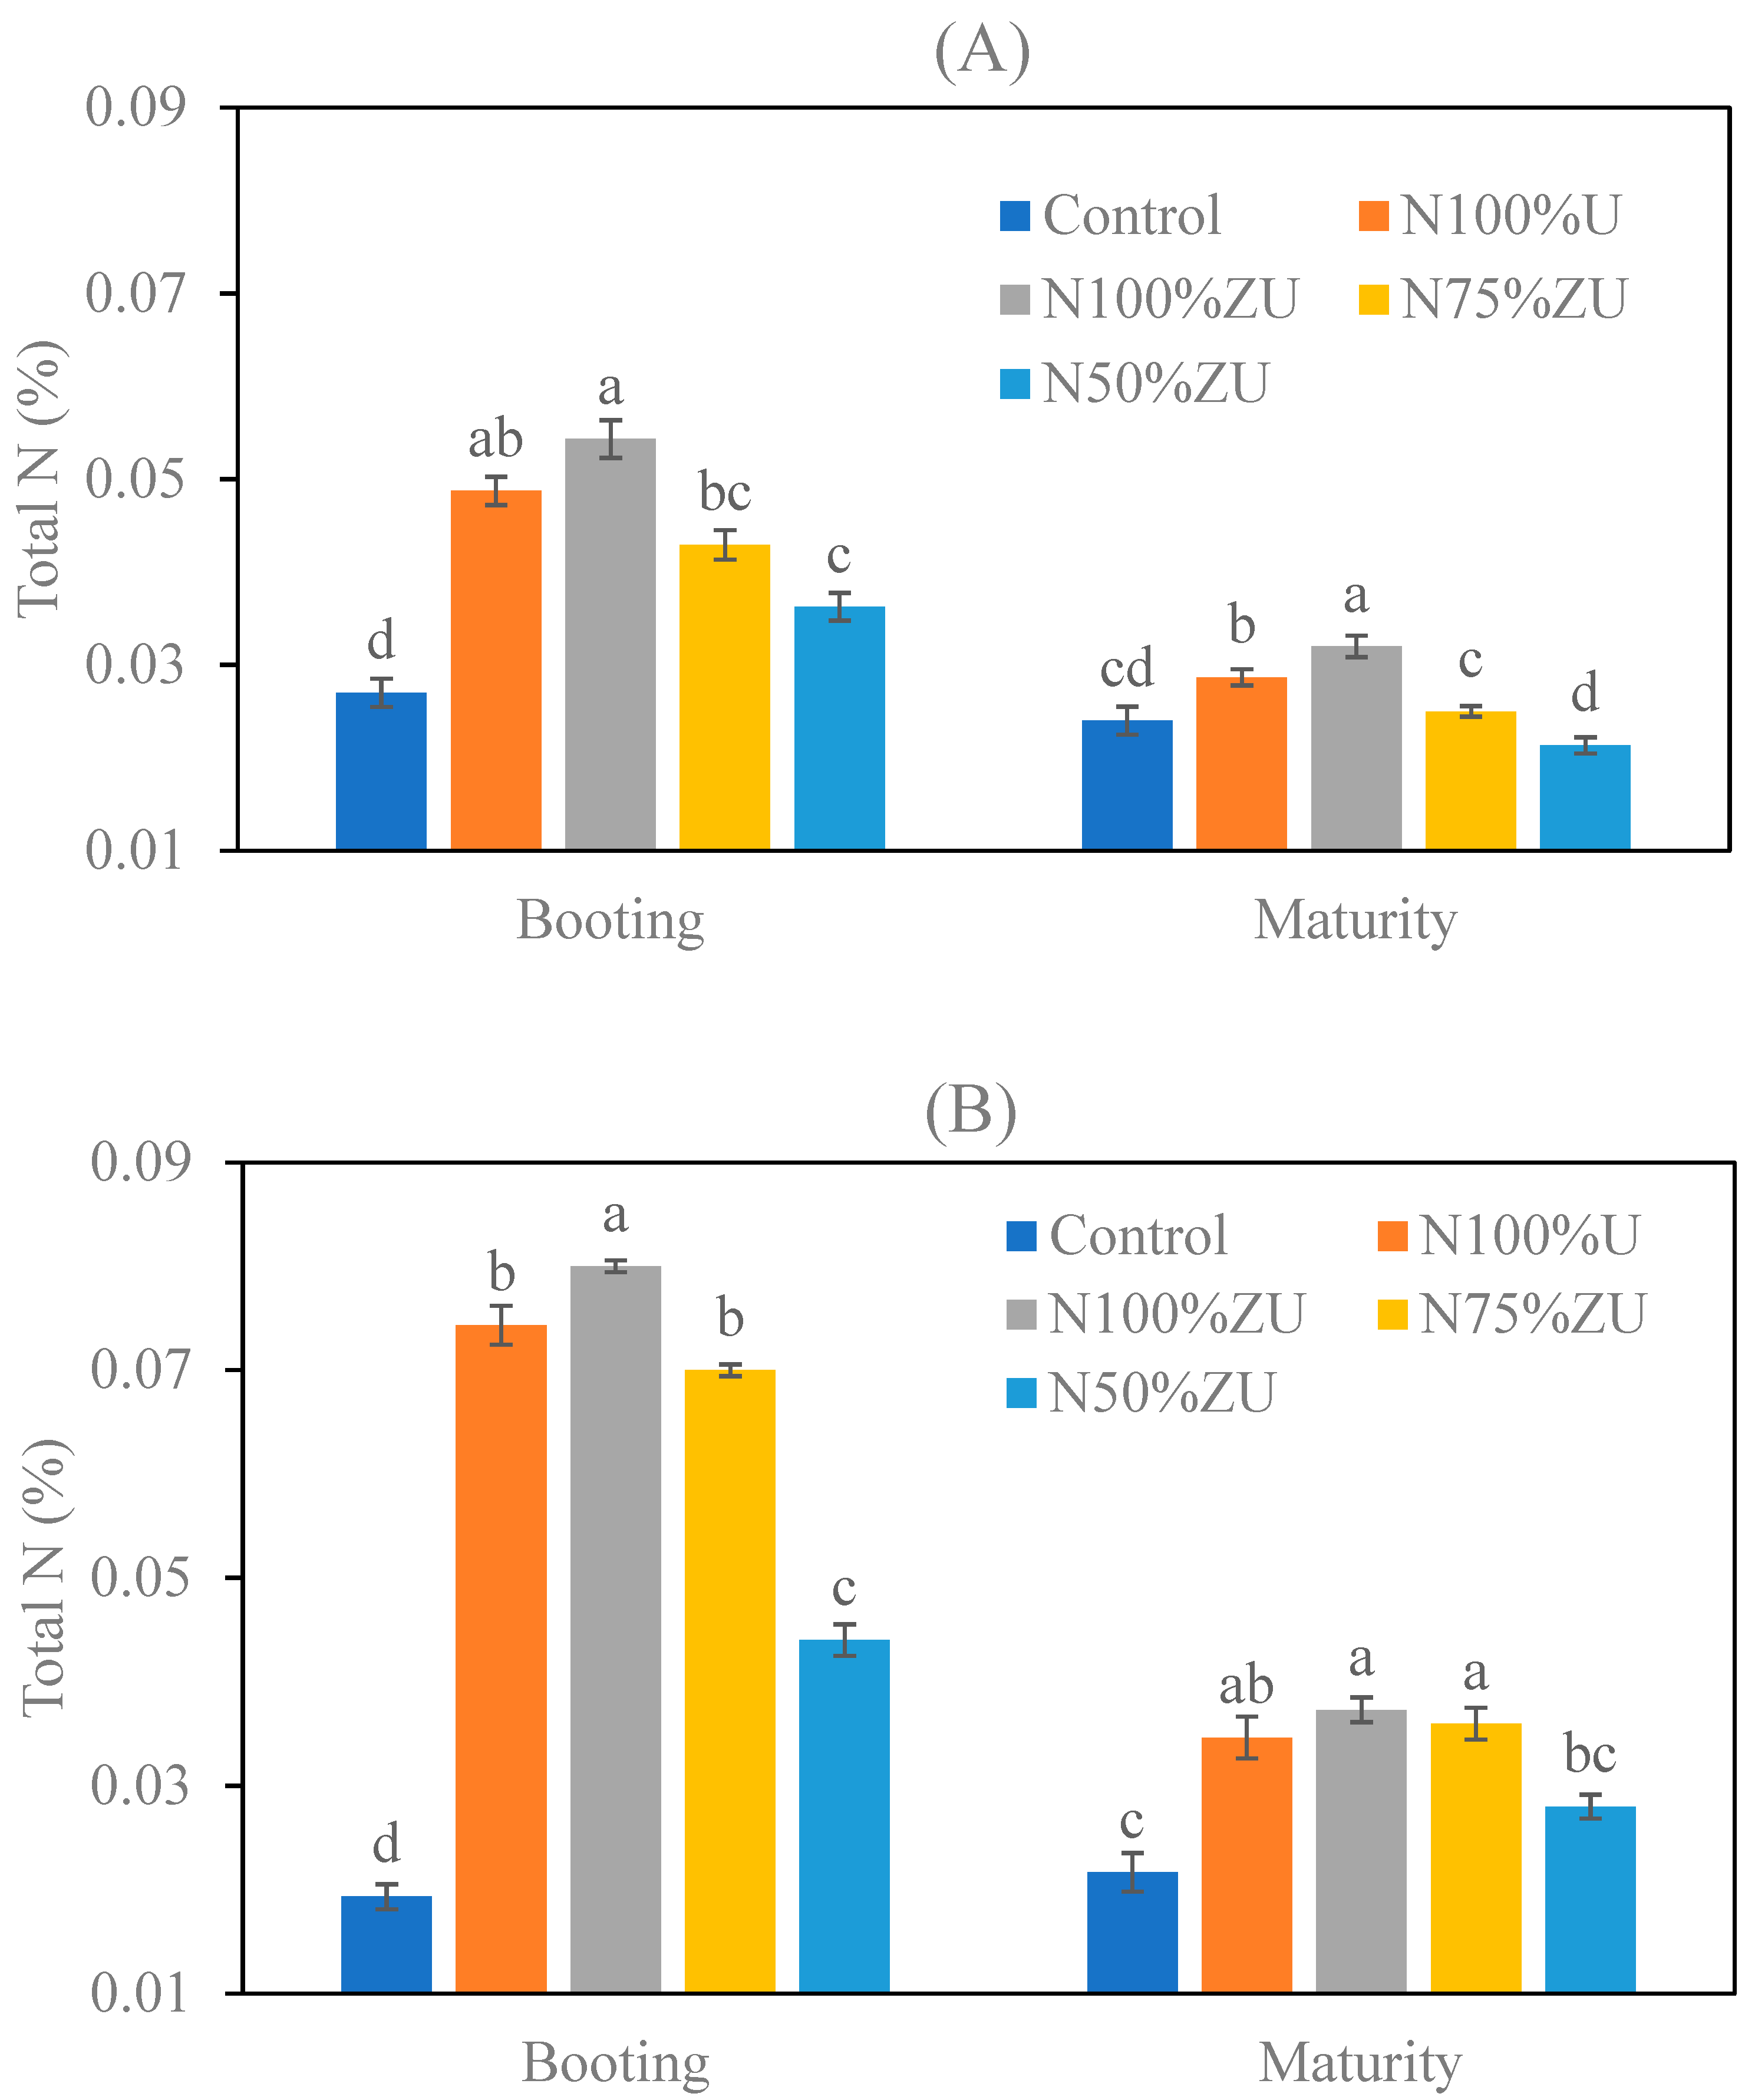
Figure 5 shows the effect of treatments on total N in soil at booting and maturity stages of wheat crop. Soil total N (%) was lower at the maturity stage than that of the booting stage in all treatments due to losses of N and plant uptake. N
100%ZU retained more total N at both stages as compared with urea and other zeolitic formulations. During the second year, similar to the previous year, the highest total N was recorded at the booting stage with N
100%ZU. However, at the maturity stage, total N was lower and almost the same as N
100%ZU, N
75%ZU and N
100%U. Low total N with N
50%ZU could be due to a lower N application rate. N
100%ZU retained more total N except that of N
75%ZU at both stages as compared with urea and other zeolitic formulations, possibly due to delayed release of N regulated by the presence of zeolite. However, at the maturity stage, N
75%ZU retained more total N as compared with other treatments, while N
50%ZU retained similar total N to that of N
100%U.
3.4. Available N Concentration in Soil at Critical Growth Stages of Wheat
Plant available N (mineral N) at tillering, booting and maturity stages of wheat is presented in
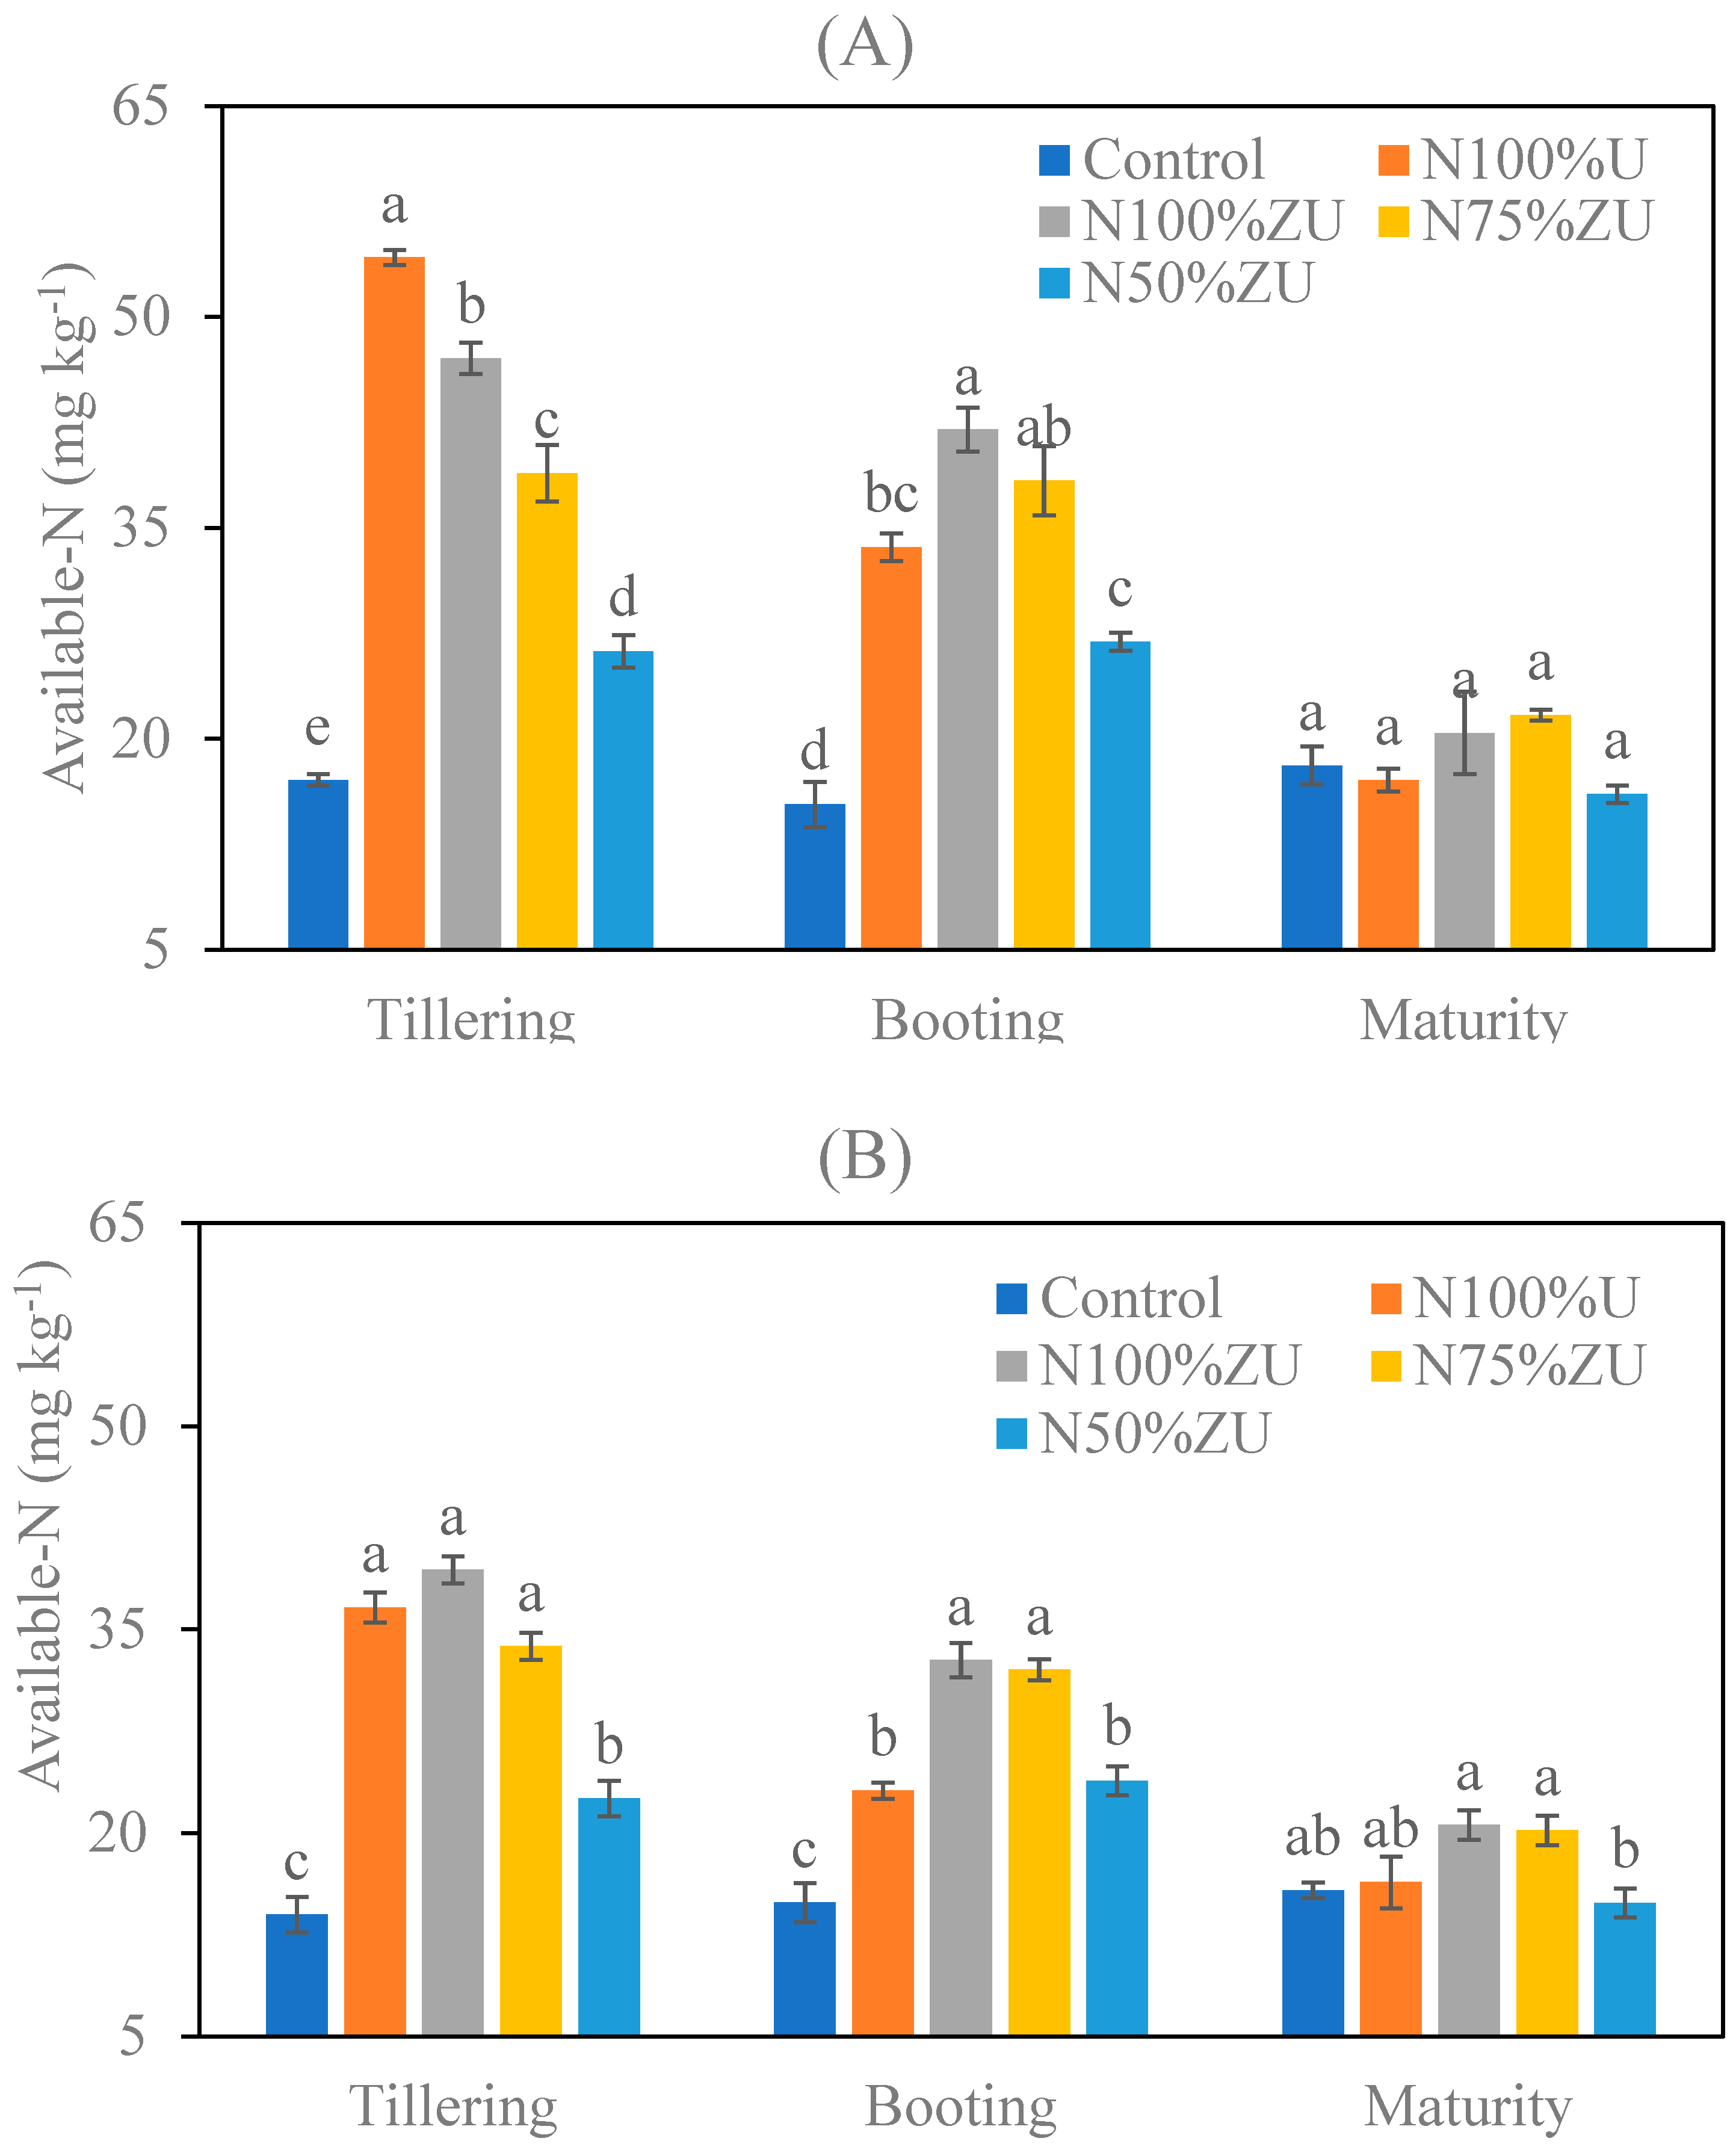
Figure 6. At the tillering stage, a higher concentration of mineral N was recorded with N
100%U, which is attributed to quick release of NH
4-N from urea. Mineral N in zeolitic urea treatments was lower but recorded in accordance with application rate of N. At the booting stage, the concentration of mineral N was higher with N
100%ZU, followed by N
75%ZU and then N
100%U, which may be attributed to nitrification and delayed release from zeolitic formulations. However, mineral N concentration was similar at the maturity stage with all treatments.
Plant available N is also called mineral N, which is a combination of ammonium and nitrates. Higher accumulation of NO
3-N at the booting stage could be beneficial for better crop growth with risk of leaching. Plant available nitrogen (NH
4-N + NO
3-N) is affected by treatments at different growth stages of wheat and is presented in
Figure 4. A high concentration of plant available N was recorded at the tillering stage with all treatments except control. However, among the treatments, it was maximum with N
100%U and minimum with N
50%U. At the booting stage, zeolitic formulations N
100%ZU and N
75%ZU produced significantly higher available N than the urea. Similarly, at the maturity stage, significantly higher available N was recorded with N
75%ZU, which was statistically similar to that of N
100%ZU. N
75%ZU maintained the available N at tillering and booting stages of wheat. Contrary to the findings of the first year, the highest plant available N was noted in treatment N
100%ZU at the tillering stage during the second year. However, the trend of nitrate retention in soil was similar to that of the previous year at booting and maturity stages of wheat, i.e., the highest available N with N
100%ZU and N
75%ZU.
Plants uptake N in the form of NH4-N and NO3-N, so NH4-N + NO3-N is the total plant available N. As depicted by the results, maximum available N was recorded at the tillering stage under wheat crop and minimum at the maturity stage. This was due to maximum NH4-N and NO3-N concentration at the tillering stage of wheat crop.
3.5. Nitrate Retention at Different Soil Depths
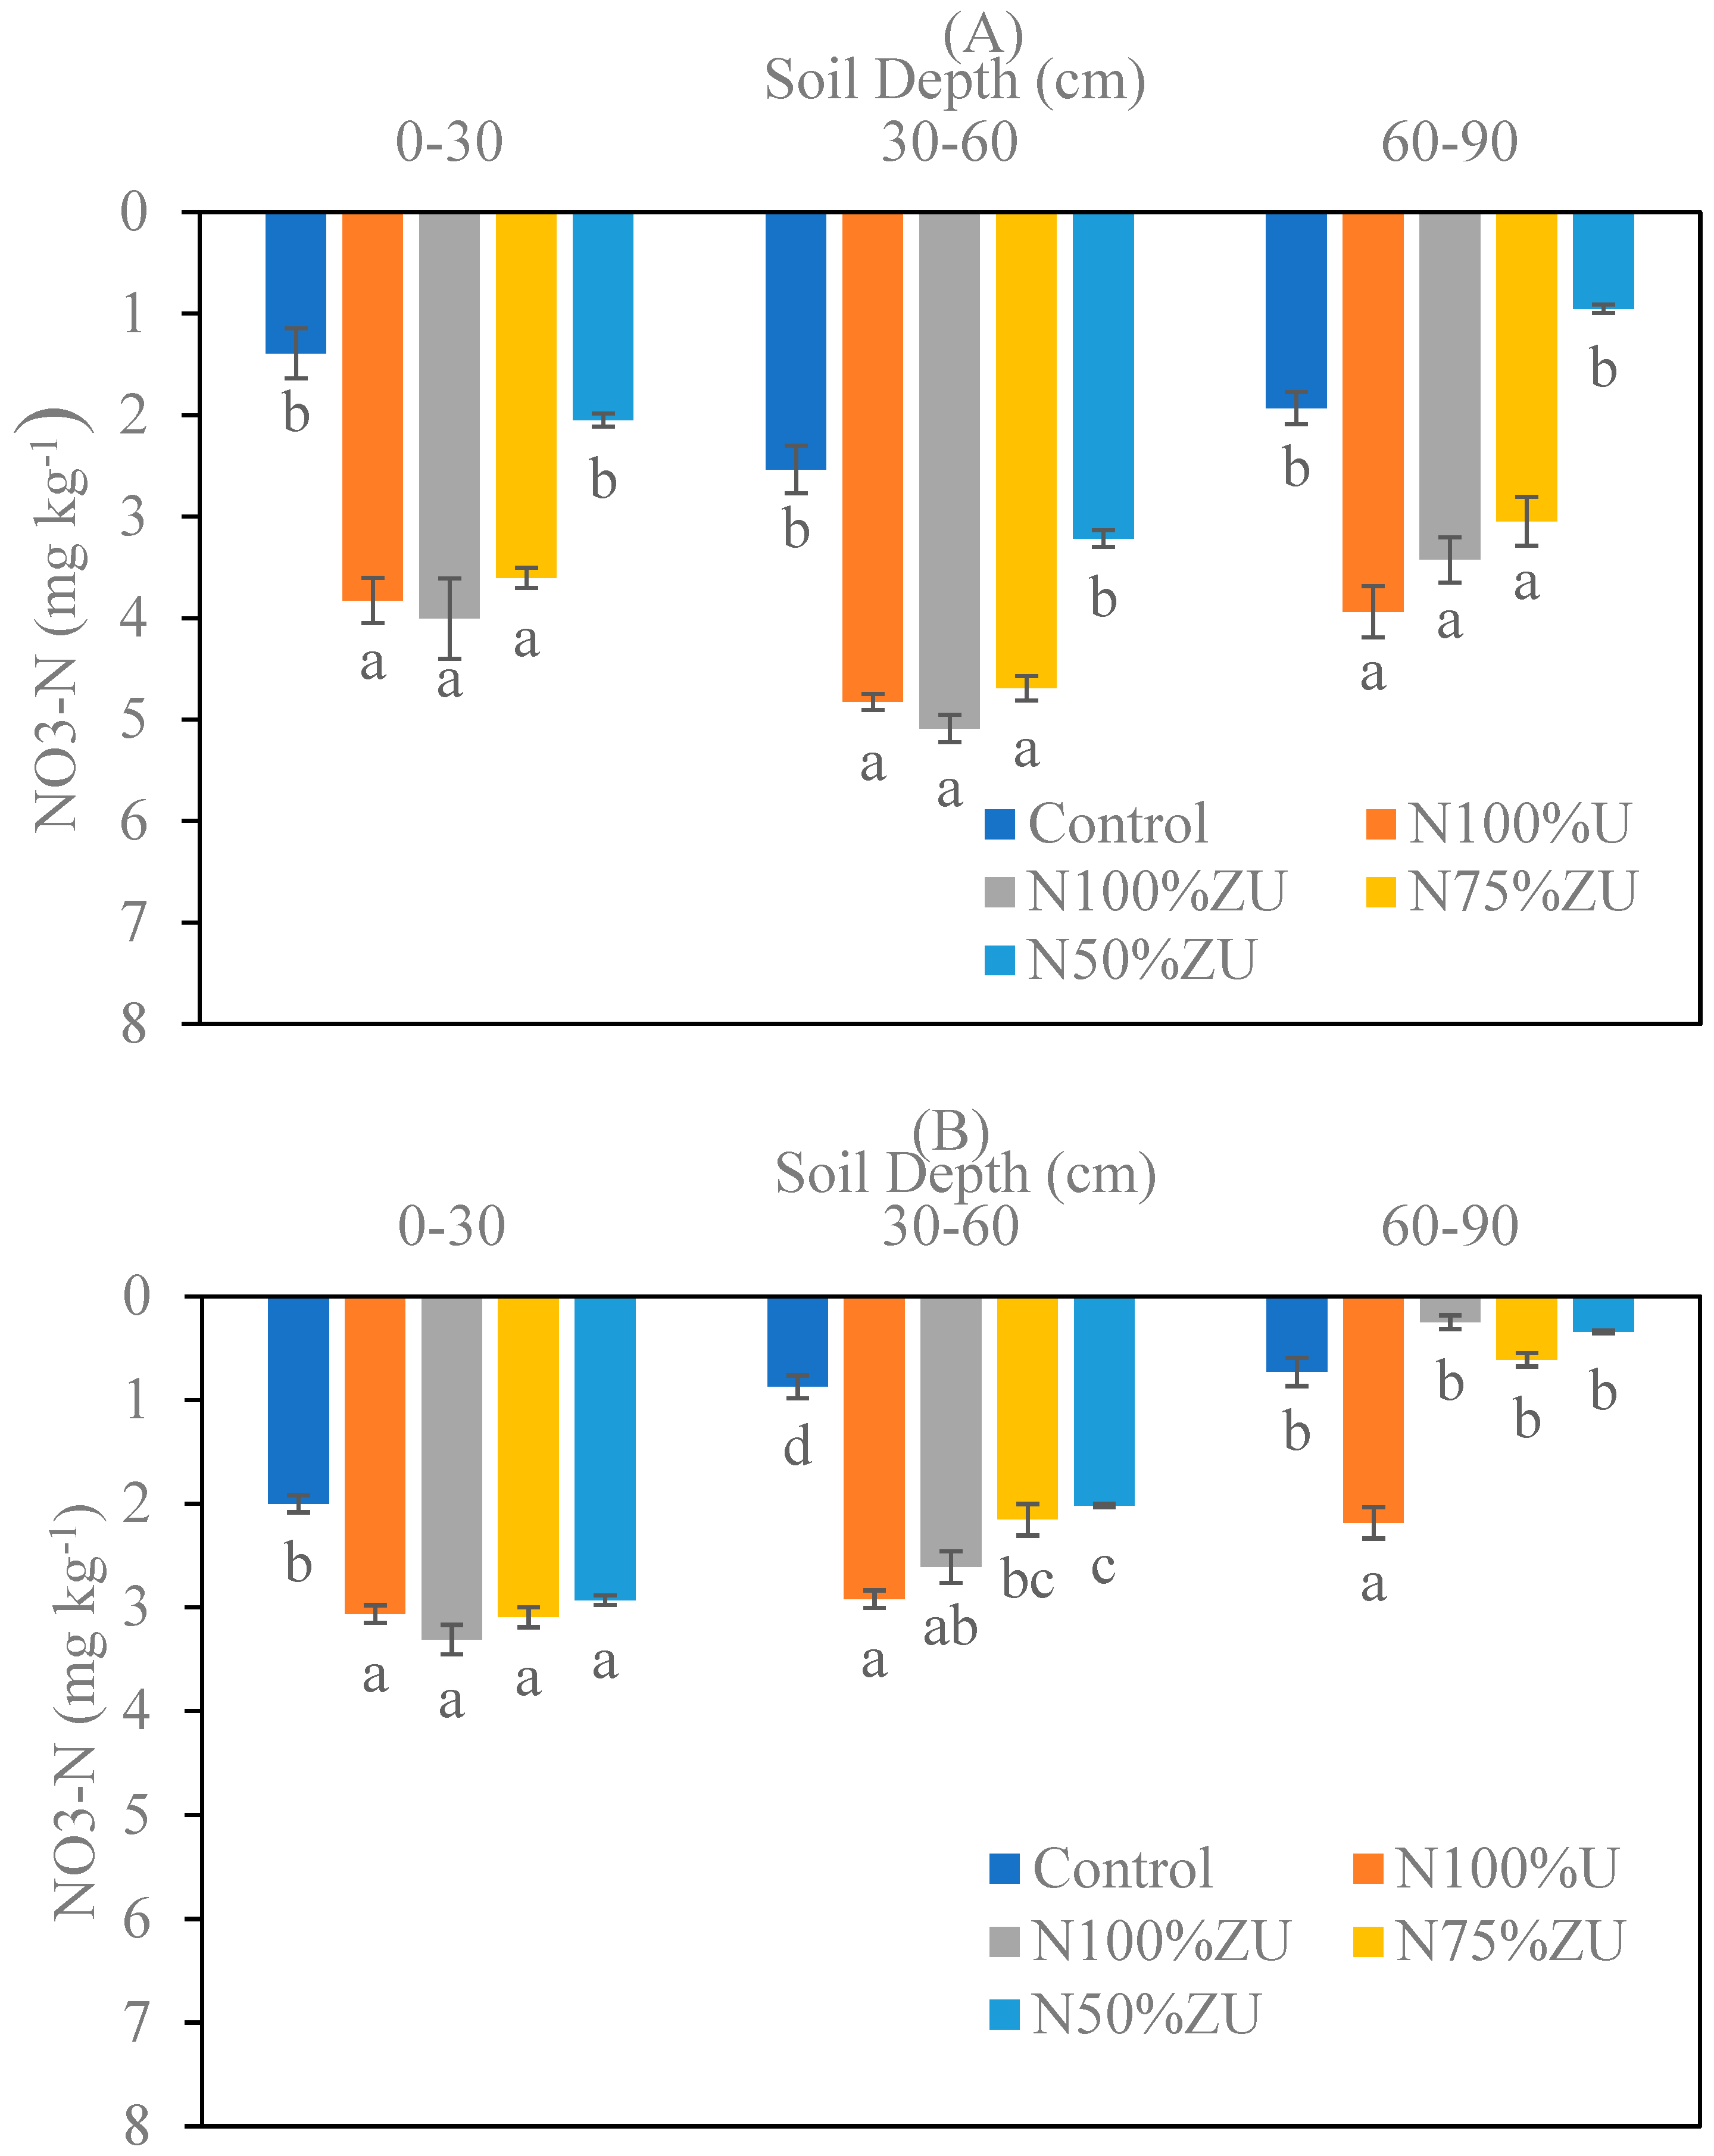
Figure 7 shows the effect of treatments on retention of nitrates at three depths of soil under wheat crop. It is depicted by the results that maximum nitrates were recorded at 30–60 cm depth with N
100%ZU, which is statistically similar to N
100%U and N
75%ZU. An almost similar trend was recorded at 0–30 cm depth. In other words, zeolitic urea formulation did not affect nitrate leaching at 0–30 cm and 30–60 cm depth as compared with urea. However, significantly low nitrates were retained at 60–90 cm depth with all zeolitic formulations as compared with urea. During the second year, retention of nitrates at different soil depths is presented in
Figure 5. Nitrate concentration at different depths was very low with all treatments. The trend was different from the first year. An almost similar concentration of nitrates was retained in 0–30 cm depth with all treatments but higher from other depths. At 30–60 cm depth, the concentration of nitrates was lower in zeolitic urea formulation as compared with urea alone. But, at 60–90 cm depth, nitrate retention was significantly minimum with N
100%ZU. A minute concentration of nitrates was recorded with control and N
50%ZU at all the depths. A positive effect of zeolitic formulation (N
100%ZU and N
75%ZU) was recorded on nitrate retention as compared with urea. Nitrates leached to 30–60 cm and 60–90 cm depths were higher with urea and significantly lower with N
100%ZU and N
75%ZU, respectively. However, nitrates retained within 0–30 cm depth were significantly higher with zeolitic urea formulation, i.e., N
100%ZU and N
75%ZU as compared with urea alone. Even N
50%ZU retained similar a concentration of nitrates to that of urea.
Soil nitrate concentration was maximum at 30–60 cm depth during the first year but at 0–30 cm during the second year. However, it was minimum at 60–90 cm during both years. The change in trend could be due to the cultivation of rice crop, which may have facilitated leaching and flushed nitrates from the deeper soil layers, leading to low nitrates during the second year of wheat crop.
3.6. Growth and Yield Parameters
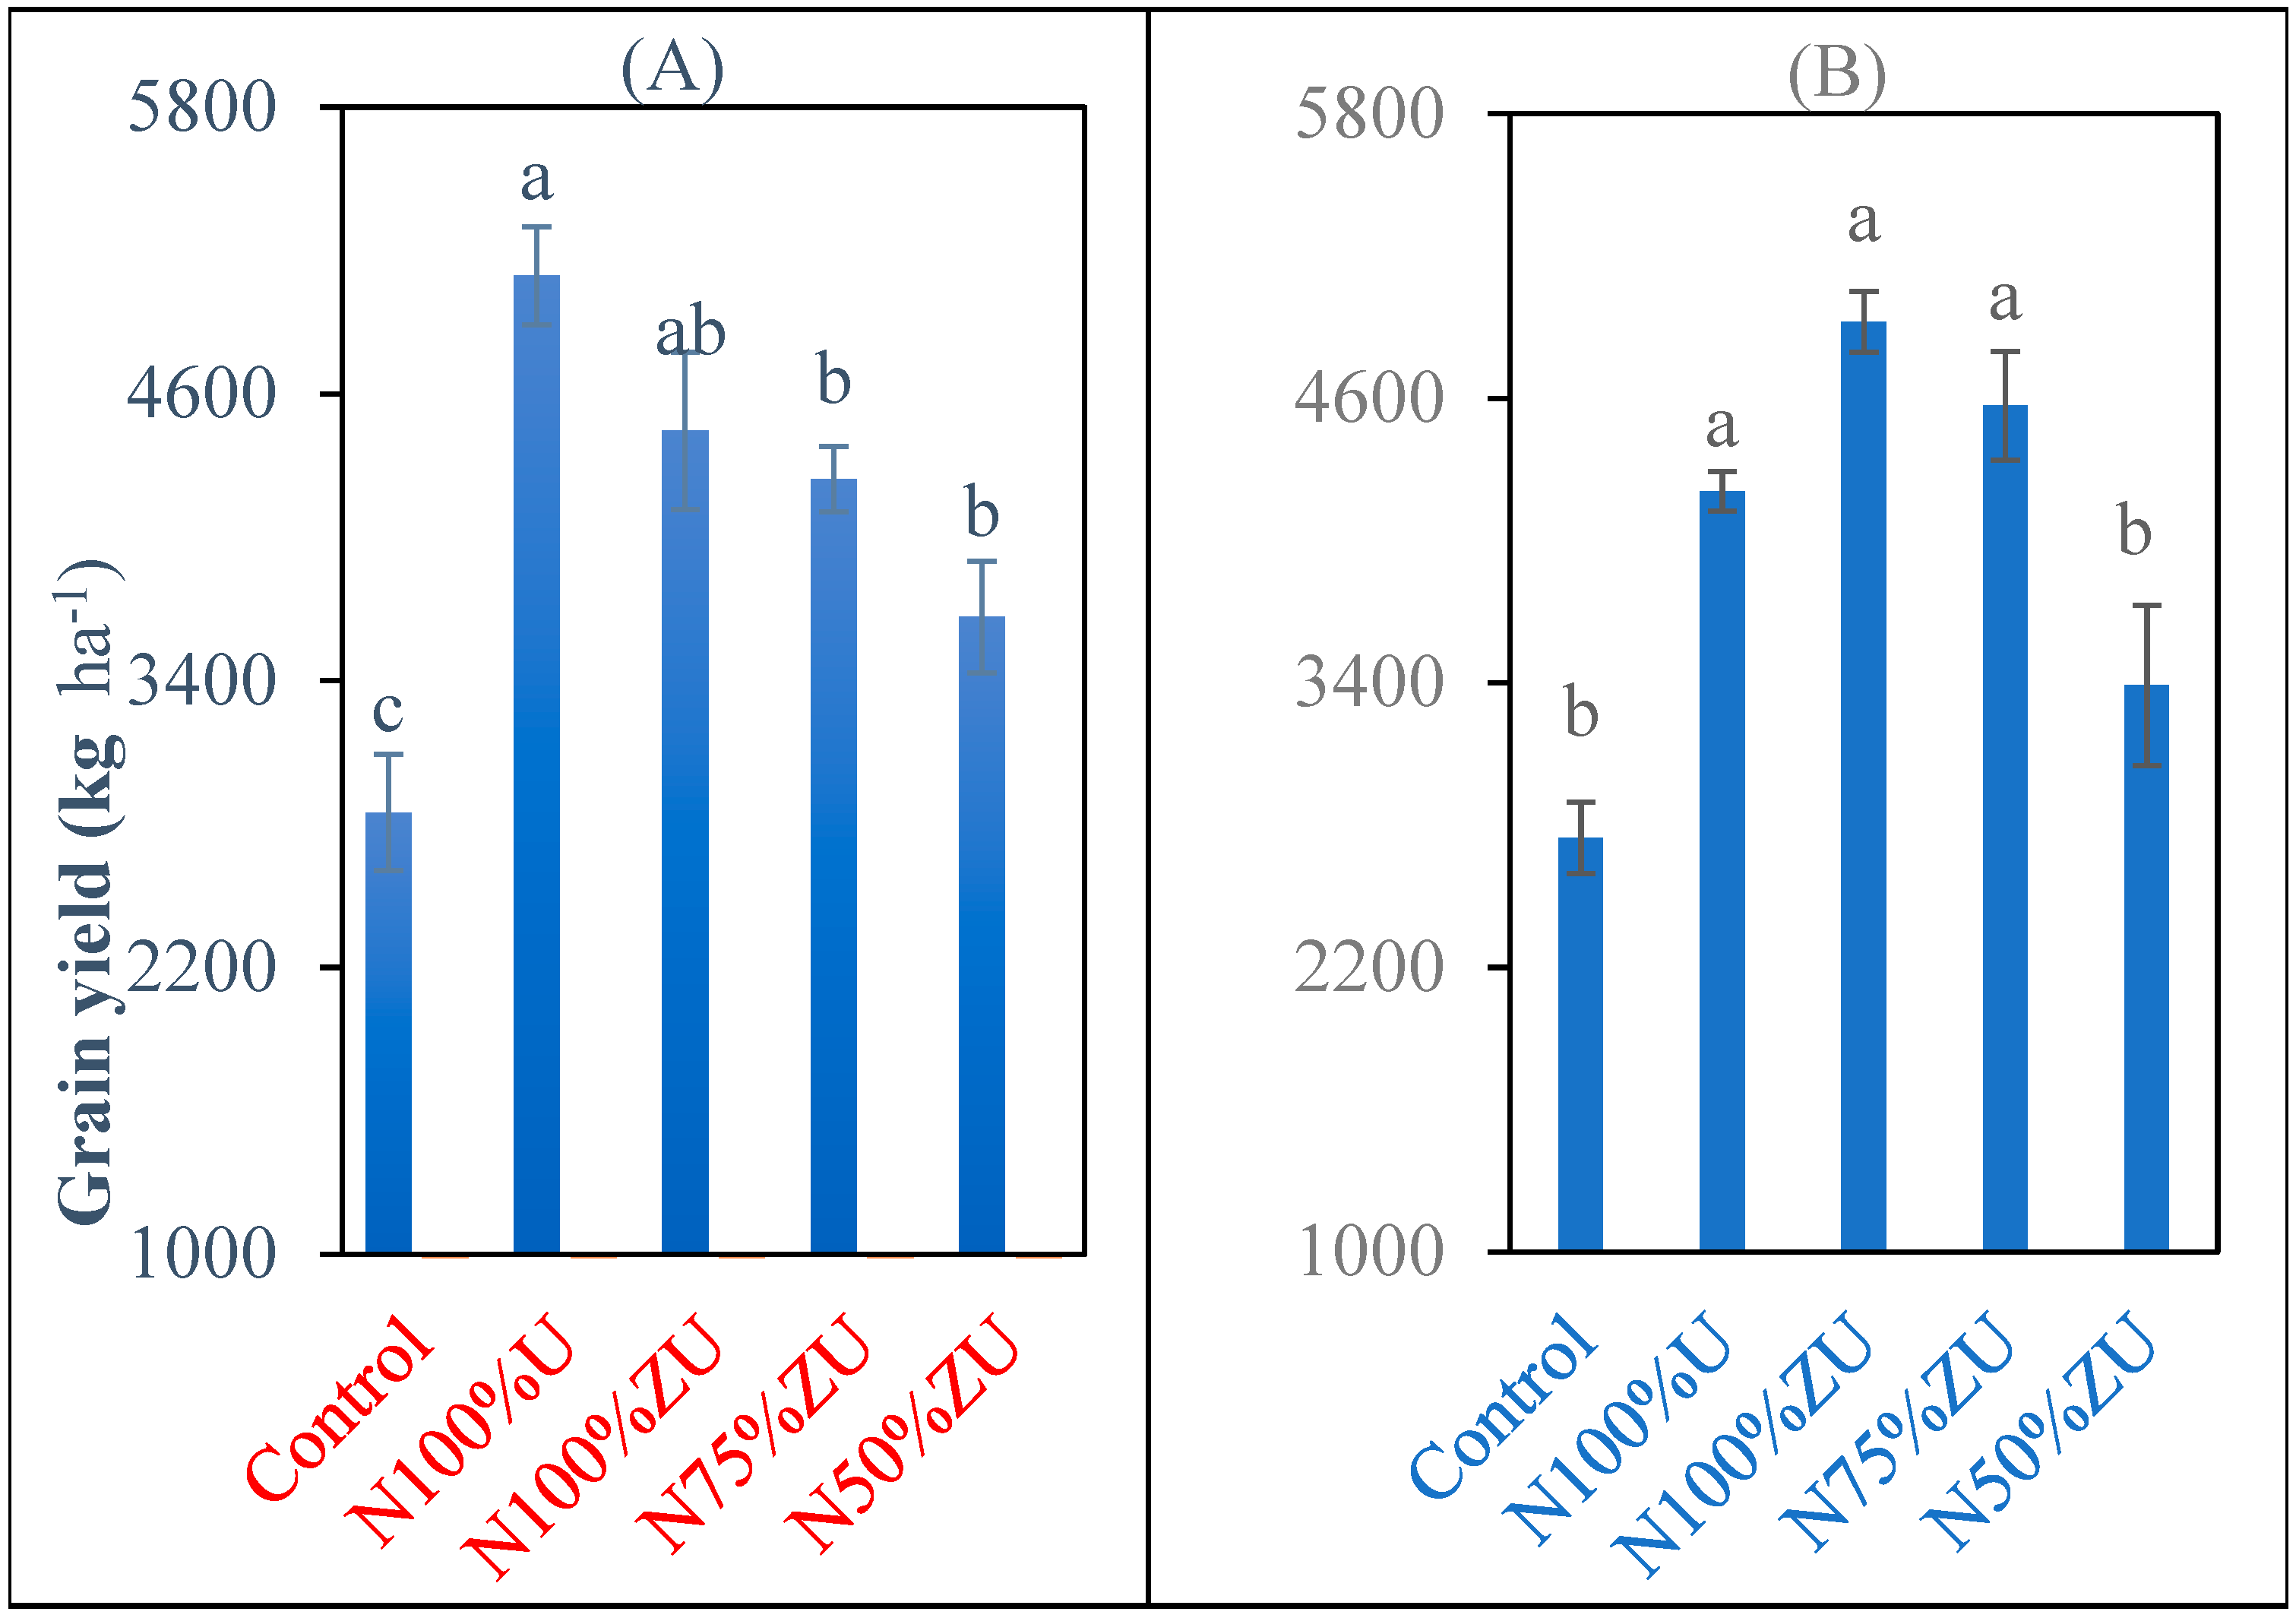
The results reflected in
Figure 8 show that, during the first year, significantly higher grain yield was obtained with N
100%U, while it was statistically similar with N
100%ZU and other zeolitic urea treatments. Contrary to the results of the first year, zeolitic urea treatments (N
100%ZU and N
75%ZU) produced higher grain yield than that of N
100%U in the second year, although it was statistically not appreciable. Low grain yield with control and N
50%U could be due to an insufficient N dose to meet the crop demand. Increased grain yield in the second year of wheat crop could be due to the accumulation of zeolite in soil after its consecutive application in wheat, which may have resulted in N releasing slowly.
3.7. Nitrogen Use Efficiency
Results described in
Table 2 show that N concentration in plant and plant uptake was positively affected by the treatments. During both years, minimum N uptake and plant concentration was recorded with control and N
50%ZU. However, during the first year, statistically similar plant N concentration and uptake was recorded with N
100%U, N
100%ZU and N
75%ZU. Meanwhile, it was highest with N
100%ZU during the second year of wheat season. N use efficiency (NUE) was lower with N
100%U and N
50%ZU.
4. Discussion
The highest soil NH4-N concentration was recorded at the tillering stage, followed by booting and then maturity stages. The time interval between fertilizer application and the tillering stage of the crops was minimum as compared with other growth stages. After the hydrolysis of fertilizer, the first available form of N was NH4-N. Furthermore, the process of ammonification is followed by nitrification, denitrification, volatilization and uptake of N, leading to a gradual reduction in NH4-N at later stages of crop growth. These could be the possible reasons behind higher NH4-N at the tillering stage of the crops.
The concentration of NH
4-N remained low at all stages of wheat with N
50%ZU as compared with other treatments except control due to low N contents. Similar results were reported by Lim et al. [
18]. They reported that NH
4-N concentration was low at the maturity and tillering stage as compared with the growing or booting stage and increasing the application of zeolite increased NH
4-N at the growing and maturity stage [
19].
Nitrates were effectively retained in soil at the booting and maturity stage with zeolitic urea treatments, i.e., N
100%ZU and N
75%ZU as compared with urea alone. These results are in line with the findings that more nitrates (57 mg kg
−1) were retained in soil with a higher dose (60 t ha
−1) of zeolitic tuff [
20].
Total N (%) in soil was recorded as highest at the booting stage, while being low at the maturity stage. Zeolitic urea formulation N
100%ZU remained the best treatment for retaining N in soil as compared with urea alone where the same N was applied. Low contents of total N with N
75%ZU and N
50%ZU may be due to less applied N. Results are in line with those recorded by Ghafoor et al. [
21]. They studied the effect of slow-releasing urea on N contents and recorded the highest concentration of total N (130 kg ha
−1) in soil after the harvesting of wheat. They also recorded that the concentration of total N was higher at the growth stage of wheat as compared to that at the maturity stage.
All the zeolitic urea formulations effectively retained more plant available N in soil as compared with N
100%U and control. These results are contradictory to those reported by Zheng et al. [
22], who reported that total soil inorganic N decreased by 8.3%, 7.2% and 21.4% in the 0–30, 30–60 and 60–90 cm layers, respectively, as compared with urea alone. However, in another study, it was reported that 2% zeolite plus 5% compost effectively increases plant available N in soil [
23,
24]. Maximum plant available N was recorded with N
100%ZU at all three stages, followed by N
75%ZU and N
50%ZU. Although N content in N
50%ZU was 50% lower than urea, still it retained almost similar N to that of N
100%U, which is due to the presence of zeolite leading to slow release of N.
Nitrate leaching to 60–90 cm soil depth was effectively reduced by the zeolitic urea as compared with urea alone [
25]. Similarly, higher nitrate concentration at upper depths was reported with nano-nitrogen chelate (NNC) slow-release fertilizer [
26]. In our experiment nitrate contents at lower soil depths were also lower with N
75%ZU and N
50%ZU as compared with N
100%ZU, which was due to the higher N content of N
100%ZU. Similar results were obtained by Soltys et al. They recorded minimum leaching of nitrates at a higher rate of zeolite application. Compared to the control, the treatment resulted in a 36 and 37% reduction in leaching losses in the first and second years, respectively [
27].
Zeolitic urea formulations positively affected yield of wheat crop. The results were statistically similar with N
100%U, N
100%ZU and N
75%ZU but applied N was 25% lower in N
75%ZU as compared with the sole urea treatment. This could be due to the continuous supply of N from zeolitic urea even with a lower basal dose of N. Beneficial effects of zeolite and urea combinations were also reported by Najafinezhad et al. [
28]. They tested seven combinations of treatments along with urea alone on wheat and canola crops. Results of the study revealed that zeolite in combination with urea and manure produced the highest grain yield of wheat and canola and the highest N uptake (120.4 kg ha
−1) by wheat crop. Kotoulas et al. [
29] also recorded 76% higher fresh weight of wheat with zeolite and urea combination. A similar effect of zeolite was reported by Karami et al. [
30]. They reported that combined application of 10 t ha
−1 zeolite with urea significantly improved NUE. Similarly, Wang et al. [
31] reported that controlled blend fertilizer of N enhanced crop yield and NUE as compared with conventional fertilizers.
In our study zeolitic formulation significantly improved NUE being maximum with N100%ZU and N75%ZU. Our findings are applicable in practical wheat farming, where they can make the wheat production more environment-friendly through less nitrogen use and emissions, as well as lower energy consumption for nitrogen fertilizers production.


 ,
, 
