1. Introduction
The relationship between nitrate concentration and electrical conductivity in aqueous environments has become a focal point in environmental science and water quality management [
1]. This correlation is particularly significant because of its potential applications in monitoring nitrate and assessing water quality across various aquatic ecosystems. Understanding the interplay between nitrate concentration and EC is important for rapid water quality screening, particularly in regions lacking resources for direct nitrate analysis. While nitrate can be directly measured, such testing may not be routinely feasible in all global contexts. Thus, examining the environments in which EC could serve as a proxy for nitrate concentration is a valuable contribution to cost-effective monitoring strategies. This study emphasizes the relevance of such proxy methods primarily in nitrate-dominated water bodies such as shallow agricultural wells and rural rainwater. Nitrate is a common pollutant in water bodies, often originating from agricultural runoff, sewage discharge, and atmospheric deposition [
2,
3]. Excessive nitrate concentration can lead to eutrophication, harmful algal blooms, and potential health risks to humans and aquatic organisms. Secondly, electrical conductivity serves as a rapid and cost-effective indicator of overall water quality, reflecting the total dissolved solid content [
4]. This is especially critical in water-scarce regions such as Saudi Arabia, where cost-effective, rapid monitoring tools are essential for sustainable water resource management [
5,
6,
7].
Nitrate concentration is a key indicator of water pollution and is often associated with agricultural runoff, sewage contamination, and shallow groundwater. In the Arak Plain, Iran, a support vector machine (SVM) model was developed to predict the nitrate concentration in groundwater using easily measurable variables, such as EC, water temperature, and dissolved oxygen [
1]. Similarly, in Zaheerabad, India, 16% of the groundwater samples exceeded the permissible limit of 45 mg/L, which was attributed to the excessive use of fertilizers and pesticides [
8,
9,
10]. Interestingly, EC and total dissolved solids (TDS) are closely related parameters that directly represent the total salt concentration in water. High values of these parameters indicate reduced water quality. In the Abu-Ziriq marsh, Iraq, an Adaptive Neural-based Fuzzy Inference System (ANFIS) outperformed artificial neural networks (ANN) and multiple regression models (MLR) in predicting EC and TDS [
11]. Similarly, in the Lighvan Chay River, Iran, support vector regression (SVR) was found to be more accurate than k-nearest neighbors in estimating EC and TDS [
12]. Therefore, nitrate concentration and EC are essential parameters for a comprehensive water quality assessment. Their measurement and prediction using advanced modeling techniques can provide valuable information for water resource management and pollution control across various water sources, including groundwater and seawater.
EC plays a vital role in identifying variations in ionic strength, including the presence of pollutants such as nitrates. Since nitrate is an anion that contributes to the overall conductivity of water, a correlation often exists between EC and nitrate concentration, particularly in environments where nitrate is a dominant contaminant, such as agricultural regions with heavy fertilizer use [
13]. However, the strength of this relationship depends on the presence of other dissolved ions, land use practices, and the specific characteristics of the water body [
14]. Nitrate concentration and electrical conductivity vary significantly across different water sources, with each type exhibiting distinct characteristics influenced by environmental factors and human activities. In groundwater, nitrate concentrations are often elevated due to agricultural activities and the use of chemical fertilizers. Band et al. [
15] reported that northern agricultural areas had the highest nitrate levels in groundwater, which was attributed to excessive fertilizer use and irrigation practices [
15]. Various factors, including seawater intrusion and salinization, influence the electrical conductivity of the groundwater. Ramkumar et al. indicated that groundwater samples from coastal areas showed higher electrical conductivity, suggesting seawater incursion [
16]. Notably, rainwater quality varies depending on the collection area and roof material. Greene and Thomas found that rainwater from industrial areas had higher lead concentrations, whereas rural areas showed elevated nitrate levels [
17]. Zdeb et al. observed that rainwater quality was affected by roofing materials, with galvanized steel sheets contributing to increased zinc concentrations [
18]. In our previous study, we reported on the groundwater residence time [
19] using an advanced liquid scintillation counter [
20,
21]. We observed that nitrate levels were strongly correlated with the water type. However, these studies often lack comparative analyses across multiple water types and do not address the variability in correlation strength due to environmental and ionic differences. The present study aimed to explore the nitrate–conductivity relationship across diverse aqueous environments and investigate how this correlation varies from controlled standard solutions to complex matrices of natural water bodies. By examining these correlations, we sought to enhance our understanding of water quality dynamics and develop more efficient strategies for monitoring nitrate pollution in aquatic ecosystems.
The study of nitrate conductivity correlations encompasses a wide range of aqueous environments, from controlled laboratory settings using standard solutions to complex natural water bodies, such as groundwater systems. The primary research question guiding this study was as follows: What are the differences in nitrate concentration and electrical conductivity among standard water, rainwater, and groundwater? To address this question, we quantified and compared these parameters across four water sources. Our hypothesis suggests that seawater exhibits distinct characteristics in terms of nitrate concentration and electrical conductivity compared with other water sources. This study aims to investigate the quantitative relationship between nitrate concentration and electrical conductivity across different water bodies, identifying the consistency and limitations of EC as a proxy for nitrate across varied environments. The results of this comparative analysis are expected to reveal unique patterns and variations in water quality across different water sources, thereby providing a nuanced understanding of their respective characteristics. These findings have important implications for water resource management, environmental conservation, and public health policies related to water quality standards.
2. Materials and Methods
In this study, various water samples were carefully selected to represent a wide spectrum of nitrate concentrations (
Table 1). The first category consists of five standards provided by Horiba (Kyoto, Japan). These standards contained precise nitrate concentrations of 150, 300, 500, 1000, and 2000 mg/L to calibrate and validate the analytical methods employed in this study. The inclusion of these standards served a dual purpose in the experimental setup. The analytical instruments and methods employed throughout the study were calibrated to ensure accurate and reliable measurement. The second category encompassed seven reference samples designed to span the nitrate concentration spectrum from high to low. Reference samples were carefully prepared by diluting the standard solution with nanopore water under controlled conditions to ensure accuracy and reproducibility. The final nitrate concentration of each reference sample was determined precisely using an established dilution factor. The third group comprised rainwater samples collected from two distinct locations within the Eastern Province. The first location is near Wadi Al Batin, which is characterized by its predominantly agricultural landscape (Rains 1 and 2). Vegetables and local crops are prevalent in this area. Livestock farming is a prominent feature of the region. It is customary to use pesticides in agricultural practices in this location. The second set of rainwater samplers (Rains 3, 4, and 5) was positioned at the top of the Hafr Al Batin City government building approximately 11 m above the ground level. Unlike in the Wadi Al Batin region, this location’s vicinity does not engage in agricultural activities.
The fourth and fifth groups include groundwater samples from deep and shallow wells at various locations. These wells were presumed to contain high and low nitrate levels. The samples were collected directly from the wells, ensuring minimal contamination risk, diligently preserved in glass containers, and promptly sealed upon collection. The final category featured a single nanopore and three distilled water samples with an almost negligible nitrate content. Water was used as an essential control to provide a reference sample for assessing nitrate levels that were close to zero. The sample sizes were determined based on logistical feasibility and prior studies, indicating representativeness for preliminary correlation assessment. While limited, these numbers were sufficient to observe consistent trends across sample types.
Two different methods were used to measure the nitrate in water because of the range of nitrate levels. Measurements from ISE and YSI 9500 were cross-validated using duplicate samples. The agreement between instruments was within ±53%, indicating acceptable consistency. An ion-selective electrode (ISE) pocket meter was used which involved 0.3–2.0 mL of the sample being placed into the ISE system’s small measurement well via pipette. The measurements took approximately 1 min. The device could measure nitrate with an accuracy of ±10% with proper calibration, as mentioned by the manufacturer. Prior to each measurement, a two-point calibration was performed using manufacturer-provided standards of 150 and 2000 mg/L.
YSI 9500 photometers (YSI Inc. Yellow Springs, OH, USA) were used for photometric analysis to analyze nitrate concentrations. This instrument can be used for laboratory or on-site analysis. This portable device can measure over a hundred parameters by selecting an appropriate program; however, for simplicity, we will focus only on nitrate measurements. For general analytical applications, both transmittance (test program 0) and absorbance (test program 1) can be evaluated. The process involves directing light through a specialized test tube containing the sample solution and a colored filter, which then reaches the photodetector. The system automatically selects filters to isolate light of a specific wavelength. In completely colorless solutions, all light passes through the unimpeded light. However, colored samples absorb light, resulting in a proportional reduction in light transmission. The photometer quantifies the color produced by the reaction between the chemical reagents and the water sample. The preprogrammed calibrations for each test parameter were stored in a photometer. To optimize sensitivity, various test procedures utilize different wavelengths, with the instrument automatically choosing the appropriate one. Calibration was achieved by inputting a unique program for each test procedure, enabling the instrument to select the correct wavelength filter and convert the photodiode response into concentration reading. Consequently, the instrument provides a direct display of test results.
The determination of nitrate concentration in the water samples using the photometric method involved a two-step process. Initially, nitrate was reduced to nitrite, which was then identified through a diazonium reaction, resulting in a reddish dye. The reduction process utilized a specialized nitrate test powder and a tablet containing zinc, which promoted rapid flocculation after a brief contact period. The test was conducted in a unique Nitratest Tube, which is a graded container with a hopper bottom designed to facilitate sample preparation and decanting. The nitrite produced during the reduction phase reacts with SAA in the presence of N-(1-naphthyl)-ethylenediamine, generating a crimson hue. A Nitricol tablet containing the necessary reagents was then introduced into the test solution. The intensity of the red dye was quantified by measuring absorbance at 493 nm using a YSI 9500 photometer. This measurement involved diluting 10 mL of water and comparing it with the absorbance of a blank distilled water sample. A schematic diagram to measure the nitrate concentrations in the water samples using photometric analysis is shown in
Figure S1 in the Supporting Information. Detailed preparation steps followed the standard procedures outlined in the manufacturer’s manual (Horiba, Kyoto, Japan, 2023). This ensured reproducibility and accuracy in photometric analysis. A calibration graph was subsequently created; further details regarding these measurements can be found elsewhere. Electrical conductivity and pH were measured using a BLE-C600 meter (JiNan Huiquan Electronic Co., Ltd. Jinan City, Shandong, China), which is a reliable instrument for assessing water quality parameters.
3. Results and Discussion
3.1. Dilution Effect on Electrical Conductivity, Total Dissolved Solids and Nitrate
Diluting concentrated water samples with nanopore water is a common procedure for water analysis. This process serves multiple purposes, including enhancing the measurement accuracy, reducing chemical consumption, and improving sample safety. Appropriate dilution is very important for obtaining reliable results, optimizing resource utilization, and ensuring the safe handling or consumption of the sample. Elevated nitrate concentrations in water can interfere with analytical instruments, potentially leading to measurement errors and unreliable results. Proper dilution ensures that nitrate levels fall within the optimal detection range of the testing methods, thus improving precision and reproducibility. Furthermore, dilution can reduce chemical consumption by decreasing the quantity of reagents required for testing, rendering the analysis more cost-effective and environmentally sustainable. The dilution effect may significantly alter the electrical conductivity and total dissolved solids of the solution. The addition of water to a solution containing dissolved ions decreased the concentration of these ions, resulting in a reduction in both electrical conductivity and TDS.
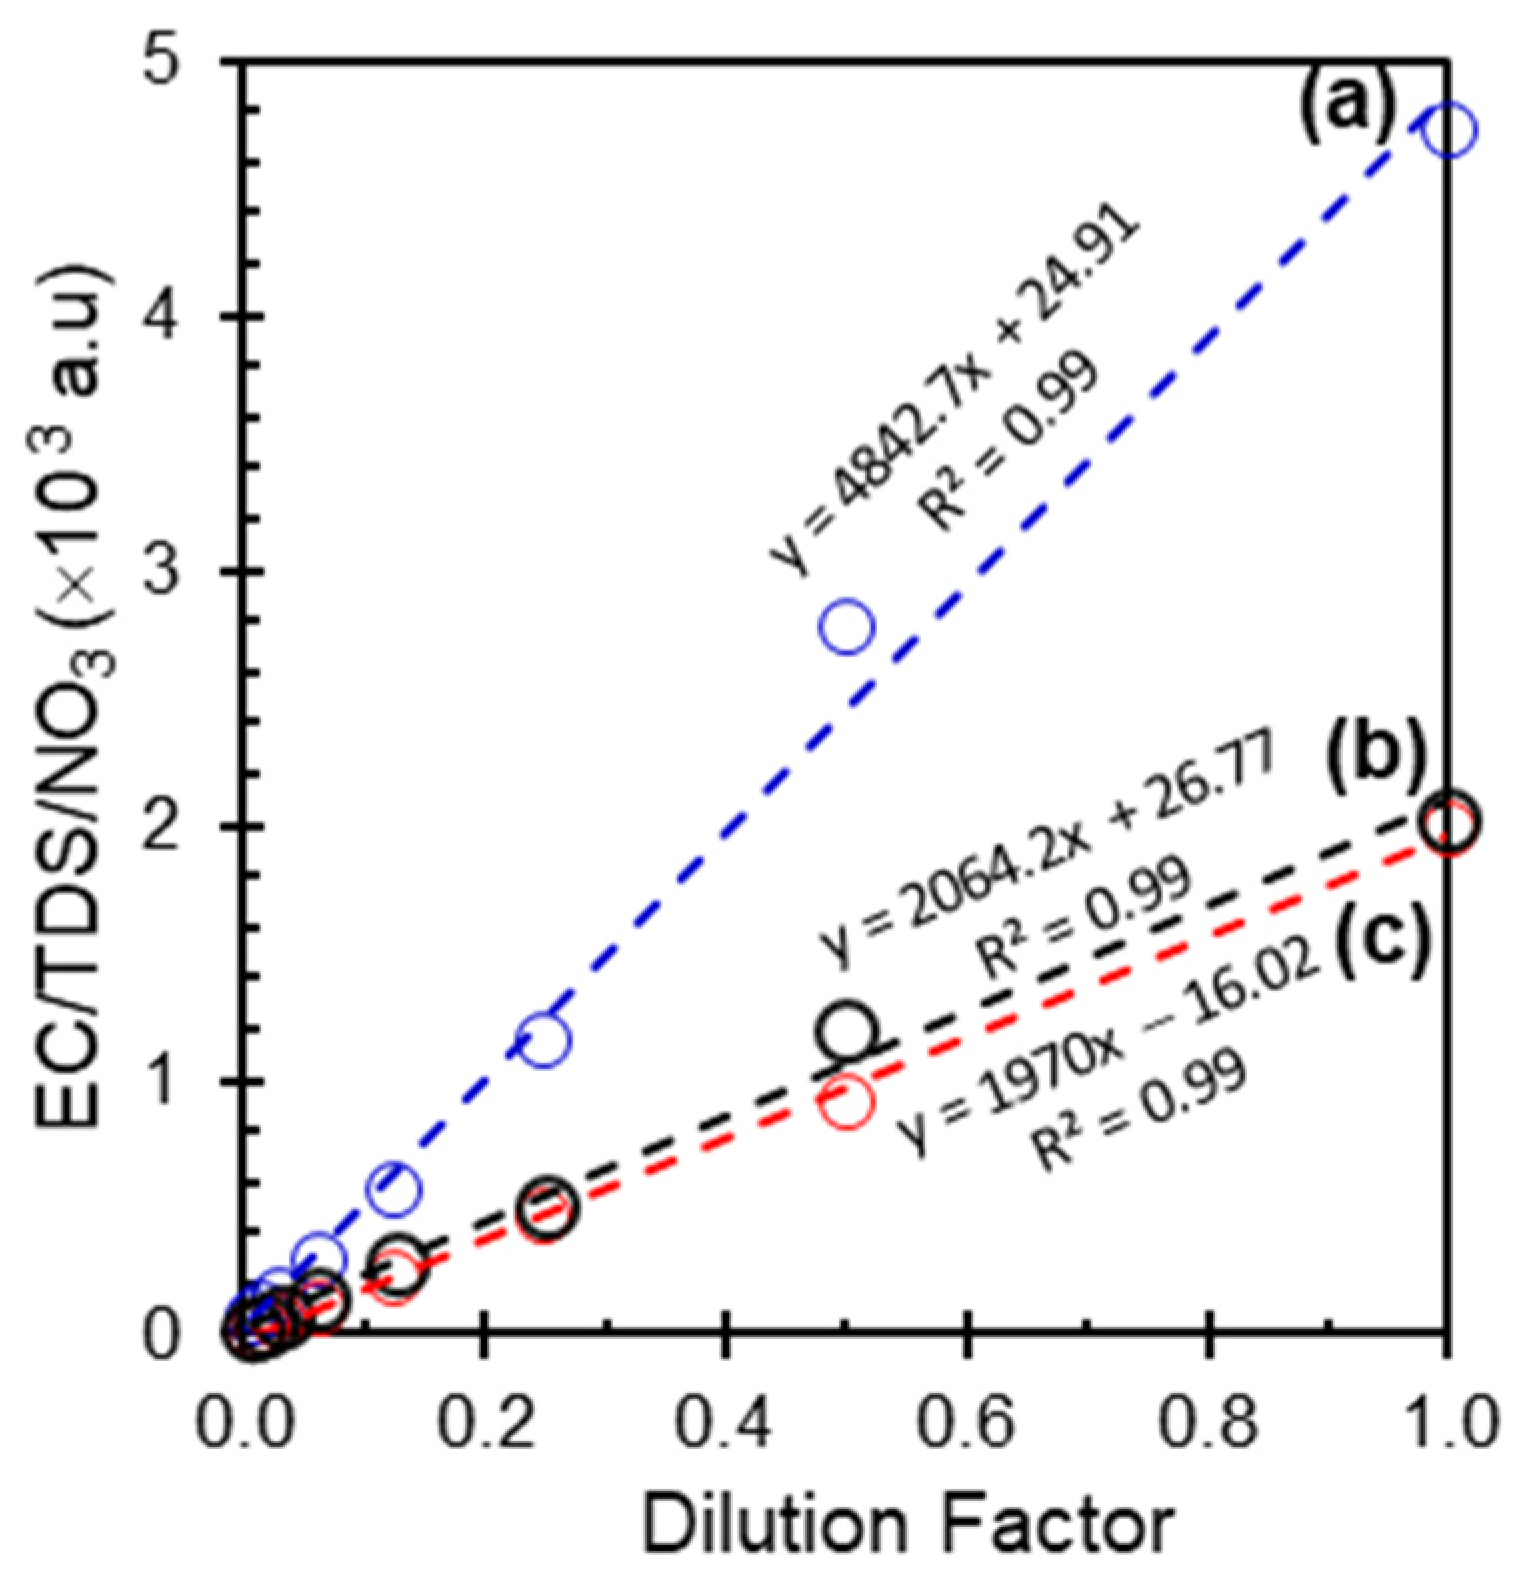
Figure 1 shows the relationship between the electrical conductivity (EC) of a standard sample (nitrate concentration of 2000 mg/L) diluted in distilled water at various dilution factors. The diluted samples were subsequently measured using an ion-selective electrode (ISE) and conductivity meter (BLE-C600). The graph demonstrates a strong linear correlation between the EC and dilution factor, indicating direct proportionality. The high coefficient of determination suggests a near-perfect fit and a negligible systematic error in the measurements. The robustness of both techniques was evident, demonstrating their reliability and precision in EC measurements across various dilution factors.
The relationship between total dissolved solids and nitrate as a function of dilution factors demonstrates another significant advantage by showing the changes in TDS and nitrate concentrations with varying dilution levels. This linear increase indicates a substantial and consistent increase in TDS with increasing dilution factor, closely approximating the original sample concentration and facilitating the accurate prediction of TDS in diluted solutions. Regarding the dilution process, as water is added to a solution containing dissolved ions, the concentration of these ions decreases, resulting in a reduction in both electrical conductivity and TDS. The electrical conductivity, which quantifies the ability of a solution to conduct electricity, decreases proportionally with dilution, owing to the reduced availability of ions to carry the electrical charge. Similarly, TDS, which represents the total amount of dissolved substances in water, also decreases with dilution, because the same quantity of dissolved solids is distributed over a larger volume of nanopore water. This inverse relationship among dilution, electrical conductivity, and TDS is significant for various applications. The initial nitrate concentration was 2000 mg/L, showing that nitrate ions contributed significantly to the solution conductivity, confirming its predominant role. However, contributions from other dissolved ions (e.g., Na
+, Cl
−, SO
42−) might be present. A similar inverse relationship has been observed for nitrate dilution. The dilution of the corresponding nitrate data showed a strong linear relationship between the dilution factor and the nitrate concentration. It should be noted that the dilution effect may not always align with changes in EC, TDS, and NO
3. Arabgol et al. developed a support vector machine model to predict nitrate concentration using various parameters, including EC and TDS, suggesting that nitrate levels can be influenced by factors beyond simple dilution [
1]. Additionally, Sanusi et al. reported that nitrate concentrations were observed to be the lowest among measured parameters in surface water during the wet season, while EC values remained high [
22]. This trend reflects basic dilution principles, where the reduction in ion concentration leads to a proportional decrease in electrical conductivity and TDS.
3.2. Nitrate Concentration and Electrical Conductivity for Standard and Reference Samples
The relationship between the nitrate concentration and electrical conductivity offers valuable insights into the ionic composition of water sources and potential contamination. This correlation may serve as a crucial benchmark for understanding nitrate behavior in controlled environments and enable the development of calibration curves for rapid nitrate estimation.
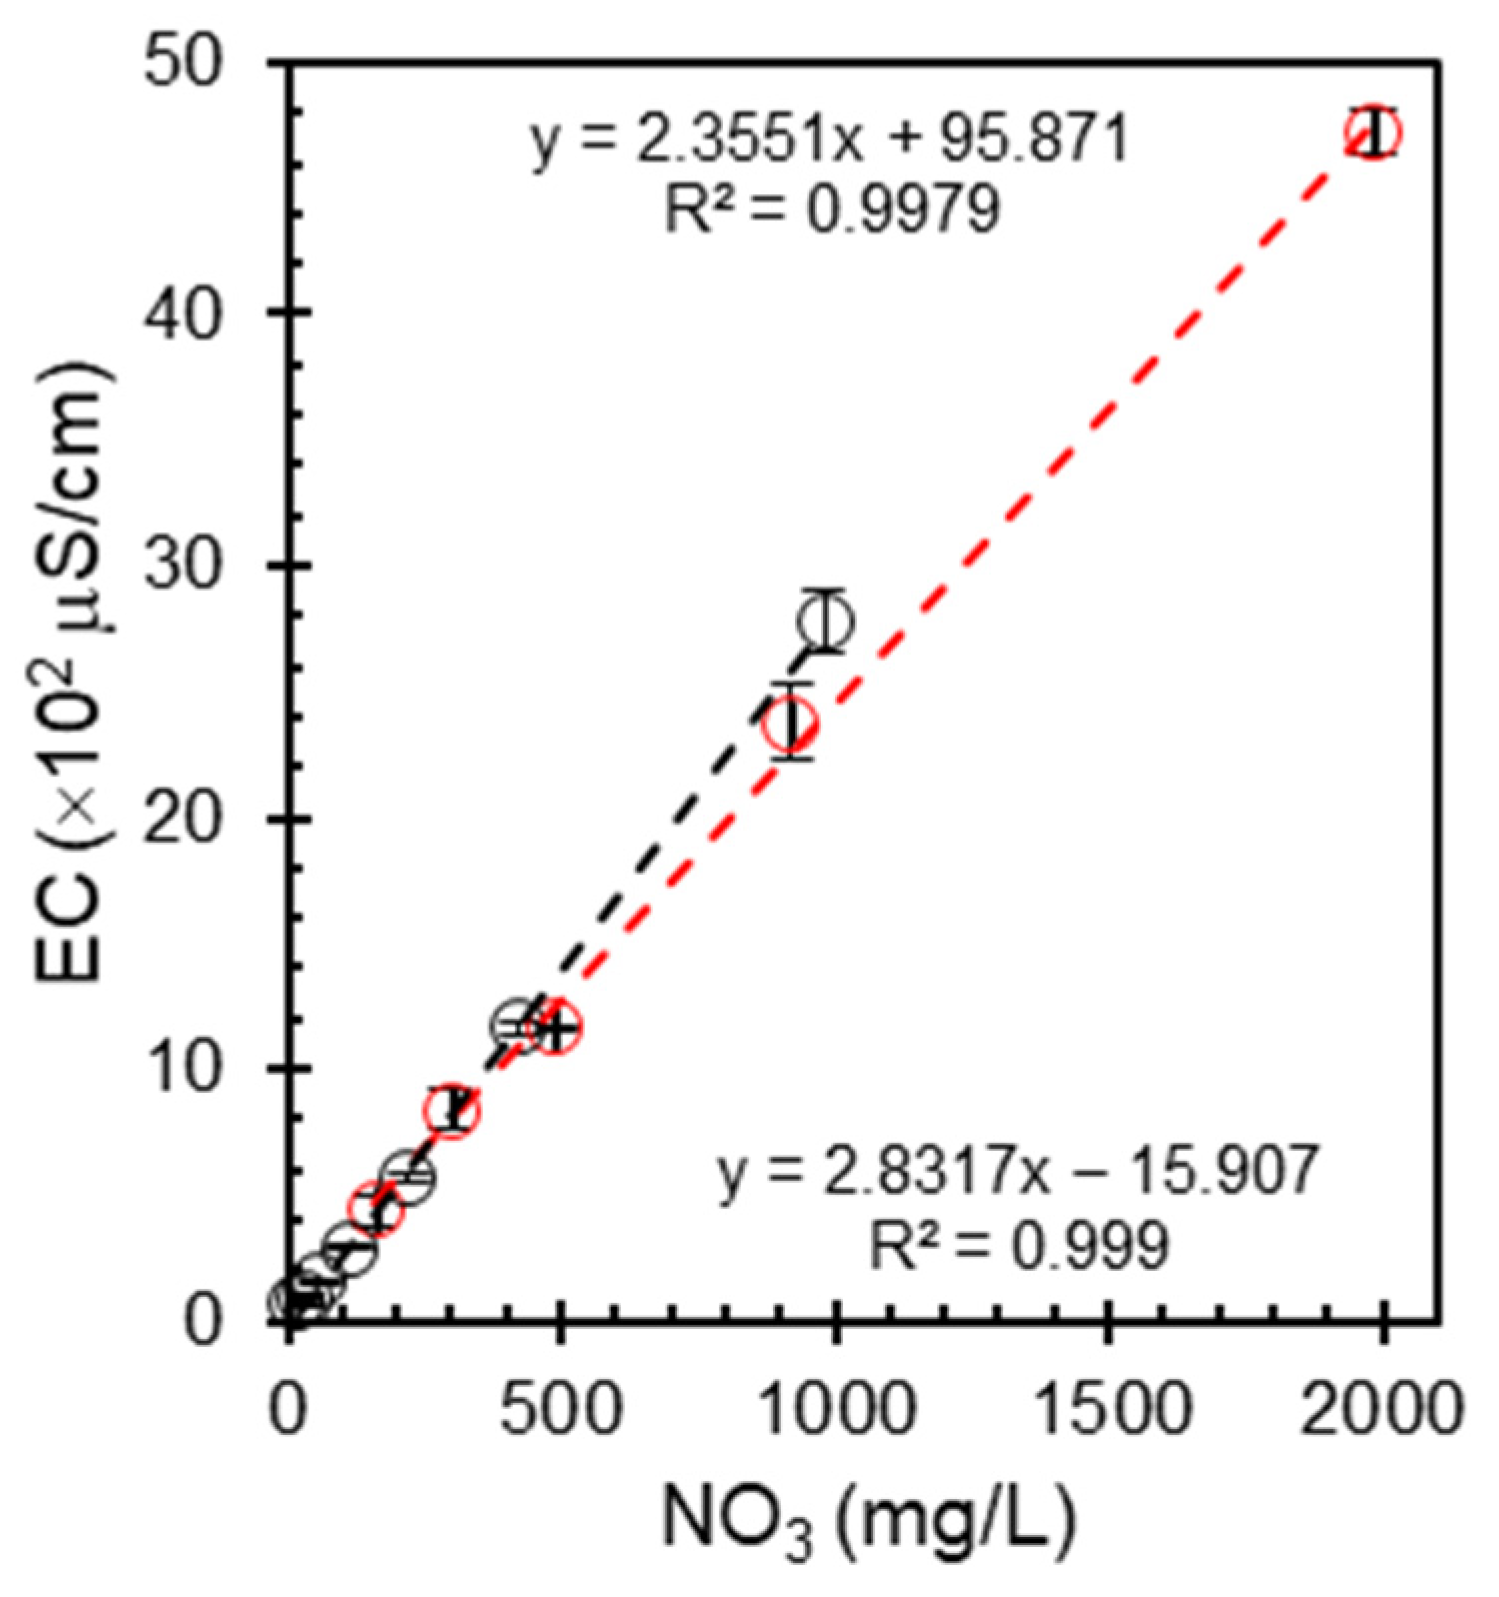
Figure 2 shows the relationship between the nitrate concentration (NO
3−) and electrical conductivity (EC) for the standard and reference samples with error bars. The graph demonstrates a strong positive correlation between nitrate levels and electrical conductivity in both types of samples, with increasing nitrate concentrations corresponding to higher electrical conductivities. This trend is consistent with expectations, as nitrate salts contribute to the ionic strength of the solution, thereby enhancing conductivity. It was found that the addition of nitrate salts to aqueous solutions increased the ionic conductivity, as demonstrated in a recent study on the relationship between structure and ion transport in liquid electrolyte solutions [
23]. The observed linear relationship suggests that electrical conductivity may serve as a reliable method for estimating nitrate levels in water, particularly in controlled environments. However, it is imperative to note that factors such as the presence of other ions, temperature variations, and complex matrix effects in natural water bodies may influence the accuracy of nitrate estimations based solely on EC measurements. For example, a study on groundwater quality in Zaheerabad found that fluoride concentration was controlled by geogenic processes, whereas nitrate concentration was influenced by anthropogenic factors such as fertilizer use [
8]. This suggests that the relationship between electrical conductivity and nitrate concentration may not always be straightforward. Consequently, although promising, this approach necessitates careful calibration and validation across diverse environmental conditions to ensure its reliability as an independent method for nitrate quantification.
3.3. Relationship Between Electrical Conductivity and Nitrate Concentration in Rainwater
Nitrate may be one of the factors that influence rainwater conductivity. Atmospheric deposition in rainwater can introduce various ions such as sulfates, ammonium, hydronium, and chlorides, which can independently affect the electrical conductivity of rainwater. Dissolved CO
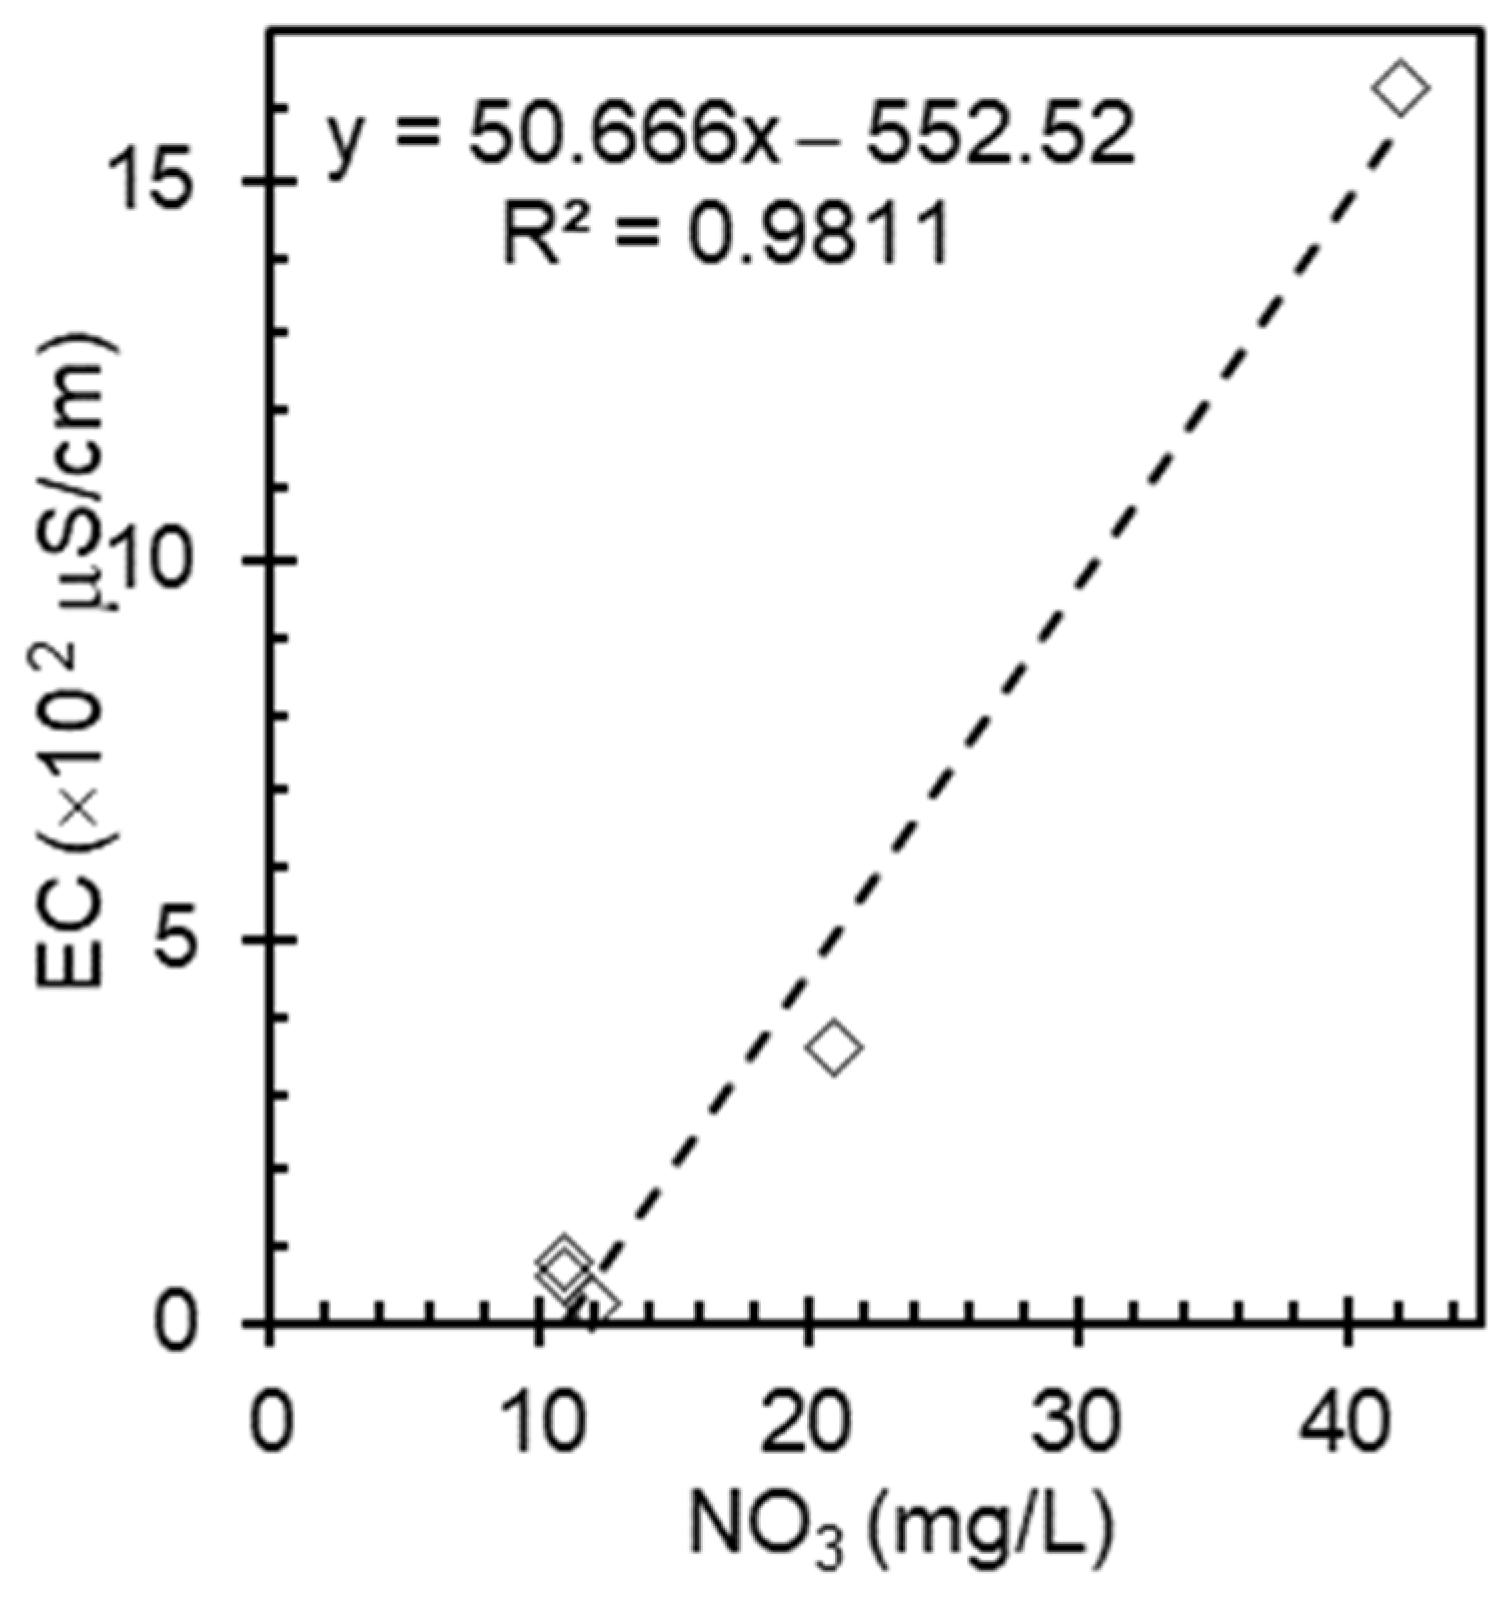
2 forms carbonic acid, altering rainwater pH and impacting ion dissociation, whereas organic matter from natural and anthropogenic sources contributes to additional dissolved compounds. To account for these complex interactions between the nitrate concentration and electrical conductivity in rainwater, samples were collected twice every year, as shown in
Figure 3.
A weaker correlation between the nitrate concentration and EC was observed compared to the standard solutions and seawater. The variability in EC values at similar nitrate levels suggests that additional factors such as atmospheric deposition, dissolved CO
2, and organic matter influence rainwater conductivity. The lower ion content in rainwater diminished the impact of nitrate on EC measurements. Interestingly, the concentration of nitrate in rainwater depends on its location and surrounding environment. For instance, rainwater collected from rural areas has higher nitrate concentrations than those collected from urban and industrial areas. This variation in nitrate levels would consequently affect rainwater conductivity in different regions. From this observation, it can be concluded that nitrate is an important factor influencing rainwater conductivity as it is a major ionic component of precipitation. However, it is worth noting that other ions such as ammonium, sulfate, and various metallic constituents also contribute to the overall conductivity of rainwater [
24]. The specific impact of nitrate on conductivity may vary depending on location, season, and other environmental factors. As an example, Keresztesi et al. indicate that nitrate (NO
3) is one of the major ions present in rainwater, along with sulfate (SO
4) and chloride (Cl
−). The study also mentions electrical conductivity as one of the analyzed parameters, suggesting a potential relationship between these factors [
25,
26]. However, the report does not explicitly state a linear correlation between electrical conductivity and nitrate concentration in rainwater.
3.4. Nitrate Levels and Electrical Conductivity in Groundwater Samples
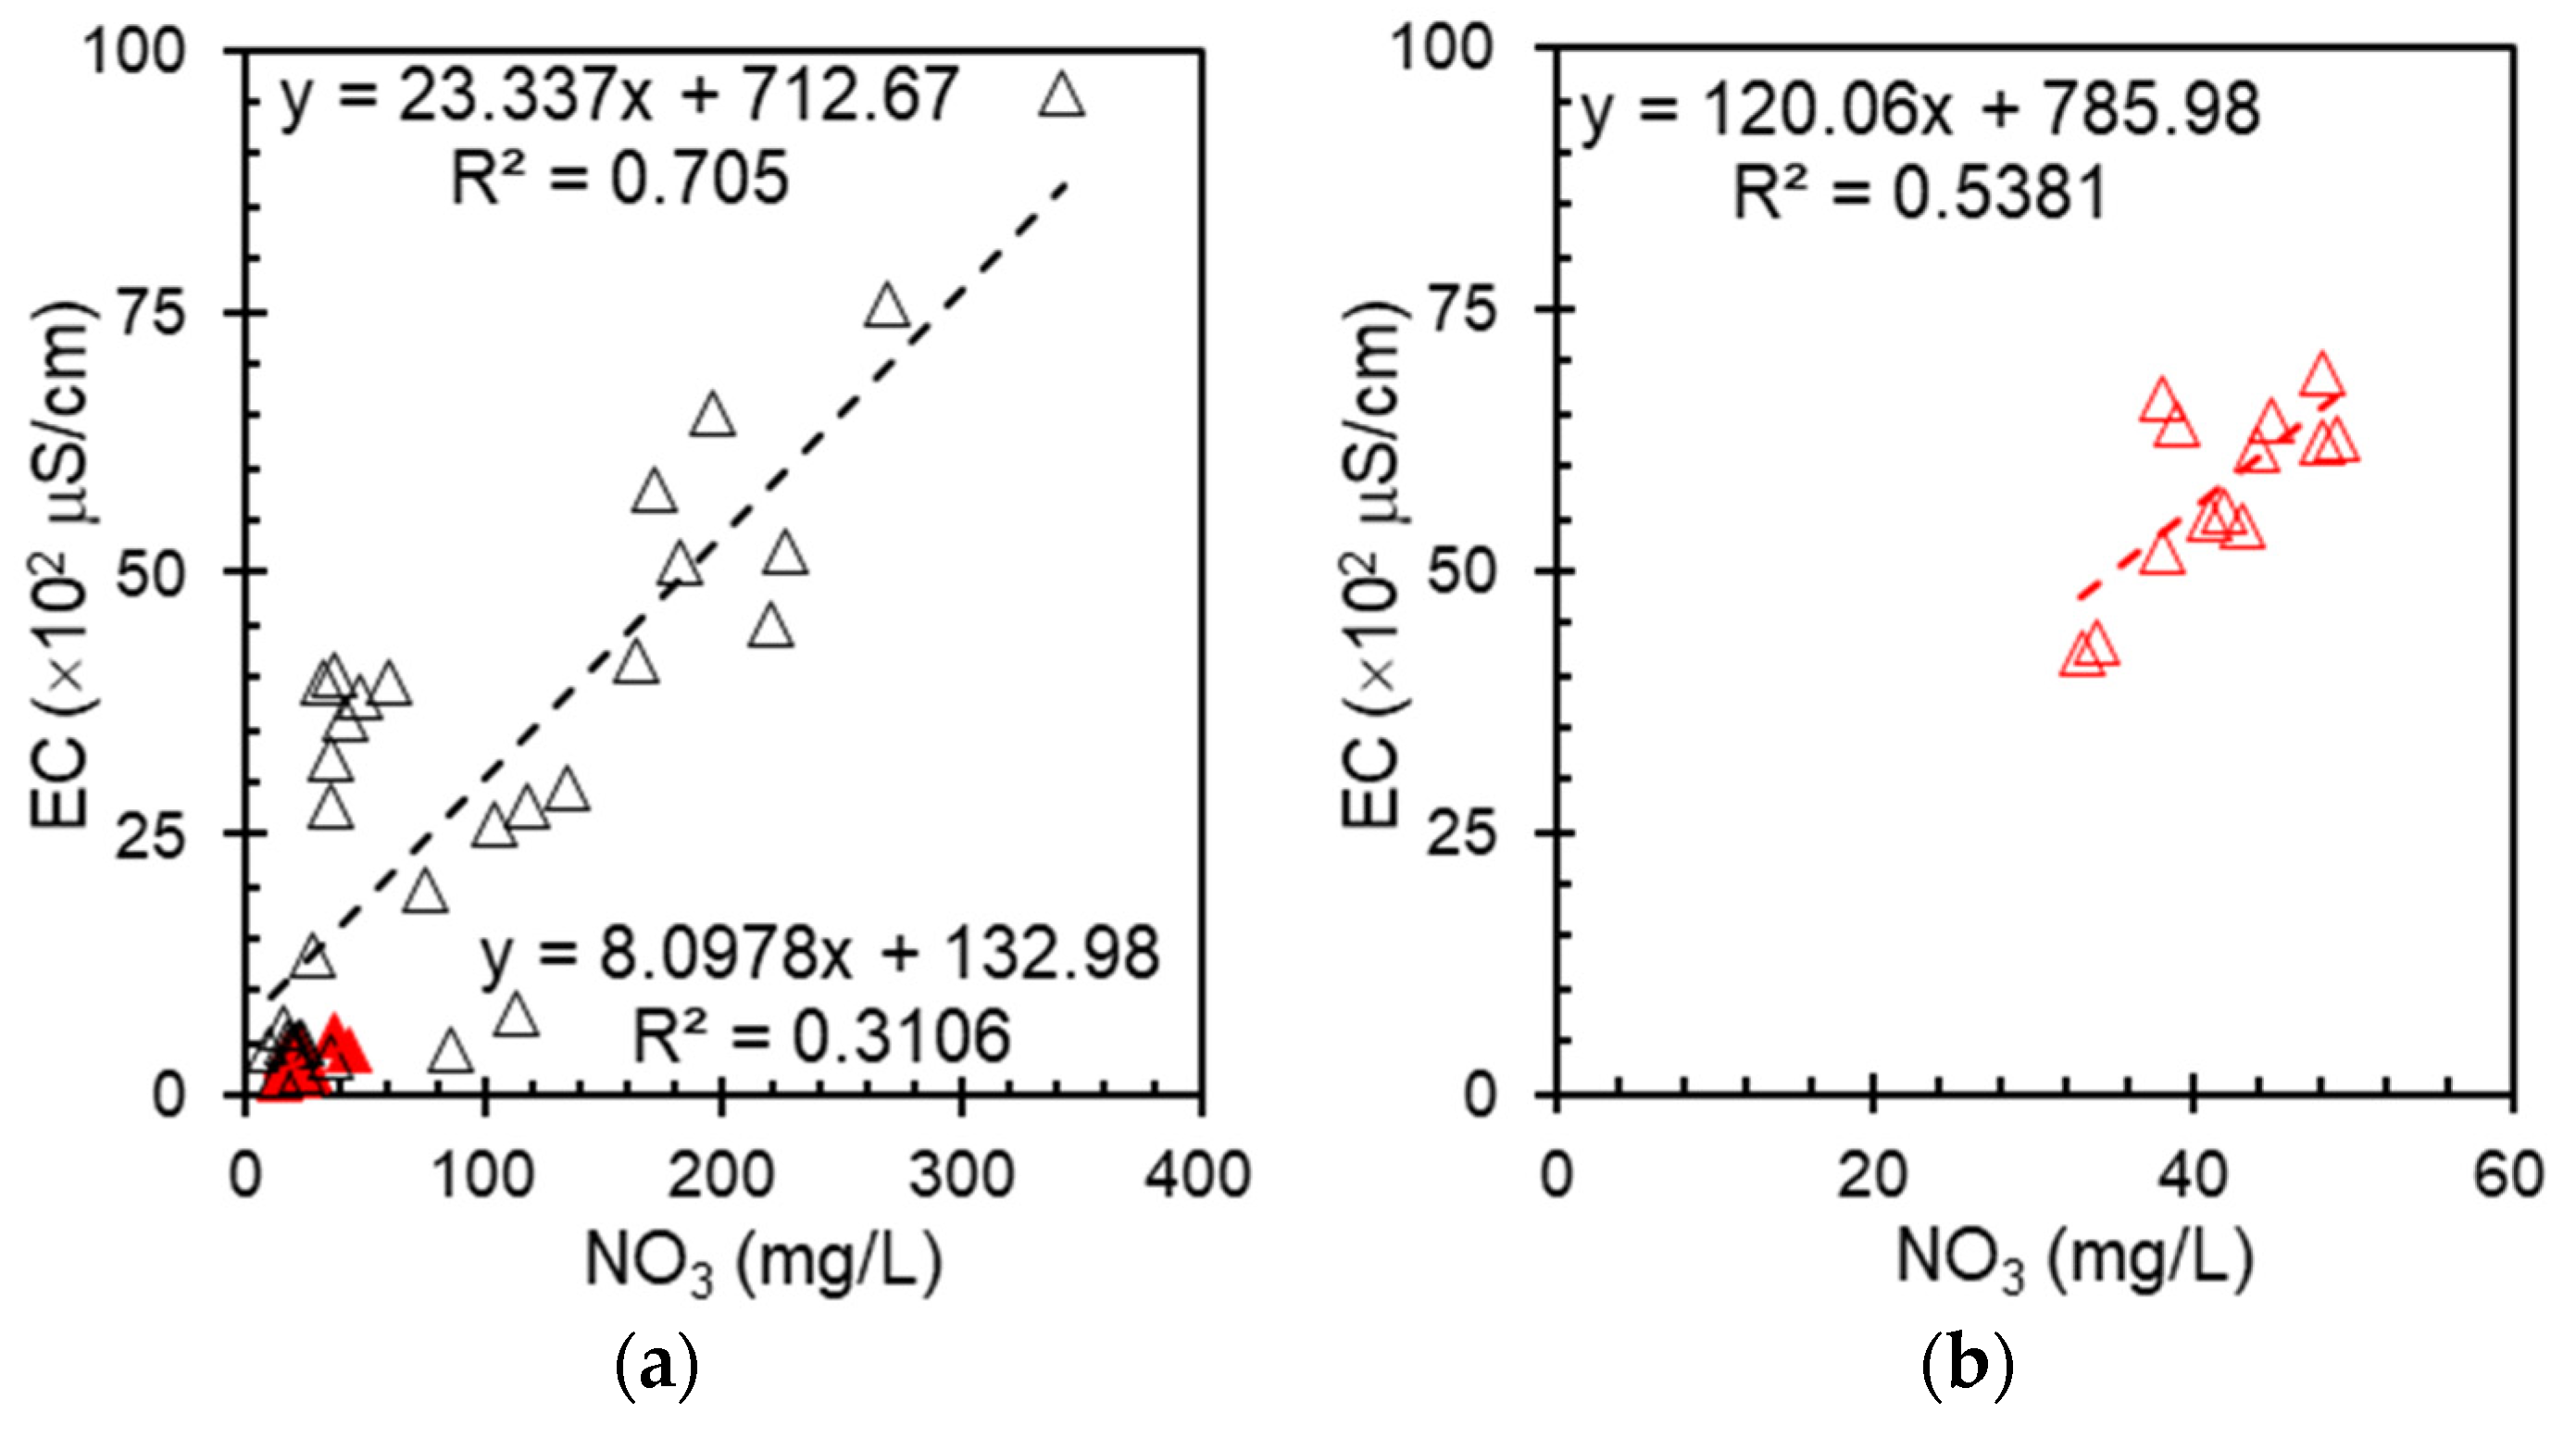
Figure 4 shows the relationship between nitrate and EC in the groundwater, distinguishing between shallow wells (red triangles) and deep wells (black triangles). A stronger correlation was observed in shallow wells, where nitrate contamination from agricultural runoff and surface infiltration were more significant. Deep wells show a more variable trend, possibly owing to geological influences and longer residence times [
19], which affect ionic composition. Both shallow and deep wells were sampled from the same region to ensure geographic consistency. Among them, most of the deep wells had undergone treatment via ion exchange. The differentiation between shallow and deep groundwater highlights the role of environmental factors in determining the nitrate distribution and conductivity responses. Shallow wells demonstrate a more pronounced correlation between these parameters, reflecting their heightened susceptibility to surface contaminants such as agricultural runoff. This increased vulnerability translates to a greater likelihood of elevated nitrate levels in shallow groundwater sources. The stronger nitrate–EC relationship in shallow wells can be attributed to the shorter travel time and reduced filtration of surface pollutants, allowing for a more direct impact on water quality.
In contrast, the deep wells present a more nuanced scenario in which the nitrate–EC relationship is less straightforward. The variability in the nitrate–EC relationship observed in deep wells arises from multiple factors that influence groundwater chemistry over extended periods. Unlike shallow wells, which are more directly affected by surface contamination and exhibit a clear correlation between nitrate levels and electrical conductivity, deep wells present a more complex scenario because of several interrelated influences. One major factor is the geological composition of the bedrock, which dictates mineral content and ionic interactions within the aquifer. As water percolates through different geological layers, it undergoes chemical changes, acquiring dissolved ions from minerals that may not be directly linked to nitrate sources. This results in a more diverse ionic profile, making the nitrate–EC relationship less predictable than that in shallow groundwater. Another key aspect is that deep wells are commonly used for commercial purposes, such as industrial and municipal water supplies. These wells often undergo treatment processes, including filtration, chemical adjustments, and ion exchange, which alter the natural chemical composition of the water. The removal or addition of specific ions during treatment decouples the direct relationship between nitrate levels and EC, making the correlation less straightforward compared with untreated groundwater sources, as shown in
Figure 4b.
Despite these complexities, the observed correlation supports the potential application of EC as a proxy for nitrate estimation in groundwater. However, given the diverse factors influencing deep groundwater chemistry, additional calibration is required to improve the accuracy of the EC-based nitrate predictions. However, these findings are location-specific and may not be generalizable globally due to local hydrogeological and anthropogenic factors.
3.5. Comparative Analysis of Nitrate Concentration and Electrical Conductivity Across Different Water Sources
A comparative analysis of nitrate concentration and electrical conductivity across diverse water sources is presented in
Table 2. The standard/reference samples demonstrated a robust linear correlation (R
2 > 0.85), rendering them optimal for calibration curves and expeditious nitrate estimation. Rainwater demonstrates a weak correlation (R
2 < 0.50) influenced by atmospheric deposition, dissolved CO
2, and organic matter, suggesting that multiple external factors affect the EC. Groundwater presents varying correlations: shallow wells show stronger correlations due to surface contamination, whereas deep wells exhibit complex relationships due to prolonged water residence time and geological interactions. The analysis emphasizes the importance of considering environmental and chemical influences when interpreting nitrate–EC relationships. Although standard solutions provide a reliable baseline, natural water bodies present unique challenges that require tailored analytical approaches.
3.6. Correlation of Oxidation–Reduction Potential and Electrical Conductivity Across Different Water Sources
The correlation between the oxidation–reduction potential (ORP) and electrical conductivity (EC) of different water sources is essential for assessing water quality, identifying contamination, and understanding chemical interactions.
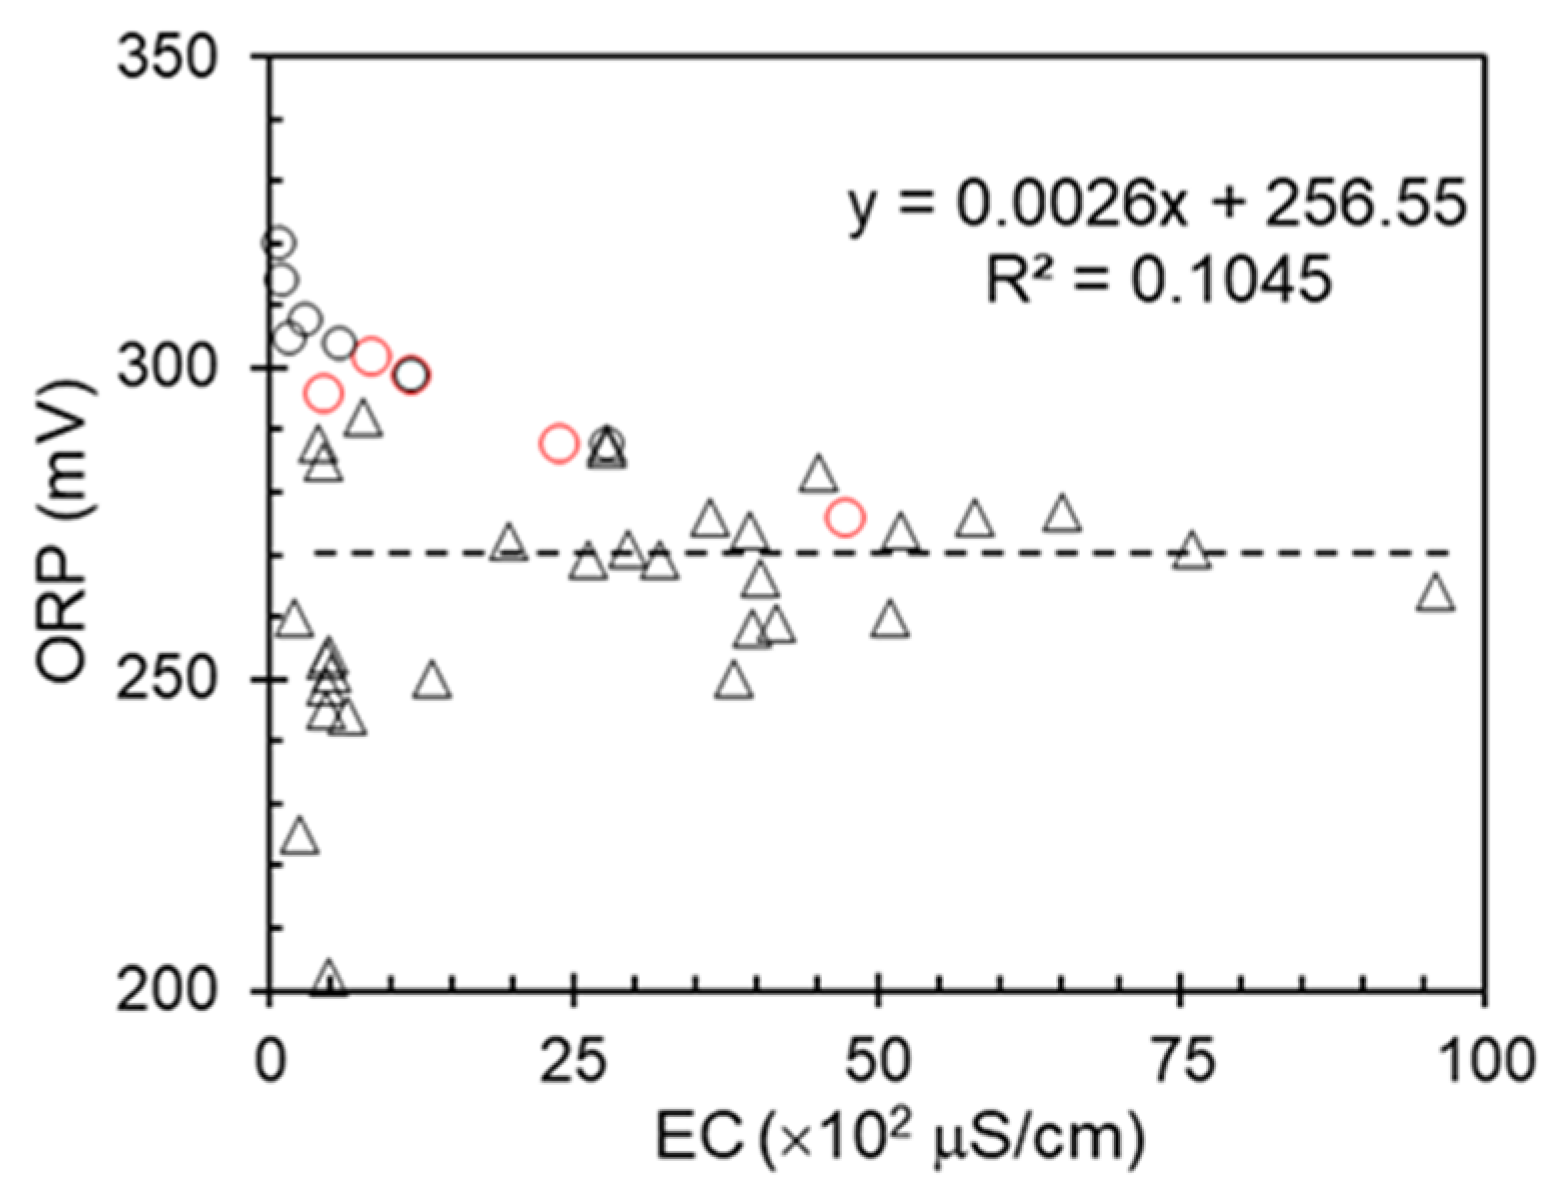
The relationship between the oxidation and reduction potential (ORP) and electrical conductivity (EC) of various water sources is shown in
Figure 5. No significant correlation was found between ORP and EC across the various water sources examined in this study. Despite the importance of these parameters in water quality assessment and management, the data do not reveal a consistent relationship. This lack of correlation was observed across different water types, including deep well waters, and shallow wells. The variability in the ORP and EC measurements across these sources suggests that these parameters may be influenced by distinct factors in different water environments. Similarly, deep well waters showed high conductivity but a stable ORP, whereas shallow wells displayed more variable measurements for both parameters. The absence of a strong correlation between ORP and EC challenges the assumption that these parameters can be reliably used in conjunction with pollution detection or the determination of water treatment approaches.
3.7. Future Works
Future research should focus on several key areas. These include developing more sophisticated multivariate models to improve nitrate estimation accuracy across different water sources, investigating the specific contributions of various ionic species to the overall conductivity in complex water systems, and conducting long-term studies to assess seasonal variations in nitrate–conductivity relationships. Additionally, exploring advanced machine learning techniques such as regression trees, artificial neural networks (ANN), and support vector regression (SVR) could enhance the predictive capabilities for nitrate levels based on easily measurable parameters, such as electrical conductivity. Possible datasets include EC, pH, TDS, and seasonal nitrate measurements from local municipal databases and field campaigns. Developing standardized protocols for EC-based nitrate estimation, examining the relationship between nitrate, EC, and emerging contaminants in urban and agricultural runoff, and exploring the integration of remote sensing techniques with EC measurements could yield valuable insights for water quality management and monitoring. Future research should also prioritize the inclusion of soil solutions from fertilized agricultural fields to exhibit strong nitrate–EC correlations due to the predominance of nitrate as a major ionic component.
4. Conclusions
This study investigated the specific aqueous environments where the relationship between nitrate concentration and electrical conductivity is meaningful across various water sources, including standard solutions, rainwater, and groundwater. The findings revealed distinct patterns and correlations specific to each water type, highlighting the complexity of water quality assessments in diverse aquatic environments.
In particular, shallow wells in agricultural zones and rainwater collected from rural areas demonstrate stronger correlations, suggesting EC may serve as a rapid screening tool in these contexts. Conversely, environments such as treated deep groundwater, where other ions dominate conductivity, are unsuitable for this approach. We recommend focusing future work on nitrate-dominated environments and emphasize that EC should not be used as a universal predictor without localized calibration. Where laboratory capabilities exist, direct nitrate measurement remains the gold standard.
The present study has key limitations and sources of variation affecting the generalizability of results across study areas, including geographic specificity, environmental variability, geological factors, seawater composition, and agricultural practices. Location-specific groundwater findings, environmental variations, land use differences between rural and urban areas, geological influences on deep groundwater, the unique ionic composition of Arabian Gulf seawater, and agricultural practices may contribute to result disparities. These limitations require tailored monitoring strategies across diverse water sources and regions.


