Article

Deficit Irrigation of Greenhouse Cucumber Reduces Mineral Leaching and Improves Water Use Efficiency While Maintaining Fruit Yield

Beijing Key Laboratory of Growth and Developmental Regulation for Protected Vegetable Crops, College of Horticulture, China Agricultural University, Beijing 100193, China
*
Authors to whom correspondence should be addressed.
These authors contributed equally to this work.
Nitrogen 2025, 6(1), 18; https://doi.org/10.3390/nitrogen6010018
Submission received: 11 February 2025 / Revised: 8 March 2025 / Accepted: 11 March 2025 / Published: 14 March 2025

Abstract

:
Excessive irrigation in protected vegetable production often results in soil nutrient loss and groundwater contamination. Cucumber (Cucumis sativus L.) is a widely cultivated and important vegetable in the world and a sensitive plant to irrigation water supply. In order to obtain higher water use efficiency (WUE) and to assess the leaching loss of mineral elements under the current strategies of irrigation and fertilization in the production of protected crops, we conducted experiments with three irrigation levels, namely, normal (NI), optimized (OI), and deficit irrigation (DI), on cucumber in a solar greenhouse. The results indicated that the contents of nitrate–nitrogen (NO3–N) in the top soil layer increased significantly under the reduced irrigation condition (OI and DI) after two cultivation seasons compared with normal irrigation (NI). However, there were no significant differences in the contents of available phosphorus (A–P) and available potassium (A–K) between the three treatments in each soil layer during a single irrigation cycle and for the whole growth cycle. In addition, compared to the NI condition, reducing the amount of irrigation (OI and DI) decreased the amount of leaching of the soil mineral elements by more than half without jeopardizing the fruit yield of cucumber, particularly for DI. Under the three irrigation treatments, the economic yield of cucumber varied from 64,513 to 72,604 kg·ha−1 in the autumn–winter season and from 89,699 to 106,367 kg·ha−1 in the winter–spring season, but the differences among the treatments were not significant. Moreover, the reduced irrigation treatments (OI and DI) substantially improved WUE by 43.9% and 135.3% in the autumn–winter season, and by 82.2% and 173.7%, respectively, in the winter–spring season, compared to the NI condition. Therefore, deficit or optimized irrigation was a potential and suitable irrigation strategy in the solar greenhouse for increasing the water use efficiency, reducing the amount of leached soil mineral elements, and maintaining the economic yield of cucumber crop. Overall, our results provided some insight into the future applications of water-saving irrigation techniques in sustainable greenhouse vegetable production.

1. Introduction

The application of suitable irrigation management induces high yield and fruit quality in vegetable production [1]. With the extensive requirement of water resources in vegetable growth, there is an urgent need to improve water use efficiency in order to contribute to the development of sustainable agriculture. Protected vegetable production is widely developed in many regions all over the world. In particular, the solar greenhouse, an unheated plastic greenhouse, plays an increasingly important role in off-season vegetable cultivation in China [2]. Solar greenhouses exhibit great advantages in the production of seasonal vegetables due to their controlled environment, which prolongs the growing season length [2]. Due to their relatively closed environment, irrigation water, and chemical fertilizers in solar greenhouses are totally applied by farmers.
However, in order to increase both yield and income, excessive irrigation and fertilization are common in the vegetable production of solar greenhouses [3]. Flooding irrigation and over-fertilization not only lead to a waste of resources but also cause environmental pollution (nitrogen and phosphorus over-accumulation in soils, soil salinization, etc.) in greenhouse vegetable production. Almost 40% of soils in the planting area of greenhouse vegetable production across China have shown salinization over the last decade [4]. In recent years, increasing water shortages associated with the overuse of surface water, falling water tables, water pollution, and soil salinization are threatening the sustainability of agricultural production [5,6]. Efficient water resource management in agriculture is critical for crop health and sustainability. Recent advancements in Internet of Things (loT)–based water management systems have revolutionized agricultural water management practices [7]. These systems employ soil-embedded and environmental sensors to continuously monitor parameters such as soil moisture and weather conditions. However, most existing implementations primarily focus on irrigation scheduling while lacking integration with nutrient management protocols. This study proposes a relatively novel framework to analyze soil nutrient dynamics under different irrigation levels, aiming to inform the development of integrated IoT systems that synchronize water and nutrient management strategies for enhanced agricultural sustainability [8,9].
Irrigation water entering the soil can dissolve the chemical elements in the upper part of the soil profile and translocate them to deeper layers [10]. The soil contains a high concentration of mineral nutrients (e.g., nitrogen, phosphorus, and potassium), which are essential for plant growth and development, yet the demand of plants for these elements is often less than the amount in the soil. In the case of excessive irrigation, as a consequence, a large percentage of the nutrients applied to the soil can be lost, mainly by leaching, inducing economic losses and contaminating the groundwater [11]. The flushing of excess nitrogen and phosphorus into streams and lakes, and eventually reaching the ocean, has become the primary cause of eutrophication [12] and also results in groundwater contamination [13]. The soil agglomerate structure, irrigation volume, and chemical composition of water are all factors determining the leaching of nitrogen from soil [14,15]. In addition, Sajjad et al.’s study suggests that the higher agronomic nitrogen use efficiency (ANUE) could be associated with lower NH3 volatilization, denitrification, and nitrification [16]. Phosphorus is the limiting factor of eutrophication in Chinese waters, and concentrations as low as 0.020–0.035 mg per liter can cause eutrophication in lakes [17]. Unlike nitrogen, phosphorus, and potassium, the element calcium is immobile for plants and is more susceptible to leaching in the soil. In a study on the properties of soil nutrient loss from four experimental sites, Vopenka et al. indicated that the average leaching of calcium was close to hundreds of kilograms. The leaching of calcium in the soil is mainly due to the loss of calcium ions with the water, and can be reduced by decreasing the amount of water applied during irrigation [18].
With the increasing annual cultivation intensity of vegetable crops in continuous cropping systems, the soil environment undergoes progressive alterations, including nutrient depletion, salinization, and structural degradation. This necessitates detailed, empirical data on optimized irrigation and fertilization practices to provide a scientifically robust theoretical framework for guiding sustainable production strategies. Cucumber (Cucumis sativus L.) is the main cultivated vegetable crop in solar greenhouses across China. The yield and quality of cucumber fruits, a nutritionally and economically important sink organ, are two key factors for farmers. Cucumber is a shallow-rooted crop with a general root distribution in the 0–40 cm soil layer. Therefore, the water and nutrient contents in this soil layer are directly related to the plant growth and fruit yield of cucumber. Thus, irrigation and fertilization are crucial farming operations that obviously affect crop yield and quality, as well as the distribution and potential loss of mineral nutrients in soil. Adopting a regulated deficit irrigation strategy or optimal water management for greenhouse crops has great potential for saving water, maintaining yield, improving fruit quality, and increasing water use efficiency (WUE) [11,19,20,21]. Zhou et al. also revealed that optimized nitrogen management can reduce mineral nitrogen leaching loss by 4–86% [15]. Accordingly, previous research has demonstrated that appropriate irrigation and fertilization management can greatly contribute to an improvement in crop productivity and the development of sustainable agriculture. However, the systematical examination and practices related to the impact of water arrangement, especially deficit irrigation, on the agroecological environment of protected cucurbit crop production is relatively limited. In this paper, in order to obtain higher water use efficiency (WUE) and reduce the leaching loss of key mineral elements, we performed experiments with three irrigation levels on cucumber, which is generally considered a model plant of the Cucurbitaceae family, in a solar greenhouse. The three irrigation levels were as follows: normal (525 m3 ha−1, irrigation amount per time; NI), optimized (315 m3 ha−1; OI), and deficit irrigation (189 m3 ha−1; DI). The NI water amount was established based on the regional empirical water usage, with the OI water amount set at 60% of NI, and the DI further reduced to 60% of the OI water amount. The objectives of this work were to (1) assess suitable regulated deficit irrigation and optimized irrigation strategies for a higher WUE and lower mineral leakage rate, without jeopardizing greenhouse vegetable production, and (2) propose a scientific basis and practical guidelines to farmers on how to apply water-saving irrigation techniques for sustainable greenhouse vegetable production.

2. Materials and Methods

2.1. Plant Material and Soil Conditions in the Solar Greenhouse

The Jinyou No.5 cucumber (Cucumis sativus L.) was planted in a solar greenhouse in the Shunyi District (N40°13′, E116°65′) of Beijing City. The experimental period consisted of two cultivation seasons taken as a whole growth cycle, including the autumn–winter (end of August to end of December) and winter–spring (end of January to the end of June) seasons (Table 1). The solar greenhouse (70 m length in east–west direction, 7 m width in north–south direction, and 3.5 m ridge height) had a planting area of 352 m2. The soil was classified as sandy loam with a pH of 6.34, an electrical conductivity (EC) value of 0.31 mS cm−1, and a topsoil bulk density (0–30 cm layer) of 1.28 g cm−3. The soil contained 2.3% organic matter, 6.84 g kg−1 total nitrogen (N), 166.57 mg kg−1 mineral N (nitrate N plus ammonium N), 69.8 mg kg−1 available phosphorus (A–P), and 279.6 mg kg−1 available potassium (A–K).

2.2. Treatments and Experimental Design

The three irrigation treatments were normal (525 m3 ha−1 every time; NI for short), optimized (315 m3 ha−1 every time; OI), and deficit irrigation (189 m3 ha−1 every time; DI). Table 1 reports the amount of water and fertilizers applied under the different irrigation treatments for the two growing seasons (autumn–winter and winter–spring seasons). The same amount of each fertilizer was applied between the three irrigation treatments in the same season. Water–fertilizer integrated equipment was used to control the simultaneous supply of nutrients and water.
The field experiment consisted of the three irrigation treatments arranged in a randomized block design in triplicate, resulting in nine plots. The cucumber plants were grown in raised beds. Each replicate plot (5.6 m × 3.3 m) consisted of three raised beds with a small irrigation furrow (0.4 m width) between the beds. The beds had a 5.6 m length (south–north direction) and 0.7 m width (east–west direction). The raised beds consisted of double rows, with row and plant spacings of 0.35 m and 0.30 m, respectively. Each of the three raised beds were separately used for the destructive sampling of the soil, the recording of the fruit yield, and the monitoring of mineral element leaching. A three-raised-bed buffering belt was present between the plots to prevent the lateral seepage of water and nutrients between experimental plots.

2.3. Analysis of Soil NO3–N and Available P and K Contents

The distribution of the mineral elements nitrate nitrogen (NO3–N), available phosphorus (A–P), and available potassium (A–K) were determined in the different soil layers in an irrigation (fertilization) cycle or after the autumn–winter and the winter–spring growing seasons. During the middle growth period, soil samples were collected five times within a single irrigation (fertilization) cycle according to the schedule: (1) autumn–winter season (19, 21, 26 October and 1, 11 November); (2) winter–spring season (12, 14, 16, 19, 22 April). Soil samples were collected separately for the soil layers 0–20 cm, 20–40 cm, 40–60 cm, 60–80 cm, and 80–100 cm from five random sites near the crop roots of each replicate raised bed with a soil drill (diameter 25 mm/1.1 m, wall thickness 2 mm). After the cucumber plants were harvested in the two seasons (end of the autumn–winter and winter–spring seasons, respectively), soil samples were collected following the same procedure described above.
A portion of the soil samples was sieved as fresh samples for the determination of soil NO3–N content, while another part was used to determine soil available phosphorus and available potassium following air-drying. The fresh samples were extracted in 0.01 M CaCl2 solution for 30 min as described by Houba [22]. Soil NO3–N content was then measured using a continuous flowing analyzer (TRAACS2000, Technikon, Montvale, NJ, USA). The air-dried soil samples were extracted with a dilute acid solution (0.05 M HCl with 0.0125 M H2SO4) as described previously [22]. Extractable phosphate was determined using molybdenum blue colorimetry, while extractable potassium was measured using flame photometry [23].

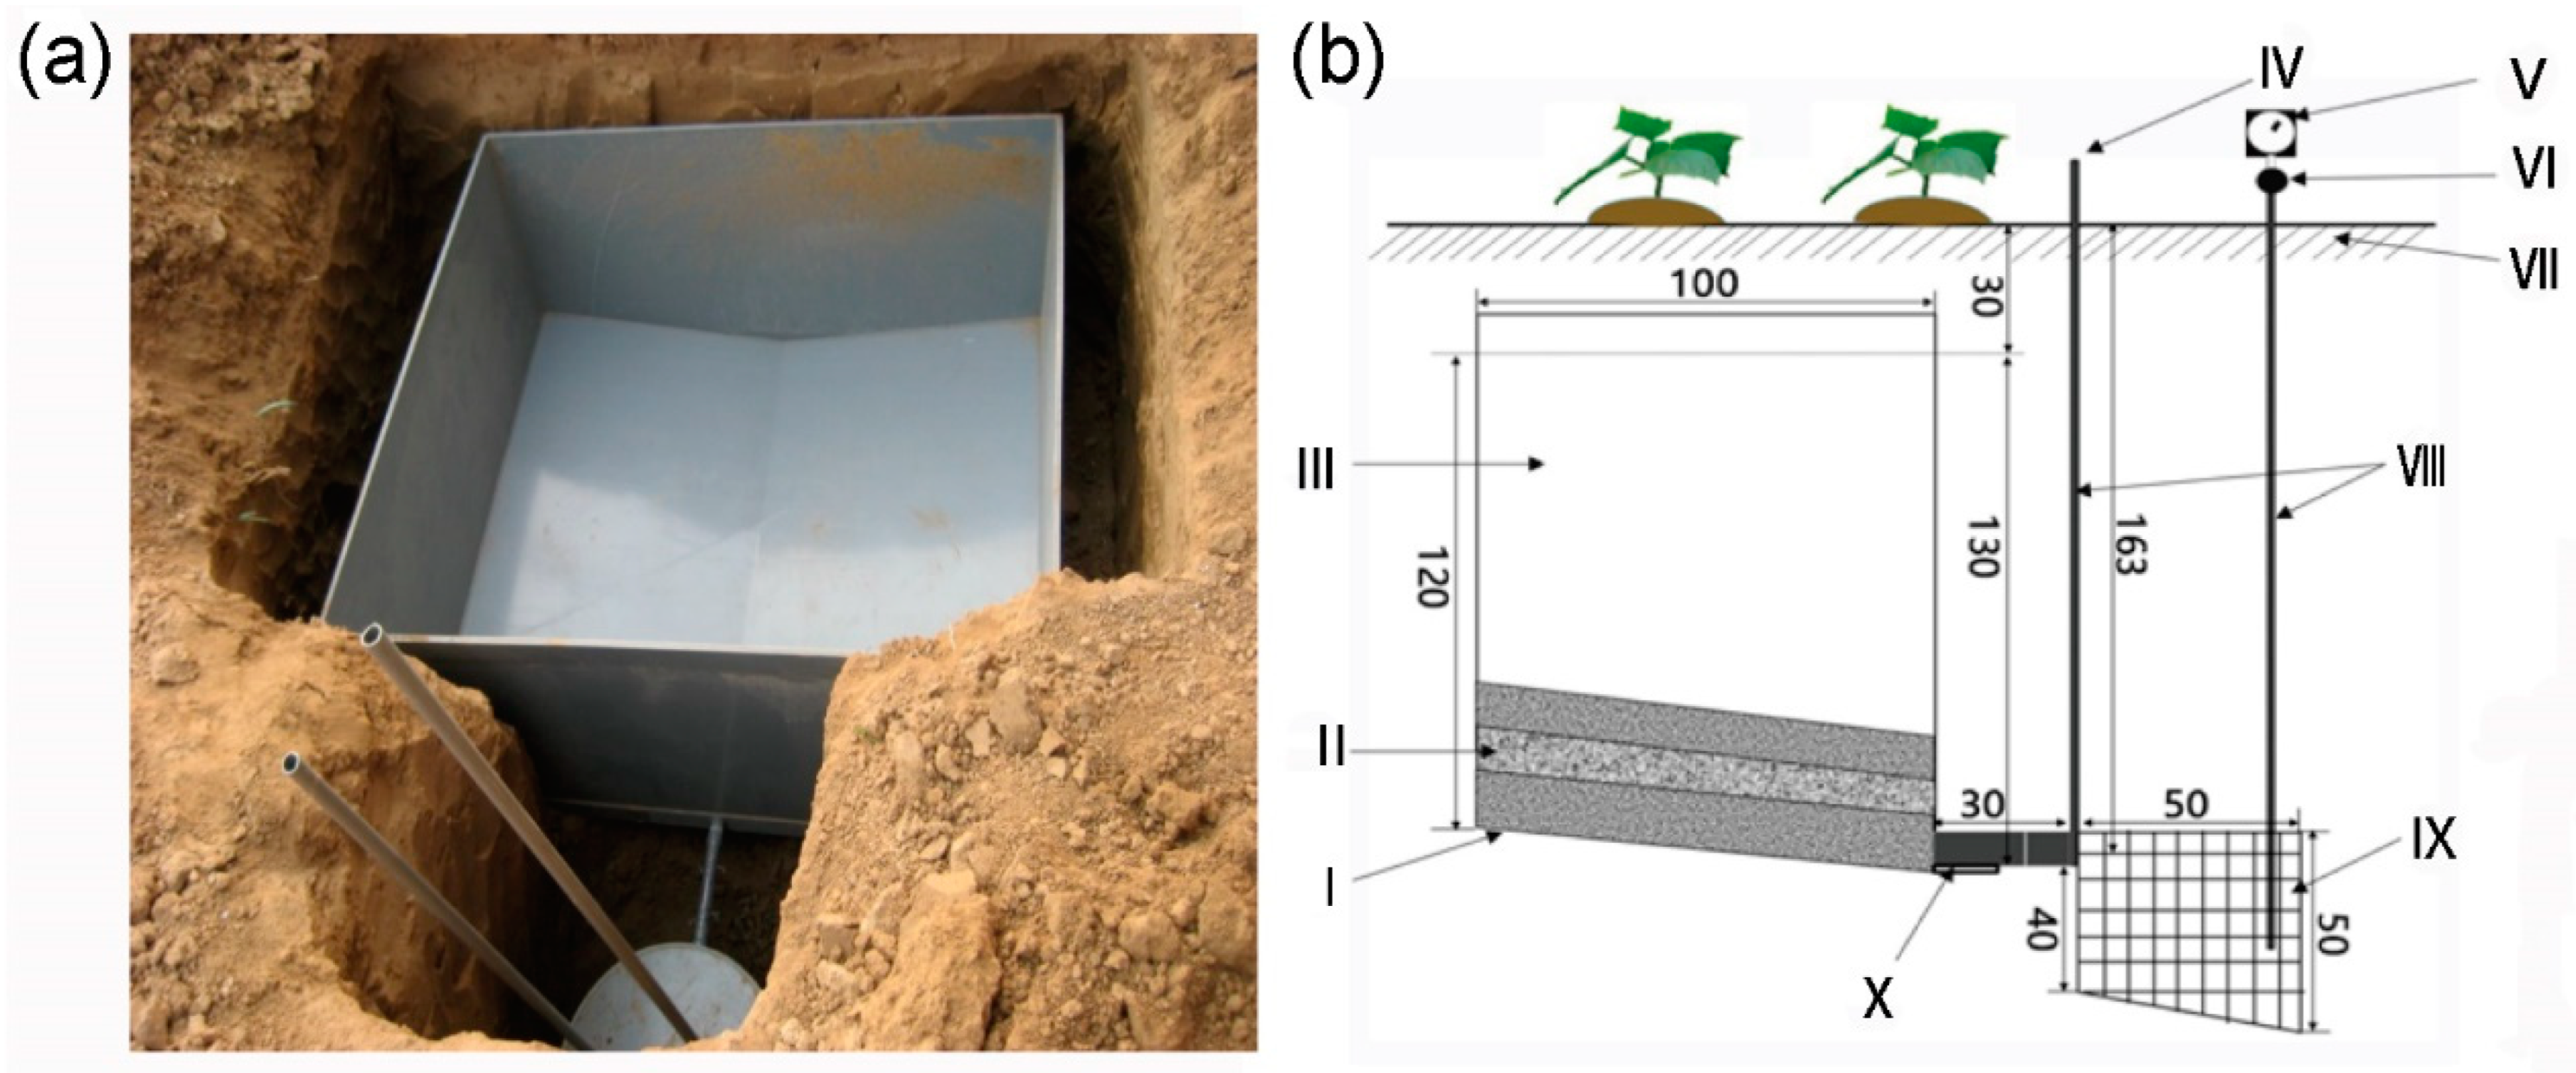
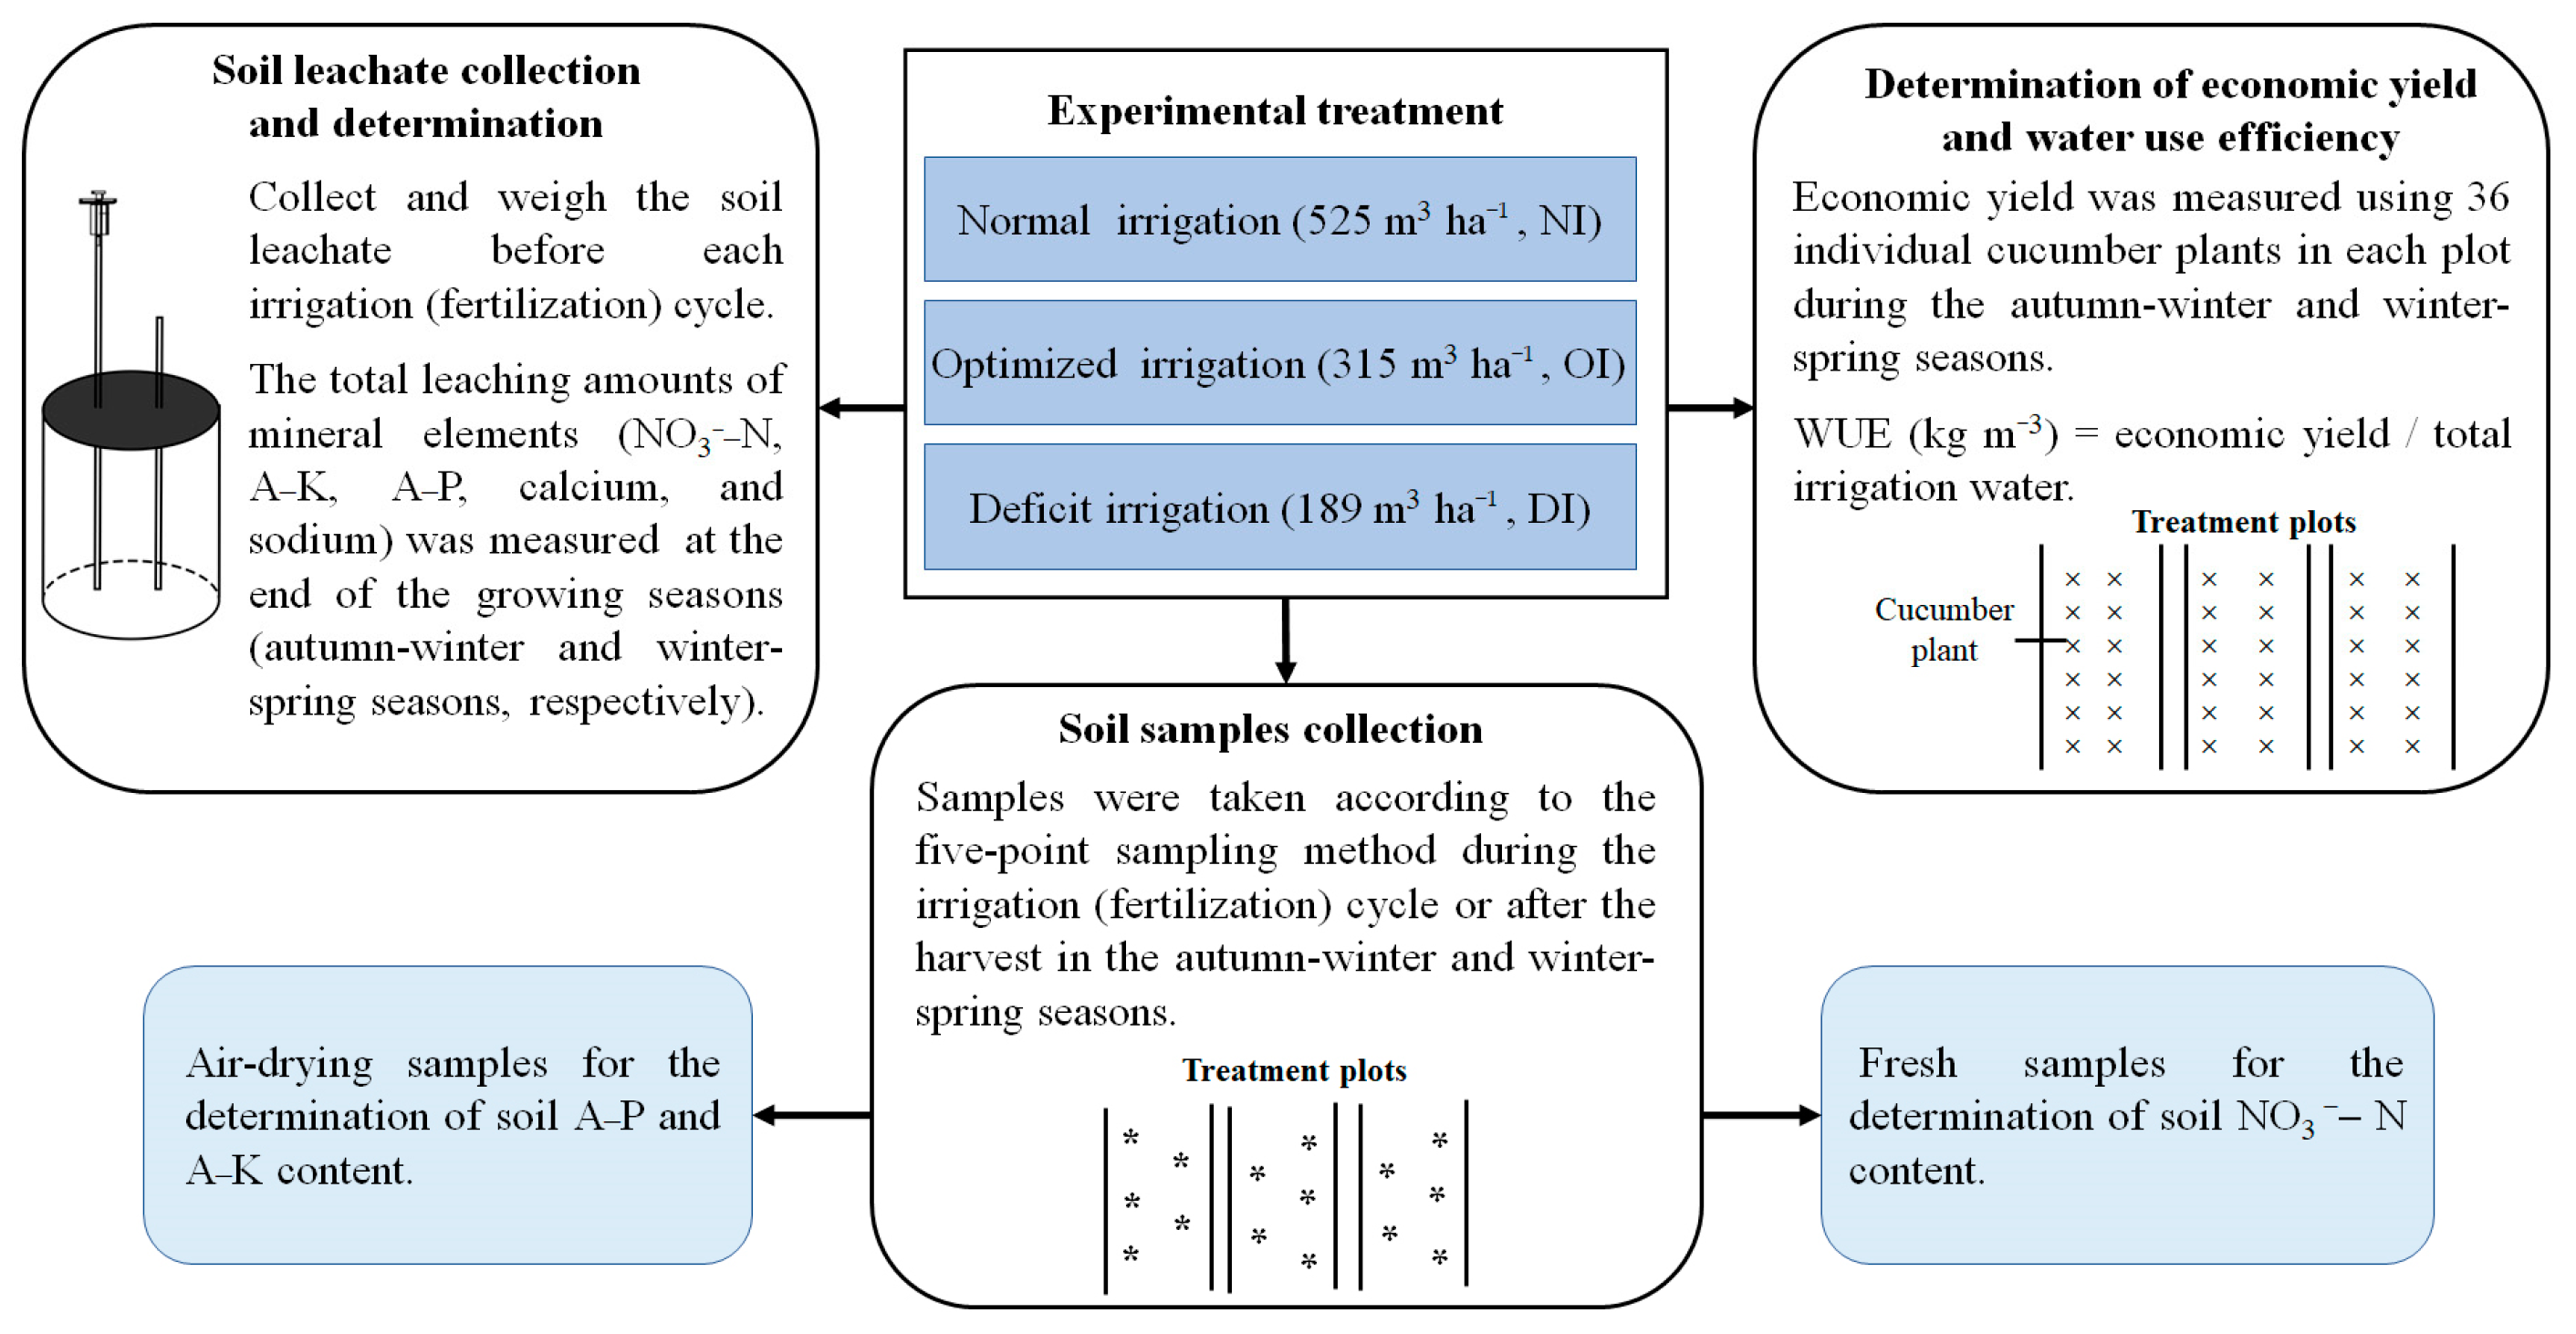
2.4. Analysis of Amount of Leached Mineral Elements

The soil leachate was collected using a lysimeter buried 1 m underground at the center of a raised bed in each plot (Figure 1). Soil leachate was removed from a lysimeter equipped with a pump (pump specifications, 25DB-25-0.37, 220 V/0.37 KW, Guanfengbengye, Shanghai, China) and weighed before each irrigation (fertilization) cycle. The samples were then maintained at 4 °C until further analyses. The amounts of leached mineral elements (nitrate nitrogen, available phosphorus, potassium, calcium, and sodium) was measured separately. The contents of nitrate nitrogen and available phosphorus in the leachates were determined using a flow analyzer (SEAL AA3 XY-2 Sampler, Bran+Luebbe, Norderstedt, German). Concentrations of potassium, calcium, and sodium in the leachates were measured with an atomic absorption spectrophotometer (Spectra AA 55, Varian, Palo Alto, CA, USA) [24].

2.5. Cucumber Economic Yield Measurements and Water Use Efficiency Analysis

Economic yield was measured using 36 individual cucumber plants in each plot. The cucumber fruit yield was determined as the total fresh weight of fruits harvested in each season. The WUE was calculated as follows:
WUE (kg m−3) = EY/TW
where EY is the economic yield (kg), and TW is the total irrigation water used during each growing season (m3).

2.6. Workflow Chart

According to the experimental design and methodological framework, we systematically synthesized a workflow chart to delineate the research process, as shown below (Figure 2). This diagram serves as a conceptual and operational guide for the subsequent investigative activities undertaken in this study.

2.7. Statistical Analysis

The graphics of the experimental data were generated in Microsoft Excel 2018 (Microsoft Corp., Redmond, WA, USA). Statistical analysis of variance (ANOVA) was performed using SPSS 14.0 (IBM). Means were separated using the least significant difference (LSD) test at p < 0.05.

3. Results

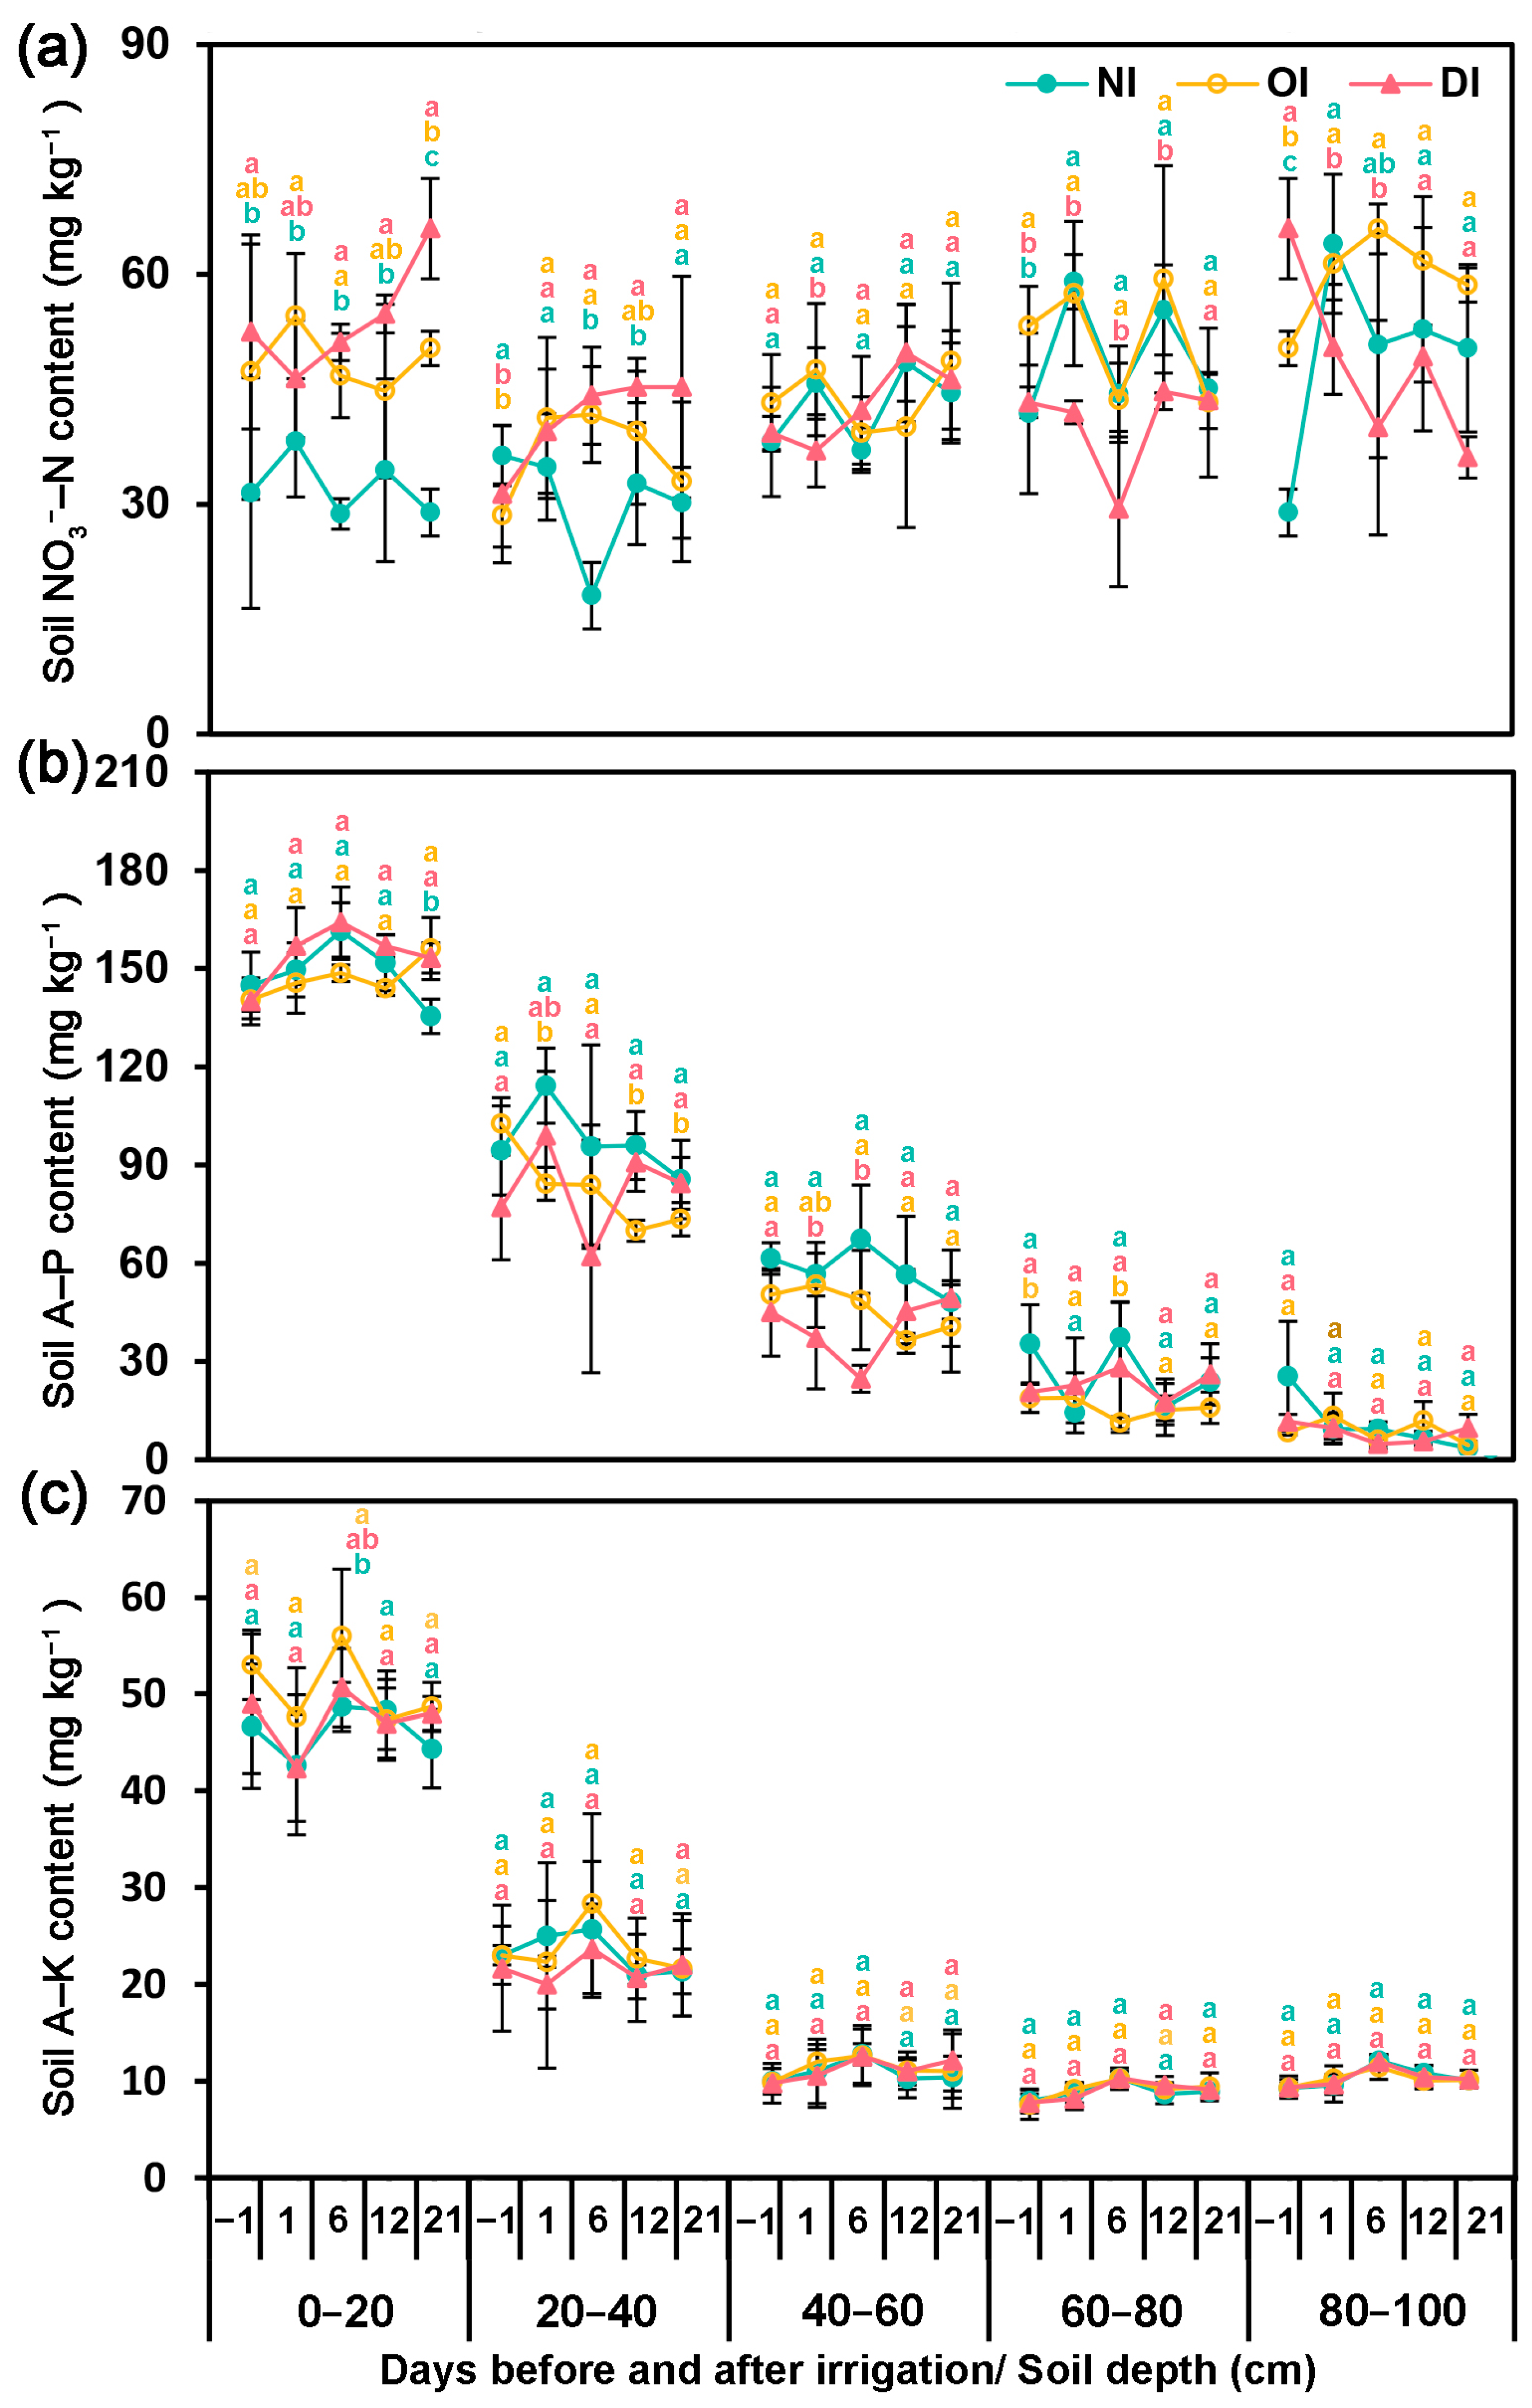
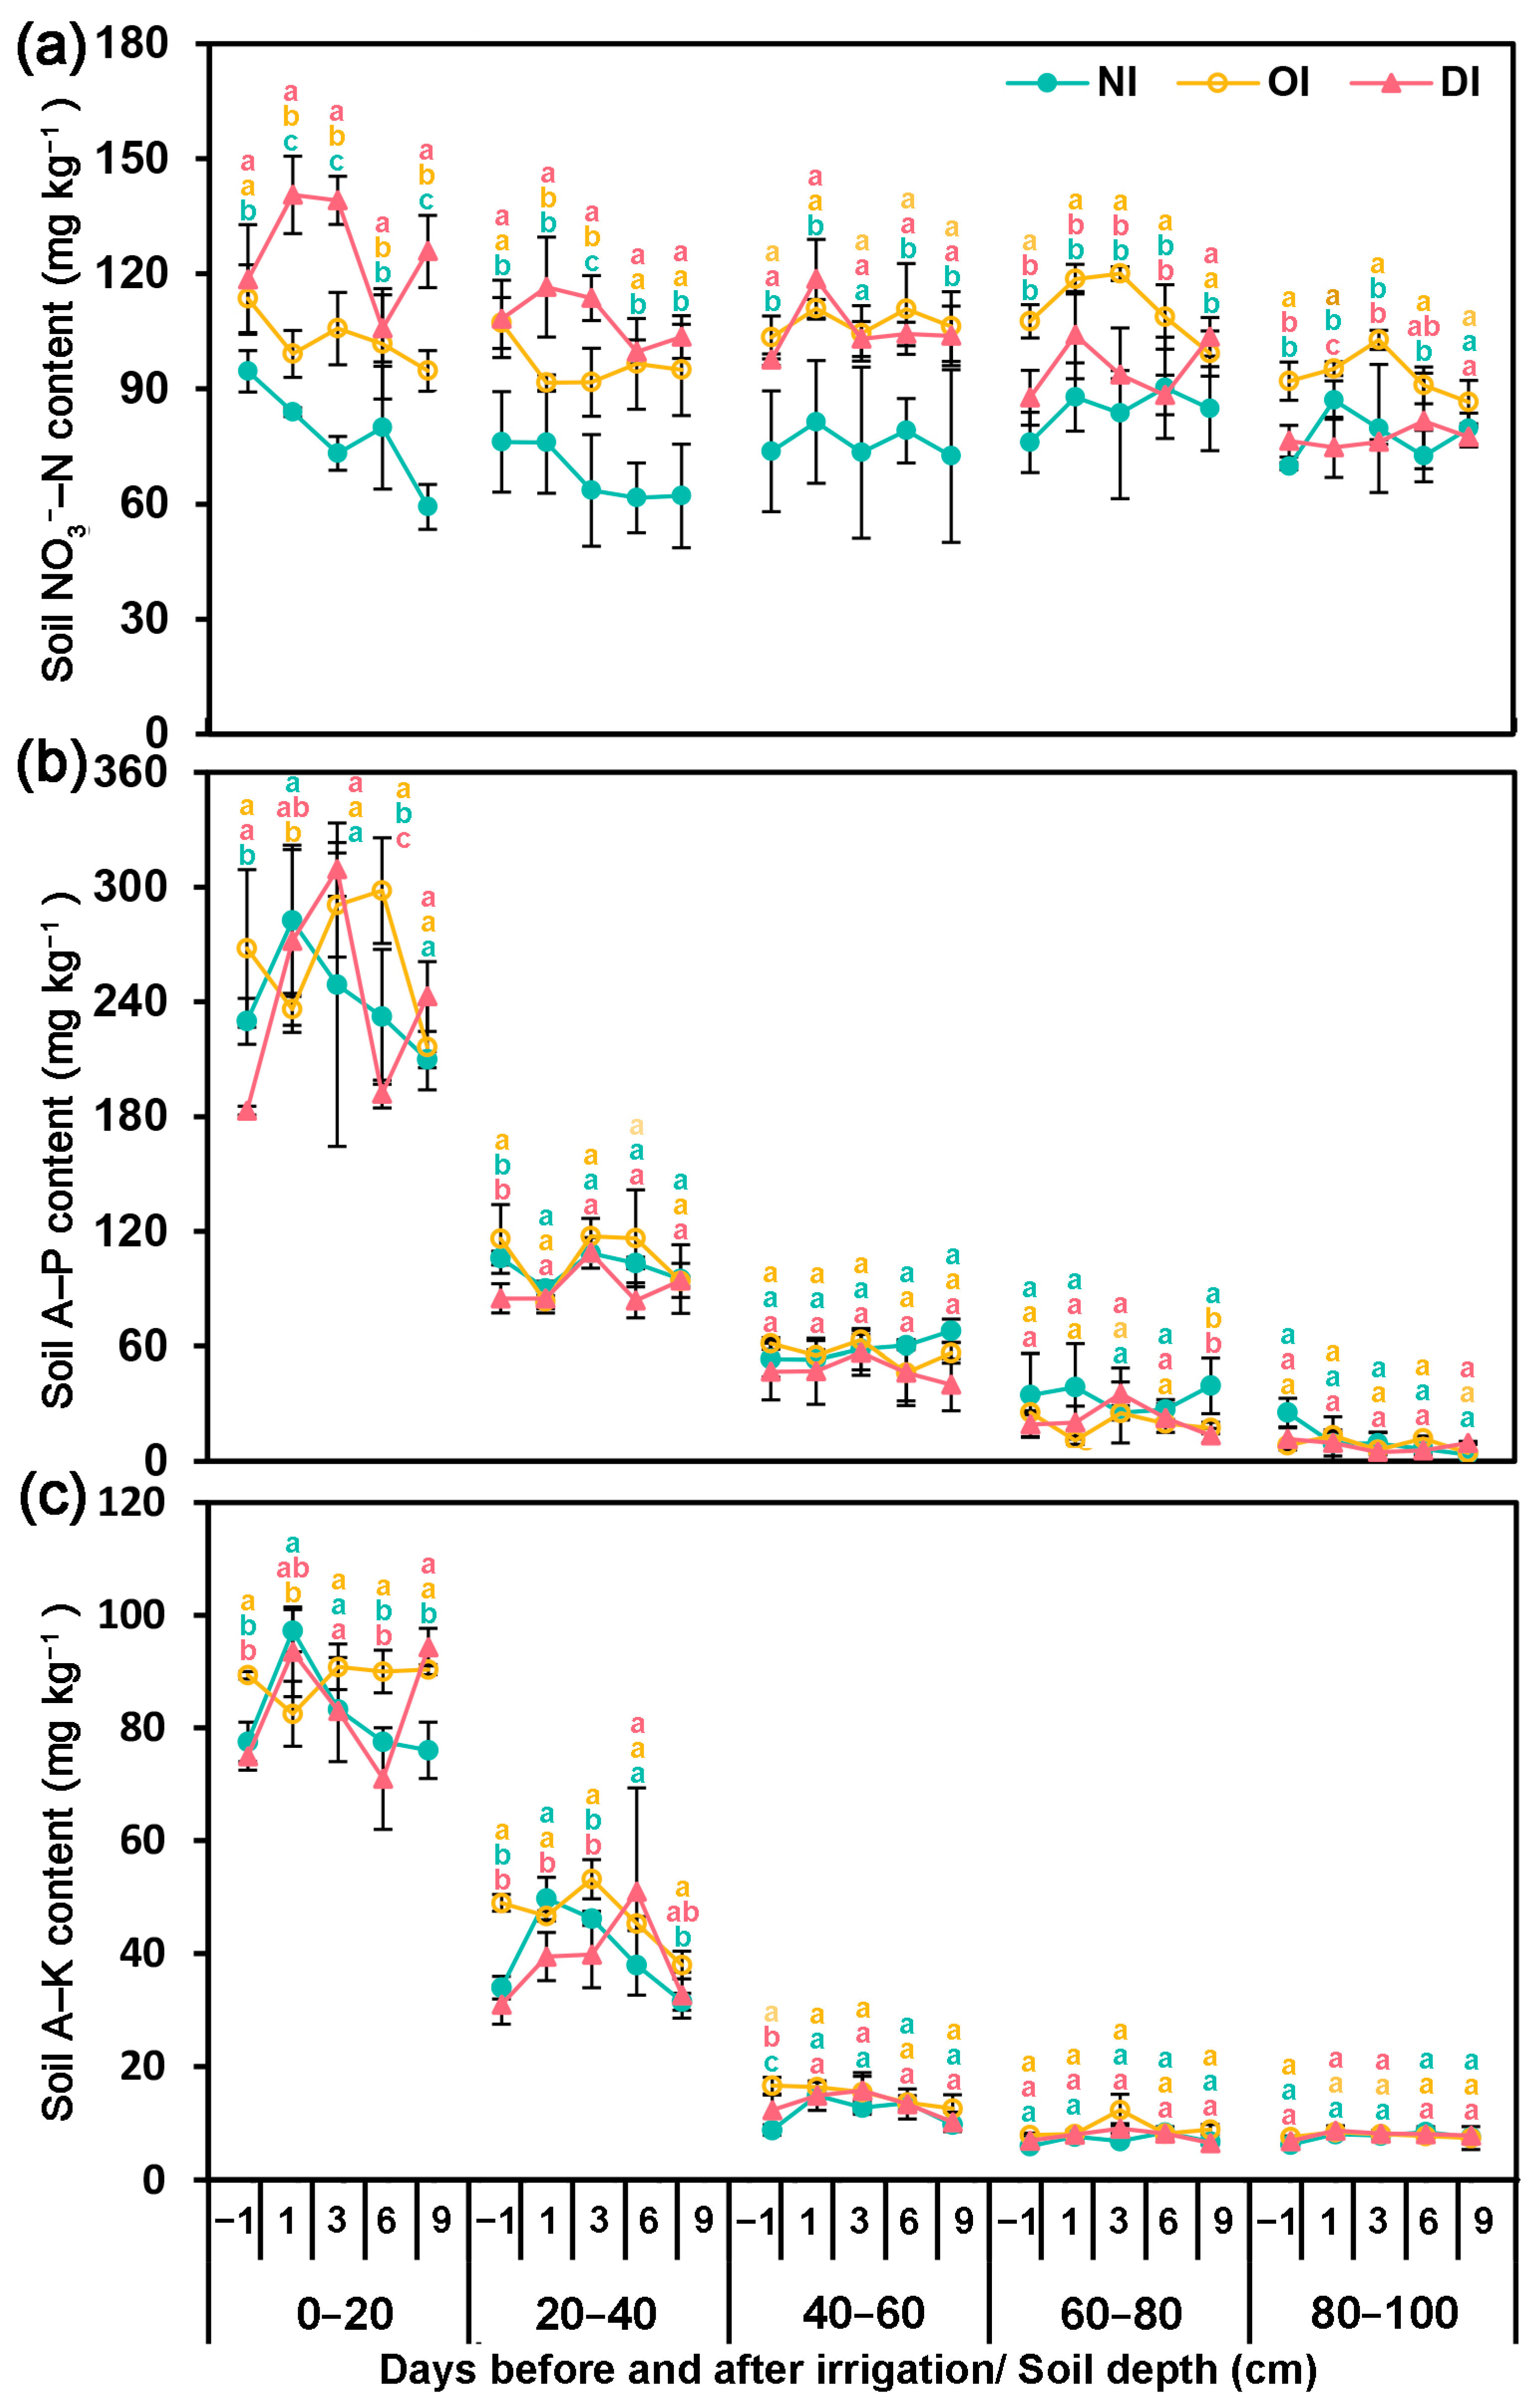
3.1. Distribution of Mineral Elements in Soil with an Irrigation (Fertilization) Cycle

The distributions of the mineral elements along the soil profile exhibited dynamic variations within an irrigation (fertilization) cycle in the autumn–winter season (Figure 3). Soil nitrate–nitrogen (NO3–N) content depended on the soil depth in different treatments (Figure 3a). Throughout the entire irrigation cycle, and under normal irrigation (NI), soil NO3–N was concentrated towards the deeper soil layers (60–80 cm and 80–100 cm soil), yet there were no obvious differences among each soil layer (Figure 3a). In contrast, under the optimized irrigation (OI) treatment, soil NO3–N was largely distributed in the middle layer of the soil (40–60 cm; 60–80 cm), while under deficit irrigation (DI), it was mostly observed in the top layer (0–20 cm) (Figure 3a).
In addition to nitrogen, phosphorus and potassium are essential mineral elements required for plant growth and metabolism activity. In this study, regardless of irrigation level, the soil available phosphorus (A–P) (Figure 3b) and available potassium (A–K) (Figure 3c) were mainly distributed in the top 0–20 cm soil layer, followed by the 20–40 cm soil layer, where concentrations dropped by almost half. The lowest levels occurred in the deeper soil layer (40–100 cm), and were close to zero. During the irrigation cycle, almost no obvious changes were observed in the contents of soil phosphorus (Figure 3b) and potassium (Figure 3c) among the three treatments under the same soil depth. This suggests that the irrigation level did not have a substantial effect on the distribution of the soil phosphorus and potassium.
We then determined the contents of NO3–N (Figure 4a), A–P (Figure 4b), and A–K (Figure 4c) in the different soil layers within an irrigation (fertilization) cycle in the following winter–spring season. The results were similar to those obtained in the autumn–winter season (Figure 3). In general, the distribution of NO3–N in the soil layer was relatively uniform, with a stronger water fluidity compared to phosphorus and potassium. This implies that reducing the irrigation amount can aid in reducing the leakage of nitrate–nitrogen to the lower layer. However, phosphorus and potassium are easily enriched at 0–40 cm due to their weak fluidity. Thus, reducing the amount of irrigation has almost no obvious impact on the distribution of these two elements.

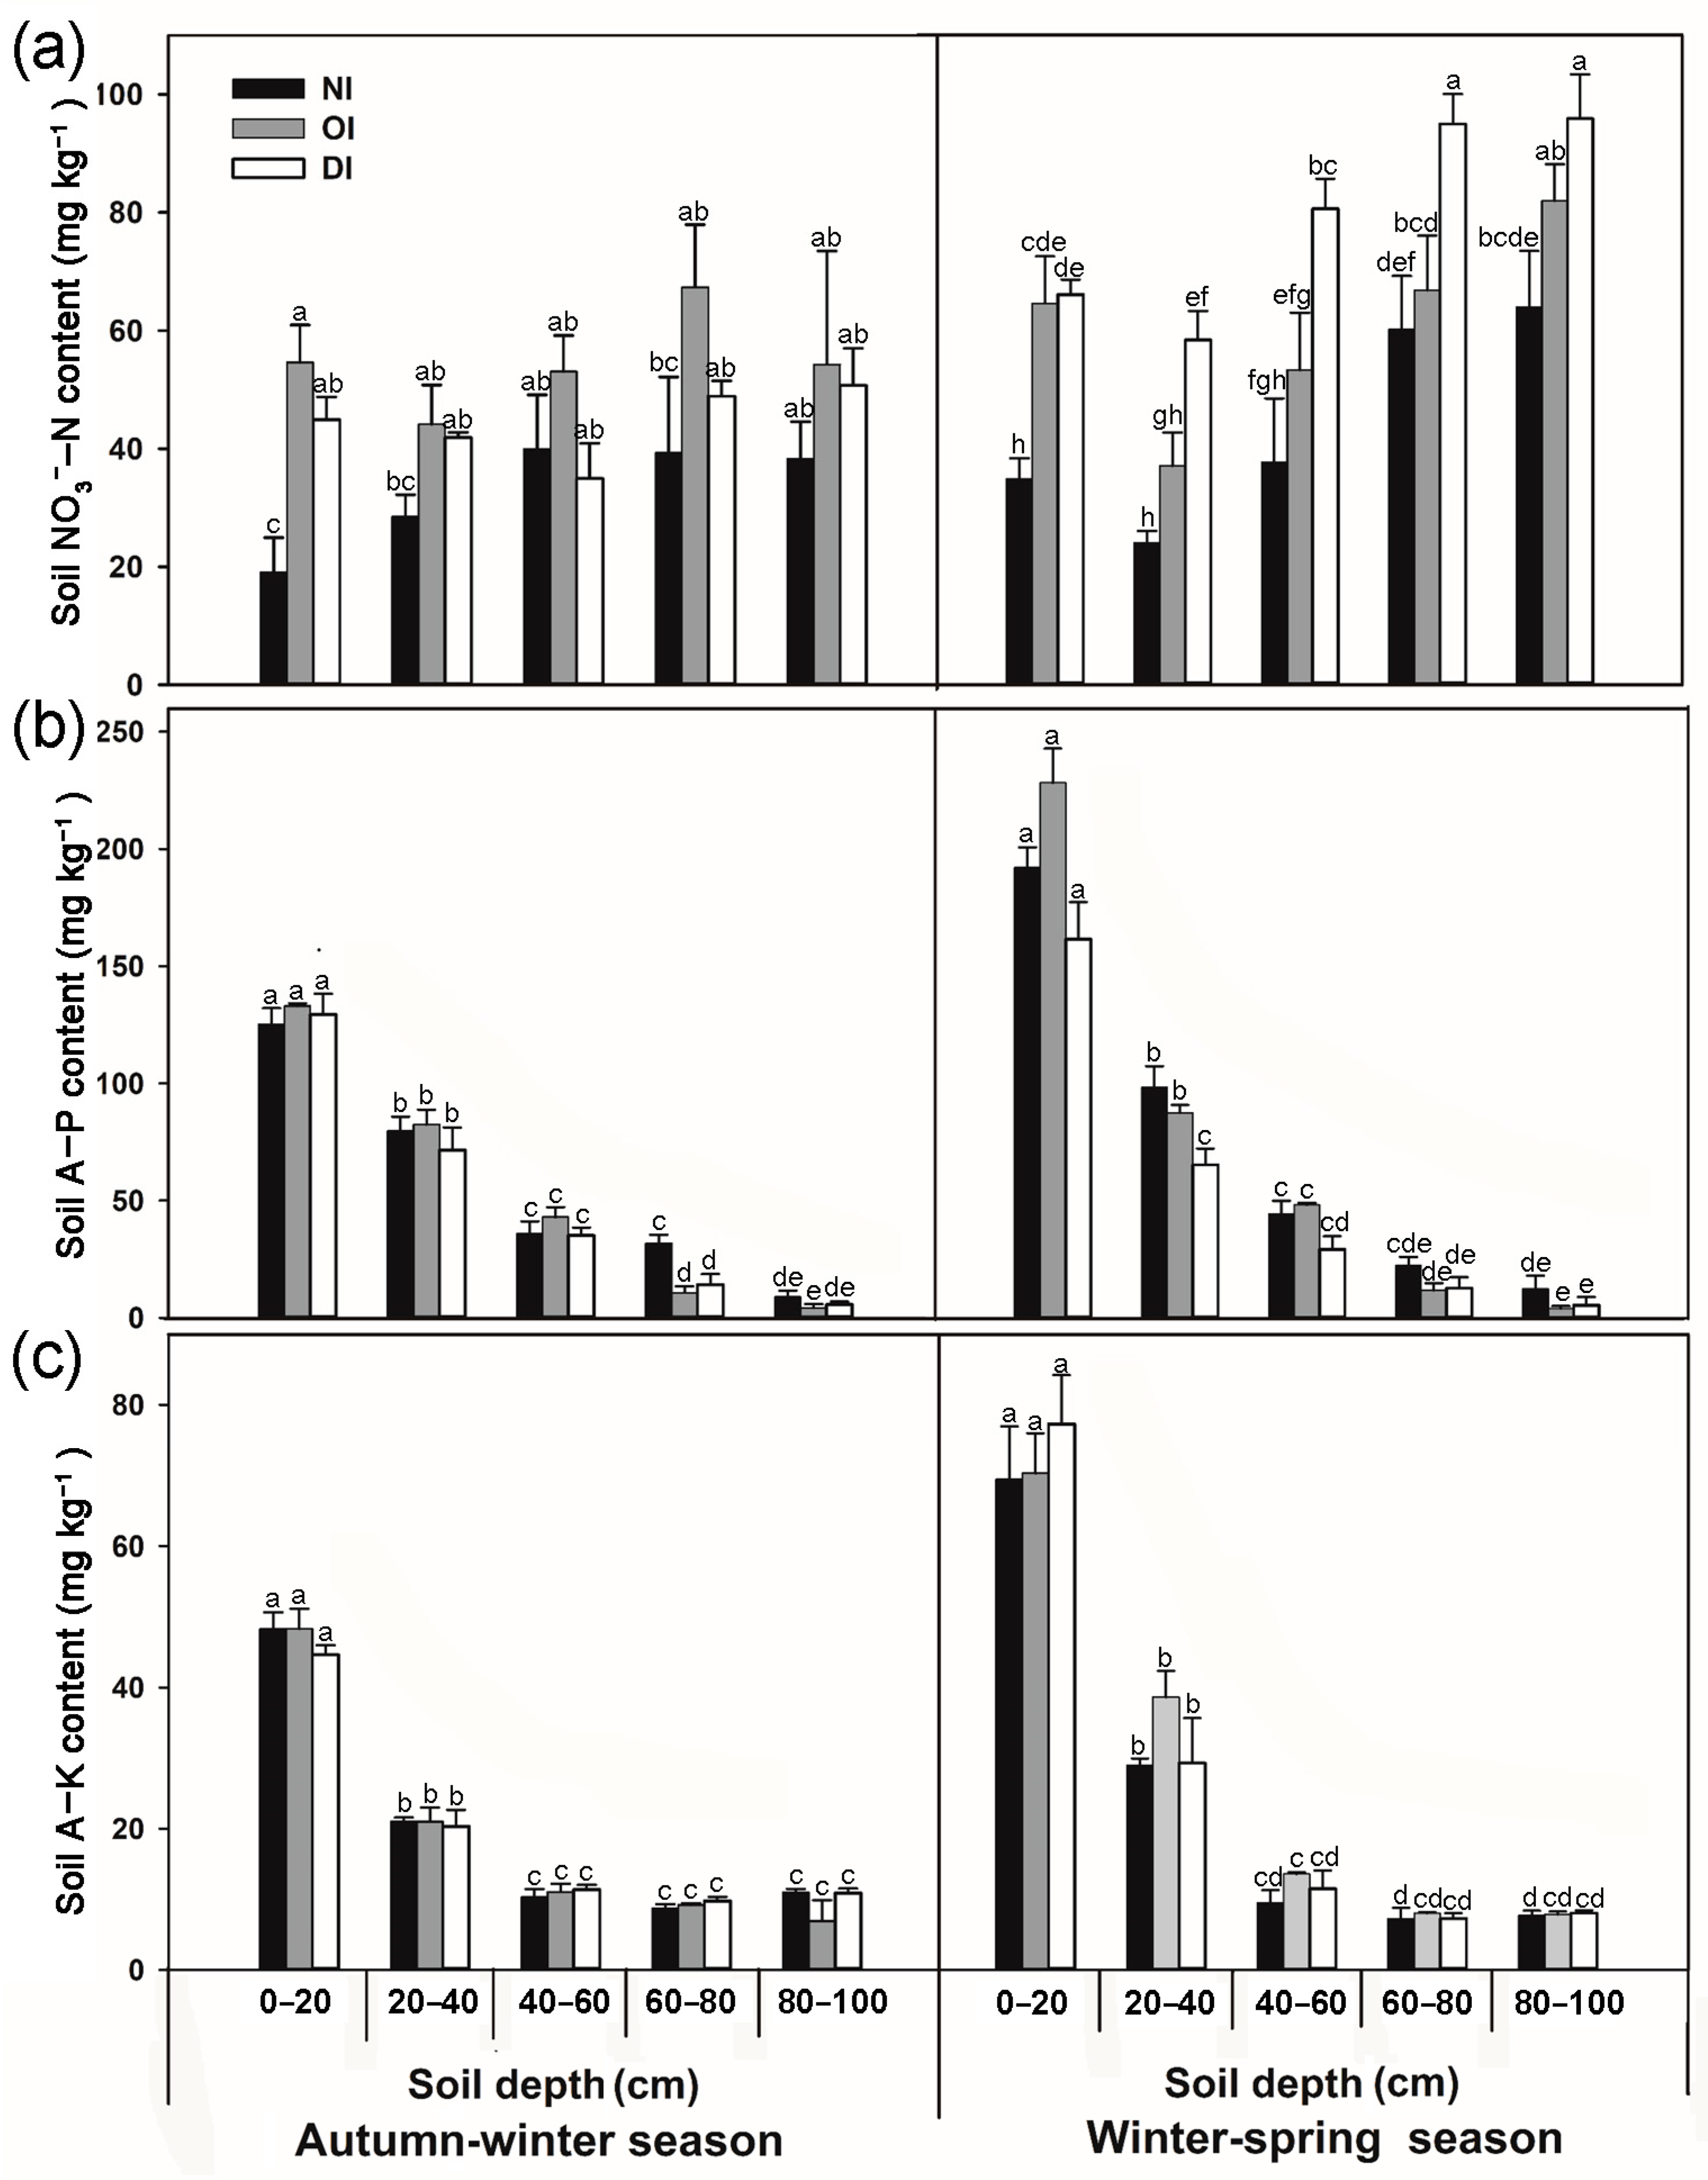
3.2. Residual Mineral Elements in the Soil at the End of the Growing Season

Nitrogen, phosphorus, and potassium are three essential elements for plant growth and development, and are mainly taken up from the soil by plant roots. This may consequently result in changes in the soil nutrient contents after a growing season [25,26]. Thus, we investigated the NO3–N, available phosphorus, and available potassium contents in different soil layers at the end of the autumn–winter and winter–spring seasons (Figure 5). The distribution trends of the three elements in each soil layer were similar to those in Figure 2 and Figure 3. More specifically, NO3–N was distributed relatively uniformly in the 0–100 cm soil layer (Figure 5a), while phosphorus (Figure 5b) and potassium (Figure 5c) were concentrated in the 0–40 cm soil layer for all irrigation levels. In terms of the irrigation level, following two consecutive growing seasons (end of the winter–spring season), the NO3–N content in each soil layer under the DI treatment was significantly larger than that of NI (Figure 5a). However, unlike NO3–N, no significant differences were observed in the phosphorus and potassium contents for each soil layer among the three treatments. This indicates that the irrigation amount has a relatively weak impact on phosphorus and potassium.

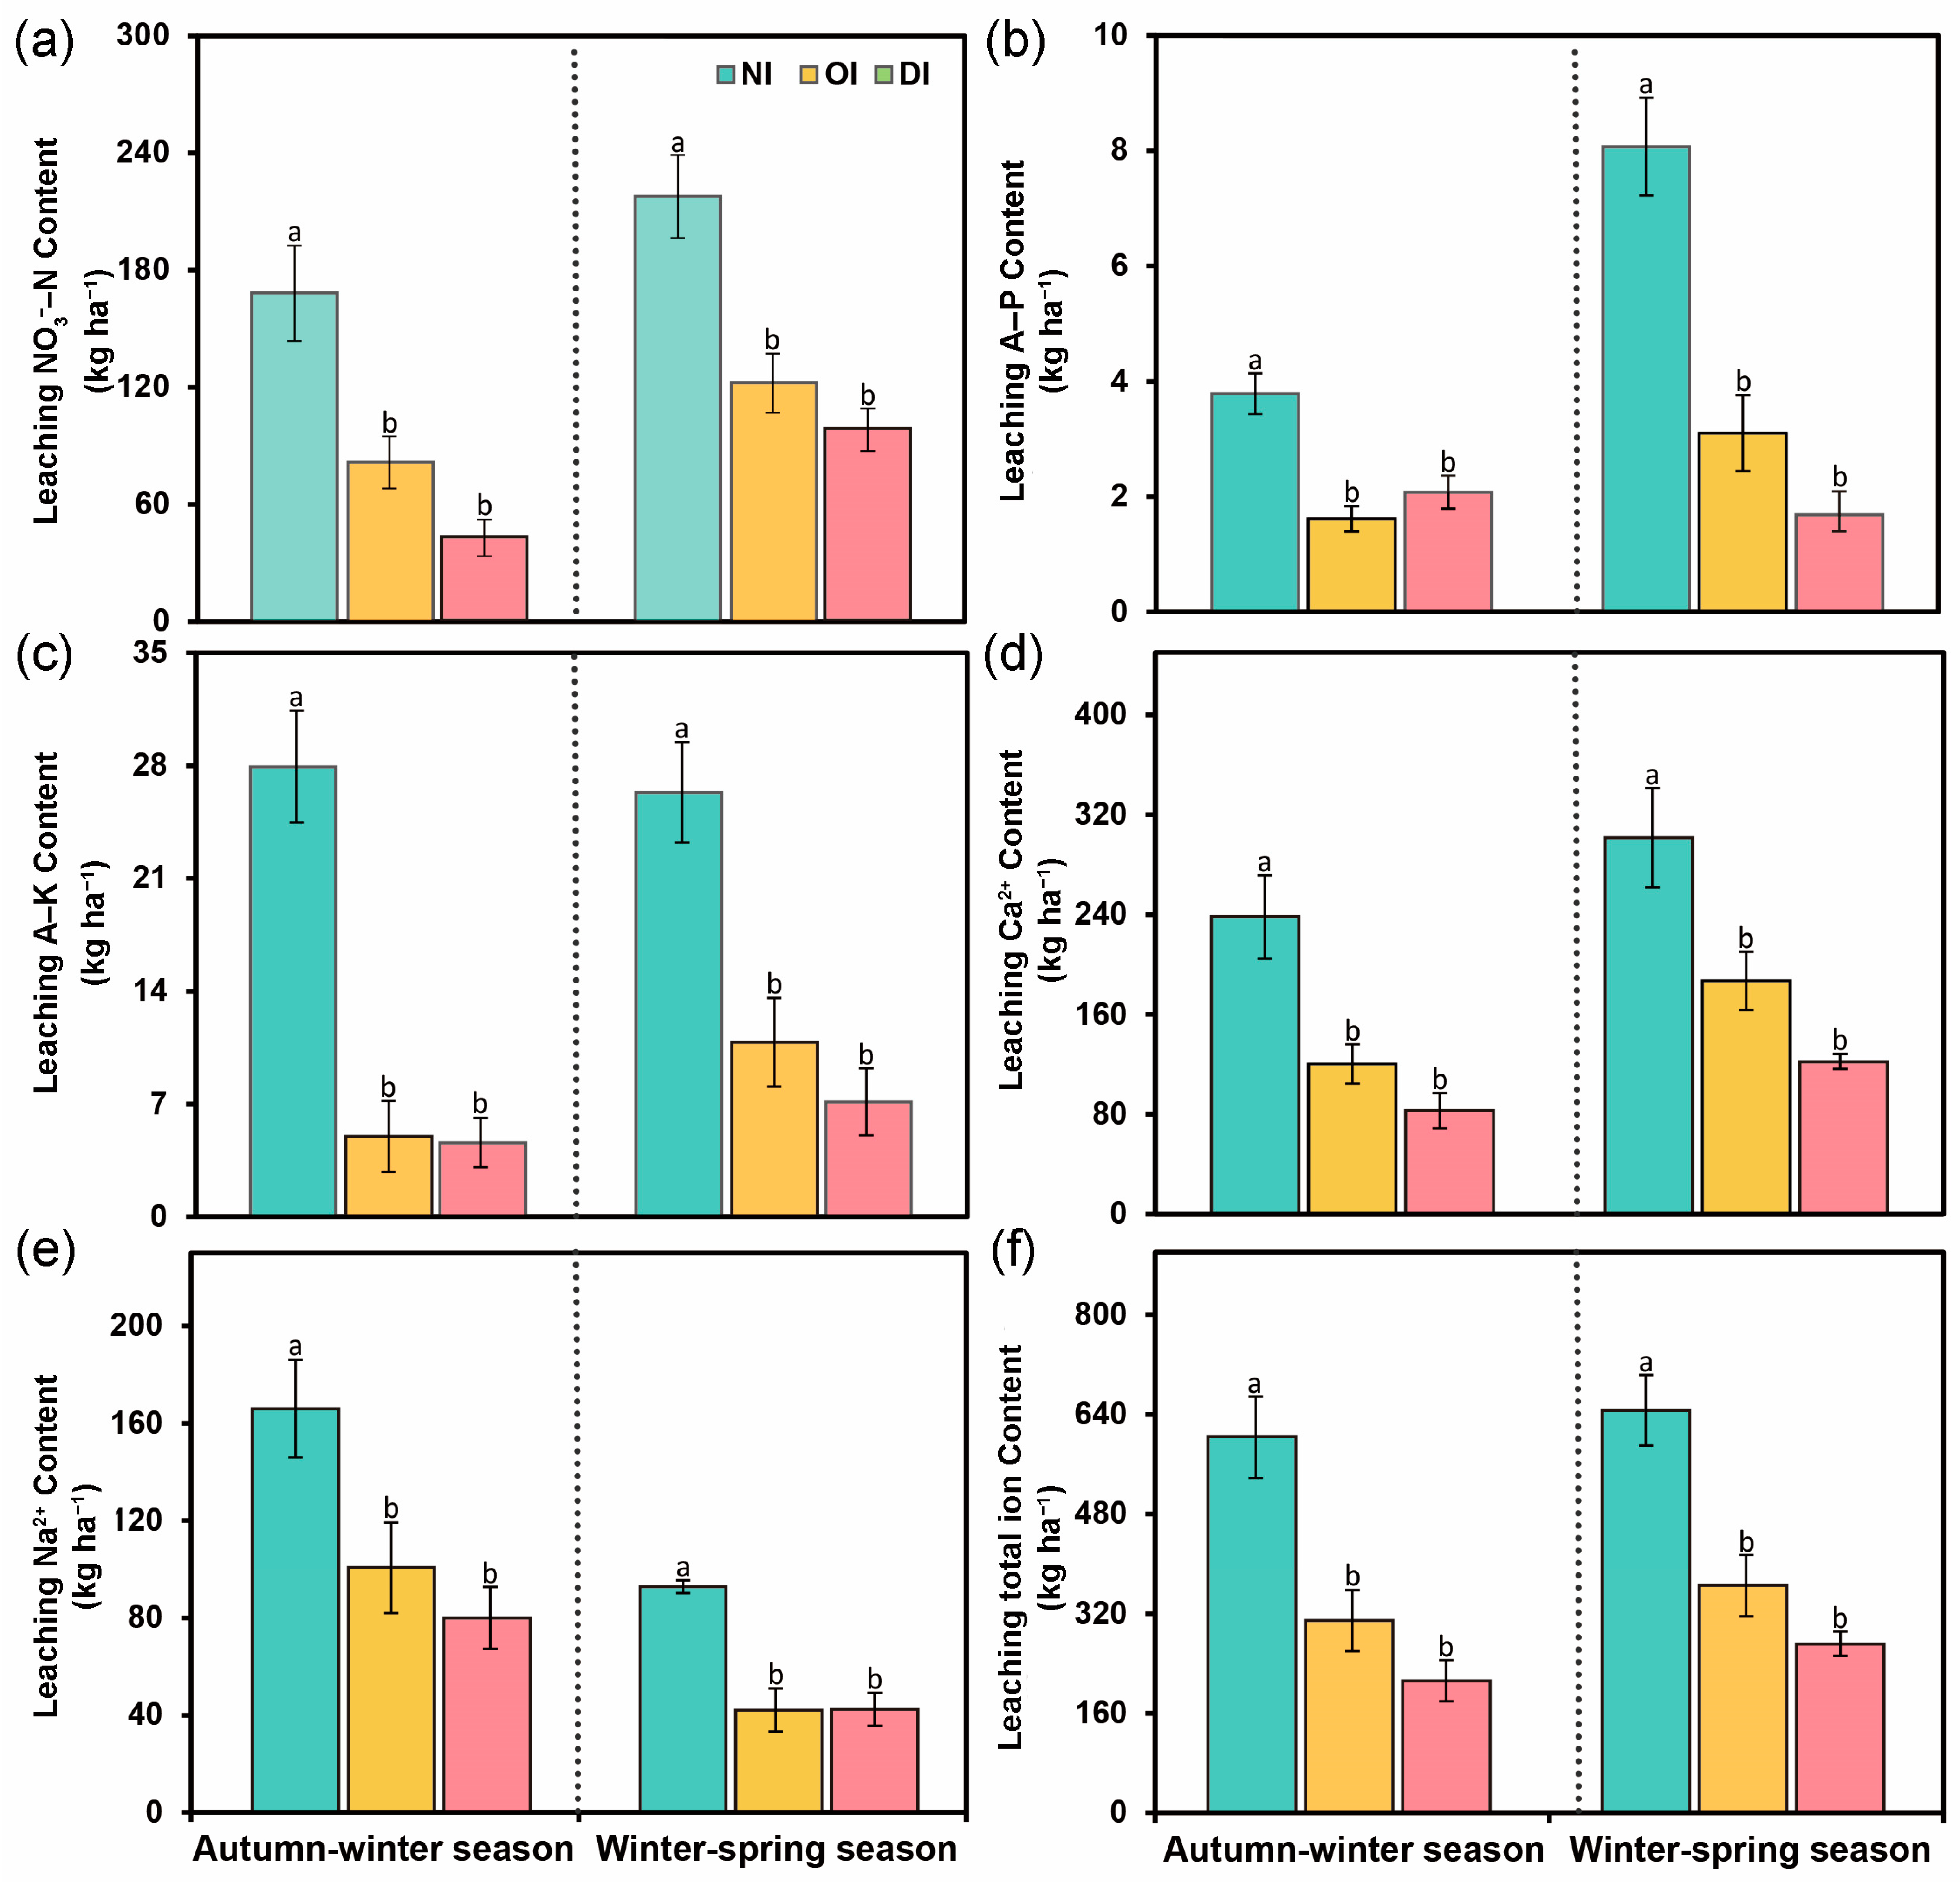
3.3. Leaching of Mineral Elements in the Soil at the End of the Growing Season

An additional process of the flow of soil elements is infiltration with water fluxes. Our results revealed that a reduction in the irrigation amount (OI and DI compared to NI) led to a significant drop in the amount of leaching of several soil mineral elements (NO3–N, P, K+, Ca2+, and Na+) in the whole cucumber growth period at the end of both growing seasons (Figure 6a–e). In particular, the total leached content of the five mineral elements in OI was close to half of that in NI, and in DI it was close one-third of that in NI (Figure 6f).
The total contents of NO3-–N, Ca2+, and Na+ in the soil leachate after two plant growing seasons reached 385.8, 539.6, and 258.9 kg ha−1 under normal irrigation (NI), respectively, while the amount of leached P and K+ was only 11.9 and 54.3 kg ha−1 throughout the year (Figure 6). With the decrease in irrigation water, the amount of leached NO3-–N in the whole growth cycle decreased significantly compared with the NI treatment, reaching just 203.7 kg ha−1 and 140.9 kg ha−1 in OI and DI (Figure 6a), respectively. During the autumn–winter, the amount of Ca2+ leaching under the NI treatment was 238.1 kg ha−1, while that in OI and DI was 120.3 and 82.9 kg ha−1, representing a decrease of 117.8 kg ha−1 and 155.2 kg ha−1 compared to NI, respectively (Figure 6d). The fertilizer input was higher in the winter–spring season than in the autumn–winter season (Table 1), and the amount of leached Ca2+ for the three treatments was 301.5 kg ha−1, 187.1 kg ha−1, and 122.4 kg ha−1, respectively. This indicates that reducing irrigation could significantly reduce the leaching of Ca2+ by 114.4 and 179.1 kg ha−1 in the winter–spring season (Figure 6d). Similarly, the amount of leached Na+ in the autumn–winter season decreased by 39.3% and 51.8% under OI and DI, and that in the winter–spring season decreased by 54.6% and 54.4%, respectively, compared to the NI treatment (Figure 6e). The same trend was observed for the P and K+ losses (Figure 6b,c), with the amount of leached K+ and P having fallen by more than half in OI and by three-quarters in DI, compared to their respective NI treatment in the autumn–winter season (Figure 6c).

3.4. Cucumber Economic Yield and Water Use Efficiency

Under the three irrigation treatments, the economic yield of cucumber ranged from 64,513 to 72,604 kg ha−1 in the autumn–winter season and from 89,699 to 106,367 kg ha−1 in the winter–spring season (Table 2). However, no significant differences were observed in the economic yield between the three irrigation treatments, irrespective of season. This suggests that a reduced water supply may not have an obvious effect on crop yield under the current irrigation and fertilization practices used for the production of protected crops. In contrast, the WUE of cucumber plants under the three irrigation treatments exhibited a clear increasing trend with a decrease in irrigation water amount (Table 2). More specifically, the WUE of the OI and DI treatments increased by 43.9% and 135.3%, respectively, in the autumn–winter season, and by 82.2% and 173.7%, respectively, in the winter–spring season, compared to NI (Table 2).

4. Discussion

Our results provide compelling evidence that reducing irrigation can substaintially mitigate the loss of essential elements (Figure 5 and Figure 6). This approach not only helps conserve natural resources but also enhances water use efficiency, all while maintaining crop yield. As such, our study offers a promising strategy for sustainable water-saving cultivation practices.
Among the elements evaluated in this study, within an irrigation (fertilization) cycle, nitrogen exhibited a strong presence and was evenly distributed in all layers (Figure 3a and Figure 4a). Malhi et al. also demonstrated that NO3–N is an unstable form of N that moves dynamically at high rates into the deeper soil profile, particularly when water is abundant [27]. From our results, reducing the amount of irrigation generally maintained nitrogen in the upper soil layer, particularly in the DI treatment, where it was largely present in the 0–40 cm soil layer. This trend suggested that reducing irrigation (both OI and DI) could effectively decrease the leaching of NO3–N to deeper soil compared with NI. Moreover, the DI treatment was determined to be conductive to significantly reducing the loss of NO3–N in the 0–40 cm surface soil, which is the main tillage layer for cucumber root growth. Phosphorus and potassium were observed in the topsoil (from 0 to 40 cm), with lower levels in deeper soils. This agrees with the work of Mendes et al., who demonstrated phosphate and potassium to be concentrated in the surface soil, particularly at the 0–40 cm depth. These two mineral elements are typically strongly maintained by soil surfaces [13].
A similar trend was observed after two seasons of cultivation (Figure 5), whereby the soil layer exhibited an obvious accumulation of nitrogen, phosphorus, and potassium with the continuous application of fertilizer and irrigation in the whole/annual growth cycle. This is consistent with previous studies [1,28]. Furthermore, a reduction in the irrigation amount results in a greater retention of nitrogen in the soil at the end of the growing season (Figure 5a). This suggests that the soil maintenance of NO3–N increased under deficit water conditions, which is similar to previous results [29]. However, unlike NO3–N, there were no significant differences in phosphorus and potassium contents for each soil layer among the three treatments, indicating the limited response of phosphorus and potassium to the irrigation amount.
Nitrate leaching and gaseous nitrogen (N) emissions have been reported as the main pathways of nitrogen loss in greenhouse vegetable production [19]. Data from 75 studies revealed that the mean annual nitrogen leaching from fertilized greenhouse vegetable systems can reach 275–319 kg N ha−1, often occurring under extreme fertilization and irrigation management schemes [30]. In a study on furrow treatments, Sun et al. determined the amount of leached nitrate to be between 587 and 817 kg N ha−1 (accounting for 43% to 67% of total N input) for greenhouse tomato in northern China [19]. The authors also demonstrated gaseous N loss to range from 32 to 99 kg N·ha−1, accounting for about 3% to 14% of total N input. It was also reported that the amount of nitrate leaching could account for 71–86% of N input in a greenhouse vegetable system that rotates between tomato, cucumber, and celery in southeast China [31].
As already mentioned, leaching is the primary N loss pathway under a high N application rate, and the amount of N leached is proportional to the N applied during crop production. On the other hand, previous studies have demonstrated that N loss is highly correlated with irrigation [11,19,30]. The irrigation method, fertilizer input amount, and crop residues can all have significant impacts on nitrate leaching and nitrogen use efficiency (NUE) [11]. Thus, drip irrigation (water-saving irrigation), an optimal N fertilizer application, and straw incorporation (addition of crop residues) can be effective (agronomic) measures for reducing N leaching and improving NUE compared with conventional farming practices [11,19,30,32]. Our results showed that with the reduction in irrigation water volume under OI and DI, the amount of leached NO3–N decreased significantly compared to the NI treatment (Figure 6a). In Bruno et al.’s work, different crop rotation schemes did not have a significant effect on NO3 leaching, but in the presence of nitrogen fertilization, leaching was extremely low when rainfall was obviously reduced, and vice versa [33]. Raave et al. suggested that incorporating activated carbon into light-textured soils can help prevent the leaching of NO3–N and increase soil water retention ability [34]. It is also an effective method for reducing NO3 leaching from soil. In particular, the addition of soluble Ca (such as CaNO3+) in both aqueous and soil systems can enable NO3 retention by biochar material via the adsorption of the soluble Ca to the negatively charged biochar surfaces [35]. Calcareous fluvo-aquic soil or high soil sand content (exceeding 53%) exhibited a significant decline in nitrogen (N) retention capacity [36,37]. However, cover crops effectively mitigated N leaching, primarily through its role in re-coupling soil carbon (C) and nitrogen cycles. This re-coupling mechanism, driven by rhizodeposition and enhanced microbial activity associated with legume root systems, promoted the simultaneous mineralization of carbon and nitrogen, thereby reducing nitrate mobility and improving N retention in sandy soils [36,37]. Similarly, the application of organic fertilizer in the soil will also reduce the nitrogen loss, which is more significant when the amount of irrigation is reduced [38,39].
The leaching of phosphorus (P) is also a key process worthy of attention. Based on long-term observations from the Rothamsted Broadbalk Experiment in the UK, Heckrath et al. showed that when the soil available P content accumulates and exceeds a threshold value of 60 mg kg−1, the P in the leaching from the soil to the groundwater will increase dramatically [40]. Previous research evaluated the current status of P in China’s intensive vegetable production systems by analyzing extensive published results [41]. The authors demonstrated that an excess P input led to the soil enrichment of available P (measured as Olsen–P) in the surface layer (0–20 cm depth), with averages of 179 (greenhouses) and 100 mg kg−1 (open fields), respectively. Some of these cases were identified to lead to P-leaching risk [41]. The threshold of soil available P (60 mg kg−1, usually considered the change point in P–leaching evaluations) has been observed to be in excess in 91.8% of protected/greenhouse vegetable fields and 70.5% of open vegetable fields [40,41]. In the present study, after the autumn–winter and winter–spring seasons, the accumulation of available phosphorus in the 0–20 cm soil layer was as high as 161.77–228.53 mg kg−1 under different irrigation conditions (Figure 5b). This suggests a risk of phosphorus leaching loss, as shown by the amount of leached soil available phosphorus in the whole/annual growth period of cucumber (Figure 6b). A reduction in the irrigation water of the OI and DI treatments was able to dramatically help lower the leakage of available phosphorus (Figure 6b).
In this study, reduced irrigation did not significantly affect cucumber yield in either of the growing seasons. Similar irrigation treatments were conducted on tomato, melon, pepper, and other crops in order to investigate the relationship between the yield and deficit irrigation [42,43,44,45]. The results show that a moderate water shortage does not tend to reduce crop yield and quality. Moreover, numerous studies have demonstrated that excessive irrigation will result in lower water use efficiency [46,47]. By combining the aforementioned two points, the present study indicates that deficit (DI at 189 m3 ha−1) or optimized irrigation (OI at 315 m3 ha−1) can significantly improve the water use efficiency of cucumber without jeopardizing the economic yield.
To substantiate the conclusions drawn above, Table 3 provides a comprehensive summary of the impacts of various irrigation regimes on the dynamics of nitrogen (N), phosphorus (P), and potassium (K) within the cultivation environment, as derived from pertinent studies. The analysis of the data presented in the table offers a clearer perspective on the efficacy of deficit irrigation in enhancing the WUE and promoting rational fertilizer management. This approach not only underscores the potential of deficit irrigation as a sustainable agricultural practice but also highlights its role in mitigating nutrient losses and optimizing resource utilization in crop production systems.

5. Conclusions

This study investigated the effects of varying irrigation levels, i.e., normal (525 m3 ha−1 every time; NI for short), optimized (315 m3 ha−1 every time; OI), and deficit irrigation (189 m3 ha−1 every time; DI), on greenhouse cucumber cultivation. Through comprehensive analysis of soil nutrient dynamics (NO3–N, available P and K), soil mineral element retention, and elemental leaching patterns during irrigation/growth cycles, as well as statistical yields and water use efficiency (WUE), we systematically examined the impact of irrigation practices on the agroecological environment of greenhouse cucumber production. Our study reveals the distribution of nitratenitrogen (NO3–N) in the sandy loam soil layer to be relatively uniform, while the DI or OI treatment facilitates a reduction in the leaching of nitrogen to the deeper soil to some extent. Phosphorus and potassium cannot easily move with the irrigation water, and are thus mainly distributed in the 0–40 cm surface soil. Deficit or optimized irrigation can significantly reduce the amount of leached mineral elements (nitrogen, phosphorus, potassium, calcium, and sodium) in the sandy loam soil and improve the WUE (for OI at 315 m3 ha−1 and DI at 189 m3 ha−1) without jeopardizing cucumber production in a solar (or unheated) greenhouse. Therefore, deficit or optimized irrigation is a potential and suitable irrigation strategy for the cucumber crop cultivated in solar greenhouses.

Author Contributions

X.S., L.G. and D.L. conceived the project and designed the experiments; D.L., S.W. and Y.G. performed the experiments and analyzed the data; J.N. provided technical assistance to Y.G., S.W. and D.L.; Y.G., S.W. and D.L. wrote the article; X.S. and L.G. revised the article. X.S. and L.G. agree to serve as the authors responsible for contact and ensure communication. All authors have read and agreed to the published version of the manuscript.

Funding

This research was funded by the National Key Research and Development Program of China (2016YFD0201003), the China Agriculture Research System of the Ministry of Finance (MOF) and Ministry of Agriculture and Rural Affairs (MARA) (CARS-23), and the 2115 Talent Development Program of China Agricultural University.

Data Availability Statement

The raw data supporting the conclusions of this article will be made available by the authors on request.

Acknowledgments

The authors are grateful to all the staff of the Shunyi Experiment Station in Beijing, China.

Conflicts of Interest

The data in the manuscript are original and the manuscript has not been submitted elsewhere for publication, either completely or in part, or in another form or language. The authors have no conflicts of interest to declare.

References

  1. Lv, H.F.; Lin, S.; Wang, Y.F.; Lian, X.J.; Zhao, Y.M.; Li, Y.J.; Du, J.Y.; Wang, Z.X.; Wang, J.G.; Butterbach-Bahl, K. Drip fertigation significantly reduces nitrogen leaching in solar greenhouse vegetable production system. Environ. Pollut. 2019, 245, 694–701. [Google Scholar] [CrossRef] [PubMed]
  2. Gao, L.H.; Qu, M.; Ren, H.Z.; Sui, X.L.; Chen, Q.Y.; Zhang, Z.X. Structure, function, application, and ecological benefit of a single-slope, energy-efficient solar greenhouse in China. Hort. Technol. 2010, 20, 626–631. [Google Scholar] [CrossRef]
  3. Liang, X.; Gao, Y.; Zhang, X.; Tian, Y.; Zhang, Z.; Gao, L. Effect of optimal daily fertigation on migration of water and salt in soil, root growth and fruit yield of cucumber (Cucumis sativus L.) in solar-greenhouse. PLoS ONE 2014, 9, e86975. [Google Scholar] [CrossRef] [PubMed]
  4. Hu, W.Y.; Zhang, Y.X.; Huang, B.; Teng, Y. Soil environmental quality in greenhouse vegetable production systems in eastern China: Current status and management strategies. Chemosphere 2017, 170, 183–195. [Google Scholar] [CrossRef]
  5. Chai, Q.; Gan, Y.T.; Zhao, C.; Xu, H.L.; Waskom, R.M.; Niu, Y.N.; Siddique, K.H.M. Regulated deficit irrigation for crop production under drought stress. A Review. Agron. Sustain. Dev. 2016, 36, 3. [Google Scholar] [CrossRef]
  6. Yan, W.H.; Li, F.W.; Zhao, Y. Determination of irrigation water quantity and its impact on crop yield and groundwater. Agric. Water Manag. 2022, 273, 107900. [Google Scholar] [CrossRef]
  7. Manmeet, S.; Suhaib, A. IoT based smart water management systems: A systematic review. Mater. Today 2021, 46, 5211–5218. [Google Scholar] [CrossRef]
  8. Seyar, M.H.; Ahamed, T. Development of an IoT-Based Precision Irrigation System for Tomato Production from Indoor Seedling Germination to Outdoor Field Production. Appl. Sci. 2023, 13, 5556. [Google Scholar] [CrossRef]
  9. Bouali, E.; Mohamed, R.A.; El-Mahjoub, B.; Abdennabi, M.; Safae, B.; Tareq, A.H.; Driss, B. Enhancing water management in smart agriculture: A cloud and IoT-Based smart irrigation system. Results Eng. 2024, 22, 102283. [Google Scholar] [CrossRef]
  10. Zotarelli, L.; Dukes, M.D.; Scholberg, J.M.S.; Muñoz-Carpena, R.; Icerman, J. Tomato nitrogen accumulation and fertilizer use efficiency on a sandy soil, as affected by nitrogen rate and irrigation scheduling. Agric. Water Manag. 2009, 96, 1247–1258. [Google Scholar] [CrossRef]
  11. Sun, Y.; Hu, K.L.; Zhang, K.F.; Jiang, L.H.; Xu, Y. Simulation of nitrogen fate for greenhouse cucumber grown under different water and fertilizer management using the EU-Rotate_N model. Agric. Water Manag. 2012, 112, 21–32. [Google Scholar] [CrossRef]
  12. Malone, T.C.; Newton, A. The globalization of cultural eutrophication in the coastal ocean: Causes and consequences. Front. Mar. Sci. 2020, 7, 670. [Google Scholar] [CrossRef]
  13. Mendes, W.D.C.; Alves, J.; da Cunha, P.C.R.; da Silva, A.R.; Evangelista, A.W.P.; Casaroli, D. Potassium leaching in different soils as a function of irrigation depths. Rev. Bras. Eng. Agric. Ambient. 2016, 20, 972–977. [Google Scholar] [CrossRef]
  14. Zhu, G.Y.; Deng, L.; Shangguan, Z.P. Effects of soil aggregate stability on soil N following land use changes under erodible environment. Agric. Ecosyst. Environ. 2018, 262, 18–28. [Google Scholar] [CrossRef]
  15. Zhou, W.W.; Lv, H.F.; Chen, F.; Wang, Q.Y.; Li, J.L.; Chen, Q.; Liang, B. Optimizing nitrogen management reduces mineral nitrogen leaching loss mainly by decreasing water leakage in vegetable fields under plastic-shed greenhouse. Environ. Pollut. 2022, 308, 119616. [Google Scholar] [CrossRef] [PubMed]
  16. Sajjad, M.; Hussain, K.; Wajid, S.A.; Saqib, Z.A. The Impact of Split Nitrogen Fertilizer Applications on the Productivity and Nitrogen Use Efficiency of Rice. Nitrogen 2025, 6, 1. [Google Scholar] [CrossRef]
  17. Correll, D.L. The role of phosphorus in the eutrophication of receiving waters. A Review. J. Environ. Qual. 1998, 27, 261–266. [Google Scholar] [CrossRef]
  18. Vopenka, L.; Machacek, V.; Pirkl, J. Phosphorus, potassium and calcium leaching from the soil by percolating water. Rostl. Vyrob. 1987, 33, 813–818. [Google Scholar]
  19. Sun, Y.; Hu, K.L.; Fan, Z.B.; Wei, Y.P.; Lin, S.; Wang, J.G. Simulating the fate of nitrogen and optimizing water and nitrogen management of greenhouse tomato in North China using the EU-Rotate-N model. Agric. Water Manag. 2013, 128, 72–84. [Google Scholar] [CrossRef]
  20. Dasgan, H.Y.; Kusvuran, S.; Kirda, C. Use of short duration partial root drying (PRD) in soilless grown cucumber by 35% deficit irrigation. Acta Hortic. 2012, 927, 163–170. [Google Scholar] [CrossRef]
  21. Yang, H.; Du, T.S.; Qiu, R.J.; Chen, J.L.; Wang, F.; Li, Y.; Wang, C.X.; Gao, L.H.; Kang, S.Z. Improved water use efficiency and fruit quality of greenhouse crops under regulated deficit irrigation in northwest China. Agric. Water Manag. 2017, 179, 193–204. [Google Scholar] [CrossRef]
  22. Houba, V.J.G.; Temminghoff, E.J.M.; Gaikhorst, G.A.; van Vark, W. Soil analysis procedures using 0.01 M calcium chloride as extraction reagent. Commun. Soil Sci. Plant Anal. 2000, 31, 1299–1396. [Google Scholar] [CrossRef]
  23. Carson, P.L. Recommended potassium test. In Recommended Chemical Soil Test Procedures for the North Central Region; Dahnke, W.C., Ed.; Bulletin 499; North Dakota Agricultural Experiment Station: Fargo, ND, USA, 1980; pp. 17–18. [Google Scholar]
  24. Isaac, R.A.; Kerber, J.D. Atomic absorption and flame photometry: Techniques and uses in soil, plant, and water analysis. In Instrumental Methods for Analysis of Soils and Plant Tissue; Walsh, L.M., Ed.; Soil Science Society of America: Madison, WI, USA, 1971; pp. 17–37. [Google Scholar] [CrossRef]
  25. Aronsson, H.; Torstensson, G.; Bergström, L. Leaching and crop uptake of N, P and K from organic and conventional cropping systems on a clay soil. Soil Use Manag. 2007, 23, 71–81. [Google Scholar] [CrossRef]
  26. Chu, L.L.; Kang, Y.H.; Wan, S.Q. Influence of microsprinkler irrigation amount on water, soil, and pH profiles in a coastal saline soil. Sci. World J. 2014, 2014, 279895. [Google Scholar] [CrossRef]
  27. Malhi, S.S.; Brandt, S.A.; Ulrich, D.; Lemke, R.; Gill, K.S. Accumulation and distribution of nitrate–nitrogen and extractable phosphorus in the soil profile under various alternative cropping systems. J. Plant Nutr. 2002, 25, 2499–2520. [Google Scholar] [CrossRef]
  28. Dal Molin, S.J.; Ernani, P.R.; Soldatelli, P.; Cassol, P.C. Leaching and recovering of nitrogen following N fertilizers application to the soil in a laboratory study. Commun. Soil Sci. Plant Anal. 2018, 49, 1099–1106. [Google Scholar] [CrossRef]
  29. Sun, H.J.; Min, J.; Zhang, H.L.; Feng, Y.F.; Lu, K.P.; Shi, W.M.; Yu, M.; Li, X.W. Biochar application mode influences nitrogen leaching and NH3 volatilization losses in a rice paddy soil irrigated with N-rich wastewater. Environ. Technol. 2018, 39, 2090–2096. [Google Scholar] [CrossRef] [PubMed]
  30. Qasim, W.; Xia, L.L.; Lin, S.; Wan, L.; Zhao, Y.M.; Butterbach-Bahl, K. Global greenhouse vegetable production systems are hotspots of soil N2O emissions and nitrogen leaching: A meta-analysis. Environ. Pollut. 2021, 272, 116372. [Google Scholar] [CrossRef]
  31. Min, J.; Zhao, X.; Shi, W.M.; Xing, G.X.; Zhu, Z.L. Nitrogen balance and loss in a greenhouse vegetable system in southeastern china. Pedosphere 2011, 21, 464–472. [Google Scholar] [CrossRef]
  32. Tian, Y.Q.; Wang, Q.; Zhang, W.H.; Gao, L.H. Reducing environmental risk of excessively fertilized soils and improving cucumber growth by Caragana microphylla-straw compost application in long-term continuous cropping systems. Sci. Total Environ. 2016, 544, 251–261. [Google Scholar] [CrossRef]
  33. Bruno, I.P.; Araújo, A.G.; Merten, G.H.; Ladeira, A.S.; Pinto, V.M. Crop Rotation and Nitrogen Fertilizer on Nitrate Leaching: Insights from a Low Rainfall Study. Nitrogen 2024, 5, 329–348. [Google Scholar] [CrossRef]
  34. Raave, H.; Keres, I.; Kauer, K.; Nõges, M.; Rebane, J.; Tampere, M.; Loit, E. The impact of activated carbon on NO3--N, NH4+-N, P and K leaching in relation to fertilizer use. Eur. J. Soil Sci. 2014, 65, 120–127. [Google Scholar] [CrossRef]
  35. Qin, J.H.; Niu, A.Y.; Li, Q.W.; Liu, Y.Q.; Lin, C.X. Effect of soluble calcium on enhancing nitrate retention by biochar. J. Environ. Manag. 2020, 274, 111133. [Google Scholar] [CrossRef] [PubMed]
  36. Quemada, M.; Baranski, M.; Nobel-de Lange, M.N.J.; Vallejo, A.; Cooper, J.M. Meta-analysis of strategies to control nitrate leaching in irrigated agricultural systems and their effects on crop yield. Agric. Ecosyst. Environ. 2013, 174, 1–10. [Google Scholar] [CrossRef]
  37. Huang, T.; Ju, X.; Yang, H. Nitrate leaching in a winter wheat-summer maize rotation on a calcareous soil as affected by nitrogen and straw management. Sci. Rep. 2017, 7, 42247. [Google Scholar] [CrossRef]
  38. Luo, X.; Kou, C.; Wang, Q. Optimal Fertilizer Application Reduced Nitrogen Leaching and Maintained High Yield in Wheat-Maize Cropping System in North China. Plants 2022, 11, 1963. [Google Scholar] [CrossRef]
  39. Nartey, O.D.; Liu, D.; Luo, J.; Lindsey, S.; Chen, Z.; Yuan, J.; Zaman, M.; Hogarh, J.N.; Ding, W. Optimizing application of dairy effluent with synthetic N fertilizer reduced nitrogen leaching in clay loam soil. Heliyon 2024, 10, e33900. [Google Scholar] [CrossRef]
  40. Heckrath, G.; Brookes, P.C.; Poulton, P.R.; Goulding, K.W.T. Phosphorus leaching from soils containing different phosphorus concentrations in the broadbalk experiment. J. Environ. Qual. 1995, 24, 904–910. [Google Scholar] [CrossRef]
  41. Yan, Z.J.; Liu, P.P.; Li, Y.H.; Ma, L.; Alva, A.; Dou, Z.X.; Chen, Q.; Zhang, F.S. Phosphorus in China’s Intensive Vegetable Production Systems: Overfertilization, Soil Enrichment, and Environmental Implications. J. Environ. Qual. 2013, 42, 982–989. [Google Scholar] [CrossRef]
  42. Cabello, M.J.; Castellanos, M.T.; Romojaro, F.; Martínez-Madrid, C.; Ribas, F. Yield and quality of melon grown under different irrigation and nitrogen rates. Agric. Water Manag. 2009, 96, 866–874. [Google Scholar] [CrossRef]
  43. Shao, G.C.; Liu, N.; Zhang, Z.Y.; Yu, S.; Chen, C.R. Growth, yield and water use efficiency response of greenhouse-grown hot pepper under Time-Space deficit irrigation. Sci. Hortic. 2010, 126, 172–179. [Google Scholar] [CrossRef]
  44. Chen, J.L.; Kang, S.Z.; Du, T.S.; Qiu, R.J.; Guo, P.; Chen, R.Q. Quantitative response of greenhouse tomato yield and quality to water deficit at different growth stages. Agric. Water Manag. 2013, 129, 152–162. [Google Scholar] [CrossRef]
  45. Fan, Q.F.; Zhang, Y.L. Water use and productivity of tomato under four irrigation systems in greenhouse; Northern China. In Proceedings of the 3rd International Conference on Mechanics, Dynamic Systems and Material Engineering, Guangzhou, China, 15–17 May 2015; pp. 48–52. [Google Scholar]
  46. Davies, W.J.; Bacon, M.A.; Thompson, D.S.; Sobeih, W.; González Rodríguez, L. Regulation of leaf and fruit growth in plants growing in drying soil: Exploitation of the plants’ chemical signalling system and hydraulic architecture to increase the efficiency of water use in agriculture. J. Exp. Bot. 2000, 51, 1617–1626. [Google Scholar] [CrossRef] [PubMed]
  47. Du, T.S.; Kang, S.Z.; Sun, J.S.; Zhang, X.Y.; Zhang, J.H. An improved water use efficiency of cereals under temporal and spatial deficit irrigation in north China. Agric. Water Manag. 2010, 97, 66–74. [Google Scholar] [CrossRef]
Figure 1. Schematic diagram of lysimeters used in the experiment. (a) Physical picture of the lysimeter. (b) Pattern image of the lysimeter. I. Vaporizer cabinet; II. filter; III. test soil; IV. snorkel; V. suction pump; VI. water container; VII. horizon; VIII. plastic tube; IX. water bucket; X. soft plastic tube. Dimensions are expressed in cm.
Nitrogen 06 00018 g001
Figure 2. Work flow chart in this study.
Nitrogen 06 00018 g002
Figure 3. Effect of different irrigation treatments on the dynamic changes in mineral elements with the soil layer (0–100 cm depth) during an irrigation (fertilization) cycle in the autumn–winter season. (a) Soil nitrate–nitrogen (NO3–N); (b) available phosphorus (A–P); (c) available potassium (A–K). The irrigation cycle occurred from 19 October to 10 November, where −1 is the day before irrigation (19 October), and 1, 6, 12, and 22 are the 1st (21 October), 6th (26 October), 12th (1 November), and 22th (11 November) days after irrigation, respectively. A total of 525 m3 ha−1, 315 m3 ha−1, and 189 m3 ha−1 irrigation amounts were applied each time for NI (normal irrigation), OI (optimized irrigation), and DI (deficit irrigation) treatments, respectively. Mean values were obtained from three biological replicates, each quantified with three technical replicates. Different letters above data points represent differences (LSD-tests, p < 0.05) within treatments in the same soil layer and at the same time point.
Nitrogen 06 00018 g003
Figure 4. Effect of different irrigation treatments on the dynamic changes in mineral elements with the soil layer (0–100 cm depth) during an irrigation (fertilization) cycle in the winter–spring season. (a) Soil nitrate nitrogen (NO3–N); (b) available phosphorus (A–P); (c) available potassium (A–K). The irrigation cycle occurred from 12 April to 22 April, where −1 denotes the day before irrigation (12 April), 0 is the day of irrigation (13 April), and 1, 3, 6, and 9 are the 1st (14 April), 3rd (16 April), 6th (19 April), and 9th (22 April) days after irrigation, respectively. A total of 525 m3 ha−1, 315 m3 ha−1, and 189 m3 ha−1 irrigation amounts were applied each time for NI (normal irrigation), OI (optimized irrigation), and DI (deficit irrigation) treatments, respectively. Mean values were obtained from three biological replicates, each quantified with three technical replicates. Different letters above data points represent differences (LSD-tests, p < 0.05) within treatments in the same soil layer and at the same time point.
Nitrogen 06 00018 g004
Figure 5. Effect of different irrigation treatments on the mineral element contents in different soil depths after the harvest of cucumber in the autumn–winter and winter–spring seasons. (a) Nitrate–nitrogen (NO3–N); (b) available phosphorus (A–P); (c) available potassium (A–K). A total of 525 m3 ha−1, 315 m3 ha−1, and 189 m3 ha−1 irrigation amounts were applied each time for NI (normal irrigation), OI (optimized irrigation), and DI (deficit irrigation) treatments, respectively. Mean values were obtained from three biological replicates, each quantified with three technical replicates. The vertical bars represent the standard deviation (n = 3). Different letters above the bars represent differences (LSD-test, p < 0.05) within treatments and soil depth in the same season.
Nitrogen 06 00018 g005
Figure 6. Effect of different irrigation treatments on the amount of leached soil mineral elements in the whole growth period of cucumber in the autumn–winter and winter–spring seasons. (a) Nitrate nitrogen (NO3–N); (b) available phosphorus (A–P); (c) available potassium (A–K); (d) calcium ion (Ca2+); (e) sodium ion (Na+); (f) total mineral elements (sum of amount of all leached mineral elements shown in (ae)). Total irrigation amounts of 525 m3 ha−1, 315 m3 ha−1, and 189 m3 ha−1 were applied each time for NI (normal irrigation), OI (optimized irrigation), and DI (deficit irrigation) treatments, respectively. Mean values were obtained from three biological replicates, each quantified with three technical replicates. The vertical bars represent the standard deviation (n = 3). Different letters above the bars represent differences (LSD-test, p < 0.05) within treatments in the same season.
Nitrogen 06 00018 g006
Table 1. Irrigation and fertilization schedule under different irrigation treatments across the whole cucumber growth period of this study.
Date (Month/Day)Amount of Irrigation WaterAmount of Fertilizer
NIOIDINPK
/m³ ha−1/kg ha−1
Autumn
–winter
season
8/30
(Colonization water)
450.0450.0450.00.00.00.0
9/20
(Beginning of treatment)
525.0315.0189.038.516.254.7
9/30525.0315.0189.038.516.254.7
10/20525.0315.0189.038.516.254.7
11/12525.0315.0189.038.516.254.7
12/14525.0315.0189.019.28.127.3
Total3075.02025.01395.0173.272.9246.1
Winter
–spring
season
The following year
1/25
(Colonization water)
450.0450.0450.00.00.00.0
2/14
(Before treatment)
218.7218.7218.70.00.00.0
3/5
(Beginning of treatment)
525.0315.0189.071.930.3102.2
3/21525.0315.0189.020.68.629.3
4/3525.0315.0189.020.68.629.3
4/13525.0315.0189.071.930.3102.2
4/23525.0315.0189.042.717.960.6
5/5525.0315.0189.053.522.576.0
5/16525.0315.0189.042.717.960.6
5/26525.0315.0189.028.512.040.5
6/5525.0315.0189.028.512.040.5
6/14525.0315.0189.00.00.00.0
Total5918.73818.72558.7380.9160.1541.2
Note: Autumn–winter (end of August to end of December) and winter–spring (end of January to end of June) are the two growing seasons of the experimental period. The same amount of each fertilizer was applied between irrigation treatments in the same season. NI, normal irrigation (525 m3 ha−1); OI, optimized irrigation (315 m3 ha−1); DI, deficit irrigation (189 m3 ha−1).
Table 2. Effect of irrigation level on economic yield and water use efficiency (WUE) in the cucumber growing season.
TreatmentYield (kg·ha−1)WUE (kg·m−3)
Autumn–Winter SeasonWinter–Spring SeasonAutumn–Winter SeasonWinter–Spring Season
NI67,829.0 ± 4164.9 a89,699.3 ± 3255.8 a22.1 ± 1.4 c15.2 ± 0.6 c
OI64,513.0 ± 1205.3 a103,428.5 ± 6725.1 a31.8 ± 0.6 b27.7 ± 2.4 b
DI72,604.5 ± 3219.1 a106,367.5 ± 3982.9 a52.0 ± 2.3 a41.6 ± 1.6 a
Note: Total irrigation amounts of 525 m3 ha−1, 315 m3 ha−1, and 189 m3 ha−1 were applied each time for NI (normal irrigation), OI (optimized irrigation), and DI (deficit irrigation), respectively. WUE, economic yield (calculated as fresh weight) of water use efficiency. Different letters in the same column represent significant difference at the p < 0.05 level (LSD-test) among treatments in the same season.
Table 3. Summary of relevant studies.
TopicReference NumbersMain Content
Irrigation and water management[1,10,14,21,41,42]
-
Suitable irrigation management induces high yield and fruit quality [1].
-
Irrigation water entering the soil can dissolve the chemical elements in the upper part of the soil profile and translocate them to deeper layers [10].
-
Irrigation volume is a factor determining the leaching of nitrogen from soil [14].
-
Regulated deficit irrigation improves water use efficiency and fruit quality [21].
-
Time–space deficit irrigation effects on pepper growth and water use efficiency [41].
-
Quantitative response of greenhouse tomato yield and quality to water deficit at different growth stages [42].
Nitrogen management and leaching[1,15,16,27,30,31,33]
-
Drip fertigation significantly reduces nitrogen leaching [1].
-
Optimizing nitrogen management reduces nitrogen leaching mainly by decreasing water leakage [15].
-
Nitrogen efficiency is highly correlated with nitrogen loss [16].
-
Sufficient water supply accelerates the leaching loss of NO3–N [27].
-
Global greenhouse vegetable systems are hotspots for nitrogen leaching and N2O emissions [30].
-
Nitrogen balance and loss in greenhouse vegetable systems [31].
-
Impact of crop rotation and nitrogen fertilizer on nitrate leaching [33].
Phosphorus management and leaching[14,17,36,37]
-
Phosphates are predominantly enriched in the shallow soil layers [14].
-
Low levels of phosphorus loss can lead to eutrophication of water bodies [17].
-
Phosphorus leaching from soils with varying phosphorus concentrations [36].
-
Overfertilization and soil enrichment of phosphorus in China’s intensive vegetable systems [37].
Potassium management and leaching[13,25,34]
-
Potassium leaching increased by 20–30% under high irrigation depths (>500 mm) [13].
-
Organic systems reduced potassium leaching compared to conventional systems [25].
-
Activated carbon reduced potassium leaching by 10–15% when applied with fertilizers [34].
Disclaimer/Publisher’s Note: The statements, opinions and data contained in all publications are solely those of the individual author(s) and contributor(s) and not of MDPI and/or the editor(s). MDPI and/or the editor(s) disclaim responsibility for any injury to people or property resulting from any ideas, methods, instructions or products referred to in the content.

