
Effects of Biochar, Biogas Slurry, and Dicyandiamide Application on N2O Emissions from Soil in Tomato Production Under Protected Cultivation


Abstract
1. Introduction
2. Materials and Methods
2.1. Overview of the Research Area
2.2. Experimental Materials
2.3. Experimental Design
2.4. Measurement Indicators and Methods
2.4.1. Collection and Measurement of N2O Gas
2.4.2. Physicochemical Properties of Soil
2.4.3. Measurements of Ammonia-Oxidizing Microorganisms in Soil
2.5. Statistical Analysis
3. Results
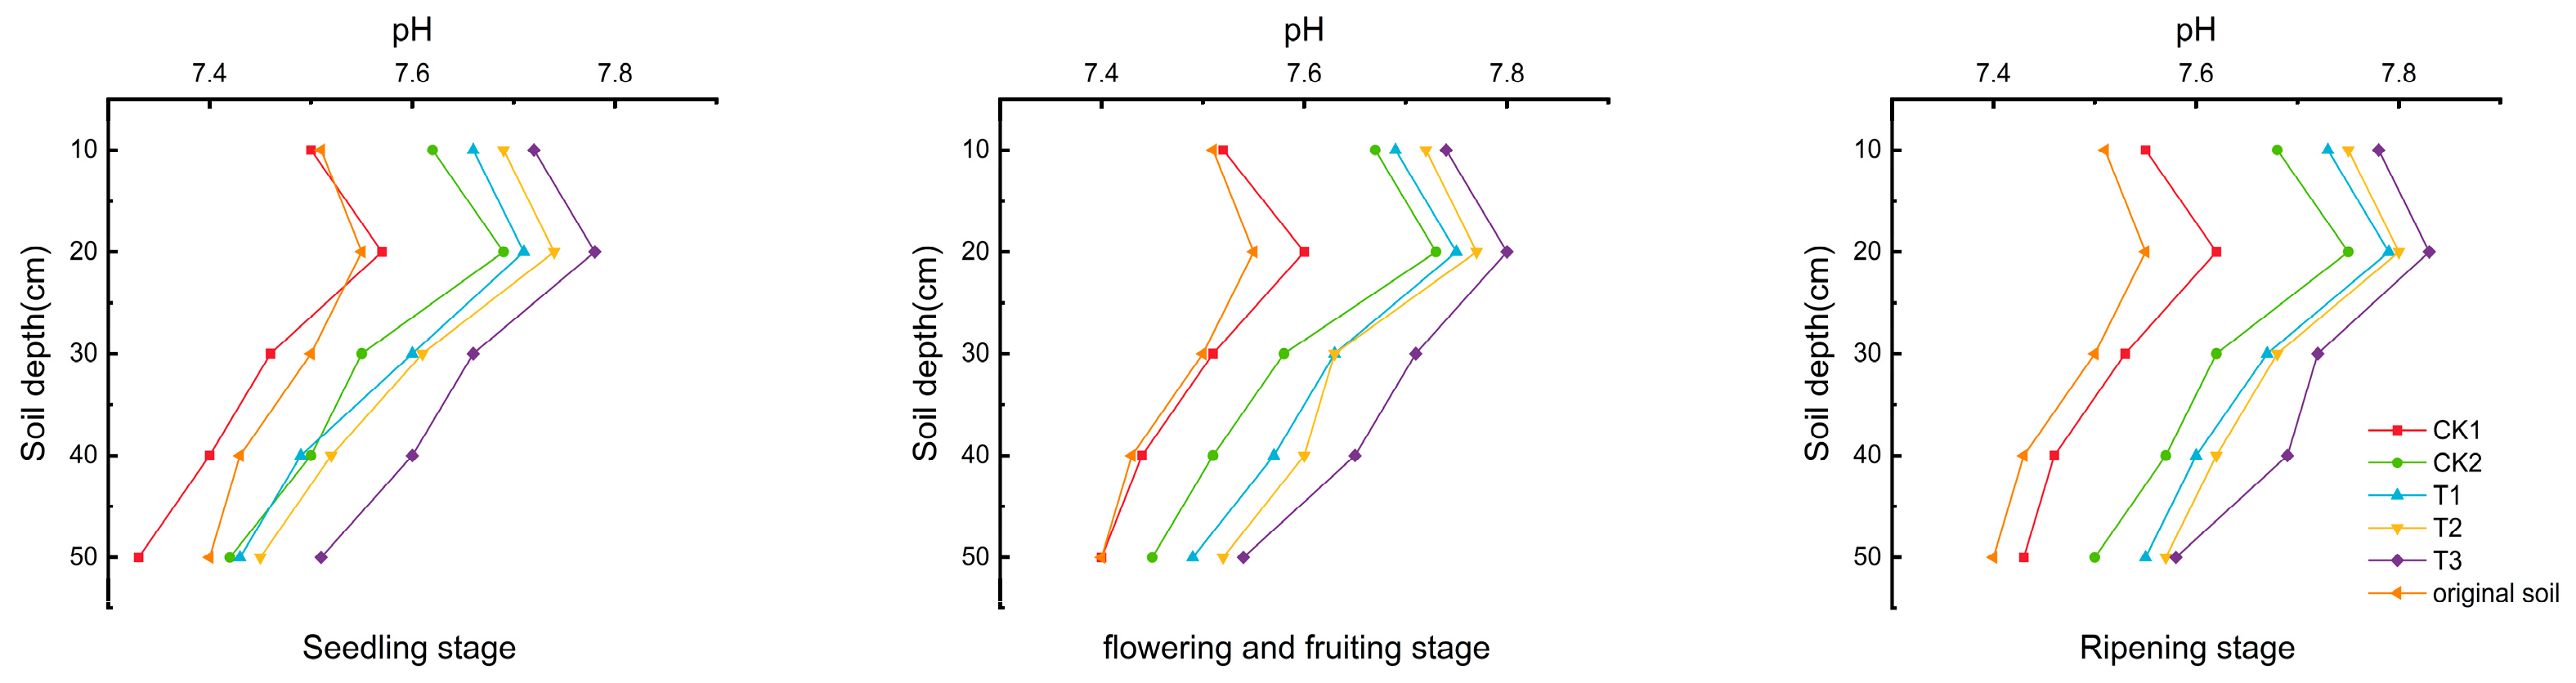
3.1. Soil pH Value
3.2. Soil Organic Matter
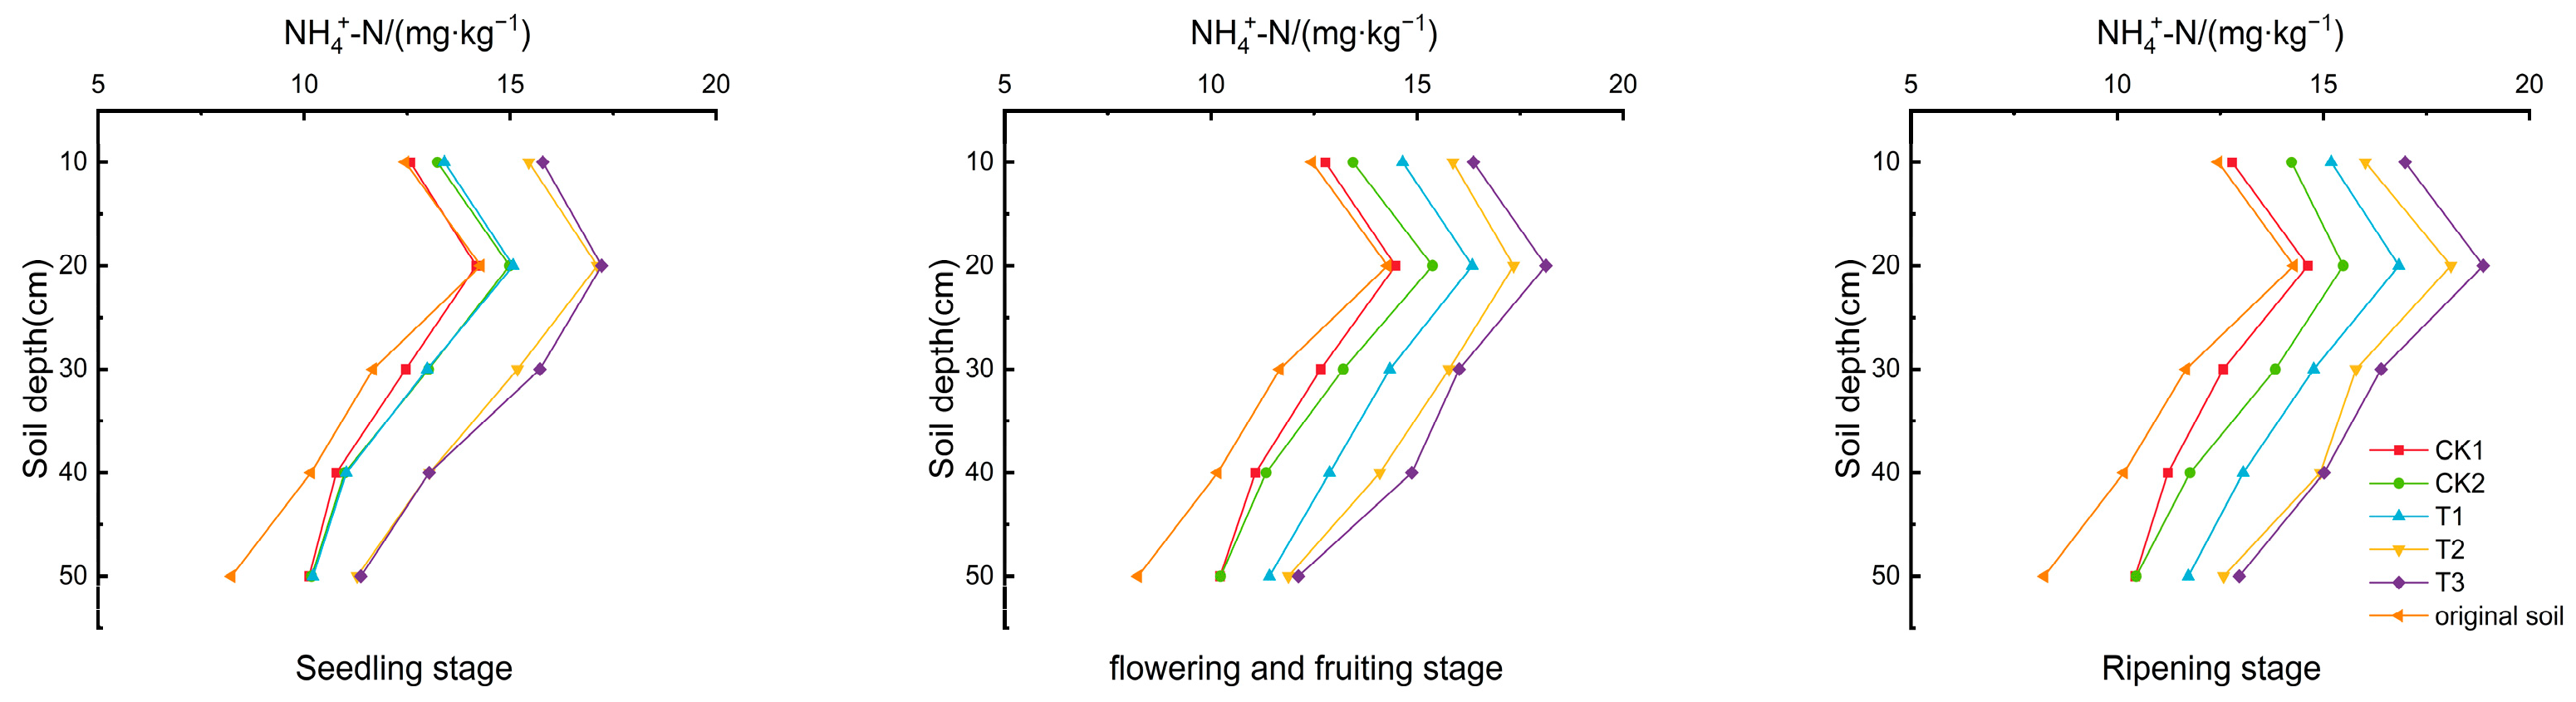
3.3. NH4+-N
3.4. NO3−-N
3.5. Ammonia-Oxidizing Microorganisms
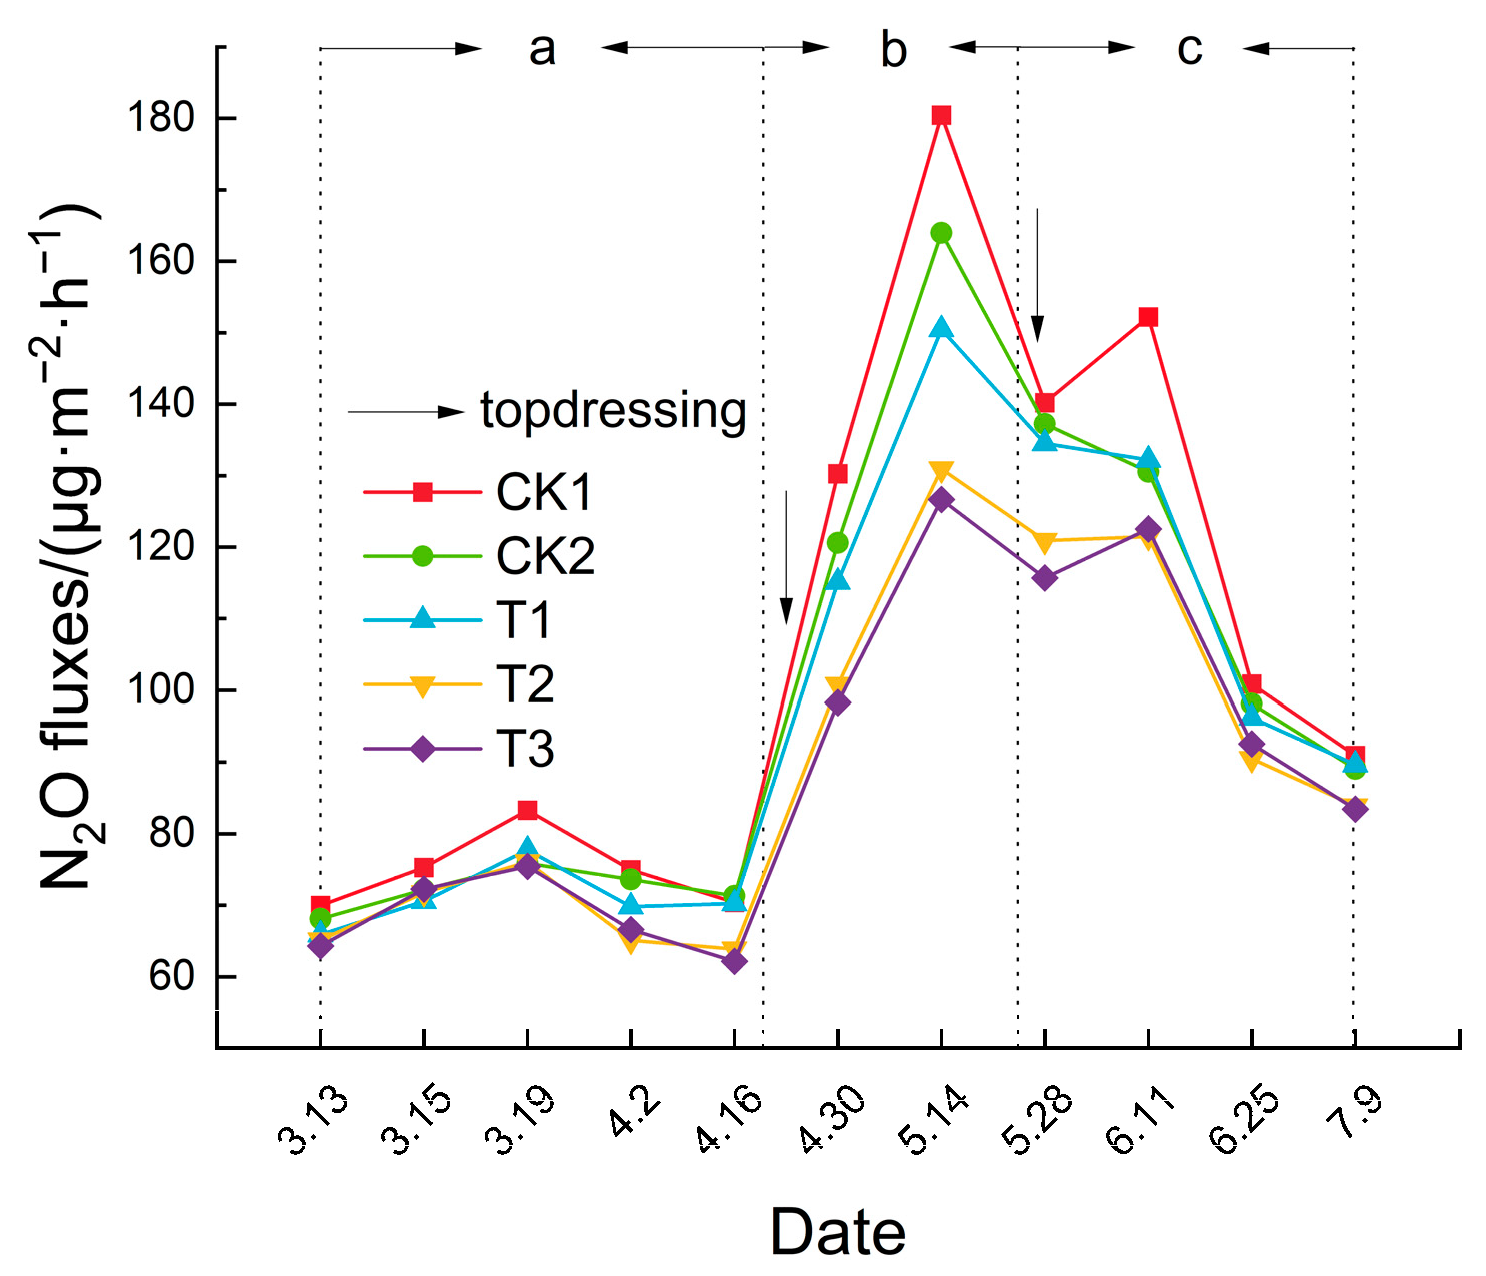
3.6. N2O Emission Flux
4. Discussion
4.1. The Effects of Biochar, Biogas Slurry, and DCD Application on Soil Physicochemical Properties
4.2. The Effects of Biochar, Biogas Slurry, and DCD Application on N2O Emissions
5. Conclusions
- The addition of biochar and biogas slurry increased the soil pH, organic matter, ammonium nitrogen, and nitrate nitrogen contents in the tomato root zone’s soil layer, while decreasing the copy number of AOB functional genes without affecting those of AOA. The introduction of DCD raised the soil pH, ammonium nitrogen, and the copy number of AOA functional genes in the 0–50 cm soil layer of the tomato root zone, while lowering the nitrate nitrogen content and the copy number of AOB functional genes, without impacting organic matter.
- The application of biochar, biogas slurry, and DCD effectively reduced N2O emissions. DCD exerted the most significant effect on reducing N2O emissions, followed by biochar, with biogas slurry having the least impact. The T3 treatment, combining biochar, biogas slurry, and DCD, yielded the best results.
Author Contributions
Funding
Data Availability Statement
Acknowledgments
Conflicts of Interest
References
- Kang, S.; Eltahir, E.A.B. North China Plain threatened by deadly heatwaves due to climate change and irrigation. Nat. Commun. 2018, 9, 2894. [Google Scholar] [CrossRef] [PubMed]
- Xu, X.; Zhao, Q.; Guo, J.; Li, C.; Li, J.; Niu, K.; Jin, S.; Fu, C.; Gaffney, P.P.J.; Xu, Y.; et al. Inequality in agricultural greenhouse gas emissions intensity has risen in rural China from 1993 to 2020. Nat. Food 2024, 5, 916–928. [Google Scholar] [CrossRef] [PubMed]
- Shcherbak, I.; Millar, N.; Robertson, G.P. Global metaanalysis of the nonlinear response of soil nitrous oxide (N2O) emissions to fertilizer nitrogen. Proc. Natl. Acad. Sci. USA 2014, 111, 9199–9204. [Google Scholar] [CrossRef]
- Wu, L.; Wu, X.; Lin, S.; Wu, Y.; Tang, S.; Zhou, M.; Shaaban, M.; Zhao, J.; Hu, R.; Kuzyakov, Y.; et al. Carbon budget and greenhouse gas balance during the initial years after rice paddy conversion to vegetable cultivation. Sci. Total Environ. 2018, 627, 46–56. [Google Scholar] [CrossRef]
- Xin, Y.; Tao, F. Developing climate-smart agricultural systems in the North China Plain. Agric. Ecosyst. Environ. 2020, 291, 106791. [Google Scholar] [CrossRef]
- Dai, Z.; Su, W.; Chen, H.; Barberan, A.; Zhao, H.; Yu, M.; Yu, L.; Brookes, P.C.; Schadt, C.W.; Chang, S.X.; et al. Long-term nitrogen fertilization decreases bacterial diversity and favors the growth of Actinobacteria and Proteobacteria in agro-ecosystems across the globe. Glob. Chang. Biol. 2018, 24, 3452–3461. [Google Scholar] [CrossRef]
- Han, J.; Shi, J.; Zeng, L.; Xu, J.; Wu, L. Effects of nitrogen fertilization on the acidity and salinity of greenhouse soils. Environ. Sci. Pollut. Res. Int. 2015, 22, 2976–2986. [Google Scholar] [CrossRef]
- Homyak, P.M.; Kamiyama, M.; Sickman, J.O.; Schimel, J.P. Acidity and organic matter promote abiotic nitric oxide production in drying soils. Glob. Chang. Biol. 2017, 23, 1735–1747. [Google Scholar] [CrossRef]
- Sa, Q.; Zheng, J.; Li, Z.; Wang, Y. A Meta-analysis of the Impact of Organic Fertilizer Application on Greenhouse Gas Emissions from Global Agricultural Soils. Environ. Sci. 2025, 46, 148–161. [Google Scholar] [CrossRef]
- Zhong, Y.; Ragauskas, A.J.; Zheng, Y.; Meng, X.; Zhou, Y.; Lin, Y. A review on the pretreatment of straw biomass by using biogas slurry. Process Saf. Environ. Prot. 2025, 195, 106843. [Google Scholar] [CrossRef]
- Zhou, W.; Qi, Y.; Xiao, N. Research progress and development suggestions on harmless treatment and resource utilization of biogas slurry. Trans. Chin. Soc. Agric. Eng. 2018, 34, 115–122. [Google Scholar]
- Nelissen, V.; Rütting, T.; Huygens, D.; Staelens, J.; Ruysschaert, G.; Boeckx, P. Maize biochars accelerate short-term soil nitrogen dynamics in a loamy sand soil. Soil Biol. Biochem. 2012, 55, 20–27. [Google Scholar] [CrossRef]
- Glaser, B.; Haumaier, L.; Guggenberger, G.; Zech, W. The ‘Terra Preta’ phenomenon: A model for sustainable agriculture in the humid tropics. Naturwissenschaften 2001, 88, 37–41. [Google Scholar] [CrossRef]
- Zhang, N.; Ye, X.; Gao, Y.; Liu, G.; Liu, Z.; Zhang, Q.; Liu, E.; Sun, S.; Ren, X.; Jia, Z.; et al. Environment and agricultural practices regulate enhanced biochar-induced soil carbon pools and crop yield: A meta-analysis. Sci. Total Environ. 2023, 905, 167290. [Google Scholar] [CrossRef] [PubMed]
- Lehmann, J.; Gaunt, J.; Rondon, M. Bio-char Sequestration in Terrestrial Ecosystems—A Review. Mitig. Adapt. Strateg. Glob. Chang. 2006, 11, 403–427. [Google Scholar] [CrossRef]
- Saarnio, S.; Heimonen, K.; Kettunen, R. Biochar addition indirectly affects N2O emissions via soil moisture and plant N uptake. Soil Biol. Biochem. 2013, 58, 99–106. [Google Scholar] [CrossRef]
- Verhoeven, E.; Six, J. Biochar does not mitigate field-scale N2O emissions in a Northern California vineyard: An assessment across two years. Agric. Ecosyst. Environ. 2014, 191, 27–38. [Google Scholar] [CrossRef]
- Yamamoto, A.; Akiyama, H.; Kojima, M.; Osaki, A. Nitrous oxide emissions from an Andosol upland field amended with four different types of biochars. Nutr. Cycl. Agroecosystems 2019, 113, 323–335. [Google Scholar] [CrossRef]
- Case, S.D.C.; McNamara, N.P.; Reay, D.S.; Stott, A.W.; Grant, H.K.; Whitaker, J. Biochar suppresses N2O emissions while maintaining N availability in a sandy loam soil. Soil Biol. Biochem. 2015, 81, 178–185. [Google Scholar] [CrossRef]
- Lentz, R.D.; Ippolito, J.A.; Spokas, K.A. Biochar and Manure Effects on Net Nitrogen Mineralization and Greenhouse Gas Emissions from Calcareous Soil under Corn. Soil Sci. Soc. Am. J. 2014, 78, 1641–1655. [Google Scholar] [CrossRef]
- Cheng, D.; ZhiYong, C.; Xie, Y.X.; YangYang, Z.; Gou, P.X.; JiaHeng, Y.; DongYun, M.A.; ChenYang, W.; Guo, T.C. Effects of Successive Biochar Addition to Soil on Nitrogen Functional Microorganisms and Nitrous Oxide Emission. Sci. Agric. Sin. 2020, 53, 4024–4034. [Google Scholar] [CrossRef]
- Harter, J.; Krause, H.-M.; Schuettler, S.; Ruser, R.; Fromme, M.; Scholten, T.; Kappler, A.; Behrens, S. Linking N2O emissions from biochar-amended soil to the structure and function of the N-cycling microbial community. ISME J. 2014, 8, 660–674. [Google Scholar] [CrossRef]
- Zhang, A.; Liu, Y.; Pan, G.; Hussain, Q.; Li, L.; Zheng, J.; Zhang, X. Effect of biochar amendment on maize yield and greenhouse gas emissions from a soil organic carbon poor calcareous loamy soil from Central China Plain. Plant Soil 2012, 351, 263–275. [Google Scholar] [CrossRef]
- Fan, C.; Wang, D.; Duan, P.; Gao, W.; Liu, Y.; Wu, X.; Liu, H.; Ning, Z.; Li, Q.; Chen, M. Mechanistic insights into mitigating N2O emissions by the nitrification inhibitor dicyandiamide (DCD) in a tropical sandy soil after six years of manure amendment. Pedosphere 2024, in press. [Google Scholar] [CrossRef]
- Gao, J.; Luo, J.; Lindsey, S.; Shi, Y.; Wang, L. Benefits and Risks for the Environment and Crop Production with Application of Nitrification Inhibitors in China. J. Soil Sci. Plant Nutr. 2021, 21, 497–512. [Google Scholar] [CrossRef]
- Zhang, M.; Fan, C.H.; Li, Q.L.; Li, B.; Zhu, Y.Y.; Xiong, Z.Q. A 2-yr field assessment of the effects of chemical and biological nitrification inhibitors on nitrous oxide emissions and nitrogen use efficiency in an intensively managed vegetable cropping system. Agric. Ecosyst. Environ. 2015, 201, 43–50. [Google Scholar] [CrossRef]
- Zheng, Q.; Wang, W.; Wen, J.; Wu, R.; Wu, J.; Zhang, W.; Zhang, M. Non-additive effects of bamboo-derived biochar and dicyandiamide on soil greenhouse gas emissions, enzyme activity and bacterial community. Ind. Crops Prod. 2023, 194, 116385. [Google Scholar] [CrossRef]
- He, S.; Zheng, J. Effects of different water/biogas slurry integrated irrigation methods on tomato growth, yield and quality. China Rural. Water Hydropower 2022, 118–122+129. [Google Scholar]
- Shan, N.; Chuan, L.; Li, M.; Liu, J. Effect of fertilizer application recommended by nutrient expert system on tomatoes. China Cucurbits Veg. 2022, 35, 45–50. [Google Scholar] [CrossRef]
- John, R.; Dalling, J.W.; Harms, K.E.; Yavitt, J.B.; Stallard, R.F.; Mirabello, M.; Hubbell, S.P.; Valencia, R.; Navarrete, H.; Vallejo, M.; et al. Soil nutrients influence spatial distributions of tropical tree species. Proc. Natl. Acad. Sci. USA 2007, 104, 864–869. [Google Scholar] [CrossRef]
- Oyonarte, C.; Aranda, V.; Durante, P. Soil surface properties in Mediterranean mountain ecosystems: Effects of environmental factors and implications of management. For. Ecol. Manag. 2008, 254, 156–165. [Google Scholar] [CrossRef]
- Zhang, Y.; Yan, C.; Wang, T.; Zhang, G.; Bahn, M.; Mo, F.; Han, J. Biochar strategy for long-term N2O emission reduction: Insights into soil physical structure and microbial interaction. Soil Biol. Biochem. 2025, 202, 109685. [Google Scholar] [CrossRef]
- Nguyen, T.T.N.; Xu, C.-Y.; Tahmasbian, I.; Che, R.; Xu, Z.; Zhou, X.; Wallace, H.M.; Bai, S.H. Effects of biochar on soil available inorganic nitrogen: A review and meta-analysis. Geoderma 2017, 288, 79–96. [Google Scholar] [CrossRef]
- Dempster, D.N.; Jones, D.L.; Murphy, D.V. Clay and biochar amendments decreased inorganic but not dissolved organic nitrogen leaching in soil. Soil Res. 2012, 50, 216. [Google Scholar] [CrossRef]
- Snyder, C.S.; Bruulsema, T.W.; Jensen, T.L.; Fixen, P.E. Review of greenhouse gas emissions from crop production systems and fertilizer management effects. Agric. Ecosyst. Environ. 2009, 133, 247–266. [Google Scholar] [CrossRef]
- Han, S.; Zeng, L.; Luo, X.; Xiong, X.; Wen, S.; Wang, B.; Chen, W.; Huang, Q. Shifts in Nitrobacter- and Nitrospira-like nitrite-oxidizing bacterial communities under long-term fertilization practices. Soil Biol. Biochem. 2018, 124, 118–125. [Google Scholar] [CrossRef]
- Wang, C.; Lu, H.; Dong, D.; Deng, H.; Strong, P.J.; Wang, H.; Wu, W. Insight into the Effects of Biochar on Manure Composting: Evidence Supporting the Relationship between N2O Emission and Denitrifying Community. Environ. Sci. Technol. 2013, 47, 7341–7349. [Google Scholar] [CrossRef] [PubMed]
- Harter, J.; Weigold, P.; El-Hadidi, M.; Huson, D.H.; Kappler, A.; Behrens, S. Soil biochar amendment shapes the composition of N2O-reducing microbial communities. Sci. Total Environ. 2016, 562, 379–390. [Google Scholar] [CrossRef]
- Hyodo, A.; Malghani, S.; Zhou, Y.; Mushinski, R.M.; West, J.B. Biochar amendment suppresses N2O emissions but has no impact on 15N site preference in an anaerobic soil. Rapid Commun. Mass Spectrom. 2019, 33, 165–175. [Google Scholar] [CrossRef]
- Shi, Y.; Rahaman, M.A.; Zhang, Q.; Zhan, X.; Zheng, L. Effects of partial substitution of chemical fertilizer with biogas slurry on nitrous oxide emissions and the related nitrifier and denitrifier in a saline–alkali soil. Environ. Technol. Innov. 2022, 28, 102900. [Google Scholar] [CrossRef]
- Jia, Z.; Conrad, R. Bacteria rather than Archaea dominate microbial ammonia oxidation in an agricultural soil. Environ. Microbiol. 2009, 11, 1658–1671. [Google Scholar] [CrossRef] [PubMed]
- Lehtovirta-Morley, L.E.; Stoecker, K.; Vilcinskas, A.; Prosser, J.I.; Nicol, G.W. Cultivation of an obligate acidophilic ammonia oxidizer from a nitrifying acid soil. Proc. Natl. Acad. Sci. USA 2011, 108, 15892–15897. [Google Scholar] [CrossRef] [PubMed]


| Soil Layer/cm | pH | Soil Moisture Content/% | /(mg·kg−1) | /(mg·kg−1) | OM/(g·kg−1) |
|---|---|---|---|---|---|
| 0~10 | 7.51 | 14.21 | 142.763 | 12.453 | 14.632 |
| 10~20 | 7.55 | 15.61 | 150.237 | 14.286 | 16.475 |
| 20~30 | 7.50 | 12.75 | 138.238 | 11.672 | 13.356 |
| 30~40 | 7.43 | 11.68 | 120.362 | 10.163 | 11.351 |
| 40~50 | 7.40 | 11.43 | 83.231 | 8.236 | 8.823 |
Disclaimer/Publisher’s Note: The statements, opinions and data contained in all publications are solely those of the individual author(s) and contributor(s) and not of MDPI and/or the editor(s). MDPI and/or the editor(s) disclaim responsibility for any injury to people or property resulting from any ideas, methods, instructions or products referred to in the content. |
© 2025 by the authors. Licensee MDPI, Basel, Switzerland. This article is an open access article distributed under the terms and conditions of the Creative Commons Attribution (CC BY) license (https://creativecommons.org/licenses/by/4.0/).
Share and Cite
Zheng, J.; Li, Z.; Sa, Q.; Wang, Y. Effects of Biochar, Biogas Slurry, and Dicyandiamide Application on N2O Emissions from Soil in Tomato Production Under Protected Cultivation. Nitrogen 2025, 6, 17. https://doi.org/10.3390/nitrogen6010017
Zheng J, Li Z, Sa Q, Wang Y. Effects of Biochar, Biogas Slurry, and Dicyandiamide Application on N2O Emissions from Soil in Tomato Production Under Protected Cultivation. Nitrogen. 2025; 6(1):17. https://doi.org/10.3390/nitrogen6010017
Chicago/Turabian StyleZheng, Jian, Zifan Li, Qinglin Sa, and Yan Wang. 2025. "Effects of Biochar, Biogas Slurry, and Dicyandiamide Application on N2O Emissions from Soil in Tomato Production Under Protected Cultivation" Nitrogen 6, no. 1: 17. https://doi.org/10.3390/nitrogen6010017
APA StyleZheng, J., Li, Z., Sa, Q., & Wang, Y. (2025). Effects of Biochar, Biogas Slurry, and Dicyandiamide Application on N2O Emissions from Soil in Tomato Production Under Protected Cultivation. Nitrogen, 6(1), 17. https://doi.org/10.3390/nitrogen6010017