Article

Structural Traits, Production, Biomass Allocation, and Changes in Leaf Investment in Megathyrsus maximus cv. MG12 Paredão Under Nitrogen Fertilization and Cutting Intervals

by
Vinícus L. Pinheiro
,
Andressa S. Mendonça
,
Danny Hellen G. Cruz
,
Laylles C. Araújo
,
Kele S. P. Andrade
,
Tiago C. Rocha
* and
Weverton P. Rodrigues
*
Agricultural Sciences Center, State University of the Tocantina Region of Maranhão (UEMASUL), Avenida Agrária 100, Imperatriz 65900-001, MA, Brazil
*
Authors to whom correspondence should be addressed.
Nitrogen 2025, 6(1), 12; https://doi.org/10.3390/nitrogen6010012
Submission received: 29 December 2024 / Revised: 6 February 2025 / Accepted: 28 February 2025 / Published: 3 March 2025

Abstract

:
Nitrogen (N) deficiency in soil limits the development of forage grasses, while its application can significantly increase productivity. This study aimed to evaluate the effects of increasing N doses and cutting intervals on structural and productive traits, biomass allocation, leaf chlorophyll index, and specific leaf area in Megathyrsus maximus cv. MG12 Paredão. The experiment was conducted with a randomized block design in the field, using a 5 × 2 factorial scheme, with five N fertilization levels (0, 100, 200, 300, and 400 kg N ha−1 year−1) and two cutting intervals (either 28 or 56 days). Our measurements included plant height, number of tillers, dry mass production, fresh shoot weight, root dry mass, leaf and stem biomass, SPAD readings, and specific leaf area. The results indicated a significant increase in SPAD values associated with higher N fertilization levels, so that the 300 kg N ha−1 year−1 dose resulted in the most significant changes compared to the control, with SPAD values increasing from 38.2 in the control group to 54.7. Dry mass production (DMP) was higher at the 28-day cutting interval compared to 56 days, particularly with 400 kg N ha−1. The 400 kg N ha−1 year−1 dose resulted in a 68% increase in DMP compared to the control at 28-day intervals. Additionally, fertilization enhanced the number of tillers, leading to greater biomass accumulation. Significant differences in plant height were observed between cutting intervals, with taller plants recorded at 56 days. N fertilization promoted increased plant height, particularly at doses of 200, 300, and 400 kg ha−1year−1. Therefore, our study suggests the use of 400 kg N ha−1 year−1 dose at 28-day intervals. Thus, cutting frequency directly influenced plant growth.

1. Introduction

Livestock plays a significant role in the national scenario, contributing substantially to economic growth [1]. According to the 2022 Municipal Livestock Production Survey by the Brazilian Institute of Geography and Statistics (IBGE), Brazil’s cattle herd reached a new record, totaling 234.4 million animals, representing a 4.3% increase compared to the previous year [2]. This growth underscores the increasing importance of livestock productivity, which is intrinsically linked to pasture conditions. The primary challenge, therefore, is to ensure the availability of adequate forage to meet the nutritional requirements of livestock while simultaneously maintaining the persistence and sustainability of grazed forage species. Thus, the rise in livestock productivity is directly tied to pasture conditions, creating the challenge of providing adequate forage to meet the nutritional demands of animals while ensuring the survival of grazed forage species. One characteristic of cattle production on pasture is the seasonality of forage production, which causes fluctuations in nutrient supply to the animals, particularly during the dry season, when the nutritional quality of the pasture declines.
A key factor in pasture production is the availability of nutrients in the soil. Among these, N is considered one of the most important due to its dynamic nature in the soil. Indeed, N deficiency limits forage development, resulting in reduced growth rates. Its application, however, can significantly increase protein content and enhance animal gain [3].
In addition to nutrient availability, the specific leaf area (SLA) plays a crucial role in pasture quality. SLA consists of two components: leaf thickness and density [4], and is correlated with factors such as leaf N content [5], leaf longevity [6], and water availability [7]. Variations in SLA reflect plant strategies for adapting to environmental conditions, providing valuable insight into forage performance under different management practices.
While carbon investment in leaves is well understood, root growth rates are also fundamental to plant development. Roots are responsible for water and nutrient uptake, and their growth is highly responsive to resource availability and climatic factors [8]. Therefore, it is essential to consider the dynamics of resource allocation both in the aerial parts (e.g., SLA) and the root system to fully understand forage performance.
Forage species display differing responses to cutting intervals, with each species performing better at specific growth stages [9]. Overgrazing or excessive cutting can lead to a decrease in chemical composition, an accumulation of fibrous material, and a reduced leaf-to-stem ratio. While initial increases in yield may be observed, this can lead to a decline in pasture quality over time, reducing productivity and stocking capacity. Thus, carefully managing cutting intervals is crucial to maintaining forage quality and productivity.
In addition to fertilization, other factors such as residual height and the selection of high-yielding forage species are important for optimizing pasture productivity [10]. Megathyrsus maximus (syn. Panicum maximum) is one of the most widely used grass species in tropical livestock systems, known for its high productivity and forage quality. Among its cultivars, Paredão grass stands out for its rapid regrowth, drought tolerance, and superior forage yield compared to other varieties [11,12,13].
Efficient pasture management, including appropriate cutting intervals, is essential to maximizing productivity and sustainability in animal production systems. Cutting frequency directly affects grass growth and quality, and adjustments in fertilization may be necessary to maintain both productivity and pasture health [14].
Given the importance of M. maximus cv. MG12 Paredão in livestock production, it is necessary to explore more efficient management strategies to enhance its productivity per area. This study, therefore, aims to evaluate the effects of increasing nitrogen doses and varying cutting intervals on structural traits, productivity, biomass allocation, SPAD readings, and specific leaf area in this cultivar.

2. Materials and Methods

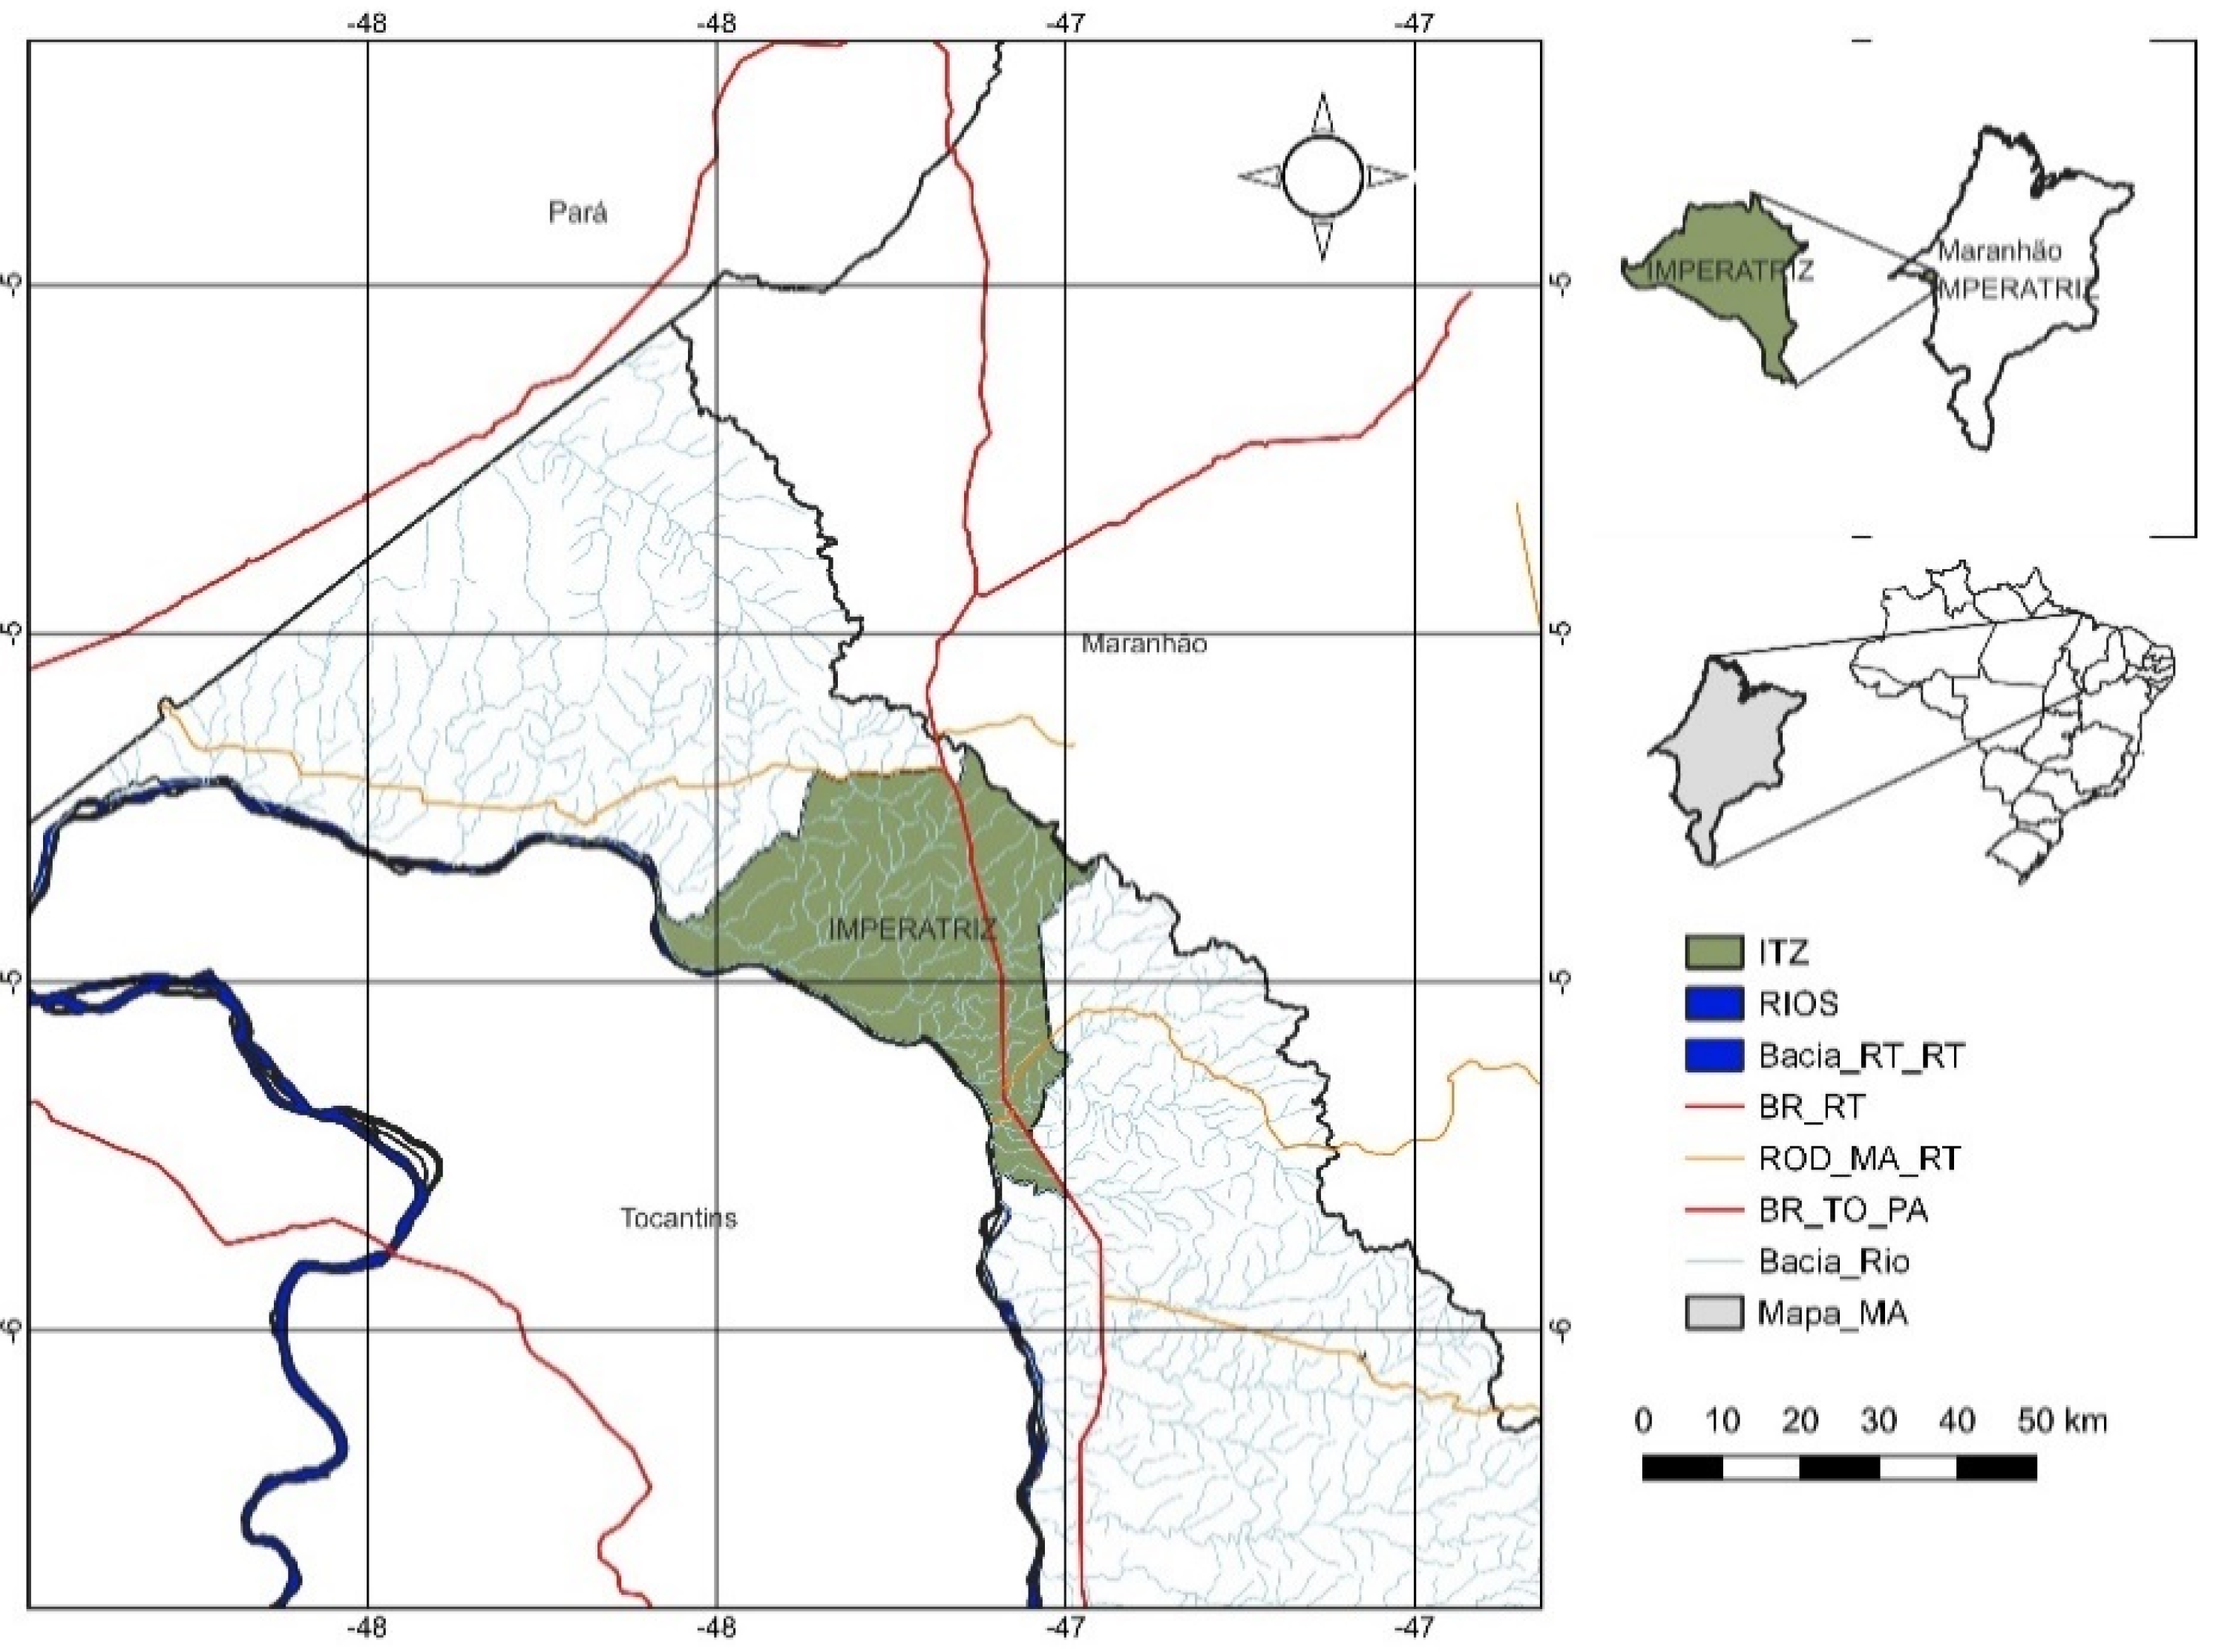
2.1. Experimental Area

The experiment was conducted at the Lourenço Vieira da Silva Exhibition Park, located in the municipality of Imperatriz (Figure 1), in the western region of the state of Maranhão, Brazil. The soil in the experimental area is classified as medium-textured, containing 670 g/kg of sand, 140 of silt, and 190 of clay. The area is situated at latitude 5°33′41.18′′ S, longitude 47°27′25.15′′ W, and an altitude of 118 m. The selection of the experimental site was based on its favorable physical traits for cultivating M. maximus.

2.2. Experimental Design and Soil Preparation

The experimental design was a completely randomized factorial scheme (5 × 2) with four replicates (each plot had an area of 12 m2.) We established 40 experimental sites within the experimental area. The treatments consisted of five N doses (0, 100, 200, 300, and 400 kg N ha−1) and two cutting intervals (either 28 or 56 days). The experimental plots were marked using 0.35 m wooden slats and delimited with strings, properly identified with polyvinyl chloride (PVC) plates specifying the applied fertilization levels. Soil analysis was conducted to determine the need for corrections. Samples were randomly collected from the experimental area at a depth of 0–0.20 m. The soil was homogenized, and a composite sample was taken for analysis (Table 1).
The 20 individual soil samples from each treatment were collected, combined in a clean container, homogenized, and approximately 250 cm3 of each composite sample was taken, stored in appropriate plastic bags, and sent to the laboratory for analysis. In the laboratory, the samples underwent initial preparation, which included air-drying, breaking up clods, and sieving through a 2 mm mesh, followed by further homogenization to ensure material uniformity. After preparation, laboratory analyses were conducted to determine soil pH, exchangeable levels of potassium (K), calcium (Ca), magnesium (Mg), aluminum (Al), and hydrogen + aluminum (H + Al), and available levels of phosphorus (P), as well as the calculation of base saturation (V), aluminum saturation (m), and cation exchange capacity (T). The methodologies used for the analyses and calculations followed the protocols described by Silva et al. [15], ensuring the standardization and reliability of the results obtained.
After the soil analysis, the experimental area was corrected by applying dolomitic limestone at a dose of 500 kg N ha−1, according to [16], 75 days before planting, with the application made by broadcasting. For phosphate fertilization, the formulated fertilizer 04-30-10 was used at a dose of 330 kg N ha−1 [16], aimed at promoting the initial development of the plants. Sowing was carried out by broadcasting, in plots measuring 4 m × 3 m (totaling 12 m2), with 40 g of seeds distributed per plot [16], using M. maximus cv. MG 12 Paredão seeds.

2.3. Fertilizer Application, Sample Collection, and Biomass Allocation

After aligning the experimental plots to a uniform height of 0.3 m, the first N fertilization application was performed using Yara Mila fertilizer (16:16:16), according to the following treatment levels: A1—0 (control); A2—100; A3—200; A4—300; and A5—400 kg of N ha−1. Applications were made every 28 days, with the same dosage for each treatment. Two fertilizations were carried out according to each treatment before the start of the experiment, and in each 28-day cutting cycle, fertilizations were applied as specified in each treatment. Samples were collected at two intervals, either 28 or 56 days after fertilization. The collected material included roots, leaves, dead matter, stems, and inflorescences. Inflorescences were recorded together with the stems due to their occurrence in a few plots and in small quantities. The number of tillers and the height of the forage plants in each treatment were also recorded.
Sample collection was performed using a 0.5 m × 0.5 m square, randomly placed within each experimental plot. In each 28- or 56-day cycle, three samples were collected per plot. The collected material was stored in properly labeled plastic bags with the plot number and corresponding sampling interval (either 28 or 56 days). Within the experimental area, the samples were weighed on a digital scale to determine the fresh shoot weight. After collection, the plots were uniformly cut to 0.3 m height. Then, N doses were reapplied according to the established levels to influence the development and production for the next collection.
The collected samples were transported to the Soil and Animal Nutrition Laboratory of the UEMASUL, where they were separated into roots, leaves, stems, and dead matter (referring to plant material that is no longer living, such as decomposing parts or tissues that had died during the plant’s growth cycle). The roots were washed under running water prior to being dried. Each fraction was placed in paper bags, properly identified, and weighed on a precision scale. Subsequently, the samples were dried in a forced-air oven at 70 °C for 72 h. After drying, the samples were weighed again on a precision scale to determine their dry matter weight. After drying, the dry mass of leaves (DML), stems (DMS), and roots (DMR) were weighed individually to calculate the average biomass allocation percentage. The partition was obtained by dividing the DML, DMS, and DMR by the dry matter production (DMP).

2.4. Soil Moisture Content

Soil moisture content was determined by weighing the sample mass in its natural state and the mass after complete drying in an oven at 110 °C. Soil samples were collected at three random points from each plot using a known-volume ring (metallic cylinder) of 25 cm3, with a depth of 5 to 10 cm. These samples were properly identified and weighed in advance. After the oven drying period, the material was weighed, and the moisture content was determined by the ratio of the sample weight at the time of collection to the weight after drying, with the soil moisture content expressed in percentage [17].

2.5. Specific Leaf Area and Leaf Green Color Index (SPAD Index)

Specific leaf area (SLA) was determined by removing ten leaf disks (6 mm2 each), with three repetitions per sample collected (four leaves at each plot). These were identified and dried in the oven following the same parameters for dry mass. After drying, the disks were weighed on an analytical balance to determine the area-to-mass ratio (cm2 g−1).
The intensity of leaf green color was measured using the portable chlorophyll meter model SPAD-502 (Konica-Minolta, Osaka, Japan) [14], with measurements taken in the morning before field sampling. The mean of 10 readings from five different plants in each of the treatments was calculated.

2.6. Statistical Analysis

After data collection and tabulation, the results were subjected to analysis of variance (ANOVA) and regression analysis using the SISVAR software (version 5.6). For each evaluated parameter, the residual mean square from the analysis of variance was used as the experimental error to assess the significance of the regression model coefficients. Additionally, mean comparisons were performed using the least significant difference (LSD) test at a 5% probability level.

3. Results

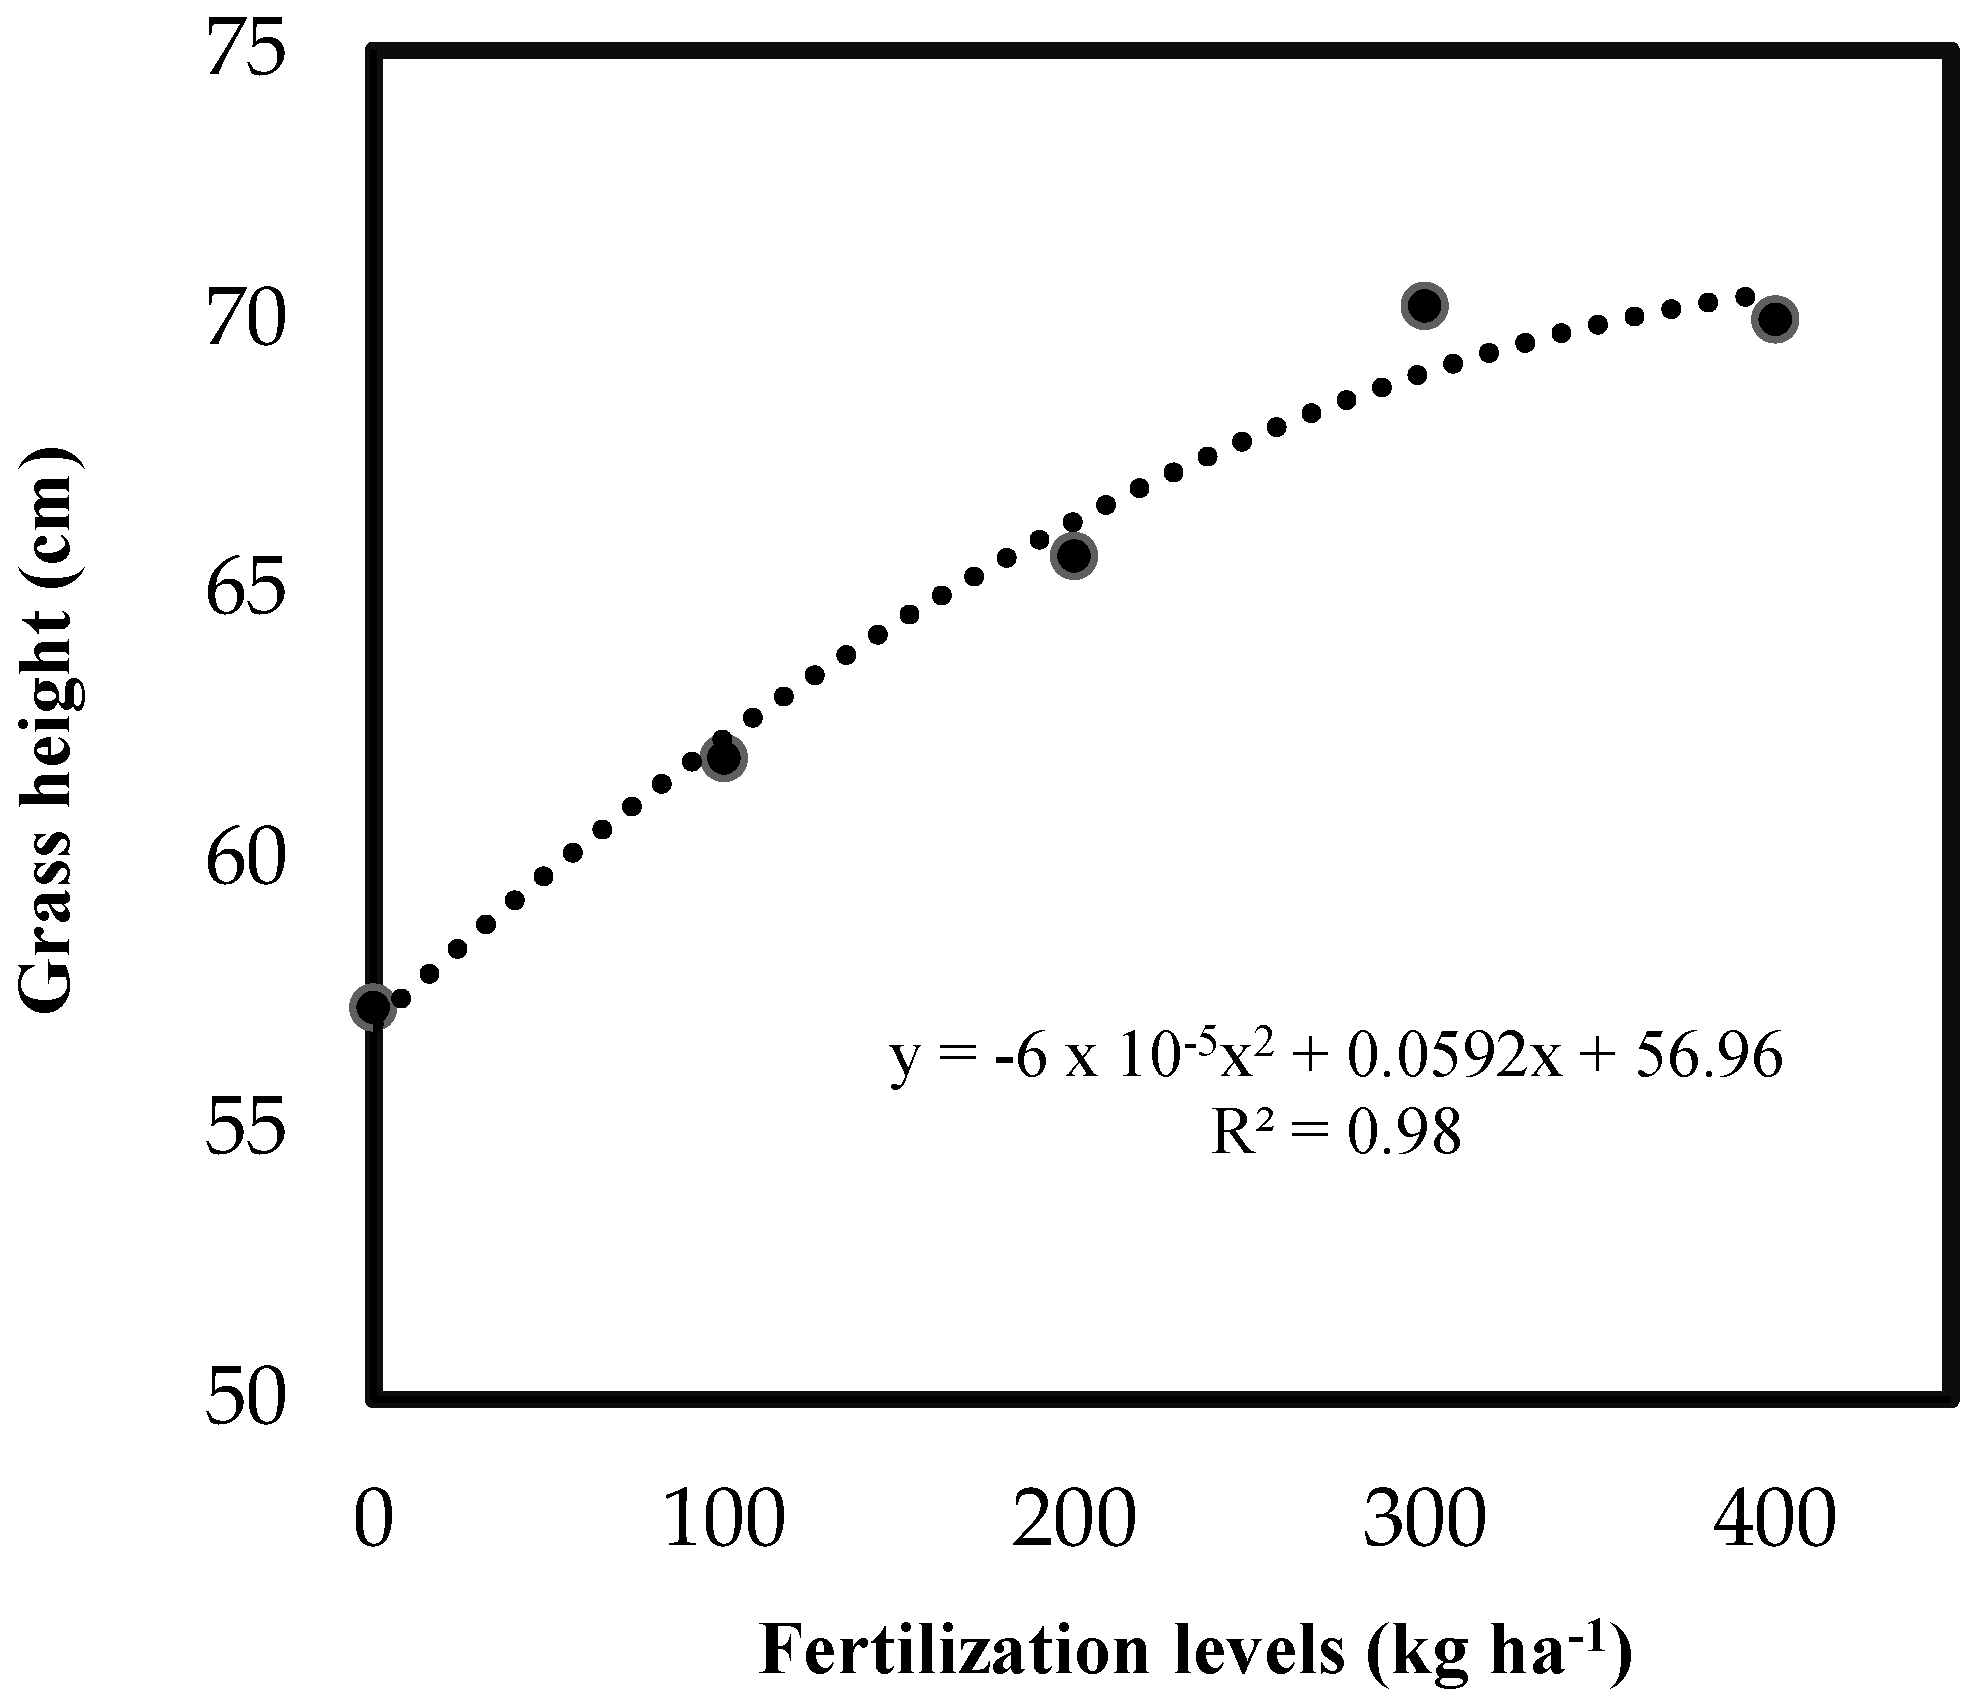
3.1. Structural and Productive Traits

The results of the study on Paredão grass (M. maximus cv. MG 12 Paredão) reveal that N fertilization has a significant effect on the both plant productive and structural traits. For DMP, there was a significant difference between the different cutting intervals at the 400 kg N ha−1 fertilization level, where the DMP was higher at the 28-day compared to the 56-day interval (Table 2). Furthermore, N fertilization promoted the development of a greater number of tillers, contributing to a higher biomass accumulation.
In the first comparison between the 28-day and 56-day cutting intervals (first evaluation period), as represented in Table 2, there were no significant differences in the number of tillers and leaf production between the treatments. However, the height showed a significant difference at the different cutting intervals, with plants at 56 days exhibiting greater height compared to those at 28 days. Additionally, regarding fertilization levels, at the 28-day cutting interval, the 200, 300, and 400 N ha−1 fertilization levels stood out, indicating that N fertilization had a positive impact on plant height at this stage.
From a nitrogen dose of 200 kg ha−1 onwards, MG12 Paredão exhibited an increase in height, with the greatest height observed at a 56-day cutting interval (Figure 2). The cultivar did not show a significant interaction between the levels and the evaluation period.
Regarding the number of tillers at different cutting intervals, the greatest values were observed at the 28-day interval. In relation to the LDM, MG12 Paredão showed a significant difference at the 56-day cutting interval when fertilized with 100 kg N ha−1 (Table 3). However, it is possible to observe that, when adjusting a single regression, the maximum response to fertilization occurred at a dose of 400 kg N ha−1 (Figure 3).
In the second comparison, as shown in Table 3, it was observed that grass height varied significantly between different cutting intervals, except at the 200 kg N ha−1 fertilization level, where the 56-day cutting interval samples exhibited the tallest plants. Furthermore, at the 28-day cutting interval, the 200, 300, and 400 kg N ha−1 fertilization levels showed significant differences, standing out compared to the other fertilization levels.
The number of tillers showed significant differences between the different cutting intervals, except for the control sample, where the 28-day cutting interval had higher values compared to the 56-day ones. Additionally, in the 28-day cutting interval, significant differences were observed among fertilization levels, with the highest tiller values recorded at the 300 and 400 kg N ha−1 levels.
Regarding DMP, there was a significant difference between cutting intervals at the 300 kg N ha−1 fertilization level, where production was higher at the 56-day compared to the 28-day cutting interval. These results highlight the importance of cutting interval and fertilization in maximizing dry matter production, indicating that proper management can lead to better productivity outcomes for the grass.
In the third comparison, it was observed that, as in the previous comparisons, the height showed significant differences between the different cutting intervals, with the 56-day cutting interval exhibiting the tallest plants (Table 4). This reinforces the trend observed earlier, where cutting interval positively influences plant growth. Additionally, the fertilization levels at the 28-day cutting interval also showed significant differences, with the 200, 300, and 400 kg N ha−1 levels standing out compared to the other levels. This suggests that fertilization is a critical factor for the initial development of the plants.
Regarding the number of tillers, the values were similar for the 28-day and 56-day cutting intervals, indicating that tiller formation may be less sensitive to cutting intervals compared to plant height. In relation to dry matter production, the highest values were observed in the 56-day cutting interval. Furthermore, this interval also showed significant differences in fertilization levels, with the 400 kg N ha−1 level resulting in the highest DMP. These results emphasize the importance of the combination of cutting intervals and fertilization in maximizing forage production, suggesting that proper management can lead to more favorable outcomes in grass productive traits.

3.2. Soil Moisture, Biomass Allocation, and Changes in Leaf Investment

The soil moisture content was assessed, which recorded a value of 1.3% at the depth of 5 to 10 cm. Therefore, the moisture content in the soil was low, indicating the dry period of the region. This information is important because soil moisture can directly impact plant growth, influencing nutrient absorption and productive traits.
Regarding the different cutting intervals for the SPAD readings, an interaction was observed where the 56-day interval showed higher values of this variable compared to the 28-day cutting interval at 400 kg N ha−1 year−1 level (Figure 4).
During the evaluation period, significant differences in TFM were observed in the MG12 Paredão cultivar when fertilized with 300 kg N ha−1 of N at the 28-day cutting interval (Table 5). According to the biomass allocation, no differences were found between the treatments for DMR, DML, and DMS, both for fertilization levels and cutting intervals (Table 5). SLA did not show significant differences; however, a trend toward higher values was observed at the 28-day cutting interval (Table 5).

4. Discussion

These results indicate that the cutting interval and the amount of fertilization are crucial factors for the growth of MG12 Paredão grass, directly influencing the plant height, which may have implications for forage quality and productive traits, similar to results reported in another study by Barros et al. [13]. However, the response of M. maximus to N fertilization can vary depending on the cultivar used and the management practices employed.
According to the results from the first cut, N fertilization with doses of 200, 300, and 400 kg N ha−1 resulted in a significant increase in grass height. This is because N fertilization influences the management of plant cutting height. Another factor observed is that the dry matter at the 28-day cutting interval, with a dose of 400 kg N ha−1, provided a higher accumulation of dry matter. The higher DMP is likely related to both the N fertilization and the number of tillers. These results corroborate the results obtained by Reis et al. [18], who state that the MG12 Paredão cultivar presents flexibility regarding the timing of N fertilization. According to Reis et al. [18], N is responsible for plant traits such as leaf size, stem size, and the formation and development of tillers. Moreover, N fertilization significantly affects both forage growth and composition, reflecting in traits such as grass height, density, and nutritional quality [18]. N plays a crucial role in plant development, promoting higher biomass production and improving the forage nutritional value.
Regarding the second cut, performed during the rainy-to-dry transition period, which resulted in a reduction in the number of tillers and DMP, it is evident that the 28-day cutting interval favored tiller production (Table 3). When the rest period is too long, the grass does not feel the need to tiller continuously, unlike when it is subjected to frequent grazing [19]. In this case, the grass tends to produce more tillers in an attempt to survive. However, at the 56-day cutting interval the height favored DMP, as stated by Matsuda [12], who mentions that grazing should begin with plants at a height of 80 to 90 cm or with a maximum of 28 days of rest during the rainy season. This likely occurred because N is directly involved in the photosynthetic process as part of the chlorophyll molecules in addition to being a fundamental nutrient for the production of proteins and enzymes involved in the photosynthetic process and other proteins necessary for cell multiplication and expansion [20,21].
In the third cut, we observed that height influenced DMP, with the 56-day cutting interval showing higher height and consequently higher DMP, highlighting both height and DMP in the 400 kg N ha−1, where both presented their highest values. According to Luo et al. [22], temperature, water availability, soil fertility, and solar radiation are the most important factors determining the quantity and nutritional value of produced forage. Rainfall has a direct influence on grass regrowth, so during the dry period, regrowth occurs more slowly, resulting in a longer rest period for the grass to reach the ideal height and sufficiently produce leaves and dry matter. Another observation is that N fertilization had no significant effects during the dry season.
As per the results, N fertilization influences the number of tillers. However, Santos et al. [23] asserts that the characterization of individual tillers in deferred pastures also allows inferences about their structure and nutritional value. Therefore, it is possible to discriminate the effects of management practices used in deferred grazing and recommend the most efficient ones to obtain a deferred pasture with a structure predisposed to consumption, without compromising its persistence by reducing the number of tillers, as shown in the 400 kg N ha−1 fertilization from the first cut.
The 56-day cutting interval can be used as a strategy for deferred grazing, silage production, and forage reserves, as it involves forage accumulation. According to Fontaneli et al. [24], pasture deferral consists of selecting a specific pasture area on a property and prohibiting grazing. This allows for forage accumulation to be grazed during periods of scarcity, thereby minimizing the effects of forage production seasonality. Through pasture deferral, it is possible to reserve forage during the dry period and produce silage from the surplus forage during the rainy season.
The average SPAD-502 values allow for an indirect assessment of chlorophyll content in plant leaves, due to the close correlation between this variable and the levels of these pigments, as well as N in the leaves [25]. In fact, increasing N levels resulted in higher SPAD values in the cultivar and cuttings, with more prominence at the 56-day cutting interval (Table 5, Figure 3). Interestingly, increasing N levels did not result in significant increases in total fresh mass (Table 5), except for the 300 kg N ha−1 treatment at the 28-day cutting interval, which presented the highest value among levels and also compared to the 56-day cutting interval.
Plants maximize their biomass allocation among plant organs according to environmental factor variations, which may result in different strategies and better agronomic performance, especially in the long term. In this study, biomass allocation differences were more evident for the cutting intervals, with less investment in TFM but more investment in RDM at the 28-day compared to the 56-day cutting interval. Therefore, the 28-day cutting interval resulted in greater investment in the root system, which contributed to a strong trend for greater total fresh mass (Table 5). It is worth noting that investment in the root system is an important characteristic for cultivars that grow in environments with water limitations [8].
It is interesting to observe that there was a strong trend for higher SLA at the 28-day compared to the 56-day cutting interval (Table 5). This could be associated with a greater leaf area, since SLA is the amount of leaf area per unit of mass, which may have contributed to higher TFM. It is important to note that SLA generally correlates with leaf N content [5]; however, in this study, this correlation was not observed. These responses were probably more influenced by water availability, which also affects SLA [7].
Although our study provides important insights, some gaps still need to be addressed. For instance, future studies could include an analysis of annual precipitation patterns and their impact on forage growth, as well as the nitrogen content in plant biomass, to provide a more comprehensive understanding of nutrient dynamics. Additionally, investigating the long-term effects of fertilization on soil health, including parameters such as soil moisture, organic matter content, and microbial activity, would offer valuable insights into the sustainability of pasture management practices.

5. Conclusions

This study demonstrated that N fertilization had a significant effect on the DMP of MG12 Paredão, with the highest productive traits recorded at a dose of 400 kg N ha−1. Furthermore, the different N fertilization levels did not have a significant influence on the productive traits during the dry season, suggesting that other factors, such as water availability, may be more determinant during this period.
The cutting interval proved to be a determining factor for TFM, LDM, RDM, and SLA. The data showed that the cut performed at 28 days was more effective compared to the 56-day interval. SPAD values increased from 38.2 in the control group to 54, indicating that cutting interval may have a positive impact on grass development and productivity. This higher efficiency observed in the earlier cutting interval can be attributed to the better utilization of available resources and the stimulation of the plant’s vegetative growth, resulting in an increase in biomass accumulation and forage quality. Additionally, the 56-day cutting intervals resulted in higher plant height and, consequently, superior DMP. It can be stated that increasing N fertilization levels resulted in significant increases only in plant height, SPAD values, and the number of tillers.
In conclusion, this study highlights the importance of N fertilization in maximizing forage production, which is essential for livestock farming, especially in regions such as Maranhão, where the production of roughages plays a crucial role in animal nutrition. The results demonstrate that proper N application not only enhances the productivity of MG012 Paredão but also improves its structural traits, such as height and number of tillers.

Author Contributions

Conceptualization, T.C.R. and W.P.R.; methodology, V.L.P., A.S.M., D.H.G.C., L.C.A., K.S.P.A., T.C.R. and W.P.R.; validation, L.C.A., K.S.P.A., T.C.R. and W.P.R.; formal analysis, V.L.P., A.S.M., D.H.G.C., L.C.A., K.S.P.A., T.C.R. and W.P.R.; investigation, V.L.P., A.S.M., D.H.G.C., L.C.A., K.S.P.A., T.C.R. and W.P.R.; resources, W.P.R. and T.C.R.; data curation, L.C.A., K.S.P.A., T.C.R. and W.P.R.; writing—original draft preparation, V.L.P., A.S.M., D.H.G.C., L.C.A., K.S.P.A., T.C.R. and W.P.R.; writing—review and editing, V.L.P., A.S.M., D.H.G.C., L.C.A., K.S.P.A., T.C.R. and W.P.R.; visualization, L.C.A., K.S.P.A., T.C.R. and W.P.R. All authors have read and agreed to the published version of the manuscript.

Funding

This research was funded by Fundação de Amparo à Pesquisa e Desenvolvimento Científico do Maranhão (FAPEMA; grant number UNIVERSAL- 06622/22).

Data Availability Statement

The datasets used to support this study will be made available upon reasonable request. Requests should be sent to the corresponding author.

Acknowledgments

The authors would like to thank SINRURAL for lending an area for the experiment.

Conflicts of Interest

The authors declare no conflicts of interest.

Abbreviations

The following abbreviations are used in this manuscript:
CVCoefficient of variation
DMLDry mass of leaves
DMPDry matter production
DMRDry mass of roots
DMSDry mass of stems
IBGEBrazilian Institute of Geography and Statistics
LDMLeaf dry mass
MAluminum saturation
NNitrogen
OMOrganic matter of the soil
PVCPolyvinyl chloride
RDMRoot dry mass
SDMStem dry mass
SBSum of bases
SLASpecific leaf area
SPAD-502Soil–Plant Analysis Development
TFMTotal fresh mass
UEMASULUniversity of the Maranhão Tocantina Region
VBase saturation

References

  1. Moraes, D.A.; Moares, D.B.; Giacon, M.; Diogo, R. A Relação da Pecuária na Economia Brasileira; Repositório Institucional do Conhecimento do Centro Paula Souza (RIC-CPS): São Paulo, Brazil, 2021. [Google Scholar]
  2. Brasil. Ministério da Agricultura e Pecuária. Produção da Pecuária Nacional. 2023. Available online: https://www.gov.br/agricultura (accessed on 14 December 2024).
  3. Lavres, J., Jr.; Santos, J.D.G., Jr.; Monteiro, F.A. Nitrate reductase activity and spad readings in leaf tissues of guinea grass submitted to nitrogen and potassium rates. Rev. Bras. Ciênc. Solo 2010, 34, 801–809. [Google Scholar] [CrossRef]
  4. Witkowski, E.T.F.; Lamont, B.B. Leaf specific mass confounds leaf density and thickness. Oecologia 1991, 88, 486–493. [Google Scholar] [CrossRef] [PubMed]
  5. Garnier, E.; Cordonnier, P.; Giullerm, J.L.; Sonie, L. Specific leaf area and leaf nitrogen concentration in annual and perennial grass species growing in Mediterranean old-fields. Oecologia 1997, 111, 409–498. [Google Scholar] [CrossRef] [PubMed]
  6. Reich, P.B. Reconciling apparent discrepancies among studies relating life span, structure and function of leaves in contrasting plant life forms and climates: “the blind men and the elephant retold”. Funct. Ecol. 1993, 7, 721–725. [Google Scholar] [CrossRef]
  7. Wellstein, C.; Poschlod, P.; Gohlke, A.; Chelli, S.; Campetella, G.; Rosbakh, S.; Beierkuhnlein, C. Effects of extreme drought on specific leaf area of grassland species: A meta-analysis of experimental studies in temperate and sub-Mediterranean systems. Glob. Change Biol. 2017, 23, 2473–2481. [Google Scholar] [CrossRef] [PubMed]
  8. Freschet, G.T.; Valverde-Barrantes, O.J.; Tucker, C.M.; Craine, J.M.; Mccormack, M.L.; Violle, C.; Fort, F.; Blackwood, C.B.; Urban-Mead, K.R.; Iversen, C.M.; et al. Climate, soil and plant functional types as drivers of global fine-root trait variation. J. Ecol. 2017, 105, 1182–1196. [Google Scholar] [CrossRef]
  9. Costa, N.L. Formação, Manejo e Recuperação de Pastagens em Rondônia; Embrapa Rondônia: Porto Velho, Brazil, 2004; 212p. [Google Scholar]
  10. Lima, U.F.; Castro, L.M.O.; Pimentel, A.J.B.; Silva, J.L. Emergence of Megathyrsus maximus seedlings grown under salt stress. Rev. Agric. Neotrop. 2024, 11, e8266. [Google Scholar] [CrossRef]
  11. Silva, A.L.; Sayd, R.M. Levantamento e Descrição de Cultivares Forrageiras Utilizadas no Brasil; REAL—Repositório Institucional; ICESP: Brasilia, Brazil, 2023; Volume 2. [Google Scholar]
  12. Matsuda. Sementes MG 12 Paredão. Sementes Matsuda. 2022. Available online: https://www.matsuda.com.br/sementes-forrageiras/produto/mg12-paredao (accessed on 4 November 2022).
  13. Barros, L.F.; Araújo, L.C.; Andrade, K.S.P.; Mota, C.R.D.M.; Silva, A.M.; Ribeiro, A.L.; Rodrigues, W.P.; Rocha, T.C. Efeito dos dias de corte nas características morfológicas do Panicum maximum cv. Paredão com níveis de adubação nitrogenada no período da seca. Rev. Aracê 2024, 6, 13281–13294. [Google Scholar] [CrossRef]
  14. Zhang, K.; Zhai, C.; Li, Y.; Li, Y.; Qu, H.; Shen, Y. Effect of nitrogen application and cutting frequency on the yield and forage quality of alfalfa in seasonal cultivation. Agriculture 2023, 13, 1063. [Google Scholar] [CrossRef]
  15. Silva, F.C.; Eira, P.A.; Barreto, W.O.; Pérez, D.V.; Silva, C.A. Manual of Chemical Analysis Methods for Soil Fertility Evaluation; Embrapa CNPS: Rio de Janeiro, Brazil, 1998; Volume 56, p. 3. [Google Scholar]
  16. Gomide, C.A.M.; Paciullo, D.S.C.; Leite, J.L.B.; Resende, H. Panicum maximum cvs. Tanzânia e Mombaça para uso em Pastejo: Produção e Custo; Circular Técnica; Embrapa Gado de Corte: Juiz de Fora, Brazil, 2016; p. 7. [Google Scholar]
  17. Caputo, H.P.; Caputo, A.N. Mecânica dos solos e Suas Aplicações, 7th ed.; LTC: Rio de Janeiro, Brazil, 2017. [Google Scholar]
  18. Reis, M.B.; Araújo, L.C.; Santos, L.C.; Silva, A.M.; Ribeiro, A.L.; Silva, J.V.S.; Andrade, K.S.P.; Rocha, T.C. Influência dos dias de corte e níveis de adubação nitrogenada nas características morfológicas no Panicum maximum cv. Mombaça e cv. Paredão. Cad. Pedagóg. 2024, 21, e9719. [Google Scholar] [CrossRef]
  19. Motta, M.M.; Mota, L.G.; Melo, K.K.; Silva, P.R.; Santos, A.R.M.; Motta, L.J.M.; Cabral, C.H.A.; Cabral, C.E.A. Interval between defoliation and nitrogen fertilization of Panicum maximum cultivars. Bol. Ind. Anim. 2021, 78, 1–12. [Google Scholar] [CrossRef]
  20. Werner, J.C. Adubação de pastagens. Bol. Téc. 1986, 18. [Google Scholar]
  21. Araújo, L.M.B.; Andrade, A.L.; Rodrigues, B.H.N.; Santos, F.J.S.; Magalhães, J.A.; Rodrigues, R.C.; Oliveira, I.V.L. Produtividade do capim-Mombaça sob diferentes idades de rebrotação no Norte do Piauí. Nucleus 2019, 16, 233–244. [Google Scholar] [CrossRef]
  22. Luo, L.; Zhang, Y.; Xu, G. How does nitrogen shape plant architecture? J. Exp. Bot. 2020, 71, 4415–4427. [Google Scholar] [CrossRef] [PubMed]
  23. Santos, M.E.R.; Fonseca, D.M.; Euclides, V.P.B.; Ribeiro Júnior, J.I.R.; Balbino, E.M.; Casagrande, D.R. Valor nutritivo da forragem e de seus componentes morfológicos em pastagens de Brachiaria decumbens diferida. Bol. De Indústria Anim. 2008, 65, 303–311. [Google Scholar]
  24. Fontaneli, R.S.; Fontaneli, R.S. Qualidade e valor nutritivo de forragem. In Forrageiras ILPF—Integração Lavoura-Pecuária-Floresta, 1st ed.; Embrapa Trigo: Passos Fundo, Brazil, 2009; 28p. [Google Scholar]
  25. Soratto, R.P.; Carvalho, M.A.C.; ARF, O. Teor de clorofila e produtividade do feijoeiro em razão da adubação nitrogenada. Pesqui. Agropecu. 2004, 39, 895–901. [Google Scholar] [CrossRef]
Figure 1. A map indicating the geographical location of Imperatriz city, in the state of Maranhão, Brazil.
Nitrogen 06 00012 g001
Figure 2. Means of height under different nitrogen fertilization levels for M. maximus cv. MG12 Paredão. The dotted lines in the figure refer to the trend line for heights under different nitrogen fertilization levels.
Nitrogen 06 00012 g002
Figure 3. Mean percentages of leaf dry matter (LDM) under different nitrogen fertilization levels for M. maximus cv. MG12 Paredão. The dotted lines in the figure refer to the trend line for percentages of leaf dry matter under different nitrogen fertilization levels.
Nitrogen 06 00012 g003
Figure 4. Means of SPAD readings at different nitrogen fertilization levels and cutting intervals for M. maximus cv. MG12 Paredão. The dotted lines in the figure refer to the trend line for SPAD readings (28 days, 56 days) under different nitrogen fertilization levels.
Nitrogen 06 00012 g004
Table 1. The chemical analysis of the soil sampled from the 0–0.20 m layer.
Sorption ComplexSaturation of the Sorption Complex
pHOMPKCaMgAIH + AISBCTCVmCaMgK
CaCI2g/kgmg/dm3 cmol/dm3 %
4.613.83.80.081.940.590.003.242.615.8544.60.033.210.11.3
(OM) organic matter of the soil; (SB) sum of bases; (V) base saturation; (m) aluminum saturation.
Table 2. Mean values of the structural and productive traits of M. maximus cv. MG 12 Paredão in the first comparison at different nitrogen fertilization levels and cutting intervals.
Cutting DaysFertilization Levels (kg ha−1)CV (%)
Item 0100200300400
Grass height (m)280.325 Bb0.475 Bab0.550 Ba0.500 Ba0.500 Ba7.5
560.800 A0.950 A0.825 A0.875 A0.900 A
Number of tillers28108.062.062.580.091.035.8
5694.596.093.5101.059.5
Leaves (%)28100.0100.0100.0100.092.85.5
56100.0100.0100.090.4100.0
DMP (g)288000.04700.07400.06000.010600.0 A33.6
566700.08100.09100.011100.04300.0 B
% leaf: percentage of leaf; DMP: dry matter production; CV: coefficient of variation; means followed by different uppercase letters in the columns and lowercase letters in the rows are significantly different, while means without letters do not differ in the comparison of means, according to the Tukey test at a 5% probability level.
Table 3. The means of the structural and productive traits of M. maximus MG 12 Paredão in the second comparison at different nitrogen fertilization levels and cutting intervals.
Cutting DaysFertilization Levels (kg N ha−1)CV (%)
Item 0100200300400
Gass height (m)280.400 Bb 0.625 Bab0.750 Aa0.650 Ba0.650 Ba9.1
560.825 A0.975 A0.825 A0.925 A0.925 A
Number of tillers2832.5 b50.0 Aab51.5 Aab58.0 Aa56.0 Aa17.5
5626.024.5 B23.0 B37.5 B35.0 B
Leaves%28100.081.6100.083.7100.011.4
56100.0100.0100.0100.0100.0
DMP (g)282120.01440.01780.02160.0 B2380.024.0
561940.02300.02540.03540 A2560.0
% leaf: percentage of leaf; DMP: dry matter production; CV: coefficient of variation; means followed by different uppercase letters in the columns and lowercase letters in the rows are significantly different, while means without letters do not differ in the comparison of means, according to the Tukey test at a 5% probability level.
Table 4. The means of the structural and productive traits of M. maximus cv. MG 12 Paredão in the third comparison at different nitrogen fertilization levels and cutting intervals.
Cutting DaysFertilization Levels (kg N ha−1)CV (%)
Item 0100200300400
Grass height (m)280.400 Bb0.375 Bb0.425 Bab0.525 Ba0.425 Bab5.7
560.800 Ab0.875 Aab0.850 Aab0.875 Aab0.925 Aa
Number of tillers2890.075.084.598.5103.521.8
5694.0116.096.590.096.5
Leaves (%)28100.0100.0100.0100.0100.00.0
56100.0100.0100.0100.0100.0
DMP (g)281400.0 B1400.0 B1000.0 B1200.0 B1100.0 B24.0
565800.0 Aab4300.0 Ab5220.0 Ab5760.0 Aab8100.0 Aa
% leaf: percentage of leaf; DMP: dry matter production; CV: coefficient of variation; means followed by different uppercase letters in the columns and lowercase letters in the rows are significantly different, while means without letters do not differ in the comparison of means, according to the Tukey test at a 5% probability level.
Table 5. Total fresh mass (TFM); SPAD reading; biomass allocations for dry mass of leaf (DML), dry mass of roots (DMR), and dry mass of stem (DMS); and specific leaf area (SLA) of M. maximus cv. MG12 Paredão at different nitrogen fertilization levels and cutting intervals.
Cutting DaysFertilization Levels (kg N ha−1)AverageCV (%)
Item 0100200300400
TFM (g)28290.00 ns286.25 ns327.50 ns697.57 a306.25 ns381.50 ns43.83
56287.50 ns375.00 ns379.50 ns423.75 b316.25 ns356.40 ns
SPAD-5022830.23 ns27.85 ns32.60 ns30.45 ns26.90 b29.6 ns19.83
5624.95 ns25.33 ns27.08 ns22.88 ns37.48 a27.54 ns
DML %2822.00 ns16.25 b18.75 ns20.50 ns25.75 ns20.65 ns26.39
5614.50 ns27.25 a25.25 ns26.75 ns25.00 ns23.75 ns
DML %2852.00 ns51.75 ns53.75 ns51.25 ns48.25 ns51.40 ns27.19
5655.25 ns41.75 ns42.50 ns46.75 ns43.00 ns45.85 ns
DMS %2826.00 ns32.00 ns27.00 ns28.50 ns26.00 ns27.90 ns37.39
5630.25 ns30.50 ns31.75 ns26.50 ns31.75 ns30.15 ns
SLA (cm2 g−1)2882.19 ns80.63 ns83.95 ns69.86 ns85.89 ns80.50 ns69.76
5667.76 ns62.73 ns60.96 ns63.41ns64.50 ns63.87 ns
Lowercase letters compare systems in the columns according to the Tukey test at a 5% probability level. ns = not significant.
Disclaimer/Publisher’s Note: The statements, opinions and data contained in all publications are solely those of the individual author(s) and contributor(s) and not of MDPI and/or the editor(s). MDPI and/or the editor(s) disclaim responsibility for any injury to people or property resulting from any ideas, methods, instructions or products referred to in the content.

