Article

N Losses from an Andisol via Gaseous N2O and N2 Emissions Increase with Increasing Ruminant Urinary–N Deposition Rate

by
Magdalena A. Ramírez-Sandoval
1,2,
Nadine Loick
3,*,
Dante E. Pinochet
2,
Maria López-Aizpun
3,
M. Jordana Rivero
3 and
Laura M. Cárdenas
3
1
Graduate School, Faculty of Agricultural Sciences, University Austral of Chile, Campus Isla Teja, Valdivia 5090000, Chile
2
Institute of Agricultural Engineering and Soils, Faculty of Agricultural Sciences, University Austral of Chile, Campus Isla Teja, Valdivia 5090000, Chile
3
Rothamsted Research, Net Zero and Resilient Farming, North Wyke, Okehampton EX20 2SB, UK
*
Author to whom correspondence should be addressed.
Nitrogen 2024, 5(2), 254-265; https://doi.org/10.3390/nitrogen5020017
Submission received: 6 February 2024 / Revised: 14 March 2024 / Accepted: 18 March 2024 / Published: 22 March 2024

Abstract

:
Agricultural soils account for about 60% of the global atmospheric emissions of the potent greenhouse gas nitrous oxide (N2O). One of the main processes producing N2O is denitrification, which occurs under oxygen-limiting conditions when carbon is readily available. On grazed pastures, urine patches create ideal conditions for denitrification, especially in soils with high organic matter content, like Andisols. This lab study looks at the effects of Urine-urea-N load on the Andisol potential to emit N2O. For this, we investigated the effects of three levels of urea-N concentrations in cow urine on emissions of N2O, N2, and CO2 under controlled conditions optimised for denitrification to occur. Results show total N2O emissions increased with increasing urine-N concentration and indicate that denitrification was the main N2O-producing process during the first 2–3 days after urine application, though it was most likely soil native N rather than urine-N being utilised at this stage. An increase in soil nitrate indicates that a second peak of N2O emissions was most likely due to the nitrification of ammonium hydrolysed from the added urine, showing that nitrification and denitrification have the potential to play a big part in N losses and greenhouse gas production from these soils.

1. Introduction

Nitrogen (N) dynamics have been widely studied, particularly for managed grazed pasture systems [1,2,3,4,5]. In a grassland’s soil–plant–animal system, numerous processes are involved in the N-cycle, with many inputs and outputs. Nitrogen can enter the system via the atmosphere or through amendment applications (organic or inorganic fertilisers), be taken up by the plant, and leave the system through leaching, removal of plant or animal material, or in gaseous forms via the atmosphere. How N moves through soil–plant–animal systems is determined by physical, biological, and chemical processes [6,7,8,9].
In soil, N can be transformed via various processes, such as nitrification or denitrification. The nitrification process oxidises ammonia/ammonium (NH3/NH4+) to nitrite (NO2), during which nitrous oxide (N2O) and nitric oxide (NO) can be released. NO2 is then further oxidised to nitrate (NO3) [8]. Denitrification is the reduction of nitrate (NO3) to gaseous nitrogen (N2) via nitrite (NO2), nitric oxide (NO), and nitrous oxide (N2O) [10]. While nitrification requires oxygen, denitrification occurs under the absence/limitation of oxygen by mainly facultative anaerobic bacteria that couple nitrate (NO3) reduction with organic carbon (Corg) oxidation [10,11,12]. Denitrification is of particular concern because N2O is an obligatory intermediate, which often represents the final stage of an incomplete denitrification process [10]. Nitrous oxide is a potent greenhouse gas (GHG) with a global warming potential 265–298 times greater than carbon dioxide (CO2) over a 100-year horizon [13]. Agricultural soils are a dominant source of N2O and account for about 60% of the atmospheric N2O emissions globally [13,14,15].
A reduction in O2 availability in the soil can result from an increase in soil moisture when liquid replaces air in pore spaces [16] which can be of particular concern in a changing climate that results in higher and/or more intense rainfall events. In a soil–plant–animal system, denitrifying conditions (low O2 availability resulting from increased soil moisture, high N input, and sufficient carbon (C) supply) are created where animal excreta are deposited [17]. Between 75 and 90% of the N consumed in animals’ diets is excreted in the form of dung and urine [18], where over 70% of urine-N is in the form of urea, with the rest being in the form of amino acids and peptides [1]. The frequency of urine excretion for dairy cows is 7–12 times per day [3,19,20], with an average urination volume of 1.5–3.5 L, resulting in a total production of 12–42 L of urine per day, with an estimated N concentration of 2–15 g N L−1. In all instances, urine excretion causes extremely high rates of N output. Urine patches can affect an area of 0.2–0.5 m2 [1] and may be equivalent to an input of >50 g N m−2 and, in some cases, up to 100 g N m−2 [21].
The effects of soil type, including its organic matter (OM) content and microbial activity, on soil N transformation processes, such as nitrification and denitrification, resulting in N emissions, have been reported [22,23]. Andisols are soils formed on volcanic ash and are characterised by high porosity, low bulk density, high water holding capacity, and an ability to accumulate organic matter [24,25]. The Andisols of Southern Chile have a high OM concentration of >10% [26] and studies of N emissions have so far focused on the use of N fertilisers and slurry application [27]. Results of those studies identify NH3 volatilisation as the main pathway for N losses from these soils [27,28], with a low contribution of N2O [29,30]. However, with beef production systems and pasture areas in Chile increasing [31], N2O emissions caused by grazing animals are becoming more important.
With NH3 volatilisation having been identified as the main pathway for N losses [32], other N-loss processes have been overlooked. There is currently no evidence evaluating N2O and N2 emissions from cow urine patches under different N concentration rates in Andisols from southern Chile. In this study, we aim to understand the potential of an Andisol to emit N2O from incomplete denitrification by investigating the effect of the application of cow urine with increasing N concentrations on the N2O/(N2O + N2) ratios and resulting CO2 emissions under controlled conditions using the gas-flow-soil-core technique [33]. The ratios will be compared with a zero-N control treatment. We hypothesise that at higher N application rates, larger N2O/(N2O + N2) ratios occur due to incomplete denitrification. With this study, we aim to provide mechanistic data to be incorporated into models as well as to help in making decisions on treatments for larger-scale experiments to ultimately determine more specific emission factors for grazed pastures on Andisol soils in Chile.

2. Materials and Methods

2.1. Soil Sampling and Preconditioning

The soil was collected in March 2019 from a natural polyphytic grassland located in southern Chile (Valdivia series, Andisol, Typic Hapludands; 39°47′10 S 73°13′ W; see Table 1 for physical and chemical characteristics). The climatic conditions for the soil sampling area from 2017 to 2019 were as follows: average annual temperature fluctuated between 10.4 and 11.6 °C, with rainfall between ~1500 and ~2300 mm per year during the summer season (Dec–Feb). The temperature ranged from 12 to 30 °C, with long periods without rain. Climatic data were collected with a weather station located in the Estación Experimental Agropecuaria Austral (EEAA, Red Agrometeorológica del Instituto de Investigaciones Agropecuarias, INIA, Valdivia, Chile, 2021).
Spade-cut squares (20 × 20 cm to a depth of 15 cm) of soil were taken from 10 locations along a ‘W’ line across a field of 1200 m2 size. After sampling, the soil was dried at ambient temperature to 30–40% moisture content (dry basis), and roots and plant residues were removed. In order to concentrate on treatment effects rather than the natural variability of the soil, the soil was homogenised to optimise the response to each N application rate by sieving to <2 mm and mixing well before being used for further analysis and soil core packing. Samples were stored at 4 °C before sending to the UK to be packed into cores for the incubation study.

2.2. Urine Collection and Preparation

Urine was collected the day before treatment application from Taw River Dairy, Westacre, Sampford Courtenay, Okehampton, UK, from silage-fed Jersey dairy cows during morning milking from at least seven different cows. After collection, urine was bulked and stored in 5 L tight sealed plastic containers below 4 °C to avoid urine hydrolysis. Three urine subsamples were taken and analysed for total N and C using a Shimadzu TOC/TN analyser (Shimadzu UK Ltd., Milton Keynes, UK). Cow urine contained 2.89 ± 0.04 g L−1 total N and 12.4 ± 0.04 g L−1 total organic C.

2.3. Experimental Setup

One way to determine denitrification as an occurring process is the detection of N2, which can only be produced in soil via this process. Because of the high background concentration of N2 under ambient conditions, this incubation was carried out using the DENitrification Incubation System (DENIS), a specialised gas-flow-soil-core incubation system [33], at Rothamsted Research North Wyke, UK, which allows the replacement of the natural atmosphere by a helium (He)/Oxygen (O) one. The experiment comprised four treatments with three replicates each. A total of 13 cores (one for soil analysis before starting the incubation and 12 for the incubation experiment) were packed with the sieved soil to a bulk density of 0.65 g cm3 (simulating the in situ soil bulk density) into stainless steel rings to a height of 7.5 cm with an internal diameter of 14 cm. To investigate the denitrification potential of the soil, conditions were optimised to promote denitrification by adjusting the soil moisture so that 85% water-filled pore space (WFPS) would be reached after amendment addition [34,35,36]. Following this, one core was used for the soil analysis before starting the incubation, and the remaining twelve were placed in the incubation system.
In order to measure N2 fluxes, the native atmosphere was removed. To remove the N2 from the soil matrix, the soil cores were flushed with a mixture of He:O2 (80:20) at a flow rate of 30 mL min−1 for 4 days from the bottom through the soil core (flow-through mode). Flow rates were then decreased to 12 mL min−1, and the flow was redirected over the surface of the soil core for 6 h before amendment application. The N2 concentrations from the vents of the vessels were very small (99% of the N2 was removed from the system), and the maintenance of these low N2 concentrations indicated that N2 had been removed from the soil matrix and that it was not diffusing from the soil. Oxygen was kept in the gas mixture at atmospheric levels as the objective was to investigate denitrification achieved by high WFPS/urine instead of forcing anaerobic conditions by preventing any O2 diffusion. The incubation was carried out in a controlled temperature cabinet at 20 °C containing the incubation chambers.
The four treatments of this experiment comprised different urine-N concentrations: 0N (N free water); 25N (4.20 ± 0.05 g N L−1 of urine = 24 g N m−2); 50N (7.98 ± 0.18 g N L−1 of urine = 45.6 g N m−2); 100N (15.83 ± 0.09 g N L−1 of urine = 90.5 g N m−2). To achieve the target N rates for all the treatments, the natural concentration of N in the urine was adjusted by adding urea powder (CO(NH2)2, 98% purity). Deionised water was used as 0N treatment. For each core, the volume of the amendment applied was 87 mL, equivalent to applying 2 L of urine to an area of 0.35 m2, calculated based on field conditions. The amendments were added to the twelve cores packed with the homogenised soil in a completely randomised design. After amendment application, the cores were incubated under the previously described conditions for a further 35 days.

2.4. Gas Analyses and Data Management

Emissions from cores were measured sequentially, with gas samples being taken every 8 min resulting in measurements every 96 min for each core. Fluxes of N2O and CO2 were quantified using a Perkin Elmer Clarus 500 gas chromatograph (GC; Perkin Elmer Instruments, Beaconsfield, UK) equipped with an electron capture detector (ECD) for N2O. Emissions of nitrogen gas (N2) were measured by GC with a helium ionisation detector (HID, VICI AG International, Schenkon, Switzerland) [33]. All gas concentrations were corrected for flow rate through the vessel, which was measured daily, and fluxes were calculated on a g N or C m−2 d−1 basis.
Cumulative emissions of N2O were calculated over the whole incubation period (day 0 to day 35). Data analysis showed that the amendment solution contained some atmospheric N2 as well as CO2, which was quickly flushed out of the system but resulted in initial N2 and CO2 peaks with amendment application. Those peaks quickly dropped to background levels. Cumulative CO2 and N2 emissions, as well as N2O/(N2O + N2) ratios, were therefore determined from day 0.5 onwards.
Cumulative emissions of N2O, N2, and CO2 were calculated from the area under the curve after linear interpolation between sampling points for the whole experimental period.

2.5. Soil Analysis

Physical and chemical soil characteristics, as presented in Table 1, were determined in triplicate using a subsample of the bulked and homogenised soil obtained from the field and analysed by the Institute of Agricultural and Soil Engineering laboratory at the Universidad Austral de Chile.
Soil samples from cores packed for the incubation experiment were taken at the beginning and end of the incubation to determine the initial and final moisture contents, mineral N (NH4+ and NO3), and soil organic carbon (SOC) concentrations. In the final sampling of the incubation, each core was divided into halves to separate the top (0–3.8 cm soil depth) section from the bottom (3.8–7.5 cm soil depth) section to allow analysis of potential redistribution of nutrients within the soil. Soil NH4+ and total oxidised nitrogen (TON: NO3 + NO2) were analysed by automated colourimetry from 2M KCl soil extracts using a Skalar SANPLUS Analyser (Skalar Analytical B.V., Breda, The Netherlands) (Searle, 1984). As nitrite (NO2) is thought to accumulate very rarely in nature and has been shown to rapidly mineralise in soil [37,38,39,40], it is assumed that TON is nearly exclusively made up of nitrate (NO3). Total SOC was analysed from 0.05 M K2SO4 extractions [41] by Shimadzu Total Organic Carbon Analyser TOC-L Series (Shimadzu UK Ltd., Milton Keynes, UK), and WFPS was calculated from soil moisture contents by drying a subsample (50 g) at 105 °C overnight, using the known particle size density for the Andisol and the bulk density of the packed cores.

2.6. Statistical Analysis
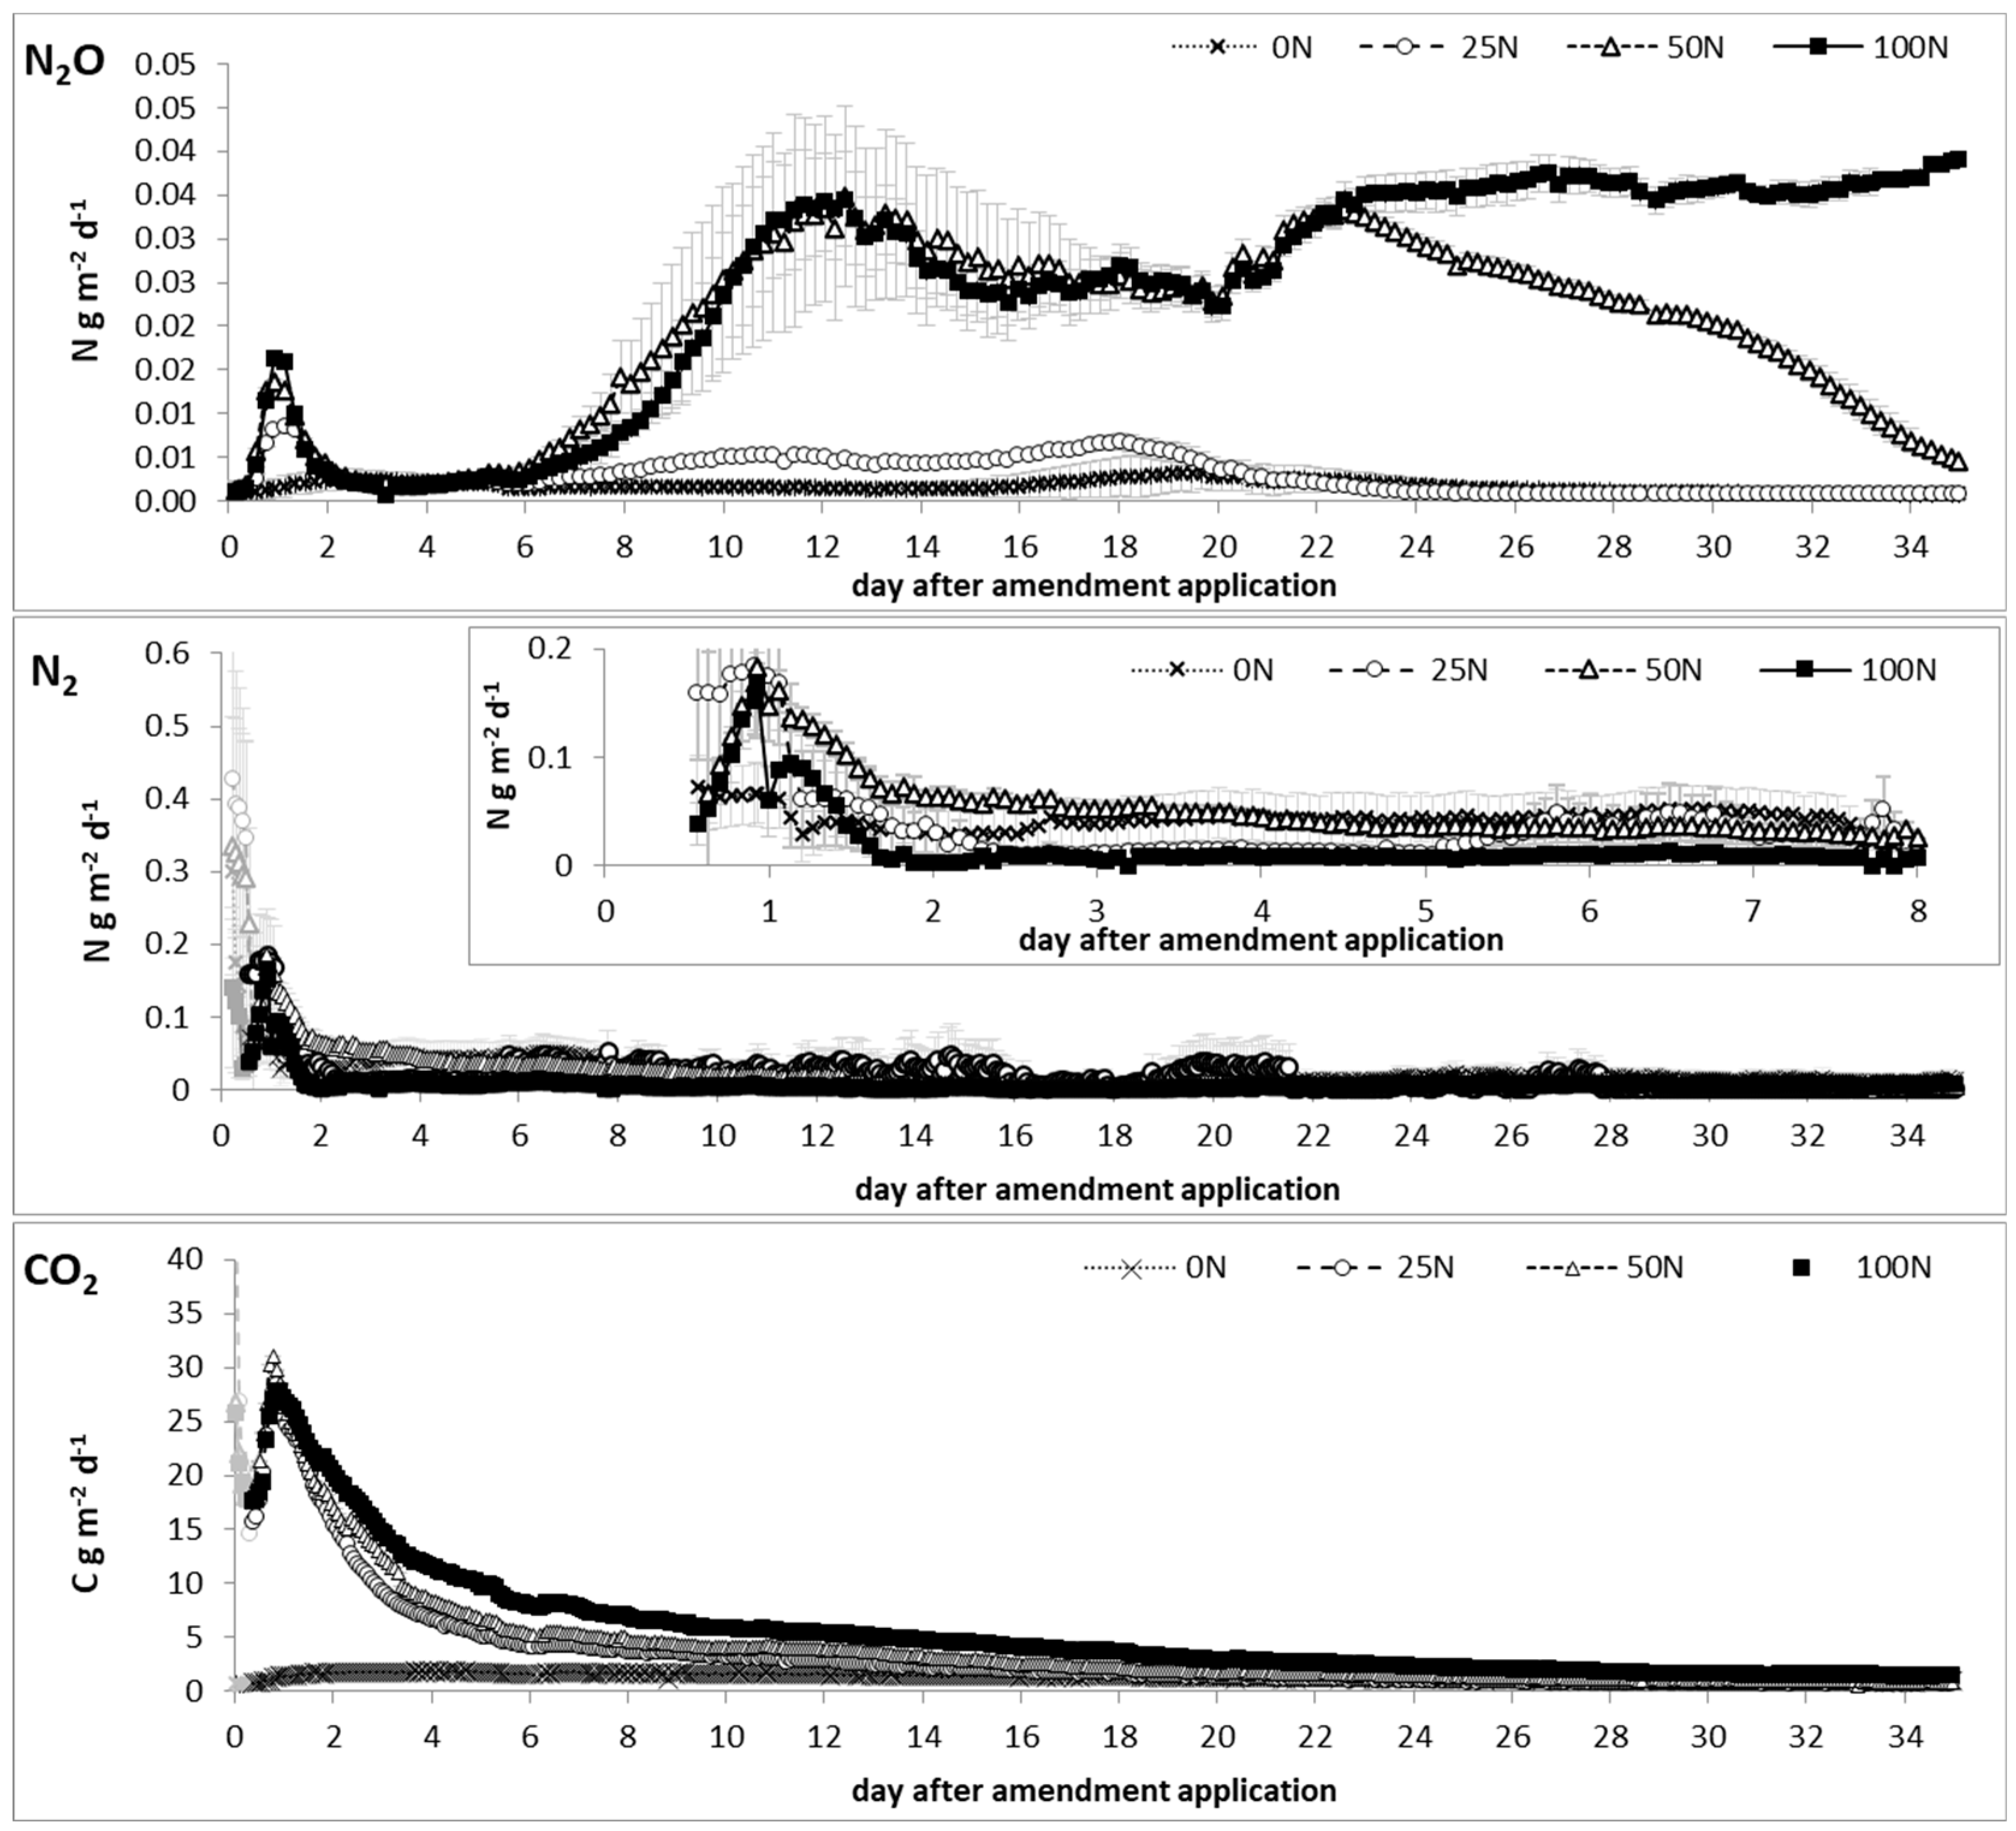
Differences in total emissions for each gas measured between treatments, as well as differences in soil characteristics between treatments of soil cores before and after incubation, were assessed by an ANOVA with 5% significance. The normal distribution of the residuals and homoscedasticity was tested using the Kolmogorov–Smirnov test and Levene test, respectively, and the Tukey HSD Test was used as a post hoc test for means separation. Statistical analysis was performed using GraphPad Prism 5 and GenStat 16th edition (VSN International Ltd., Hemel Hempstead, UK).

3. Results

3.1. Gaseous Emissions

Nitrous oxide fluxes (Figure 1) started to increase immediately after amendment application and showed a short, small peak of emissions with maximum average fluxes of 0.008, 0.014, and 0.016 g N m−2 d−1 for 25N, 50N, and 100N, respectively, at day 1 before decreasing again to a minimum under 0.0025 g N m−2 d−1 where they remained until day 6. All but the N0 treatment showed another increase in N2O fluxes from day 6. In the 25N treatment, N2O fluxes increased to about 0.005 g N m−2 d−1 (day 18) before declining on day 19 and reaching levels similar to 0N. Treatments 50N and 100N showed a second, much larger than the first peak, reaching mean fluxes of 0.035 g N m−2 d−1 on day 12 and lasting for 10 days, after which emissions declined in the 50N treatment, while the 100N treatment remained high with the indication of a slight increase until the end of the incubation with fluxes around 0.040 g N m−2 d−1.
The pattern of N2 fluxes (Figure 1) was very similar in all treatments, showing high emissions immediately after amendment application, which decreased rapidly within the first 16 h. All but the 0N treatment showed a subsequent peak in N2 fluxes of 0.17 to 0.18 g N m−2 d−1, decreasing to fluxes of around 0.009 g N m−2 d−1 for treatments 25N and 100N by day 2, while treatment 50N only dropped to levels of 0.06 before decreasing slowly and reaching similar levels by day 13.
Carbon dioxide emissions increased immediately after amendment application (Figure 1), reaching maximum average fluxes of 27.5, 31.0, and 26.8 g C m−2 d−1 for 25N, 50N, and 100N treatments, respectively, after the first day of incubation. Fluxes decreased gradually over the course of the incubation, reaching values below 2 g C m−2 d−1 by the end of the experimental period. The 0N treatment showed fluxes between 0.9 and 1.9 g C m−2 d−1 during the 35 days of incubation.
Cumulative emissions over the course of the experiment (Table 2) show that losses of N via N2O emissions increased with increasing N concentration and were nearly 2 times higher in 25N, 12 times higher in 50N, and 15 times higher in 100N than in the control treatment (0N). Contrary to this, cumulative emissions of N2 were similar in treatments 0N, 25N, and 50N but significantly lower in 100N. This is reflected in the ratios of N2O/(N2O + N2) increasing with increasing N concentrations in the treatments.

3.2. Soil Chemistry

Before amendment application, 58.8 mg TON-N and 9.6 mg NH4+-N was available per kg dry soil throughout each core. As amendments were applied to the top of the core, these values were assumed to initially remain the same for the bottom half of the cores, while the combined available N (TON-N, NH4+-N, and urine–N) in the top half of the cores increased to 1.13, 2.15, and 4.26 g kg−1 dry soil in the treatments 25N, 50N, and 100N, respectively. Table 3 shows the results of the final soil analysis after 35 days of incubation. With the exemption of treatment 50N for TON and 100N for NH4+, no differences in TON or NH4+ concentrations could be detected between the top and bottom of cores. Between treatments, the concentrations of TON showed a significant increase with increasing urine–N concentration, being lowest and not significantly different from the pre-amendment concentrations in the 0N treatment and highest in 100N. Concentrations of NH4+ were only significantly increased in the 100N treatment, while they remained similar to starting conditions in the other treatments.
Soil organic carbon (SOC) did not show any significant differences between the soil before amendment application and after the 35-day incubation period. However, the 50N treatment showed a significantly lower SOC concentration in the top half of the core than treatments 25N and 100N, while the bottom halves remained unchanged (Table 3).
Soil moisture after amendment application was at 90.6%, equivalent to a WFPS of 85%. By the end of the experiment, the moisture contents in all vessels were similar to the ones before the amendment application. Only treatments 0N and 50N showed a difference between the top and the bottom of the core, with the moisture content at the top being ~4% higher (Table 3).

4. Discussion

Emissions of CO2 and N2O increased with the increased rate of N applied, as was expected. The very low emissions of the 0N treatment suggest that the emissions of the measured gases in the treatments receiving urine were almost exclusively a result of the amendment application, through the utilisation of the applied N and/or through stimulation of the microbial community enabling it to utilise native soil N. The first peak of N2O emission on day 1 after starting the incubation was most likely due to denitrification of the NO3 native to the soil, which is supported by findings in other studies [5,42]. At this stage, denitrification would have been the promoted process due to the high WFPS of the soil, resulting in anaerobic sites [43,44] and the addition of readily available C via the urine [10,45]. This is also supported by the appearance of an N2 peak lasting from about day 0.6 to 1.2 shortly after the N2O peak.
The N2O/(N2O + N2) ratios can be used to estimate to what degree the denitrification process is completed to N2. In this experiment, the ratio was calculated for the initial period (day 0.5–3, Table 2), where we believe denitrification was the dominant N2O-producing process. The ratios were highly variable within each treatment and did not show any significant differences between the treatments, indicating that there was no influence of the urine N load on the completeness of the denitrification process at this stage.
Soil moisture analysis showed that over the course of the experiment, the WFPS decreased from 85% to around 75%. This resulted in drier and, therefore, more oxygenated areas within the soil, providing conditions suitable for nitrification. When urea is applied to soil, the enzyme urease rapidly breaks it down into ammonia and carbonic acid. In the soil, NH3 can react and bind with soil fractions such as organic matter and react with water to form NH4+ [46], which can then be nitrified. Several studies have shown that the nitrification process begins immediately after the application of the urine to the soil [5,45,47,48,49] and the large increase in TON measured in the soil at the end of the experiment (between 10 and 30 times more than before amendment application), indicates that nitrification was one of the major soil processes during the experiment, especially as there was no further N2 observed after the initial peak. The second N2O peak from the two highest N treatments, which started from day 6 after urine application, is, therefore, most likely the result of nitrification of the nitrified N from the hydrolysed urea. Second peaks like this have been observed from the application of nitrogen fertilisers in other studies [42,50]. There is the potential, however, that some of the measured N2O originated from denitrification of the produced nitrate, taking place in anaerobic sites where microbial respiration increases and O2 is being extinguished, promoting denitrification from NO3 [51].
During the incubation, the pattern and amount of N2O emission in the 50N and 100N treatments were practically the same until day 22 of the incubation. Other studies have found an inhibition of nitrification at high N application rates [5,43,52], which could explain the results of the 100N treatment in our study. The initially similar behaviour of the 50N and 100N treatments could indicate that the volcanic soil used in this study might have reached its maximum capacity for N mineralisation, denitrification, and immobilisation by soil microorganisms at a rate below 50 N g m−2. This could explain the relatively high N2O emissions from day 11 to 22, after which readily available NH4+ becomes depleted, resulting in decreasing N2O emissions from nitrification in the 50N treatment, while the substrate is still available in the 100N treatment, resulting in continued higher N2O emissions. Soil analysis at the end of the incubation showed that NH4+ concentrations were similar to those before amendment application for all but the 100N treatment, further supporting the theory that nitrification was still happening within this treatment.
Cumulative N2O emissions in this study were neither significantly different between 0N and 25N treatments nor between 50N and 100N treatments, but there were differences between both groups. Similar results were reported by Selbie et al. [53], where the cumulative emission of N2O from pasture over sandy loam amended with urine treatments of 300 and 500 kg N ha−1 (30 and 50 g N m−2) vs. 700 and 1000 kg N ha−1 (70 and 100 g N m−2) which resulted in cumulative N2O emissions of around 1.7 and 3.7 kg N ha−1, respectively, over an 80-day period. However, N2O emissions in our study were still high in the 100N treatment by the end of the experiment, which was shorter than the Selbie et al. [53] study. We are, therefore, not able to estimate the final cumulative emissions from this treatment.
The ratios of applied N lost as N2O for the 25N and 50N treatment were 0.17 ± 0.02% and 1.39 ± 0.20% of the applied urine N, respectively. In a review by Oenema et al. [19] the authors reported that emissions of N2O from animal urine deposited on grassland range from 0.1 to 3.8% of the excreted N. Clough et al. [43] performed an incubation applying urine at similar rates to our study. Although their experiment stopped after 21 days while the second N2O peak was still occurring, they reported that under a rate of 250, 500 and 1000 kg N ha−1 (25, 50 and 100 g N m−2), losses were 2.4, 3.2, and 0.5% of the applied N, which was already higher than the values in our study. The relatively low losses of applied N via N2O emissions in our study can partly be explained by the high amount of organic matter in the soil. The content of SOC plays a critical role in determining the N2O emission response from urea deposition. Soil with a high organic matter content, such as the one used in this study, has a higher cation exchange capacity, reducing the concentration of available NH4+ in the soil solution due to adsorption by soil colloids, which in turn leads to the reduction of NO3, thus reducing N2O emissions derived from urea [54]. Moreover, denitrification is a microbial process requiring an electron donor such as C, which is contained within the soil as well as being added with the urine amendments. Carbon dioxide emissions are a measure of biological activity and are often used to indicate microbial activity or respiration [55]. Overall, emissions of CO2 increased with increasing urine-N concentration.
Cumulative N2 emissions, the majority of which were emitted within the first 2 to 3 days of the experiment, were very variable in treatments 0N and 25N, averaging to values similar to those in the 50N treatment, while the 100N treatment showed less than half of those emissions. The N2 emissions indicated denitrification occurred in the first 2 to 3 days of the experiment, but the fact that the highest N treatment had the lowest emissions suggests that there could have been a toxic effect on the microbial population at these very high N rates, inhibiting the reduction of N2O to N2 which would need further investigation.

5. Conclusions

We hypothesised that the contribution denitrification can make to N losses from an Andisol will depend on the soil N input rate. The experiment was set up to provide conditions ideal for denitrification, and as expected, our results showed that denitrification was the main contributor during the first three days. However, N losses attributed to this process were still low and only increased from 0 over 25 to 50 g N m−2 application rates, while no further increase was detected when the rate was increased from 50 to 100 g N m−2. Additionally, it seems most likely that gaseous N emissions are the result of the added moisture and readily available C enabling microorganisms to utilise soil nitrate and thereby directly affecting soil fertility, rather than due to the utilisation of the added amendment-N. With the moisture content of the soil decreasing from 85 to 75% WFPS over the course of the 35-day experiment, results suggest that nitrification or nitrifier denitrification was the main N2O-producing process afterwards.
Our results showed total N2O emissions increasing with increasing urine–N concentration and amounting to over 0.85 g N2O-N m−2, indicating that there is the potential that grazed Andisols can be a source of N2O. As these are emissions from urine applications, the overall contribution of this source to total GHG emissions under natural grazing and field conditions will depend highly on stocking rates and grazing times. This study provides a first insight into the potential of different GHG-producing processes occurring in Andisols. As this study was set up to look specifically at the potential effects of urine–N load on Andisol soil, the soil itself had been homogenised and kept under controlled conditions, therefore eliminating any natural variability. To evaluate the importance of these types of soils to national and global GHG emissions, further studies are needed, especially on the field scale, to investigate environmental and management effects, such as pasture types, grazing animals, climate, etc., and take natural variabilities such as soil structure and microbial loads into account. This will hopefully lead to the development of more accurate Emission Factors and potential mitigation strategies.

Author Contributions

Conceptualization, M.A.R.-S., N.L., D.E.P., M.L.-A., M.J.R. and L.M.C.; methodology, M.A.R.-S., N.L. and L.M.C.; validation, N.L. and L.M.C.; formal analysis, M.A.R.-S., N.L., D.E.P. and L.M.C.; investigation, M.A.R.-S., N.L. and M.L.-A.; resources, D.E.P., M.J.R. and L.M.C.; data curation, M.A.R.-S. and N.L.; writing—original draft preparation, M.A.R.-S. and N.L.; writing—review and editing, N.L., D.E.P., M.L-A., M.J.R. and L.M.C.; visualization, M.A.R.-S. and N.L.; supervision, N.L., D.E.P., M.J.R. and L.M.C.; project administration, M.A.R.-S., N.L. and L.M.C.; funding acquisition, D.E.P., M.J.R. and L.M.C. All authors have read and agreed to the published version of the manuscript.

Funding

This research was funded by the UK Biotechnology and Biological Sciences Research Council (BBSRC) as part of Rothamsted Research’s Institute Strategic Programme Soil to Nutrition (BBS/E/C/000I0310, BBS/E/C/000I0320). The doctoral studies of Magdalena A. Ramírez-Sandoval and support for her internship at Rothamsted Research were funded by The Agencia Nacional de Investigación y Desarrollo (ANID; Scholarship N° 21160644).

Data Availability Statement

The raw data supporting the conclusions of this article will be made available by the authors upon request.

Acknowledgments

Our thanks go to Okanlade Lawal-Adebowale for his help with the lab work.

Conflicts of Interest

The authors declare no conflicts of interest.

References

  1. Haynes, R.J.; Williams, P.H. Nutrient Cycling and Soil Fertility in the Grazed Pasture Ecosystem. In Advances in Agronomy; Sparks, D.L., Ed.; Academic Press: Cambridge, MA, USA, 1993; pp. 119–199. [Google Scholar]
  2. Ledgard, S.F.; Sprosen, M.S.; Penno, J.W.; Rajendram, G.S. Nitrogen fixation by white clover in pastures grazed by dairy cows: Temporal variation and effects of nitrogen fertilization. Plant Soil 2001, 229, 177–187. [Google Scholar] [CrossRef]
  3. Bolan, N.S.; Saggar, S.; Luo, J.; Bhandral, R.; Singh, J. Gaseous Emissions of Nitrogen from Grazed Pastures: Processes, Measurements and Modelling, Environmental Implications, and Mitigation. In Advances in Agronomy; Academic Press: Cambridge, MA, USA, 2004; pp. 37–120. [Google Scholar]
  4. Saggar, S.; Luo, J.; Kim, D.-G.; Jha, N. Intensification in Pastoral Farming: Impacts on Soil Attributes and Gaseous Emissions. In Soil Health and Climate Change; Singh, B.P., Cowie, A.L., Chan, K.Y., Eds.; Springer: Berlin/Heidelberg, Germany, 2011; pp. 207–236. [Google Scholar]
  5. Somers, C.; Girkin, N.T.; Rippey, B.; Lanigan, G.J.; Richards, K.G. The effects of urine nitrogen application rate on nitrogen transformations in grassland soils. J. Agric. Sci. 2019, 157, 515–522. [Google Scholar] [CrossRef]
  6. Moreau, D.; Bardgett, R.D.; Finlay, R.D.; Jones, D.L.; Philippot, L. A plant perspective on nitrogen cycling in the rhizosphere. Funct. Ecol. 2019, 33, 540–552. [Google Scholar] [CrossRef]
  7. Kuypers, M.M.M.; Marchant, H.K.; Kartal, B. The microbial nitrogen-cycling network. Nat. Rev. Microbiol. 2018, 16, 263–276. [Google Scholar] [CrossRef]
  8. Heil, J.; Vereecken, H.; Brüggemann, N. A review of chemical reactions of nitrification intermediates and their role in nitrogen cycling and nitrogen trace gas formation in soil. Eur. J. Soil Sci. 2016, 67, 23–39. [Google Scholar] [CrossRef]
  9. Cameron, K.C.; Di, H.J.; Moir, J.L. Nitrogen losses from the soil/plant system: A review. Ann. Appl. Biol. 2013, 162, 145–173. [Google Scholar] [CrossRef]
  10. Saggar, S.; Jha, N.; Deslippe, J.; Bolan, N.S.; Luo, J.; Giltrap, D.L.; Kim, D.G.; Zaman, M.; Tillman, R.W. Denitrification and N2O:N2 production in temperate grasslands: Processes, measurements, modelling and mitigating negative impacts. Sci. Total Environ. 2013, 465, 173–195. [Google Scholar] [CrossRef]
  11. Knowles, R. Denitrification. Microbiol. Rev. 1982, 46, 43–70. [Google Scholar] [CrossRef]
  12. van Spanning, R.J.M.; Richardson, D.J.; Ferguson, S.J. Chapter 1—Introduction to the Biochemistry and Molecular Biology of Denitrification. In Biology of the Nitrogen Cycle; Bothe, H., Ferguson, S.J., Newton, W.E., Eds.; Elsevier: Amsterdam, The Netherlands, 2007; pp. 3–20. [Google Scholar]
  13. IPCC. Climate change. In Synthesis Report of the Fourth Assessment Report of IPCC, Chapter 3; IPCC: Geneva, Switzerland, 2007; 49p. [Google Scholar]
  14. Kroeze, C.; Mosier, A.; Bouwman, L. Closing the global N2O budget: A retrospective analysis 1500–1994. Glob. Biogeochem. Cycles 1999, 13, 1–8. [Google Scholar] [CrossRef]
  15. Mosier, A.R.; Duxbury, J.M.; Freney, J.R.; Heinemeyer, O.; Minami, K. Assessing and Mitigating N2O Emissions from Agricultural Soils. Clim. Chang. 1998, 40, 7–38. [Google Scholar] [CrossRef]
  16. Skopp, J.; Jawson, M.D.; Doran, J.W. Steady-State Aerobic Microbial Activity as a Function of Soil Water Content. Soil Sci. Soc. Am. J. 1990, 54, 1619–1625. [Google Scholar] [CrossRef]
  17. Saggar, S.; Bolan, N.S.; Bhandral, R.; Hedley, C.B.; Luo, J. A review of emissions of methane, ammonia, and nitrous oxide from animal excreta deposition and farm effluent application in grazed pastures. N. Z. J. Agric. Res. 2004, 47, 513–544. [Google Scholar] [CrossRef]
  18. Van Vuuren, A.M.; Meijs, J.A.C. Effects of herbage composition and supplement feeding on the excretion of nitrogen in dung and urine by grazing dairy cows. In Animal Manure on Grassland and Fodder Crops. Fertilizer or Waste? Proceedings of an International Symposium of the European Grassland Federation, Wageningen, The Netherlands, 31 August–3 September 1987; Van Der Meer, H.G., Unwin, R.J., Van Dijk, T.A., Ennik, G.C., Eds.; Springer: Dordrecht, The Netherlands, 1987; pp. 17–25. [Google Scholar]
  19. Oenema, O.; Velthof, G.L.; Yamulki, S.; Jarvis, S.C. Nitrous oxide emissions from grazed grassland. Soil Use Manag. 1997, 13, 288–295. [Google Scholar] [CrossRef]
  20. Misselbrook, T.; Fleming, H.; Camp, V.; Umstatter, C.; Duthie, C.A.; Nicoll, L.; Waterhouse, T. Automated monitoring of urination events from grazing cattle. Agric. Ecosyst. Environ. 2016, 230, 191–198. [Google Scholar] [CrossRef]
  21. Clough, T.J.; Sherlock, R.R.; Cameron, K.C.; Ledgard, S.F. Fate of urine nitrogen on mineral and peat soils in New Zealand. Plant Soil 1996, 178, 141–152. [Google Scholar] [CrossRef]
  22. Cahalan, E.; Minet, E.; Ernfors, M.; Müller, C.; Devaney, D.; Forrestal, P.J.; Richards, K.G. The effect of precipitation and application rate on dicyandiamide persistence and efficiency in two Irish grassland soils. Soil Use Manag. 2015, 31, 367–374. [Google Scholar] [CrossRef]
  23. McGeough, K.L.; Watson, C.J.; Müller, C.; Laughlin, R.J.; Chadwick, D.R. Evidence that the efficacy of the nitrification inhibitor dicyandiamide (DCD) is affected by soil properties in UK soils. Soil Biol. Biochem. 2016, 94, 222–232. [Google Scholar] [CrossRef]
  24. Padmanabhan, E.; Reich, P.F. World soil map based on soil taxonomy. In Encyclopedia of Soils in the Environment, 2nd ed.; Goss, M.J., Oliver, M., Eds.; Academic Press: Oxford, UK, 2023; pp. 218–231. [Google Scholar]
  25. Delmelle, P.; Opfergelt, S.; Cornelis, J.-T.; Ping, C.-L. Chapter 72—Volcanic Soils. In The Encyclopedia of Volcanoes, 2nd ed.; Sigurdsson, H., Ed.; Academic Press: Amsterdam, The Netherlands, 2015; pp. 1253–1264. [Google Scholar]
  26. Dörner, J.; Dec, D.; Peng, X.; Horn, R. Effect of land use change on the dynamic behaviour of structural properties of an Andisol in southern Chile under saturated and unsaturated hydraulic conditions. Geoderma 2010, 159, 189–197. [Google Scholar] [CrossRef]
  27. Salazar, F.; Martínez-Lagos, J.; Alfaro, M.; Misselbrook, T. Ammonia emissions from urea application to permanent pasture on a volcanic soil. Atmos. Environ. 2012, 61, 395–399. [Google Scholar] [CrossRef]
  28. Martínez-Lagos, J.; Salazar, F.; Alfaro, M.; Misselbrook, T. Ammonia volatilization following dairy slurry application to a permanent grassland on a volcanic soil. Atmos. Environ. 2013, 80, 226–231. [Google Scholar] [CrossRef]
  29. Vistoso, E.; Alfaro, M.; Saggar, S.; Salazar, F. Effect of Nitrogen Inhibitors on Nitrous Oxide Emissions and Pasture Growth After an Autumn Application in Volcanic Soil. Chil. J. Agric. Res. 2012, 72, 133–139. [Google Scholar] [CrossRef]
  30. Hube, S.; Alfaro, M.A.; Scheer, C.; Brunk, C.; Ramírez, L.; Rowlings, D.; Grace, P. Effect of nitrification and urease inhibitors on nitrous oxide and methane emissions from an oat crop in a volcanic ash soil. Agric. Ecosyst. Environ. 2017, 238, 46–54. [Google Scholar] [CrossRef]
  31. Toro-Mujica, P.; Vera, R.; Vargas-Bello-Pérez, E.; Pinedo, P.; Bas, F. Trends and Drivers of Change of Pastoral Beef Production Systems in a Mediterranean-Temperate Climate Zone of Chile. Animals 2019, 9, 1135. [Google Scholar] [CrossRef] [PubMed]
  32. Kirchmann, H.; Esala, M.; Morken, J.; Ferm, M.; Bussink, W.; Gustavsson, J.; Jakobsson, C. Ammonia emissions from agriculture. Nutr. Cycl. Agroecosystems 1998, 51, 1–3. [Google Scholar] [CrossRef]
  33. Cárdenas, L.M.; Hawkins, J.M.B.; Chadwick, D.; Scholefield, D. Biogenic gas emissions from soils measured using a new automated laboratory incubation system. Soil Biol. Biochem. 2003, 35, 867–870. [Google Scholar] [CrossRef]
  34. Loick, N.; Dixon, E.; Abalos, D.; Vallejo, A.; Matthews, P.; McGeough, K.; Watson, C.; Baggs, E.M.; Cardenas, L.M. “Hot spots” of N and C impact nitric oxide, nitrous oxide and nitrogen gas emissions from a UK grassland soil. Geoderma 2017, 305, 336–345. [Google Scholar] [CrossRef]
  35. Bergstermann, A.; Cárdenas, L.; Bol, R.; Gilliam, L.; Goulding, K.; Meijide, A.; Scholefield, D.; Vallejo, A.; Well, R. Effect of antecedent soil moisture conditions on emissions and isotopologue distribution of N2O during denitrification. Soil Biol. Biochem. 2011, 43, 240–250. [Google Scholar] [CrossRef]
  36. Meijide, A.; Cardenas, L.M.; Bol, R.; Bergstermann, A.; Goulding, K.; Well, R.; Vallejo, A.; Scholefield, D. Dual isotope and isotopomer measurements for the understanding of N2O production and consumption during denitrification in an arable soil. Eur. J. Soil Sci. 2010, 61, 364–374. [Google Scholar] [CrossRef]
  37. Burns, L.C.; Stevens, R.J.; Laughlin, R.J. Determination of the simultaneous production and consumption of soil nitrite using 15N. Soil Biol. Biochem. 1995, 27, 839–844. [Google Scholar] [CrossRef]
  38. Burns, L.C.; Stevens, R.J.; Laughlin, R.J. Production of nitrite in soil by simultaneous nitrification and denitrification. Soil Biol. Biochem. 1996, 28, 609–616. [Google Scholar] [CrossRef]
  39. Paul, E.A.; Clark, F.E. Soil Microbiology and Biochemistry; Academic Press: Cambridge, MA, USA, 1989. [Google Scholar]
  40. Russow, R.; Stange, C.F.; Neue, H.U. Role of nitrite and nitric oxide in the processes of nitrification and denitrification in soil: Results from 15N tracer experiments. Soil Biol. Biochem. 2009, 41, 785–795. [Google Scholar] [CrossRef]
  41. Bremner, J.M.; Keeney, D.R. Determination and Isotope-Ratio Analysis of Different Forms of Nitrogen in Soils: 3. Exchangeable Ammonium, Nitrate, and Nitrite by Extraction-Distillation Methods. Soil Sci. Soc. Am. J. 1966, 30, 577–582. [Google Scholar] [CrossRef]
  42. Krol, D.J.; Carolan, R.; Minet, E.; McGeough, K.L.; Watson, C.J.; Forrestal, P.J.; Lanigan, G.J.; Richards, K.G. Improving and disaggregating N2O emission factors for ruminant excreta on temperate pasture soils. Sci. Total Environ. 2016, 568, 327–338. [Google Scholar] [CrossRef] [PubMed]
  43. Clough, T.J.; Sherlock, R.R.; Mautner, M.N.; Milligan, D.B.; Wilson, P.F.; Freeman, C.G.; McEwan, M.J. Emission of nitrogen oxides and ammonia from varying rates of applied synthetic urine and correlations with soil chemistry. Soil Res. 2003, 41, 421–438. [Google Scholar] [CrossRef]
  44. Linn, D.M.; Doran, J.W. Effect of Water-Filled Pore Space on Carbon Dioxide and Nitrous Oxide Production in Tilled and Nontilled Soils. Soil Sci. Soc. Am. J. 1984, 48, 1267–1272. [Google Scholar] [CrossRef]
  45. Ambus, P.; Petersen, S.O.; Soussana, J.F. Short-term carbon and nitrogen cycling in urine patches assessed by combined carbon-13 and nitrogen-15 labelling. Agric. Ecosyst. Environ. 2007, 121, 84–92. [Google Scholar] [CrossRef]
  46. Sigurdarson, J.J.; Svane, S.; Karring, H. The molecular processes of urea hydrolysis in relation to ammonia emissions from agriculture. Rev. Environ. Sci. Bio/Technol. 2018, 17, 241–258. [Google Scholar] [CrossRef]
  47. Marsden, K.A.; Jones, D.L.; Chadwick, D.R. The urine patch diffusional area: An important N2O source? Soil Biol. Biochem. 2016, 92, 161–170. [Google Scholar] [CrossRef]
  48. Cardenas, L.M.; Misselbrook, T.M.; Hodgson, C.; Donovan, N.; Gilhespy, S.; Smith, K.A.; Dhanoa, M.S.; Chadwick, D. Effect of the application of cattle urine with or without the nitrification inhibitor DCD, and dung on greenhouse gas emissions from a UK grassland soil. Agric. Ecosyst. Environ. 2016, 235, 229–241. [Google Scholar] [CrossRef]
  49. van der Weerden, T.J.; Rutherford, A.J.; de Klein, C.A.M.; Ganasamurthy, S.; Morales, S.E. Elevating soil pH does not reduce N2O emissions from urine deposited onto pastoral soils. N. Z. J. Agric. Res. 2021, 65, 484–506. [Google Scholar] [CrossRef]
  50. Barneze, A.S.; Minet, E.P.; Cerri, C.C.; Misselbrook, T. The effect of nitrification inhibitors on nitrous oxide emissions from cattle urine depositions to grassland under summer conditions in the UK. Chemosphere 2015, 119, 122–129. [Google Scholar] [CrossRef] [PubMed]
  51. Wrage, N.; Demirbağ, N.S.; Hofmann, M.; Isselstein, J. Influence of stocking density on plant species richness and diversity in permanent grassland. In Grassland Farming and Land Management Systems in Mountainous Regions. Proceedings of the 16th Symposium of the European Grassland Federation, Gumpenstein, Austria, 29–31 August 2011; Agricultural Research and Education Center (AREC) Raumberg-Gumpenstein: Gumpenstein, Austria, 2011. [Google Scholar]
  52. Malhi, S.S.; McGill, W.B. Nitrification in three Alberta soils: Effect of temperature, moisture and substrate concentration. Soil. Biol. Biochem. 1982, 14, 393–399. [Google Scholar] [CrossRef]
  53. Selbie, D.R.; Cameron, K.C.; Di, H.J.; Moir, J.L.; Lanigan, G.J.; Richards, K.G. The effect of urinary nitrogen loading rate and a nitrification inhibitor on nitrous oxide emissions from a temperate grassland soil. J. Agric. Sci. 2014, 152, 159–171. [Google Scholar] [CrossRef]
  54. Clough, T.J.; Cardenas, L.M.; Friedl, J.; Wolf, B. Nitrous oxide emissions from ruminant urine: Science and mitigation for intensively managed perennial pastures. Curr. Opin. Environ. Sustain. 2020, 47, 21–27. [Google Scholar] [CrossRef]
  55. Parkin, T.B.; Doran, J.W.; Franco-Vizcaíno, E. Field and Laboratory Tests of Soil Respiration. Methods Assess. Soil Qual. 1997, 49, 231–245. [Google Scholar]
Figure 1. Mean of the three replicate cores of each treatment for N2O, N2, and CO2 emissions over the course of the incubation (1 g m−2 d−1 = 4.17 × 10⁻³ mg cm−2 h−1). Black and grey lines correspond to the standard error of the means. The light grey-coloured lines in the N2 and CO2 graphs show the emissions due to atmospheric N2 and CO2 introduced with the amendment (see text). The insert in the N2 graph provides a closer look at the N2 emissions during the first week after the amendment application, including the N2 peak attributed to denitrification (see text).
Nitrogen 05 00017 g001
Table 1. Physical and chemical characteristics of the soil. Values are the averages of triplicate soil analysis ± standard deviation.
PropertyUnitsSoil
Soil type Silandic Andosol; Eutric, Siltic
(IUSS Working Group 2006)
Texture Silty clay loam—silt loam
(FAO 2006)
pH 5.55 ± 0.50
Phosphorus (P)mg kg−1 dry soil26.11 ± 7.14
Potassium (K)mmol kg−1 dry soil3.3 ± 1.6
Magnesium (Mg)mmol kg−1 dry soil5.6 ± 2.4
Calcium (Ca)mmol kg−1 dry soil42.7 ± 22.4
Sodium (Na)mmol kg−1 dry soil1.6 ± 0.4
Aluminium cation (Al)mmol kg−1 dry soil5.4 ± 3.5
Organic matterg kg−1 dry soil168 ± 15
Particle densityg cm−32.24
Water content at core packing% w/w39
Table 2. Cumulative emissions of CO2 (as g C m−2), N2O, and N2 (as g N m−2), N losses via N2O (calculated by subtracting the emissions of the control treatment (0N) from the urine treatments expressed as the percentage of the total N applied in the urine) for 0N, 25N, 50N, and 100N treatments for the experimental period, and N2O/(N2O + N2) ratios for denitrification period from day 0.5 to 3. N2 is the baseline subtracted. Different letters indicate a significant difference between treatments for each measurement (n = 3, p < 0.05).
TreatmentCO2
(g C m−2)
N2O
(g N m−2)
N2
(g N m−2)
N Loss via N2O
(% of Applied N)
N2O/(N2O + N2)
0N 47.41 ± 0.11 a0.059 ± 0.029 a0.681 ± 0.257 ab 0.059 ± 0.013 a
25N113.44 ± 1.05 b0.100 ± 0.004 a0.670 ± 0.325 ab0.17 ± 0.02 a0.086 ± 0.028 a
50N139.06 ± 0.82 c0.690 ± 0.091 b0.660 ± 0.030 b1.39 ± 0.20 c0.069 ± 0.006 a
100N184.98 ± 2.04 d0.855 ± 0.051 b *0.268 ± 0.188 a0.88 ± 0.06 b *0.183 ± 0.069 a
* N2O emissions were still high and increasing slightly for this treatment at the end of the experimental period; see Figure 1.
Table 3. Soil concentration of total oxidised N (TON) and ammonium (NH4+) as g N kg−1 dry soil, soil organic carbon (SOC) as g C kg−1 dry soil, and moisture content (H2O, %) before amendment application and at the end of the incubation period. A total of 87 mL of urine was applied to each core, adding 1.13 ± 0.013, 2.15 ± 0.049, and 4.26 ± 0.024 g urea N as well as 3.49 ± 0.02, 3.99 ± 0.08, and 4.92 ± 0.03 g urea C per g dry soil to the treatments 25N, 50N, and 100N, respectively (treatment 0N received water only), and bringing the average moisture content up to 90.6% (=85% WFPS). Different letters indicate a significant difference between treatments, including the native soil before incubation for each layer [Top (A/B/C) or Bottom (a/b/c/d)]. Mean ± standard error. (*) indicates significant differences between the Top and Bottom layers within a single treatment. (n = 3, p < 0.05).
Treatment Before Amendment ApplicationAfter Incubation
Parameter Native Soil0N25N50N100N
TONTop0.059 ± 0.002 A0.108 ± 0.002 A0.605 ± 0.079 B1.223 ± 0.027 * C1.451 ± 0.078 C
g N kg−1 soilBottom0.059 ± 0.002 a0.108 ± 0.001 a0.500 ± 0.078 b0.873 ± 0.034 * c1.167 ± 0.069 d
NH4+Top0.010 ± 0.002 A0.004 ± 0.000 A0.004 ± 0.000 A0.007 ± 0.001 A1.016 ± 0.114 * B
g N kg−1 soilBottom0.010 ± 0.002 a0.004 ± 0.000 a0.004 ± 0.000 a0.007 ± 0.000 a0.241 ± 0.034 * b
SOCTop0.877 ± 0.011 AB0.931 ± 0.034 AB0.984 ± 0.026 B0.798 ± 0.039 A0.988 ± 0.019 * B
g C kg−1 soilBottom0.877 ± 0.011 a0.874 ± 0.054 a0.892 ± 0.023 a0.838 ± 0.014 a0.791 ± 0.016 * a
H2OTop79.32 ± 0.28 A83.27 ± 0.44 * A80.32 ± 1.78 A82.53 ± 0.85 * A81.39 ± 1.26 A
%Bottom79.32 ± 0.28 a79.84 ± 0.51 * a79.01 ± 1.29 a78.41 ± 0.20 * a78.10 ± 0.22 a
Disclaimer/Publisher’s Note: The statements, opinions and data contained in all publications are solely those of the individual author(s) and contributor(s) and not of MDPI and/or the editor(s). MDPI and/or the editor(s) disclaim responsibility for any injury to people or property resulting from any ideas, methods, instructions or products referred to in the content.

