Article

Sustainability Analysis of Nitrogen Use Efficiency in Soybean-Corn Succession Crops of Midwest Brazil

by
Francisco Gilberto Erthal Risi
1,
Cristina Moll Hüther
1,
Ciro Abbud Righi
2,
Renan Caldas Umburanas
3,*,
Tiago Tezotto
4,
Durval Dourado Neto
3,*,
Klaus Reichardt
3,5 and
Carlos Rodrigues Pereira
1
1
Biosystems Engineering, Fluminense Federal University (UFF), Niterói 24210-240, Brazil
2
Department of Forestry Sciences, “Luiz de Queiroz” College of Agriculture (ESALQ), University of São Paulo (USP), Piracicaba 13418-900, Brazil
3
Department of Crop Science, “Luiz de Queiroz” College of Agriculture (ESALQ), University of de São Paulo (USP), Piracicaba 13418-900, Brazil
4
Department of Soil Science, “Luiz de Queiroz” College of Agriculture (ESALQ), University of de São Paulo (USP), Piracicaba 13418-900, Brazil
5
Laboratory of Soil Physics, “Luiz de Queiroz” College of Agriculture (ESALQ), University of São Paulo (USP), Piracicaba 13416-900, Brazil
*
Authors to whom correspondence should be addressed.
Nitrogen 2024, 5(1), 232-253; https://doi.org/10.3390/nitrogen5010016
Submission received: 13 February 2024 / Revised: 5 March 2024 / Accepted: 6 March 2024 / Published: 12 March 2024

Abstract

:
Nitrogen (N) is abundant in the atmosphere as N2, which is converted into reactive forms (Nr) for plant assimilation. In pre-industrial times, atmospheric N2 conversion to Nr balanced Nr reconversion to N2, but 20th-century human activity intensified this conversion via synthetic fertilizers, biological N2 fixation, and fossil fuel burning. The surplus of Nr detrimentally impacts ecosystems and human well-being. This study aimed to assess the N use efficiency in the soil–plant system of the soybean-corn succession ( S P S S , C ) in Mato Grosso and Mato Grosso do Sul, Brazil’s midwest. We estimated N macrofluxes in S P S S , C and identified key agro-environmental indicators. Between 2008 and 2020, the yearly sowed area for the S P S S , C increased by 3.3-fold (currently 7.3 million ha). The average annual input of net anthropogenic Nr, average annual N balance, and N loss in S P S S , C was estimated to be ~204 kg [N] ha−1, 57 kg [N] ha−1, and 30 kg [N] ha−1, respectively, indicating persistent N accumulation and loss. The average results of the agronomic efficiency and N retention indicator in the S P S S , C was 0.71 and 0.90, respectively. Modest N use efficiency results reflect N loss effects. Despite these limitations, there are opportunities in S P S S , C for management strategies to reduce N loss and enhance efficiency.

1. Introduction

Nitrogen (N) is a key element for the life of all terrestrial organisms, being used by them in the production of complex biological molecules essential for their development, such as amino acids, proteins, enzymes, and nucleic acids [1].
Although it exists in great abundance in the atmosphere, with about 78% by volume in the N2 molecular form (non-reactive), N is not assimilated in this form by most living organisms [2]. For example, plants uptake N in the forms NH3 (ammonia), NH4+ (ammonium), NO3 (nitrate), and (NH2)2CO (urea) but assimilate N only in the reactive form of NH3 (ammonia) into glutamine [2], which makes N a scarce resource and a limiting factor for plant growth in many ecosystems [3].
Throughout its biogeochemical cycle, N assumes different reactive molecular forms called Nr (collective of N compounds, except N2). In a simplified way, the N cycle contemplates the following macroprocesses: (a) fixation of N2 in the forms HNO3 (nitric acid) and NO3 via atmospheric lightning discharge; (b) biological fixation of N2 in the forms NH3/NH4+ as carried out by associative and symbiotic bacteria; (c) industrial fixation of N2 in the form of synthetic nitrogen fertilizers; (d) nitrification (conversion of ammonium into nitrate) carried out by soil bacteria; (e) assimilation of mineralized N by plants in the reactive forms NH3, NH4+, and NO3; (f) mineralization of soil organic N to the NH4+ form carried out by decomposing bacteria; and (g) denitrification or reduction of nitrates and nitrites to N2O (nitrous oxide) and N2 forms [4].
In the pre-industrial historical period, the N cycle remained in a relative state of dynamic equilibrium, with the balancing of N fluxes between terrestrial ecosystems and the atmosphere, that is, with the equivalence of global rates of N2 fixation with global denitrification rates [5].
With the advent of the Industrial Revolution, this balance began to be gradually broken. Between 1860 and 2000, the annual rate of anthropogenic Nr emissions increased from 15 Tg [N] (1 Tg = 1012 g) to 165 Tg [N] [6]. But it was from the second half of the twentieth century onwards that anthropogenic Nr emissions intensified, producing profound transformations in the N cycle. The determining factor for these transformations was the acceleration of the atmospheric N2 fixation rate because of three human activities on a global scale: (a) industrial N2 fixation via the production and use of synthetic nitrogen fertilizers; (b) biological N2 fixation (BNF) via the large-scale cultivation of plants of the Fabaceae family; and (c) fossil fuel burning [1].
In 2010, these three activities jointly produced around 210 Tg [N], of which 120 Tg [N] came from synthetic fertilizers, 60 Tg [N] from BNF, and 30 Tg [N] from burning fossil fuels [7]. The Nr emitted in 2010 by these three anthropogenic sources surpassed the Nr emitted by strictly natural sources in the same year, estimated at 203 Tg [N] [7].
Global agricultural activity accounted for about 80% of global anthropogenic Nr, and of all N applied in agriculture via synthetic fertilizer, only about 50% on average were incorporated into crop biomass [8,9,10]. The other half (not assimilated by crops) goes into the environment in the form of Nr [11].
The scarcity of N constitutes a limiting factor for the primary productivity of ecosystems, whereas its excessive presence constitutes a risk factor for the sustainability of ecosystems. For some decades, the global academic literature has been warning about the effects of the growth of anthropogenic Nr emissions: (a) There has been a 20% increase in the atmospheric concentration of N2O gas in relation to the pre-industrial level [12], which is currently responsible for about 5% of the atmospheric greenhouse effect [13]. N2O is also identified as the main cause of stratospheric ozone depletion [14], responsible for adverse effects on human health [12]; (b) There has been an increase in atmospheric emissions of nitrogen oxides N2O and NO2, polluting gases responsible for increasing the concentration of ozone in the troposphere and which are harmful to human health [6,12,13]; (c) There has been a reduction in biodiversity in terrestrial ecosystems and an acidification of soils, lakes, and water bodies in different parts of the world [15]; (d) There is eutrophication of coastal areas (rivers, lakes, and estuaries), caused by excess of nutrients, generally nitrogen and phosphorus, responsible for the proliferation of algae, cyanobacteria, and aquatic plants. Between 1960 and 2000, human activity increased the N flux in the Mississippi River basin 4-fold and in the rivers of the American Northeast 8-fold, with most of these fluxes of nitrates coming from the use of synthetic nitrogenous fertilizers [16]; and (e) Other studies [12,17,18] warn of the risks of the increasing imbalance in the N biogeochemical cycle, as well as the need for global actions to reduce anthropogenic Nr emissions.
Modern agriculture represents the main factor for transgressing the tolerable limits of human interference in the global N cycle, especially due to the growth in the use of synthetic nitrogen fertilizer [17]. In this sense, more efficient use of N in agro-systems is a global need of great relevance [19,20,21].
Among the crops that consume the most synthetic nitrogen fertilizers, corn ranks first in the world [22]. Brazil produced 109 million tons of corn in 2022 (9% of global production) [23] and is currently the third largest corn producer in the world [24]. Around 27% of all synthetic N fertilizer consumed in 2018 in Brazil was utilized for corn crops [25]. However, studies on the agri-environmental efficiency of N use in this crop at a regional level are scarce. Brazil produced 121 million tons of soybeans in 2022 (35% of world production) and is currently the largest soybean producer in the world [23]. Unlike corn, the soybean production system relies only on biological N fixation as a N source. One study on macronutrients applied to sixteen main Brazilian crops [24] estimated negative results in the N balance in agricultural soils in all five regions of the country, including the midwest region, the largest producer states of soybeans and corn in Brazil.
The objective of this study was to carry out an exploratory analysis on the efficiency of N use in the soil–plant system of the soybean-corn succession (here designated by S P S S , C ) in the Brazilian states of Mato Grosso (MT) and Mato Grosso do Sul (MS). For the most part, these crops are large scale, with soybeans and corn being cultivated under direct seeding (no tillage). In recent decades, there has been a significant expansion of this agricultural modality in these states, where soybean represents the main summer crop and corn the secondary crop in succession (locally called “second season corn” or “off season corn”). The efficiency in the use of N was analyzed based on the results of N fluxes in the S P S S , C as well as the results of the agro-environmental indicators.

2. Materials and Methods

The choice of the soybean-corn succession in MT and MS as the object of interest for the present study was based on the common attributes of these crops in both states: (a) The regional amplitude of the total sown area, with more than seven million hectares in 2020 [26]. Regional analyses of large agricultural areas make it possible to more clearly identify the existence of surplus and deficit of nutrients in the soil–plant system than analyses at the local level; (b) Taking into account that all corn harvested in MT and MS is grown as second crop corn in succession to the soybean crop grown in the summer, we can assume that the cultivated area of the soybean-corn succession is equivalent to the total area of second corn crop cultivated in MT and MS; (c) The similarity between environmental characteristics (“Cerrado” biome) and agricultural management of soybean-corn succession crops in MT and MS [27]; (d) The rainy tropical climate between October and May with a defined dry season, annual rainfall ranging between 1500 and 1900 mm, average annual temperature between 22 °C and 26 °C, and latitudes between 10° S and 23° S) [28]; (e) Soils with a predominance of red Oxisols with medium and clayey texture [29]; (f) Soybean sowing typically performed between mid-October and mid-December, and corn between January and mid-March, right after the soybean harvest [27]; and (g) Soybean harvest between January and March and corn harvest between June and August.
In the soybean-corn succession analyzed here, cover crops such as Brachiaria spp., Crotalaria spp., and others eventually cultivated in intercropping with corn (second harvest) were not considered due to the unavailability of quantitative data on their cultivation. 
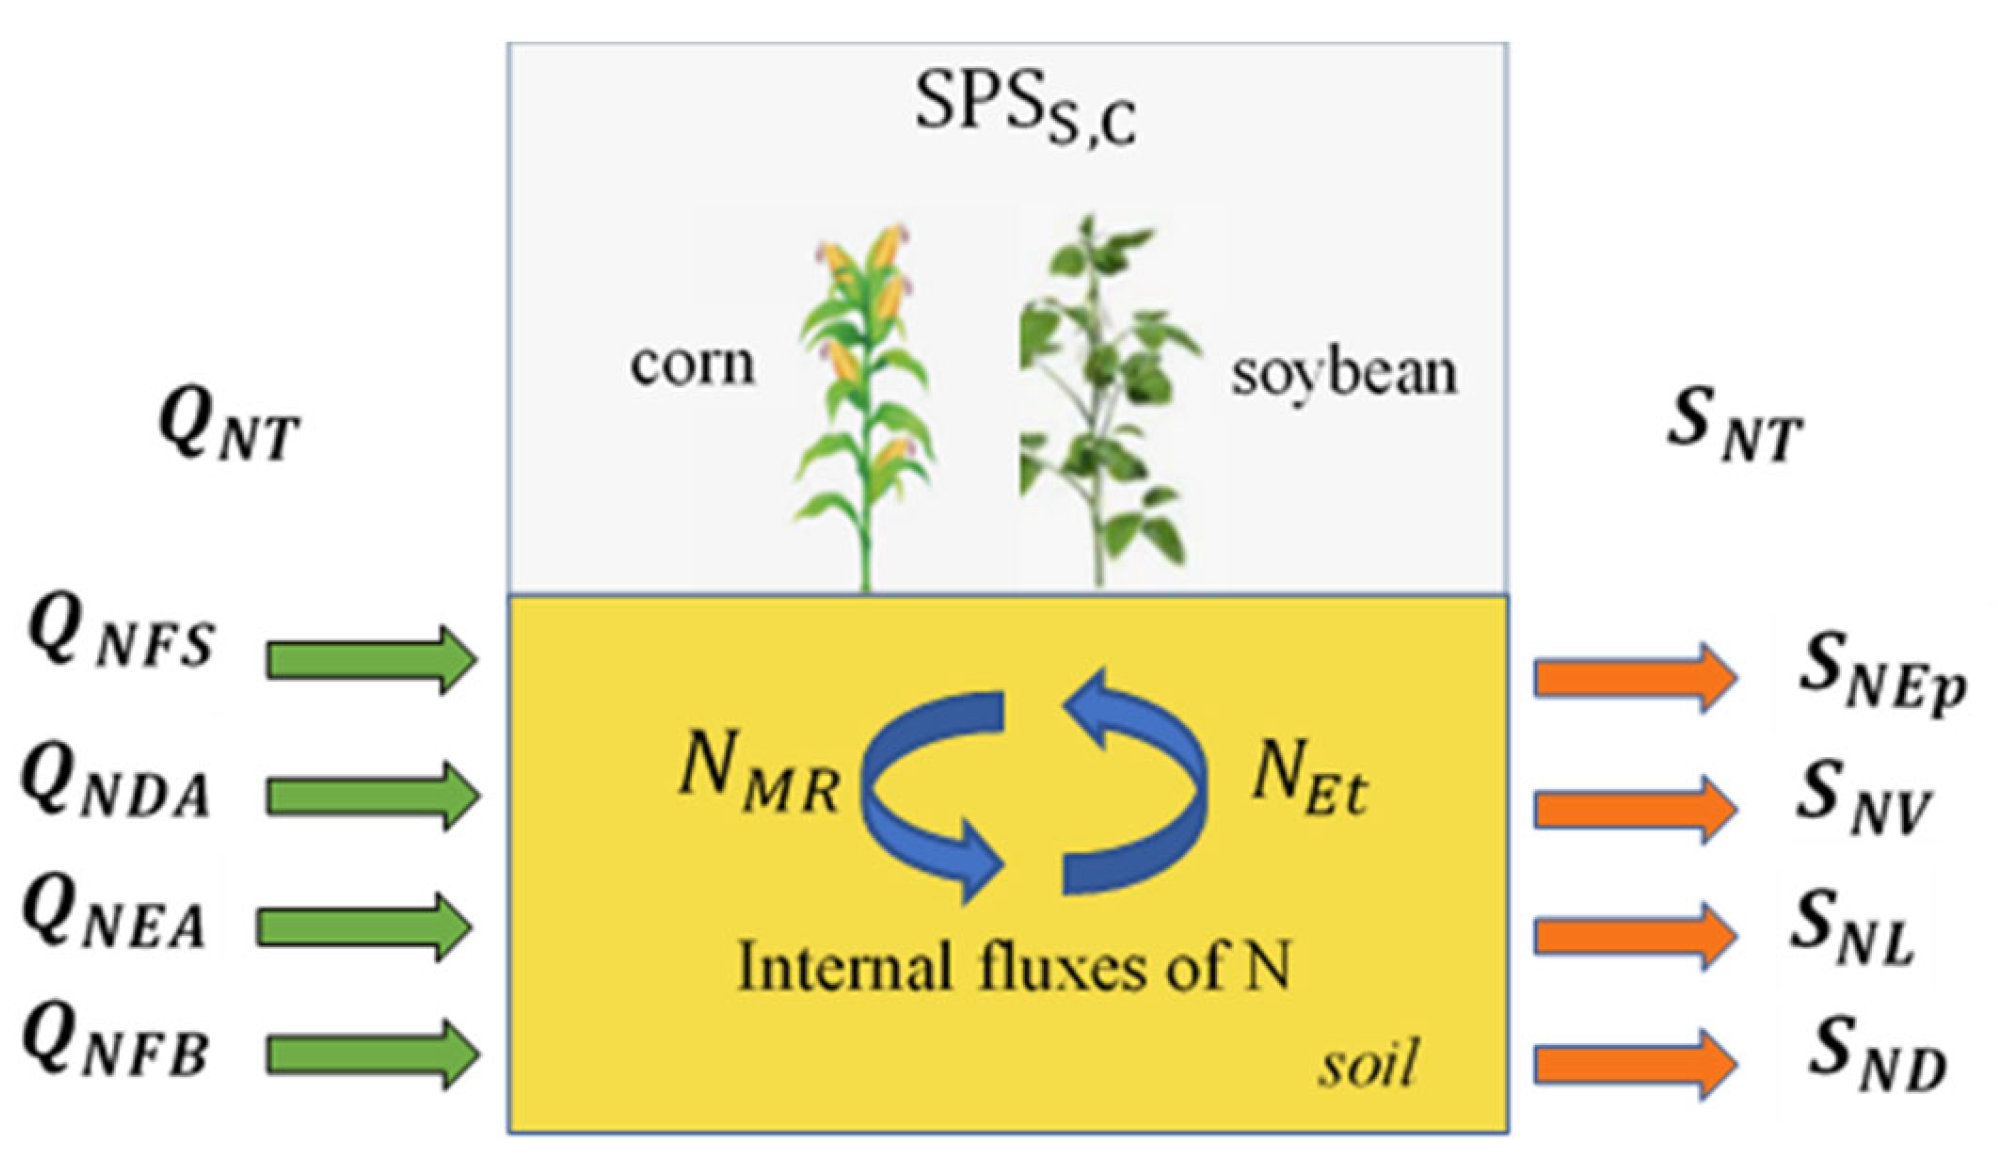
Figure 1 illustrates the S P S S , C   of the MT and MS states. The green and orange arrows indicate, respectively, the inflow and outflow of N. The blue arrows indicate the internal flows.

2.1. Definition of N Entries and Outcomes in the S P S S , C

The amount of N entries ( Q N T , kg [ N ] ha−1) can be calculated as:
Q N T = Q N F S + Q N D A + Q N E A + Q N F B
where Q N F S refers to N (kg [ N ] ha−1) entries as synthetic fertilizers, Q N D A to N (kg [ N ] ha−1) entries via atmospheric deposition in the molecular forms N O y ( N O, N O 2 , and H N O 3 ) and N H x ( N H 3 and N H 4 + ), Q N E A to N (kg [ N ] ha−1) entries via animal excreta, and Q N F B   t o   N (kg [ N ] ha−1) entries via biologic fixation of atmospheric N2 by the soybean crop.
The total N ( S N T , kg [ N ] ha−1) outcome can be calculated as:
S N T = S N V + S N L + S N E p + S N D
where S N V refers to N (kg [ N ] ha−1) outcomes via volatilization in the forms N H 3 , NO, and N 2 O , S N L to N (kg [ N ] ha−1) outcomes via lixiviation/hydrologic runoff in the form N O 3 , S N E p to N (kg [ N ] ha−1) outcomes via grain export of soybeans and corn, and S N D to N (kg [ N ] ha−1) outcomes via denitrification by eliminating N2 and N 2 O .
The N that leaves S P S S , C via the export of soybeans and corn S N E p (kg [ N ] ha−1) is calculated as:
S N E p = S N E p , S + S N E p , C
where S N E p , S and S N E p , C refer to the N (kg [ N ] ha−1) outcome via the grain export of soybeans and corn, respectively.

2.2. Definition of Internal Fluxes of the S P S S , C

The average annual amount of gross mineralized N from the organic waste of soybean and corn crops (NMR, kg [N] ha−1) left in the soil after grain harvest is:
N M R = N M R , S + N M R , C
where N M R refers to the organic N mineralization of the residues of previous crops (soybean and corn) after grain harvest. N M R represents the annual average mineralized N from the organic root, stem, and leaf residues of the previous crops.
Although considered as an internal flux of the soil–plant system, N M R represents an extra N supply to the S P S S , C via mineralization of the organic residues of the previous crops in addition to the entry fluxes Q N F S , Q N D A , Q N E A , and Q N F B . Therefore, the total quantity of N supplied to the S P S S , C , here designated as   Q N S , turns out to be:
Q N S = Q N F S + Q N D A + Q N E A + Q N F B + N M R
The average annual amount of organic N ( N O R , kg [N] ha−1) accumulated in the roots, stems, and leaves of the previous crops of soybean and corn crops until the grain harvest is expressed by the following equation:
N O R = N O R , S + N O R , C
where N O R , S refers to the organic N accumulated in the roots, stems, and leaves of the predecessor crop of soybeans and N O R , C refers to the predecessor crop of corn cultivation.
Considering that N E t represents the total N extracted from soil by the soybean and corn crops, we have:
N E t = N E t , S + N E t , C
Considering that N O R , S corresponds to the fraction of the total N extracted by soybean ( N E t , S ) relative to the N accumulated in soybean roots, stems, and leaves, and that N E p , S corresponds to the complementary fraction of NEt,S relative to the N accumulated in soybean grain ( N E t , S ), we have that:
N E t , S = N O R , S + N E p , S
In the same way for corn, we have:
N E t , C = N O R , C + N E p , C
The total accumulated N in grains of soybean and corn ( N E p ) is:
N E p = N E p , S + N E p , C
and equivalent to the total N that leaves S P S S , C via grains export is:
S N E p = S N E p , S + S N E p , C

2.3. Criteria Assumed in Estimating the Amounts of N in the Soybean-Corn Succession

All N fluxes were estimated on an annual basis within the period from 2008 to 2020 in kg [N] ha−1 using data extracted from the following primary sources: IBGE (Brazilian Institute of Geography and Statistics—statistical yearbooks) [26], CONAB (National Supply Company—historical series of soybean and corn harvests) [30], FAOSTAT (Food and Agriculture Organization Statistical Databases) [23], IPCC (Intergovernmental Panel on Climate Change) [31], EMBRAPA (Brazilian Agricultural Research Corporation—third Brazilian inventory of anthropogenic emissions and removals of GHG) [32], and IFA (International Fertilizer Association) [22].
Due to the gaps and uncertainties observed in regional agricultural data relating to soybean-corn succession crops in the states of MT and MS, some simplifying assumptions were admitted, as described in the following sub-items. Whenever applicable, N fluxes in S P S S , C were estimated using the equations and parameters recommended in the “Guidelines” of the Intergovernmental Panel on Climate Change [31]. Section 2.3.1, Section 2.3.2, Section 2.3.3, Section 2.3.4, Section 2.3.5, Section 2.3.6, Section 2.3.7, Section 2.3.8 and Section 2.3.9 detail the assumed calculation criteria.

2.3.1. Amount of N Added via Synthetic Fertilizer

Q N F S represents the amount of applied synthetic N fertilizers. In Brazil, consumption data on synthetic N fertilizer on a regional scale, by type of crop, are scarce. In the case of soybean-corn succession, such data apply exclusively to corn, given that N fertilizer is not typically required for soybean crops [33].
Technical guidelines on good practices for the efficient use of N in second season (off-season) corn in succession to soybeans, recommend an application of between 8 and 10 kg [N] ha−1 for each Mg ha−1 of expected productivity of grains produced [34].
Assuming a constant average value of 9 kg [N] Mg−1 [dry grains] ( β C ), the annual average values of the amount of N ( Q N F S , kg [N] ha−1) applied to corn crops (second harvest) are estimated for Brazil from 2008 to 2020 as shown in Table 1.
Q N F S = β C . P u , C . 1 u C
where P u , C refers to the annual average corn productivity in the second harvest (off-season) (kg [moist grain] ha−1) [26] and u C refers to the grain moisture level, 13% [32].

2.3.2. Amount of N Entering through Atmospheric Deposition

The amount of N entering through atmospheric deposition ( Q N D A ) represents the amount of N (kg [ N ] ha−1) by atmospheric deposition in the forms N O y ( N O, N O 2 , and H N O 3 ) and N H x ( N H 3 and N H 4 + ). We assume for the states of MT and MS the following values N O y and N H x [6,35]: 175 mg [ N ] m−2 and 250 mg [ N ] m−2, respectively.
Adding these two values and converting mg [ N ] m−2 to kg [ N ] ha−1, we have the estimation of Q N D A equal to 4 kg [ N ] ha−1, assumed as constant for the whole period from 2008 to 2020.

2.3.3. Amount of N Added via Animal Excreta

The amount of N added via animal excreta ( Q N E A ) represents the average annual N input flow into the S P S S , C (kg [N] ha−1) via the addition of organic fertilizer from animal excreta. As soybean-corn succession crops are not used for pasturing, we assume Q N E A as null.

2.3.4. Amount of Entry N via Biological N Fixation

The biological N fixation ( Q N F B kg [ N ] ha−1) represents the average amount of fixed N2 by the soybean crop in symbiosis with bradyrhizobia [36] (Table 2).
Q N F B = β S . P u , S . 1 u S . F N , S
where β S refers to the extraction of N by the soybean crop assuming 80 kg [ N ] Mg−1 [dry grain]), P u , S to the average annual soybean productivity of moist grain (Mg ha−1) of the soybean crop [26], u S to the grain water content of 13% [32], and F N , S to the fraction of N extracted from the BNF (assumed to be 0.8 Mg Mg−1) [37].

2.3.5. Mineralization of Organic N from Residues of Previous Crops

The average annual amount of gross mineralized N from organic residues from soybean and corn crops (NMR, kg [N] ha−1) left in the soil after grain harvest is given by Equation (4), where N M R , S is:
N M R , S = N O R , S . Y S
and Y S is the annual fraction (Mg Mg−1) of the soybeans organic N ( N O R , S ) mineralized [38]:
Y S = 1 93.819 . e 0.0031 × t 100
Taking t as the decomposition time in days as 365 results in Y S = 0.31. From Equation (8), we have:
N O R , S = N E t , S N E p , S
Assuming that the soybeans extract is 80 kg [ N ] Mg−1 [dry grain] ( β S ) [39], we can estimate the average annual N extraction ( N E t , S , kg [ N ] ha−1):
N E t , S = β S . P u , S . 1 u S
where P u , S   is in Mg ha−1 [26] and u S is 13% [32].
Assuming an average N concentration ( C S ) in the soybean grain equal to 50 kg [ N ] Mg−1 [dry grain] [39], we can estimate the average annual N export ( N E p , S , kg [ N ] ha−1):
N E p , S = C S . P u , S . 1 u S
Substituting N E t , S and N E p , S into Equation (8), we obtain N O R , S , and substituting N O R , S and Y S into Equation (14), we obtain the average annual values of N M R , S (kg [ N ] ha−1). Applying the same criteria for the corn crop, we have:
N M R , C = N O R , C . Y C
where Y C is the annual fraction (Mg Mg−1) of corn organic N ( N O R , C ) mineralized [38]:
Y C = 1 93.1   e 0.0029 × t 100
Considering t (decomposition time in days) equal to 365 days, we have Y C = 0.33. From Equation (9), we have:
N O R , C = N E t , C N E p , C
Assuming that the corn extracts 25 kg [ N ] Mg−1 [dry grain] ( β C ) [40], we can estimate average annual values of N extraction ( N E t , C , kg [ N ] ha−1):
N E t , C = β C . P u , C . 1 u C
where P u , C refers to the average annual productivity of humid grain (Mg ha−1) of the corn crop [26], and u M is 13% [32].
Assuming an average N concentration C C in corn grain equal to 17 kg [ N ] Mg−1 [dry grain of second harvest] [40], we can estimate annual averages of N E p , C (kg [ N ] ha−1):
N E p , C = C C . P u , C . 1 u C
Substituting N E t , C and N E p , C in Equation (9), we obtain N O R , C , and substituting N O R , C and Y C in Equation (19), we have N M R , C . S ubstituting the values of N M R , S and N M R , C in Equation (4), we have the average annual estimation of N M R (Table 3). During the mineralization of organic residues from soybean and corn crops, a portion of the mineralized N is temporarily immobilized in the soil microbial biomass [41]. However, when estimating NMR, immobilized N was disregarded as it undergoes remineralization after the death of microorganisms [42].

2.3.6. Amount of N Released by Volatilization

S N V represents the N that leaves the system of the soybean-corn succession by volatilization in the molecular forms N H 3 , N O x , and N 2 O . S N V is expressed in N units according to Equation (20) [31,35], where: N 2 O d and ( N H 3 + N O x ) d refer to direct emissions of N 2 O and ( N H 3 + N O x ) and N 2 O i refers to indirect emissions of N 2 O .
S N V = N 2 O d + ( N H 3 + N O x ) d + N 2 O i

Direct Emission Estimates of N 2 O in N Units

Estimates are based on Equation (21)–(23) [31,35]:
N 2 O d = F s n + F a m + F c r . E F 1
F s n represents the annual amount of N applied on the soil in the form of synthetic fertilizer ( Q N F S , kg [ N ] ha−1) discounting the volatilized N in the forms N H 3 and N O x , expressed by:
F s n = N u . 1 F r a c g f u + Q N F S N u . ( 1 F r a c g f o )
where N u refers to the fraction of Q N F S applied in the form of urea (equal to 0.5), F r a c g f u to the fraction of N u volatilized as N H 3 or N O x (equal to 0.3), and F r a c g f o to the fraction of Q N F S applied as other nitrogenous forms (equal to 0.1) [32].
F a m represents the annual amount of N applied to the soil as animal organic fertilizer (animal manure), discounting the volatilized N as N H 3 and N O x , given by:
F a m = Q N E A × ( 1 F r a c g m )
Considering that Q N E A is null (see Section 2.3.3), we have F a m = 0,
where F r a c g m is the fraction of Q N E A volatized as N H 3 or   N O x , equal to 0.2 [31].
By substituting in Equation (26) the values of N u , F r a c g f u , F r a c g f o , and Q N F S (Table 1), we obtain the annual estimation of F s n in kg [ N ] ha−1.
F c r represents the amount of N that turns back to the soil as mineralized residues [31,35], being equivalent to the annual flux N M R (Table 3).
E F 1 represents the direct emission factor of N 2O applied to the amounts of N added annually to the soil, equivalent to 0.01 [31,35]. Substituting in Equation (25) the values of F s n , F a m , F c r , and E F 1 , we have the estimation of N 2 O d in kg [ N ] ha−1 in the period of 2008 to 2020 (Table 4).
Estimation of ( N H 3 + N O x ) d Emissions in N Units
( N H 3 + N O x ) d = N u × F r a c g f u + Q N F S N u × F r a c g f o + Q N E A × F r a c g m
Substituting into Equation (28) the values of N u , F r a c g f u , Q N F S (Table 1), F r a c g f o , Q N E A , and F r a c g m , we obtain the estimation of ( N H 3 + N O x ) d during the period 2008 to 2020 in N units (Table 4) [32].
Estimation of N 2 O i Emissions in N Units
N 2 O i = ( N 2 O ) G + ( N 2 O ) L
where ( N 2 O ) G represents the N 2 O (in N units) stemming from the volatilized N of synthetic fertilizers that is deposited later on the soil [31,35].
( N 2 O ) G = ( Q N F S · F r a c g f u + Q N E A · F r a c g m ) · E F 4
where F r a c g f u refers to the fraction of Q N F S volatilized as N H 3 or N O x in N units, equal to 0.10 [31], and EF4 is the factor of direct emission of N 2 O , assumed as 0.01 [31,35].
Substituting into Equation (26) [31,35] the values of Q N F S (Table 1), F r a c g f u , Q N E A (null), F r a c g m , and EF4, we obtain ( N 2 O ) G   ~zero (null). ( N 2 O ) L represents the N 2 O emmitted from the lixiviated N of Q N F S and Q N E A [31,35].
( N 2 O ) L = Q N F S + Q N E A · F r a c l i x · E F 5
where F r a c l i x (lixiviated fraction) is equal to 0.30 and EF5 (emission factor) is equal to 0.025.
Substituting the values of Q N F S , Q N E A , F r a c l i x , and EF5 into Equation (31), we find ( N 2 O ) L . Substituting ( N 2 O ) L into Equation (29) and making ( N 2 O ) G equal to zero, we obtain N 2 O i in N units (Table 4). Substituting the values of N 2 O d , N 2 O i , and ( N H 3 + N O x ) d into Equation (24), we obtain the annual estimation of S N V in kg [ N ] ha−1 as well as the annual averages of N 2 O t emitted by the soybean-corn succession ( N 2 O d + N 2 O i ) in Gg N 2 O units (Table 4).

2.3.7. Amount of N Lost by Lixiviation/Runoff

S N L represents the N that leaves the S P S S , C by lixiviation/runoff in the form NO3, being expressed in kg [ N ] ha−1 according to Equation (28) [31].
S N L = ( Q N F S + Q N E A ) · F r a c l i x
where Fraclix is equal to 0.30 [32]. Substituting into Equation (32) Fraclix (0.30), the annual averages of Q N F S estimated in Table 1; and Q N E A (null), we obtain the annual results of S N L during the period from 2008 to 2020, expressed in Table 5.

2.3.8. Amount of N Output by the Export of Soybean and Corn Grain

The annual average values of N export by soybean and corn ( S N E p ) can be found in Section 2.3.5 (Table 3).

2.3.9. Amount of N Output via the Denitrification Process

The amount of N output via the denitrification process ( S N D ) represents the average annual volatilized N from S P S S , C in the form N 2 via denitrification in N units (kg [N] ha−1). Denitrification is a microbial process that reduces nitrates (NO3) and nitrites (NO2) to dinitrogen (N2), with nitrous oxide (N2O) being a byproduct [43,44]. N2 emission rates in agricultural soils are quite variable, and their quantification is difficult due to the high concentration of this gas in the atmosphere [45]. Long-term data on N2 emissions from agricultural soils are scarce [44]. Another study has shown results of the ratio between N2 and N2O volatilized from agricultural soils via denitrification varying between 5.6 and 7.4 [46]. Assuming that: (a) the ratio N2/N2O in S P S S , C is constant and equal to 6.5 (average value between 5.6 and 7.4); and (b) the average annual volatilized N2O is also constant and equal to 1.4 kg [N] ha−1, the value estimated in Table 4 by adding (N2Od + N2Oi), we obtain S N D (average annual N2 released from S P S S , C by denitrification in N units) equal to 9 kg [N] ha−1. This value was assumed to be constant throughout the period of 2008–2020.

2.4. Agro-Environmental Indexes of the S P S S , C

The agro-environmental indexes of the S P S S , C were defined as follows.

2.4.1. Mass Balance of N

The mass balance of nitrogen (| B N |) is the difference between Q N S (average annual N added to the S P S S , C ) (Equation (5)) and S N T (average annual N leaving the S P S S , C (Equation (2)), expressed in kg [N] ha−1, according to Equation (33):
B N = ( Q N F S + Q N D A + Q N E A + Q N F B + N M R ) ( N E p + S N L + S N V + S N D )

2.4.2. Gross Anthropogenic Reactive N

The gross anthropogenic reactive N ( N r a g ) is equal to the average annual rate of the conversion of atmospheric N2 to Nr in S P S S , C , given by the sum of N fixed via synthetic fertilizer ( Q N F S ) plus biologically fixed N (QNFB), expressed in kg [N] ha−1, according to Equation (34):
N r a g = Q N F S + Q N F B

2.4.3. Net Anthropogenic Reactive N

Anthropogenic reactive net N ( N r a n ) is equal to the difference between N r a g ( Q N F S + Q N F B ) and S N D (average annual rate of reconversion of N r to atmospheric N 2 by denitrification), expressed in kg [N] ha−1, according to Equation (35):
N r a n = Q N F S + Q N F B S N D

2.4.4. N Lost

N lost ( N l , kg [ N ] ha−1) represents the outlet flux of N from the S P S S , C by volatilization ( S N V ), lixiviation ( S N L ), and denitrification ( S N D ), defined by:
N l = S N V + S N L + S N D

2.4.5. Agronomic Efficiency of N Use

The agronomic efficiency of N use ( E a g ) [47] represents the ratio between the exported N during grain harvest (soybean and corn) and the N added to the S P S S , C ( Q N S ), expressed by:
E a g = ( N E p , S + N E p , C ) / Q N S

2.4.6. Efficiency of Retention of N Added

The Efficiency of retention of N added ( E r e ) represents the ratio between N retained in the S P S S , C and N added, expressed by:
E r e = ( Q N S N l ) / Q N S

2.4.7. Average Annual Productivity of Soybeans

The average annual soybean ( P u , S ) and corn ( P u , C ) productivity in the S P S S , C is expressed as kg [grains] ha−1.

2.4.8. Amount of N 2 O Emitted

The Amount of N 2 O leaving the S P S S , C by denitrification is expressed in Gg [ N ].
The symbols of all equations presented in the manuscript are summarized in Appendix A.

3. Results and Discussion

The average annual results of the S P S S , C in the in- and outfluxes are consolidated in Table 6. The average annual results of the agro-environmental indexes are consolidated in Table 7.
The percentage contribution of N supply and output flows in relation to the total N supplied ( Q N S ) and to the total N output ( S N T ) is presented in Figure 2A and Figure 2B, respectively.
In Section 3.1, Section 3.2, Section 3.3, Section 3.4, Section 3.5, Section 3.6 and Section 3.7, we discuss the estimated results of the agro-environmental indexes. In Section 3.8, we propose several strategies of agricultural management taking into perspective the minimization of N l and maximization of the efficiencies E a g and E r e .

3.1. | B N | Indicator (N Mass Balance)

In the period of 2008 to 2020, the result of the N balance in the S P S S , C indicated an average annual surplus of 57 kg [N] ha−1 year−1 (Table 7). This surplus conflicts with the results shown in the FAO study [24], which pointed out deficits in the N balances of sixteen main Brazilian crops. In the central-west region, where soybean-corn succession crops predominate, the average balance indicated in the FAO study was −8.6 kg [N] ha−1 year−1. The conflict between the results is largely due to differences in the criteria for calculating the N balance assumed in the present study, in which N flows not considered in the FAO study [24] were included, along with mineralization of waste from previous crops ( N M R ). Together, these two flows accounted for an average of around 92 kg [N] ha−1 year−1 (Table 6).
In general, agricultural systems with persistent positive N balances (BN > 0) signal a condition of N accumulation, with a potential risk of excess Nr emissions into the environment. Meanwhile, persistent negative N balances (BN < 0) signal a condition of depletion of soil N reserves, with a potential risk of reducing soil fertility. The balances of N with persistent decays of |BN| point to a limit condition of equilibrium between the N supplied and the N released, here designated as |BN|~0.
The persistent accumulation of N in the annual N balances of the S P S S , C (around +57 kg [N] ha−1) favors asynchronism between the N supplied and the N demanded in the system, a phenomenon typically present whenever available N is greater than the N demanded by crops [48,49]. Because asynchronism maintains a positive correlation with N loss, as both grow in proportion to the amount of available N present in agricultural soil [50], strategies of gradual and progressive minimization of the BN indicator can contribute to the reduction of asynchronism and N losses.

3.2. N r a g Indicator ( N r Antropogenic Gross)

As defined by Equation (34), a n n u a l   a v e r a g e   N r a g was estimated at 213 kg [N] ha−1 by summing the average annual anthropogenic conversion rates of atmospheric N2 to Nr in the S P S S , C ( Q N F S + Q N F B ). N r a g represents the gross annual mean anthropogenic Nr created in the S P S S , C without discounting the Nr reconverted to atmospheric N2 form by denitrification. In 2020, the global Nr creation rate from N synthetic fertilizer applied plus biological fixation induced by cultivation was 149 Tg [N] year−1 [51]. By taking from Table 7 the value of N r a g for the year 2020 (243 kg [N] ha−1), multiplying by the planted area of S P S S , C in 2020 (7,293,491 ha) [26], and converting the result to units of Gg [N], we obtain N r a g (2020) equal to 1772 Gg [N], a value that corresponds to around 1.2% of the global anthropogenic Nr creation rate estimated [51]. Once created, N r a g remains active in the biosphere until it is sequestered or reconverted to the N2 form by denitrification [51].

3.3. N r a n Indicator ( N r Net Anthropogenic)

The average annual value of N r a n in the period of 2008 to 2020 was estimated at 204 kg [N] ha−1 by substituting in Equation (35) the results of the flows QNFS, QNFB, and SND extracted from Table 6. Defined by the difference between the annual anthropogenic conversion rate of atmospheric N2 to Nr, equal to (QNFB + QNFS), and the annual rate of reconversion of Nr to N2 via denitrification (SND), N r a n represents the net annual mean anthropogenic Nr created in the S P S S , C (called “new N r ”) and added to the global N cycle. The N r a n results shown in Table 7 (in kg [N] ha−1) and in Figure 3 (shown in Gg [N]) reinforce the persistent condition of Nr accumulation in the S P S S , C pointed out in the analysis of the BN balance (Section 3.1). The N r a n values in Figure 3 were calculated by multiplying the annual N r a n data from Table 7 by the respective annual planted areas from 2008 to 2020 [26] (Table 8) and converting the result into Gg [N] units.
The increase in N r a n has adverse agronomic and environmental effects: (i) loss of N supplied to the S P S S , C to the biosphere; (ii) limitation of efficiency in the use of N in the S P S S , C ; and (iii) accumulation of Nr in the terrestrial biosphere. Such effects are mainly caused by the intensification of the use of synthetic nitrogen fertilizers and the large-scale cultivation of plants from the Fabaceae family [7]. Throughout the pre-industrial Holocene period, the N cycle remained in a state of dynamic equilibrium, with the rates of conversion of atmospheric N2 to Nr balanced with the rates of reconversion of Nr to N2 via denitrification [5,52]. It was only from the second half of the 20th century that the effects of human activity began to dramatically affect the biogeochemical cycle of N. The average annual value of the N r a n , estimated here at around 204 kg [N] ha−1, poses important challenges for the environmental sustainability of the S P S S , C , given that: (1) the N r a n (created in the S S P S , C and added to the global N cycle) produces the “cascade effect” [6] as the sequential transfer of Nr through terrestrial environmental systems is capable of producing changes in these systems as Nr moves or is stored in them; and (2) the agronomic model practiced in S P S S , C is expanding, especially in Brazil and other countries in Latin America [51], which implies an increase in this “cascade effect”.
Denitrification plays a key role in removing Nr accumulated in agricultural soils by reconverting part of this Nr to its original N2 form. However, following the intermediate products of the nitrification and denitrification processes, there are several pathways of N loss, starting with the nitrification of ammonia/ammonium ( N H 3 / N H 4 + ) into nitrate ( N O 3 ), which can be reduced to nitrite ( N O 2 ), nitric oxide (NO), nitrous oxide (N2O), and finally dinitrogen (N2) by denitrification [44,45]. N losses occur mainly through volatilization of NH3, leaching of N O 3 , and emissions of NO, N2O, and N2. Nitrous oxide as a byproduct of denitrification is particularly important because it is a greenhouse gas with a global warming potential about 300 times greater than carbon dioxide (CO2), in addition to being the main contributor to the depletion of stratospheric ozone [14].

3.4. N l Indicator Related to N Losses in the S P S S , C

The indicator ( N l ) represents the average annual N loss from S P S S , C in the period of 2008 to 2020 due to volatilization, leaching/runoff, and denitrification. It was estimated at 30 kg [N] ha−1 by the sum of the flows S N V , S N L , and S N D (Section 2.3.6 and Section 2.3.7, Table 6 and Table 7). Of these 30 kg [N] ha−1 lost to the environment, around 1.4 kg [N] ha−1 (~5%) corresponds to the annual average of N2O emissions in the S P S S , C in N units (Table 4). Estimating the annual average of N2O emitted across the entire planted area of the S P S S , C in N2O units by multiplying 1.4 kg [N] ha−1 × 4,277,833 ha (annual planted areas in the period of 2008–2020) [26] × 44/28 (atomic mass ratio N2O/N) [31] × 10−6], we have about 9 Gg [N2O] annually emitted.
Part of the N accumulated in S P S S , C (including N not assimilated by the soybean and corn crops and the N immobilized in soil organic matter) is vulnerable to loss through volatilization, leaching/runoff, and denitrification [50]. Considering that the accumulation and loss of N in S P S S , C are positively correlated and both are factors limiting the efficiency in the use of N, we can assume that the minimization of indicators |BN| and N l is a requirement to maximize the N use efficiency in S P S S , C .

3.5. P u , S and P u , C Indicators (Productivities of Soybeans and Corn)

In the period from 2008 to 2020, the average annual productivity of soybeans ( P u , S ) in the soybean-corn succession system was 3112 kg ha−1 [26], higher than the average annual productivity of soybeans in the United States in the same period (3094 kg ha−1), ranked first in the world [23]. This is largely due to the high rate of the biological fixation of atmospheric N2 by Brazilian soybeans, around 80% of the total N assimilated [37,53]. The average annual productivity P u , C of corn (second crop) in the soybean-corn succession system was estimated at 5045 kg ha−1 in the same period [26], a value considered low when compared with the average annual corn productivity in the United States (10,223 kg ha−1) in the same period [23]. Although the value of Pu,C has increased from 3985 kg ha−1 in 2008 to 6064 kg ha−1 in 2020 [26], additional productivity gains are potentially possible by reducing N losses in the S P S S , C .

3.6. Agronomic Efficiency Index in N Use

As established in Section 2.4.5, E a g (agronomic efficiency index of the N use) represents the fraction of Q N S exported in soybeans and corn grains, expressed by the ratio ( N E p , S   + N E p , C )/ Q N S . Typically, crops with an insufficient supply of N respond positively to an increased supply of this nutrient. This occurs to the point where the incremental gains in N assimilation become small as crop productivity approaches its potential, [54] i.e., the environment without limitations, edaphoclimatic and nutritional, free from the action of pests and diseases, and with other stresses effectively controlled [55].
For the same soil and crop conditions, agronomic efficiency in N use tends to decrease with increasing N supply rate. In the soybean-corn succession, situations may occur in which the N available in the soil (including the biological N fixation by soybeans) is not sufficient to achieve the desired productivity and agronomic efficiency. This is the case, for example, of high productivity crops where synthetic nitrogen fertilizer (QNFS) is added to meet the greater demand for N. However, due to the high rate of N loss in the flows QNFS, high fertilization rates generate undesirable agronomic and environmental impacts [8,9,10]. The average annual value of agronomic efficiency ( E a g ), estimated at 0.71 (Table 7), possibly reflects the negative effect of N loss caused by accumulation and asynchrony between N supply and demand.
The E a g indicator can be better interpreted when applied in experiments using control plots (CPs) [47], in which it is possible to correlate the increase in E a g efficiency with the experimental treatments applied there.

3.7. Efficiency Indicator for Supplied N Retention

The E r e indicator (efficiency indicator for supplied N retention) represents the fraction of Q N S retained in the S P S S , C (fraction not lost to the environment), expressed by the ratio ( Q N S N l )/ Q N S . The average annual efficiency E r e was estimated at 0.90 (Table 7). As was proposed for the E a g indicator (Section 3.6), carrying out experiments in control plots (CPs) aiming to correlate the treatments applied there with the increase in Ere efficiency would also be recommended.

3.8. Strategies to Minimize the Lost N ( N l ) and Maximize the Agronomic ( E a g ) and Efficiency of N Retention

In the following subitems, we examine some of the key factors that influence the efficiency in the use of N in the S P S S , C and point out some measures/management strategies that are potentially capable of minimizing lost N and maximizing E a g and E r e efficiencies.

3.8.1. Improvement of the Quality of N Flux Estimation

The quality of estimates of N fluxes in the soil–plant system is crucial for reducing uncertainties in the results of agro-environmental indicators and for the success of strategies aimed at increasing efficiency in the use of N. Whenever possible, flux estimates of N must be performed based on data obtained from experimental field research. In the case of the S P S S , C , quantitative data on N extraction flows by soybeans, corn, and intercropped plants (when applicable), as well as organic N mineralization flows from residues from these crops, constitute important subsidies. Some methodologies and guidelines for estimating N fluxes in agricultural soils are already established in the technical literature [31]. They consolidate guidelines for implementing policies for monitoring and controlling N fluxes in agricultural soils. Research and support organizations for agricultural activity, such as universities, rural technical schools, and agriculture departments, can in many cases provide basic information on indexes and coefficients necessary for estimating the main N fluxes in soil–plant systems, mainly including average N extraction rates per hectare and per crop, biological N fixation rates by type of Fabaceae, and grain productivity. Many of the countries that are signatories to international conventions to reduce emissions of reactive N already produce national data on these emissions that are available systematically.
The greater the accuracy of the measurement/estimation methods of N fluxes in the S P S S , C , the lower the uncertainties in the indicator results.

3.8.2. Minimization of | B N | and N l

According to Table 7, the average annual result of | B N | (+57 kg [ N ] ha−1 year−1) and N l (30 kg [ N ] ha−1year−1) point to a persistent condition of accumulation and loss of N in the S P S S , C , considered as the limiting agronomic efficiency ( E a g ) and retention efficiency of supplied N ( E r e ). In this scenario, strategies to favor E a g and E r e via minimization of |BN| and Nl must be explored. Let us consider the use of small areas within the S P S S , C as experimental fields or control plots (CPs), cultivated with soybeans and corn in succession and direct planting, and under management conditions identical to those of S P S S , C   except for receiving decreasing doses of fertilizers. By comparison, it would be possible to evaluate the effect of reducing the Q N F S inputs on the indicators | B N |, N l , E a g , and E r e . At the end of the soybean and corn harvests, the N harvested in the grains of the soybean-corn succession system, respectively, N E p , S and N E p , C , as well as the N harvested in grain from the CPs, respectively, N E p , S p c and N E p , C c p , are calculated. The efficiencies E a g and E r e of the S P S S , C , as well as the efficiencies E a g p c and E r e p c of the CPs, can be estimated as shown below based on the definitions of Section 2.4.
Calculation of the Efficiencies E a g and E r e in the S P S S , C
E a g = N E p Q N S
E a g = ( N E p , S + N E p , C ) ( Q N F S + Q N E A + Q N D A + Q N F B + N R M )
E r e = ( Q N S N l ) / Q N S = ( Q N F S + Q N E A + Q N D A + Q N F B + N R M ) ( S N V + S N L + S N D ) ( Q N F S + Q N E A + Q N D A + Q N F B + N R M )
Calculation of the Efficiencies E a g and E r e in the CPs
E a g c p = N E p c p Q N S c p
E a g c p = ( N E p , S c p + N E p , C c p ) ( Q N F S c p + Q N E A c p + Q N D A + Q N F B + N M R )
E r e c p = ( Q N S c p N l c p ) Q N S c p
E r e c p = ( Q N F S c p + Q N E A c p + Q N D A + Q N F B + N M R ) ( S N V c p + S N L c p + S N D c p ) ( Q N F S c p + Q N E A c p + Q N D A + Q N F B + N M R )
Persistent positive results of the differences between ( E a g c p E a g ) e ( E r e c p E r e ) signalize gains in the efficiencies E a g c p and E r e c p in the CPs in relation to the efficiencies E a g and E r e in the S P S S , C .
Alternatively, assuming that the productivity of soybean and corn grains per unit of N supplied (QNS) has a positive correlation with the N assimilated by crops [50,56], gains or losses in N use efficiency in the experiments applied to the CPs could be evaluated by the difference between the productivity of the CPs [ ( P u , S c p + P u , C c p ) / Q N S c p ] and the productivity of the S P S S , C   [ ( P u , S + P u , C ) / Q N S ] per unit of supplied N.
Through the definition of the agronomic efficiency of N use given in Section 2.4.5, we have:
P u , S c p + P u , C c p Q N S c p = ( P u , S c p + P u , C c p ) ( Q N F S c p + Q N E A c p + Q N D A + Q N F B + N M R )
  ( P u , S + P u , C ) Q N S = ( P u , S   + P u , C ) ( Q N F S + Q N E A ) + Q N D A + Q N F B + N M R
Persistent positive results of the difference [( P u , S c p + P u , C c p ) / Q N S c p ] [ ( P u , S + P u , C ) / Q N S ] indicate an increase in the total N assimilated by the grains per unit of Q N S , an increase in the agronomic efficiency of N, and an increase in the agronomic efficiency in the N use in relation to the S P S S , C .

3.8.3. Reduction of the Asynchrony between N Supply and Demand

The asynchrony between N supply and demand is one of the main causes of N loss in agricultural systems, and its minimization should be seen as a key point for maximizing efficiency in the use of N [50]. The asynchronism associated with the risks of N loss and environmental degradation can be reduced through strategies that can benefit increasing N demand, manipulating N supply, and capturing surplus inorganic N before it is lost [48]. It was reported that second-crop corn has low N absorption efficiency, but when intercropping corn with ruzigrass (Urochloa ruziziensis), a neutral N balance was achieved at a dose of 130 kg [N] ha−1 [57], which highlights the capacity of practicing management techniques such as intercropping to mitigate N loss in the system.
Experiments using control plots, differentiated from S P S S , C by the cultivation of off-season corn intercropped with plants that have temporal N demands that are out of step with corn, compete less with each other and thus contribute to the reduction of asynchronism by increase in N demand. Experiments with a gradual reduction in N fertilization proposed in Section 3.8.2 represent strategies for manipulating the N supply [10,58,59]. Another strategy that appears promising in capturing N susceptible to loss due to asynchronism in the   S P S S , C is the cultivation of sun hemp (Crotalaria spectabilis) in intercropping with off-season corn [60]. It is a species that is resistant to climate variations, beneficial to the soil–plant system due to the amount of biomass produced [61], and that does not compromise corn harvest and productivity [60].

3.8.4. Estimation of Potentially Mineralizable N

The mineralization of soil organic matter (SOM) constitutes a source of N supply for maintaining the fertility and sustainability of the soil–plant system. Of all N H 4 + (ammonium) released in SOM mineralization, commonly referred to as raw mineralized N in the technical literature, part of it is temporarily immobilized in the soil microbial mass (immobilized N). The difference between gross mineralized N and immobilized N is usually assumed as net mineralized N, that is, the N potentially available to be assimilated by crops. This conceptualization is based on the premise that plant roots lose out to the soil’s microbial fauna in the competition for N H 4 + and, therefore, the roots would be able to assimilate only the N H 4 + that exceeds what was demanded by the microbes (liquid mineralized N). However, recent research has challenged this premise, demonstrating that plants can effectively compete with microbes [41,62,63,64].
An experiment carried out in rotational soybean and corn crops [41] showed a gross mineralization rate 3.4 to 4.5 times higher than the peak N assimilation rate by corn. Direct measurements of the rate of mineralized N H 4 + allow for estimates closer to the real availability of soil N than tests to determine net mineralized N [41]. The availability of N in agricultural soils, referred to as potentially mineralizable N (PMN), can be considered as an indicator of soil health, fundamental for management strategies of soil–plant systems aimed at maximizing N use efficiency [65]. PMN estimates allow for predictions of N availability during the crop cycle. The effects of the most common management practices in conservation agriculture on PMN, including direct planting in rotation/succession systems, crop diversification, the use of Fabaceae as cover crops, and other practices, was reported in a meta-analysis study [66]. Overall, conservation practices consistently increased PMN and agricultural productivity. Some of these practices are already used successfully in the soybean-corn succession system, such as the direct planting system (no till) of soybean and off-season corn succession.
PMN is determined by the fraction of SOM mineralized in the form of inorganic N assimilable by plants under controlled laboratory incubation conditions [66]. The most widely applied standard method for its estimation is long-term aerobic incubation using the exponential function N t = N 0 ( 1 e k t ) , where Nt is the mineralized N measured at time t, N0 is the maximum mineralizable N, and k is the mineralization rate [65]. More simplified and short-term chemical methods for measuring N availability are gaining importance. Among them, the Illinois Soil Nitrogen Test (ISNT) method [67] and the direct steam distillation method [68] stand out.

4. Conclusions

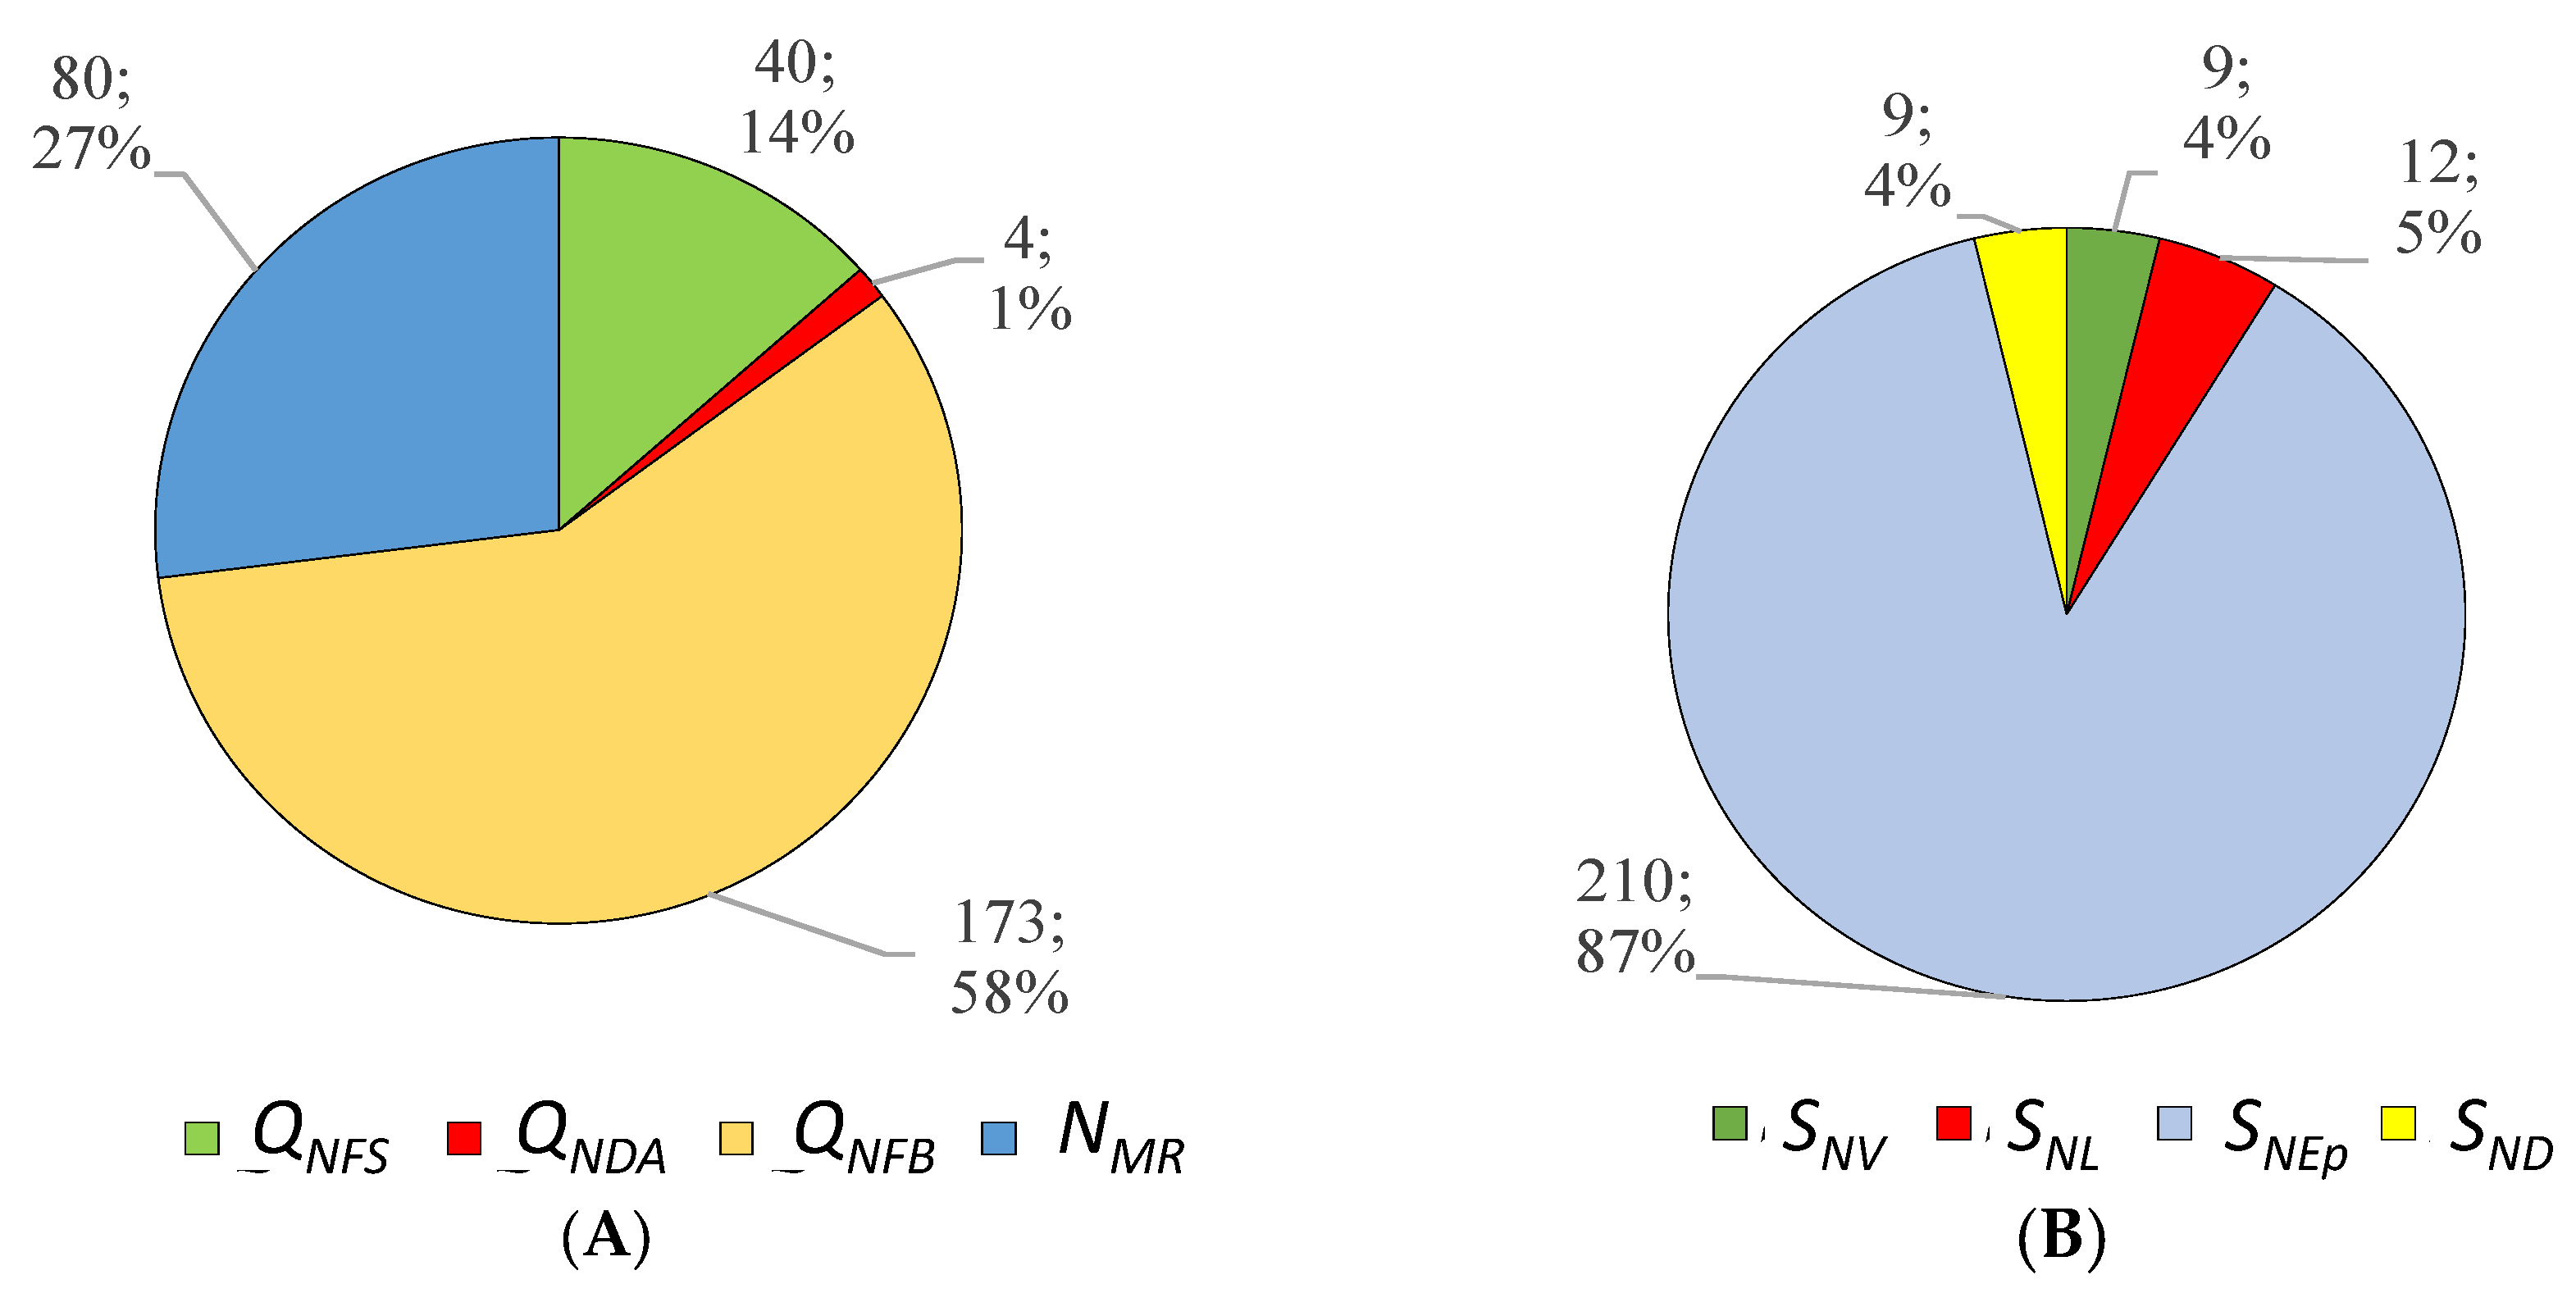
The average annual results of the N balance (| B N |) and N lost ( N l ) indicators, respectively, +57 kg [N] ha−1 and 30 kg [N] ha−1, point to a persistent condition of accumulation and loss of N in S P S S , C by volatilization, leaching/runoff, and denitrification.
The average annual results of the agronomic efficiency ( E a g ) and N retention ( E r e ) indicators, 0.71 and 0.90, respectively, reflect the negative effects of N accumulation and loss in the S P S S , C .
Despite the results of B N and N l representing factors limiting efficiency in the use of N, there are spaces of opportunity in the soybean-corn succession system for the implementation of management strategies aimed at reducing | B N | and N l with increased efficiencies E a g and E r e .
The use of experiments in control plots in which it is possible to correlate the results of the experiments with gains in efficiency in the use of N can be an effective strategy in the medium and long term.
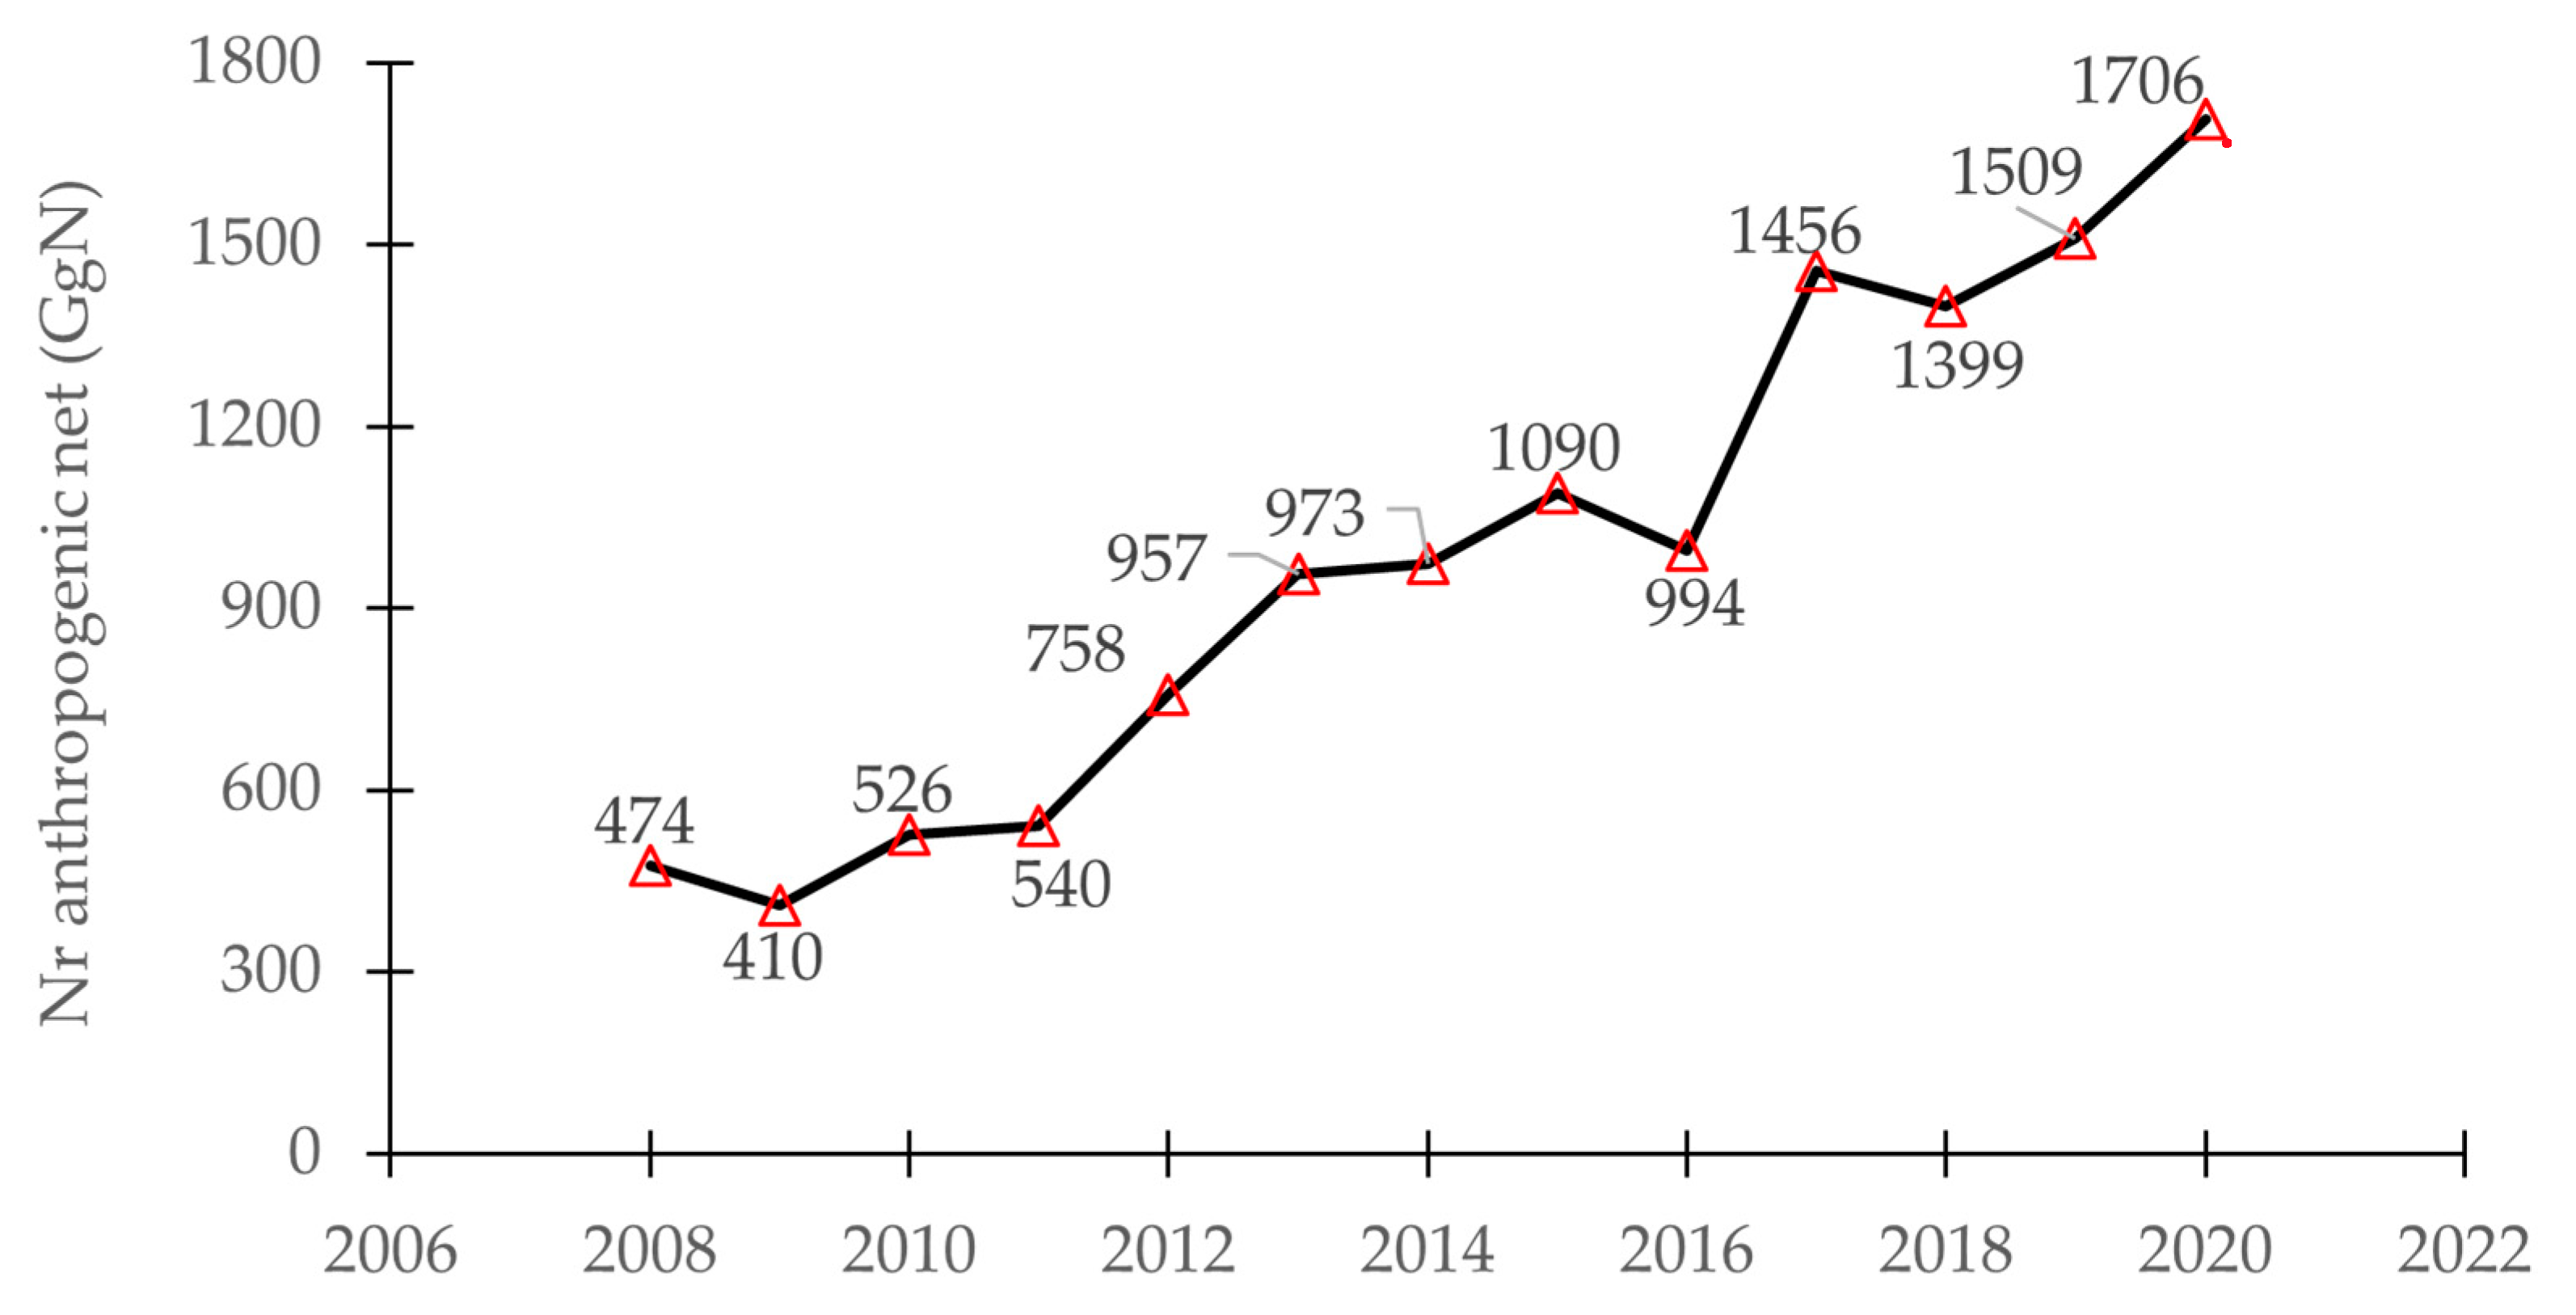
Two key questions about the environmental sustainability of S P S S , C must be considered in future research: The first concerns the “cascading effect” caused by anthropogenic Nr created in the S P S S , C and added to the global N cycle (Nran), around 204 kg [N] ha−1. This effect tends to increase, given the expectation of expansion of the soybean-corn succession agricultural model, especially in Latin America and other similar tropical environments; The second question refers to the average annual emission of N2O, here estimated at ~11 Gg [N2O] for the total area studied.

Author Contributions

Conceptualization, C.R.P. and D.D.N.; methodology, C.R.P. and D.D.N.; validation, F.G.E.R. and K.R.; formal analysis, R.C.U., C.R.P., K.R., T.T., C.M.H. and C.A.R.; investigation, F.G.E.R., C.M.H. and C.A.R.; resources, C.R.P.; data curation, F.G.E.R., C.R.P., C.M.H. and C.A.R.; writing—original draft preparation, F.G.E.R., C.R.P. and D.D.N.; writing—review and editing, R.C.U., T.T., C.R.P. and D.D.N.; visualization, F.G.E.R., C.R.P., R.C.U., K.R. and D.D.N.; supervision, C.R.P.; project administration, F.G.E.R. and C.R.P. All authors have read and agreed to the published version of the manuscript.

Funding

This research was funded by the Coordination for the Improvement of Higher Education Personnel (CAPES, Brazil) and National Council for Scientific and Technological Development (CNPq, Brazil).

Institutional Review Board Statement

Not applicable.

Data Availability Statement

Data supporting the conclusions of this article will be made available by the authors on request.

Conflicts of Interest

The authors declare no conflicts of interest.

Appendix A

Table A1. Symbols, descriptions, and units.
SymbolDescriptionUnitSymbolDescriptionUnit
Eag cpEfficiency Eag in the control plot (CP)-NrReactive nitrogen-
Ere cpEfficiency Ere in the control plot (CP)-NragAnthropogenic reactive nitrogen (gross)kg [N] ha−1
EagAgronomic N use efficiency in the SPSS,C-NranAnthropogenic reactive nitrogen (net)kg [N] ha−1
EreEfficiency for supplied N retention in the SPSS,C-PMNPotentially mineralizable N-
BNN mass balancekg [N] ha−1Pu,CAnnual average corn productivitykg ha−1
BNFBiological nitrogen fixation-Pu,SAnnual average soybean productivitykg ha−1
CCN concentration in the corn grain-QNDAN entries via atmospheric depositionkg [N] ha−1
CSN concentration in the soybean grain-QNEAN entries via animal excretakg [N] ha−1
IBGEBrazilian Institute of Geography and Statistics-QNFBN entries via biological fixationkg [N] ha−1
MSMato Grosso do Sul (Brazilian State)-QNFSN entries via synthetic fertilizerkg [N] ha−1
MTMato Grosso (Brazilian state)-QNSTotal amount of N supplied to the SPSS,Ckg [N] ha−1
NNitrogen-QNTTotal amount of N entrieskg [N] ha−1
N2Molecular form of atmospheric N-SNDN output via denitrificationkg [N] ha−1
N2ONitrous oxide-SNEpN outputs via export of soybean and corn grainskg [N] ha−1
NEtTotal N extracted by crops (soybean + corn)kg [N] ha−1SNEp, CN outputs via export of corn grainskg [N] ha−1
NEt, CN extracted by scornkg [N] ha−1SNEp, SN outputs via export of soybean grainskg [N] ha−1
NEt, SN extracted by soybeankg [N] ha−1SNLN outputs via leaching/hydrologic runoffkg [N] ha−1
NH3Ammonia-SNTTotal amount of N outputskg [N] ha−1
NH4+Ammonium-SNVN outputs via volatilizationkg [N] ha−1
NMRMineralized N from previous crops residueskg [N] ha−1SOMSoil organic matter-
NMR, CMineralized N from corn residueskg [N] ha−1SPSS,CSoil plant system (soybean-corn)-
NMR, SMineralized N from soybean residueskg [N] ha−1YCAnnual fraction of corn organic N that is mineralized-
NO3Nitrate-YSAnnual fraction of soybeans organic N that is mineralized-
NORTotal organic N accumulated in the predecessor crops (soybean + corn)kg [N] ha−1𝜷CN fertilizer added to corn crop for each Mg ha−1 of expected productivity of grains producedkg [N] ha−1
NOR, COrganic N accumulated in the roots, stems and leaves of the predecessor corn cropkg [N] ha−1𝜷SN uptake by soybean cropkg [N] ha−1
NOR, SOrganic N accumulated in the roots, stems and leaves of the predecessor soybean cropkg [N] ha−1μCCorn grain moisture%
NOxNitrogen oxides (NO and NO2)-μSSoybean grain moisture%

References

  1. Sutton, M.A.; Howard, C.M.; Kanter, D.R.; Lassaletta, L.; Móring, A.; Raghuram, N.; Read, N. The Nitrogen Decade: Mobilizing Global Action on Nitrogen to 2030 and Beyond. One Earth 2021, 4, 10–14. [Google Scholar] [CrossRef]
  2. Liu, X.; Hu, B.; Chu, C. Nitrogen Assimilation in Plants: Current Status and Future Prospects. J. Genet. Genomics. Inst. Genet. Dev. Biol. 2022, 49, 394–404. [Google Scholar] [CrossRef]
  3. Anas, M.; Liao, F.; Verma, K.K.; Sarwar, M.A.; Mahmood, A.; Chen, Z.L.; Li, Q.; Zeng, X.P.; Liu, Y.; Li, Y.R. Fate of Nitrogen in Agriculture and Environment: Agronomic, Eco-Physiological and Molecular Approaches to Improve Nitrogen Use Efficiency. Biol. Res. 2020, 53, 47. [Google Scholar] [CrossRef] [PubMed]
  4. Robertson, G.P.; Groffman, P.M. Nitrogen Transformations. In Soil Microbiology, Ecology and Biochemistry, 3rd ed.; Elsevier: Amsterdam, The Netherlands, 2006; pp. 341–364. [Google Scholar] [CrossRef]
  5. Ayres, R.U.; Schlesinger, W.H.; Socolow, R.H. Human impacts on the carbon and nitrogen cycles. In Industrial Ecology and Global Change; Cambridge University Press: Cambridge, UK, 1994; pp. 121–155. [Google Scholar] [CrossRef]
  6. Galloway, J.N. The global nitrogen cycle. Treatise Geochem. 2003, 8, 557–583. [Google Scholar] [CrossRef]
  7. Fowler, D.; Coyle, M.; Skiba, U.; Sutton, M.A.; Cape, J.N.; Reis, S.; Sheppard, L.J.; Jenkins, A.; Grizzetti, B.; Galloway, J.N.; et al. The global nitrogen cycle in the twenty-first century. Philos. Trans. R. Soc. Lond. B Biol. Sci. 2013, 368, 20130164. [Google Scholar] [CrossRef]
  8. Tilman, D.; Cassman, K.G.; Matson, P.A.; Naylor, R.; Polasky, S. Agricultural sustainability and intensive production practices. Nature 2002, 418, 671–677. [Google Scholar] [CrossRef]
  9. Ladha, J.K.; Pathak, H.; Krupnik, T.J.; Six, J.; Van Kessel, C. Efficiency of fertilizer nitrogen in cereal production: Retrospects and prospects. Adv. Agron. 2005, 87, 85–156. [Google Scholar] [CrossRef]
  10. Greer, K.D.; Pittelkow, C.M. Linking nitrogen losses with crop productivity in maize agroecosystems. Front. Sustain. Food Syst. 2018, 2, 29. [Google Scholar] [CrossRef]
  11. Eickhout, B.; Bouwman, A.V.; Van Zeijts, H. The role of nitrogen in world food production and environmental sustainability. Agric. Ecosyst. Environ. 2006, 116, 4–14. [Google Scholar] [CrossRef]
  12. Erisman, J.W.; Galloway, J.N.; Seitzinger, S.; Bleeker, A.; Dise, N.B.; Petrescu, A.R.; Leach, A.M.; De Vries, W. Consequences of human modification of the global nitrogen cycle. Philos. Trans. R. Soc. Lond. B Biol. Sci. 2013, 368, 20130116. [Google Scholar] [CrossRef]
  13. Follett, R.F.; Hatfield, J.L. Nitrogen in the environment: Sources, problems, and management. Sci. World J. 2001, 1, 920–926. [Google Scholar] [CrossRef] [PubMed]
  14. Ravishankara, A.R.; Daniel, J.S.; Portmann, R.W. Nitrous oxide (N2O): The dominant ozone-depleting substance emitted in the 21st century. Science 2009, 326, 123–125. [Google Scholar] [CrossRef]
  15. Vitousek, P.M.; Aber, J.D.; Howarth, R.W.; Likens, G.E.; Matson, P.A.; Schindler, D.W.; Schlesinger, W.H.; Tilman, D.G. Human alteration of the global nitrogen cycle: Sources and consequences. Ecol. Appl. 1997, 7, 737–750. [Google Scholar] [CrossRef]
  16. Howarth, R.W.; Sharpley, A.; Walker, D. Sources of nutrient pollution to coastal waters in the United States: Implications for achieving coastal water quality goals. Estuaries 2002, 25, 656–676. [Google Scholar] [CrossRef]
  17. Rockström, J.; Steffen, W.; Noone, K.; Persson, Å.; Chapin Iii, F.S.; Lambin, E.; Lenton, T.M.; Scheffer, M.; Folke, C.; Schellnhuber, H.J.; et al. Planetary boundaries: Exploring the safe operating space for humanity. Ecol. Soc. 2009, 14, 32. [Google Scholar] [CrossRef]
  18. Pikaar, I.; Matassa, S.; Rabaey, K.; Laycock, B.; Boon, N.; Verstraete, W. The urgent need to re-engineer nitrogen-efficient food production for the planet. In Managing Water, Soil and Waste Resources to Achieve Sustainable Development Goals; Springer: Berlin/Heidelberg, Germany, 2018; pp. 35–69. [Google Scholar] [CrossRef]
  19. He, W.; Jiang, R.; He, P.; Yang, J.; Zhou, W.; Ma, J.; Liu, Y. Estimating soil nitrogen balance at regional scale in China’s croplands from 1984 to 2014. Agric. Syst. 2018, 167, 125–135. [Google Scholar] [CrossRef]
  20. Xu, M.; Zhang, Y.; Wang, Y.; Wang, L.; Bai, Y.; Lu, Y. Optimizing nitrogen input and nitrogen use efficiency through soil nitrogen balance in a long-term winter wheat-summer maize rotation system in North China. Eur. J. Agron. 2023, 149, 126908. [Google Scholar] [CrossRef]
  21. Tan, M.; Hou, Y.; Zhang, L.; Shi, S.; Long, W.; Ma, Y.; Zhang, T.; Oenema, O. Nutrient use efficiency of intensive dairy farms in China-Current situation and analyses of options for improvement. Agric. Syst. 2022, 203, 103495. [Google Scholar] [CrossRef]
  22. Fernanda Gonzalez, M.; Golombek, K.; Hansen, J.; Iqbal, A.; Asif Ali, M.; Hahn, E.; Samaniego, R.; Ramirez Dominguez, F.; Ilustre, R.P.; Fertilizer, A.; et al. Fertilizer Use by Crop and Country for the 2017–2018 Period; International Fertilizer Association (IFA): Paris, France, 2022. [Google Scholar] [CrossRef]
  23. FAO. Food and Agriculture Organization. Fertilizer Use by Crop in Brazil. Available online: https://www.fao.org/3/y5376e/y5376e00.htm (accessed on 12 February 2024).
  24. Ludemann, C.I.; Gruere, A.; Heffer, P.; Dobermann, A. Global data on fertilizer use by crop and by country. Sci. Data 2022, 9, 501. [Google Scholar] [CrossRef]
  25. IBGE. Instituto Brasileiro de Geografia e Estatística. Anuários Estatísticos do Brasil (2008–2020); IBGE: Rio de Janeiro, Brazil, 2020. [Google Scholar]
  26. Garcia, R.A.; Ceccon, G.; Sutier, G.A.D.S.; Santos, A.L.F.D. Soybean-corn succession according to seeding date. Pesqui. Agropecu. Bras. 2018, 53, 22–29. [Google Scholar] [CrossRef]
  27. Alvares, C.A.; Stape, J.L.; Sentelhas, P.C.; Gonçalves, J.D.M.; Sparovek, G. Köppen’s climate classification map for Brazil. Meteorol. Z. 2013, 22, 711–728. [Google Scholar] [CrossRef]
  28. EMBRAPA. “Mapa de Solos do Brasil”—“Soil Map of Brazil”. Available online: https://geoinfo.cnps.embrapa.br/layers/geonode%3Abrasil_solos_5m_20201104 (accessed on 12 February 2024).
  29. CONAB. “Safras—Série Histórica” = Crops—Historical Set. Available online: https://www.conab.gov.br/info-agro/safras/serie-historica-das-safras (accessed on 12 February 2024).
  30. FAOSTAT. Crops and Livestock Products. Available online: http://www.fao.org/faostat/en/#compare (accessed on 12 February 2024).
  31. IPCC. Guidelines for National Greenhouse Gas Inventories. In National Greenhouse Gas Inventory Program; Eggleston, S., Buendia, L., Miwa, K., Ngara, T., Tanabe, K., Eds.; Institute for Global Environmental Strategies: Hayama, Japan, 2006; Chapter 11—N2O Emissions from Managed Soils, and CO2 Emissions from Lime and Urea Application, Volume 4; Available online: https://www.ipcc-nggip.iges.or.jp/public/2006gl/index.html (accessed on 13 February 2024).
  32. Alves, B.J.R. Relatório de Referência Setorial, III Inventário—Agricultura. Emissões de Óxido Nitroso de Solos Agrícolas e de Manejo de Dejetos = Sector Reference Report, III Inventory—Agriculture; Nitrous Oxide Emissions from Agricultural Soils and Waste Management: Brasilia, Brazil, 2015. (In Portuguese) [Google Scholar]
  33. de Freitas, V.F.; Cerezini, P.; Hungria, M.; Nogueira, M.A. Strategies to Deal with Drought-Stress in Biological Nitrogen Fixation in Soybean. Appl. Soil Ecol. 2022, 172, 104352. [Google Scholar] [CrossRef]
  34. Coelho, A.M.; de RESENDE, A.V. Exigências Nutricionais e Adubação do Milho Safrinha; Embrapa Milho e Sorgo: Sete Lagoas, Brazil, 2008. [Google Scholar]
  35. Filoso, S.; Martinelli, L.A.; Howarth, R.W.; Boyer, E.W.; Dentener, F. Human activities changing the nitrogen cycle in Brazil. Biogeochemistry 2006, 79, 61–89. [Google Scholar] [CrossRef]
  36. Zilli, J.É.; Pacheco, R.S.; Gianluppi, V.; Smiderle, O.J.; Urquiaga, S.; Hungria, M. Biological N2 Fixation and Yield Performance of Soybean Inoculated with Bradyrhizobium. Nutr. Cycl. Agroecosyst. 2021, 119, 323–336. [Google Scholar] [CrossRef]
  37. Herridge, D.F.; Peoples, M.B.; Boddey, R.M. Global inputs of biological nitrogen fixation in agricultural systems. Plant Soil 2008, 311, 1–18. [Google Scholar] [CrossRef]
  38. Gonçalves, S.L.; Saraiva, O.F.; Franchini, J.C.; Torres, E. Decomposição de Resíduos de Milho e Soja em Função do Tempo e Do Manejo Do Solo; Embrapa-CNPSo: Londrina, Brasil, 2010; Available online: https://ainfo.cnptia.embrapa.br/digital/bitstream/item/31179/1/Boletim-PD-3.pdf (accessed on 13 February 2024).
  39. Grassini, P.; Cafaro La Menza, N.; Rattalino Edreira, J.I.; Monzón, J.P.; Tenorio, F.A.; Specht, J.E. Soybean. In Crop Physiology Case Histories for Major Crops; Elsevier: Amsterdam, The Netherlands, 2020; pp. 282–319. [Google Scholar] [CrossRef]
  40. Otegui, M.E.; Cirilo, A.G.; Uhart, S.A.; Andrade, F.H. Maize. In Crop Physiology Case Histories for Major Crops; Elsevier: Amsterdam, The Netherlands, 2020; pp. 2–43. [Google Scholar] [CrossRef]
  41. Osterholz, W.R.; Rinot, O.; Liebman, M.; Castellano, M.J. Can mineralization of soil organic nitrogen meet maize nitrogen demand? Plant Soil 2016, 415, 73–84. [Google Scholar] [CrossRef]
  42. Mary, B.; Recous, S.; Darwis, D.; Robin, D. Interactions between decomposition of plant residues and nitrogen cycling in soil. Plant Soil 1996, 181, 71–82. [Google Scholar] [CrossRef]
  43. Zaman, M.; Nguyen, M.L.; Šimek, M.; Nawaz, S.; Khan, M.J.; Babar, M.N.; Zaman, S. Emissions of Nitrous Oxide (N2O) and Di-Nitrogen (N2) from the Agricultural Landscapes, Sources, Sinks, and Factors Affecting N2O and N2 Ratios; IntechOpen: London, UK, 2012; pp. 3–32. [Google Scholar] [CrossRef]
  44. Hofstra, N.; Bouwman, A.F. Denitrification in Agricultural Soils: Summarizing Published Data and Estimating Global Annual Rates. Nutr. Cycl. Agroecosys. 2005, 72, 267–278. [Google Scholar] [CrossRef]
  45. Scheer, C.; Fuchs, K.; Pelster, D.E.; Butterbach-Bahl, K. Estimating global terrestrial denitrification from measured N2O:(N2O + N2) product ratios. Curr. Opin. Env. Sust. 2020, 47, 72–80. [Google Scholar] [CrossRef]
  46. Ryden, J.C.; Lund, L.J.; Letey, J.; Focht, D.D. Direct measurement of denitrification loss from soils: II. Development and application of field methods. Soil Sci. Soc. Am. J. 1979, 43, 110–118. [Google Scholar] [CrossRef]
  47. Congreves, K.A.; Otchere, O.; Ferland, D.; Farzadfar, S.; Williams, S.; Arcand, M.M. Nitrogen Use Efficiency Definitions of Today and Tomorrow. Front. Plant Sci. 2021, 12, 637108. [Google Scholar] [CrossRef] [PubMed]
  48. Crews, T.E.; Peoples, M.B. Can the synchrony of nitrogen supply and crop demand be improved in legume and fertilizer-based agroecosystems? A review. Nutr. Cycl. Agroecosys. 2005, 72, 101–120. [Google Scholar] [CrossRef]
  49. Fan, Z.; Zhao, Y.; Chai, Q.; Zhao, C.; Yu, A.; Coulter, J.A.; Gan, Y.; Cao, W. Synchrony of nitrogen supply and crop demand are driven via high maize density in maize/pea strip intercropping. Sci. Rep. 2019, 9, 10954. [Google Scholar] [CrossRef]
  50. Cassman, K.G.; Dobermann, A.; Walters, D.T. Agroecosystems, nitrogen-use efficiency and nitrogen management. AMBIO A J. Hum. Environ. 2002, 31, 132–140. [Google Scholar] [CrossRef]
  51. Galloway, J.N.; Bleeker, A.; Erisman, J.W. The human creation and use of reactive nitrogen: A global and regional perspective. Annu. Rev. Environ. Resour. 2021, 46, 255–288. [Google Scholar] [CrossRef]
  52. Galloway, J.N.; Schlesinger, W.H.; Levy, H.; Michaels, A.; Schnoor, J.L. Nitrogen fixation: Anthropogenic enhancement-environmental response. Glob. Biogeochem. Cycles 1995, 9, 235–252. [Google Scholar] [CrossRef]
  53. Herridge, D.F.; Giller, K.E.; Jensen, E.S.; Peoples, M.B. Quantifying country-to-global scale nitrogen fixation for grain legumes II. Coefficients, templates and estimates for soybean, groundnut and pulses. Plant Soil 2022, 474, 1–15. [Google Scholar] [CrossRef]
  54. Evans, L.T.; Fischer, R.A. Yield potential: Its definition, measurement, and significance. Crop Sci. 1999, 39, 1544–1551. [Google Scholar] [CrossRef]
  55. Reynolds, M.P.; Braun, H.J. Wheat Improvement: Food Security in a Changing Climate; Springer International Publishing: New York, NY, USA, 2022. [Google Scholar] [CrossRef]
  56. Zambon, L.M.; Umburanas, R.C.; Schwerz, F.; Sousa, J.B.; Barbosa, E.S.T.; Inoue, L.P.; Dourado-Neto, D.; Reichardt, K. Nitrogen balance and gap of a high yield tropical soybean crop under irrigation. Front. Plant Sci 2023, 14, 1233772. [Google Scholar] [CrossRef]
  57. Balbinot Junior, A.A.; Coelho, A.E.; Sangoi, L.; Debiasi, H.; Franchini, J.C. Soybean-Maize Off-Season Double Cropping System as Affected by Maize Intercropping with Ruzigrass and Nitrogen Rate. Int. J. Plant Prod. 2023, 17, 715–728. [Google Scholar] [CrossRef]
  58. Umburanas, R.C.; de Souza, M.P.; Koszalka, V.; Eurich, K.; Lopes, É.C.P.; Camilo, E.L.; de Ávila, F.W.; Müller, M.M.L. Long-Term Impact of Gypsum and Nitrogen Levels on Soil Chemical Properties and Maize Forage and Grain Yield under No-Tillage in a Subtropical Region. Int. J. Plant Prod. 2023, 17, 147–164. [Google Scholar] [CrossRef]
  59. Coelho, A.E.; Sangoi, L.; Balbinot, A.A.; Fioreze, S.L.; Berghetti, J.; Kuneski, H.F.; Leolato, L.S.; Martins, M.C. Growth Patterns and Yield of Maize (Zea Mays) Hybrids as Affected by Nitrogen Rate and Sowing Date in Southern Brazil. Crop Pasture Sci 2020, 71, 976–986. [Google Scholar] [CrossRef]
  60. de Souza, S.S.; Couto Júnior, P.A.; Flôres, J.D.A.; Coelho, A.P.; Lemos, L.B. Do the Intercropping with Crotalaria Spectabilis and Urochloa Ruziziensis Reduce the Maize Agronomic Performance? Pesqui. Agropecu. Trop. 2022, 52, e70513. [Google Scholar] [CrossRef]
  61. Berriel, V.; Monza, J.; Perdomo, C.H. Cover Crop Selection by Jointly Optimizing Biomass Productivity, Biological Nitrogen Fixation, and Transpiration Efficiency: Application to Two Crotalaria Species. Agronomy 2020, 10, 1116. [Google Scholar] [CrossRef]
  62. Schimel, J.P.; Bennett, J. Nitrogen mineralization: Challenges of a changing paradigm. Ecology 2004, 85, 591–602. [Google Scholar] [CrossRef]
  63. Inselsbacher, E.; Umana, N.H.N.; Stange, F.C.; Gorfer, M.; Schüller, E.; Ripka, K.; Zechmeister-Boltenstern, S.; Hood-Novotny, R.; Strauss, J.; Wanek, W. Short-term competition between crop plants and soil microbes for inorganic N fertilizer. Soil Biol. Biochem. 2010, 42, 360–372. [Google Scholar] [CrossRef]
  64. Osterholz, W.R.; Rinot, O.; Shaviv, A.; Linker, R.; Liebman, M.; Sanford, G.; Strock, J.; Castellano, M.J. Predicting gross nitrogen mineralization and potentially mineralizable nitrogen using soil organic matter properties. Soil Sci. Soc. Am. J. 2017, 81, 1115–1126. [Google Scholar] [CrossRef]
  65. Schomberg, H.H.; Wietholter, S.; Griffin, T.S.; Reeves, D.W.; Cabrera, M.L.; Fisher, D.S.; Endale, D.M.; Novak, J.M.; Balkcom, K.S.; Raper, R.L.; et al. Assessing indices for predicting potential nitrogen mineralization in soils under different management systems. Soil Sci. Soc. Am. J. 2009, 73, 1575–1586. [Google Scholar] [CrossRef]
  66. Mahal, N.K.; Castellano, M.J.; Miguez, F.E. Conservation agriculture practices increase potentially mineralizable nitrogen: A meta-analysis. Soil Sci. Soc. Am. J. 2018, 82, 1270–1278. [Google Scholar] [CrossRef]
  67. Khan, S.A.; Mulvaney, R.L.; Hoeft, R.G. A simple soil test for detecting sites that are nonresponsive to nitrogen fertilization. Soil Sci. Soc. Am. J. 2001, 65, 1751–1760. [Google Scholar] [CrossRef]
  68. Roberts, T.L.; Norman, R.J.; Slaton, N.A.; Wilson, J.R.C.E.; Ross, W.J.; Bushong, J.T. Direct steam distillation as an alternative to the Illinois soil nitrogen test. Soil Sci. Soc. Am. J. 2009, 73, 1268–1275. [Google Scholar] [CrossRef]
Figure 1. N macrofluxes in the soil–plant system of the soybean-corn succession ( S P S S , C ). Q N F S refers to N entries as synthetic fertilizers, Q N D A to N entries via atmospheric deposition in the molecular forms N O y ( N O, N O 2 , and H N O 3 ) and N H x ( N H 3 and N H 4 + ), Q N E A to N entries via animal excreta, Q N F B   t o   N entries via biologic fixation of atmospheric N2 by the soybean crop, S N T to total N outcome, S N E p to N outcomes via grain export of soybeans and corn, S N V to N outcomes via volatilization in the forms N H 3 , NO, and N 2 O , S N L to N outcomes via lixiviation/hydrologic runoff in the form N O 3 , and S N D to N outcomes via denitrification by eliminating N2 and N 2 O . N M R represents the annual average mineralized N from the organic root, stem, and leaf residues of the previous crops. N E t represents the total N extracted from soil by crops.
Nitrogen 05 00016 g001
Figure 2. (A) Distribution of the input fluxes of N in the S P S S , C ; (B) distribution of the output fluxes of N in the S P S S , C . Both data averaged between 2008 and 2020. QNFS, N entries via synthetic fertilizer; QNDA, N entries via atmospheric deposition; QNFB, N entries via biological fixation; NMR, mineralized N from previous crops residues; SNV, N outputs via volatilization; SNL, N outputs via leaching/hydrologic runoff; SNep, N outputs via export of soybean and corn grains; and SND, N output via denitrification.
Nitrogen 05 00016 g002
Figure 3. Annual values of net anthropogenic reactive nitrogen ( N r a n ) (Gg [N]) established in the soil–plant system of soybean-corn ( S P S S , C ) in the period from 2008 to 2020 in the Mato Grosso do Sul and Mato Grosso states, Brazil.
Nitrogen 05 00016 g003
Table 1. Average annual productivity of corn crops ( P u , C , kg ha−1), referring to the second harvest (off-season) and corresponding to the estimated average annual quantity of fertilizer synthetic nitrogen (QNFS, kg ha−1) applied from 2008 to 2020.
Parameter2008200920102011201220132014201520162017201820192020
P u , C 3985407640833878551855765320595939195989530659166064
Q N F S 31323230434442473147424647
Productivity data obtained from the IBGE [26].
Table 2. Average annual productivity of soybean crops ( P u , S , kg ha−1) and biological nitrogen fixation (QNFB, kg [N] ha−1) in Brazil in the period 2008 to 2020.
Parameter2008200920102011201220132014201520162017201820192020
P u , S 2971284230373123294629443031310829423338343632323510
Q N F B 165158169174164164169173164186191180195
Productivity data obtained from the IBGE [26].
Table 3. Average annual values (kg [ N ] ha−1) of N E t (total N extracted by soybeans and corn); N E p equal to S N E p (total N exported,); N O R (organic N); N M R (mineralized N from N O R ).
2008200920102011201220132014201520162017201820192020Avg.
N E t 293286300302325326327346290363355354376326
N E p 188184192193210211211223186234228228242210
N O R 105103108109115116116123104129127126134116
N M R 7371757580808085728988879280
Table 4. S N V = N 2 O d + ( N H 3 + N O x ) d + N 2 O i in kg[ N ] ha−1 and N 2 O   t in Gg[ N 2 O ].
2008200920102011201220132014201520162017201820192020Mean
N 2 O d kg [N] ha−11.01.01.01.01.11.21.11.21.01.31.21.21.31.1
N 2 O i kg [N] ha−10.30.30.30.30.40.40.40.40.30.40.40.40.40.3
( N H 3 + N O x ) d   kg [N] ha−166669989698998
S N V kg [N] ha−17887101010117111011119
N 2 O   t  (1)Gg [ N 2 O ] 54559111113101715171911
(1)  N 2 O   t (Gg [ N 2 O ] ) = { N 2 O d +  N 2 O i , kg [N] ha−1}·{44/28}·{harvested area, ha}·{10−6} [26,31].
Table 5. Emissions of NO3 (N units) in the S P S S , C via lixiviation/runoff ( S N L , kg [N] ha−1).
2008200920102011201220132014201520162017201820192020Avg.
S N L 9101091313121491412141412
Table 6. Average annual in- and outfluxes ( Q N S and S N T ) of the S P S S , C : Q N F S (synthetic fertilizer), Q N D A (atmospheric deposition), Q N E A (animal excreta), Q N F B (biological fixation), N M R (mineralized N from residues), S N V (volatilized N), S N L (lixiviated/runoff N), S N E p or N E p (exported N), and S N D (denitrified). Results are expressed in kg [ N ] ha−1.
2008200920102011201220132014201520162017201820192020Avg.
Q N S Q N F S 3132323043444247314742464740
Q N D A 44444444444444
Q N E A 00000000000000
Q N F B 165158169174164164169173164186191180195173
N M R 7371757580808085728988879280
Total274265280284291292295309270326324317339297
S N T S N V 7887101010117111011119
S N L 9101091313121491412141412
S N E p 188184192193210211211223186234228228242210
S N D 99999999999999
Total214210219219242243242257212268259262277240
Table 7. Average annual values of agri-environmental indexes: B N (N balance) = Q N S S N T ; N l (lost N) = S N V + S N L + S N D ; N r a g (gross anthropogenic Nr) =   Q N F S   + Q N F B ; N r a n (net anthropogenic N r ) =   Q N F S + Q N F B S N D   ; P u , S and P u , C (productivities of soybean and corn); E a g (agronomic efficiency of N use) = S N E p / Q N S ; E r e (retention efficiency of added N) = ( Q N S   N l )/ Q N S ; nitric oxide ( N 2 O ) left from the S P S S , C by denitrification.
2008200920102011201220132014201520162017201820192020Avg.
Agri-environmental indicators B N  (1)6055616549495351595865556357
N l  (1)2626262532323134263431343430
N r a g  (1)197190201204207208210220194233233226243213
N r a n  (1)188181192195198199201211185224224217234204
P u , S  (1)29712842303731232946294430313108294233383436324835103112
P u , C  (1)39854076408338785518557653205959391959895306591660645045
E a g 0.690.690.690.680.720.720.710.720.690.720.700.720.710.71
E r e 0.910.900.910.910.890.890.890.890.910.900.900.890.900.90
N 2 O  (2)54559111113101715171911
(1) kg [N] ha−1. (2) Gg [N2O].
Table 8. Succession soybean-corn areas planted in the period.
2008200920102011201220132014201520162017201820192020
Area (Million ha)32.32.72.83.84.84.85.25.46.56.26.97.3
Disclaimer/Publisher’s Note: The statements, opinions and data contained in all publications are solely those of the individual author(s) and contributor(s) and not of MDPI and/or the editor(s). MDPI and/or the editor(s) disclaim responsibility for any injury to people or property resulting from any ideas, methods, instructions or products referred to in the content.

