
Can Foliar-Applied Omeprazole Improve the Yield, Assimilation, Recovery and Nitrogen Use Efficiency in Bean Plants?

 , , ,
, , ,  ,
,
Abstract
1. Introduction
2. Materials and Methods
2.1. Crop Management
2.2. Experimental Design
2.3. Plant Sampling
2.4. Plant Analysis
2.4.1. Total Biomass and Yield
2.4.2. “In Vivo” Nitrate Reductase Enzyme Activity (NR) (E.C. 1.7.1.1)
2.4.3. Photosynthetic Pigments
(Chl a × V × W1)/(W2 × (π × r2) × n)
(Chl b × V × W1)/(W2 × (π × r2) × n)
(Carotenoids × V × W1)/(W2 × (π × r2) × n)
2.4.4. Soluble Amino Acid and Soluble Protein Concentrations
2.4.5. Total Nitrogen Concentration
2.4.6. Nitrogen Use Efficiency Parameters
2.4.7. Nitrogen Recovery Percentage
2.5. Statistical Analysis
3. Results
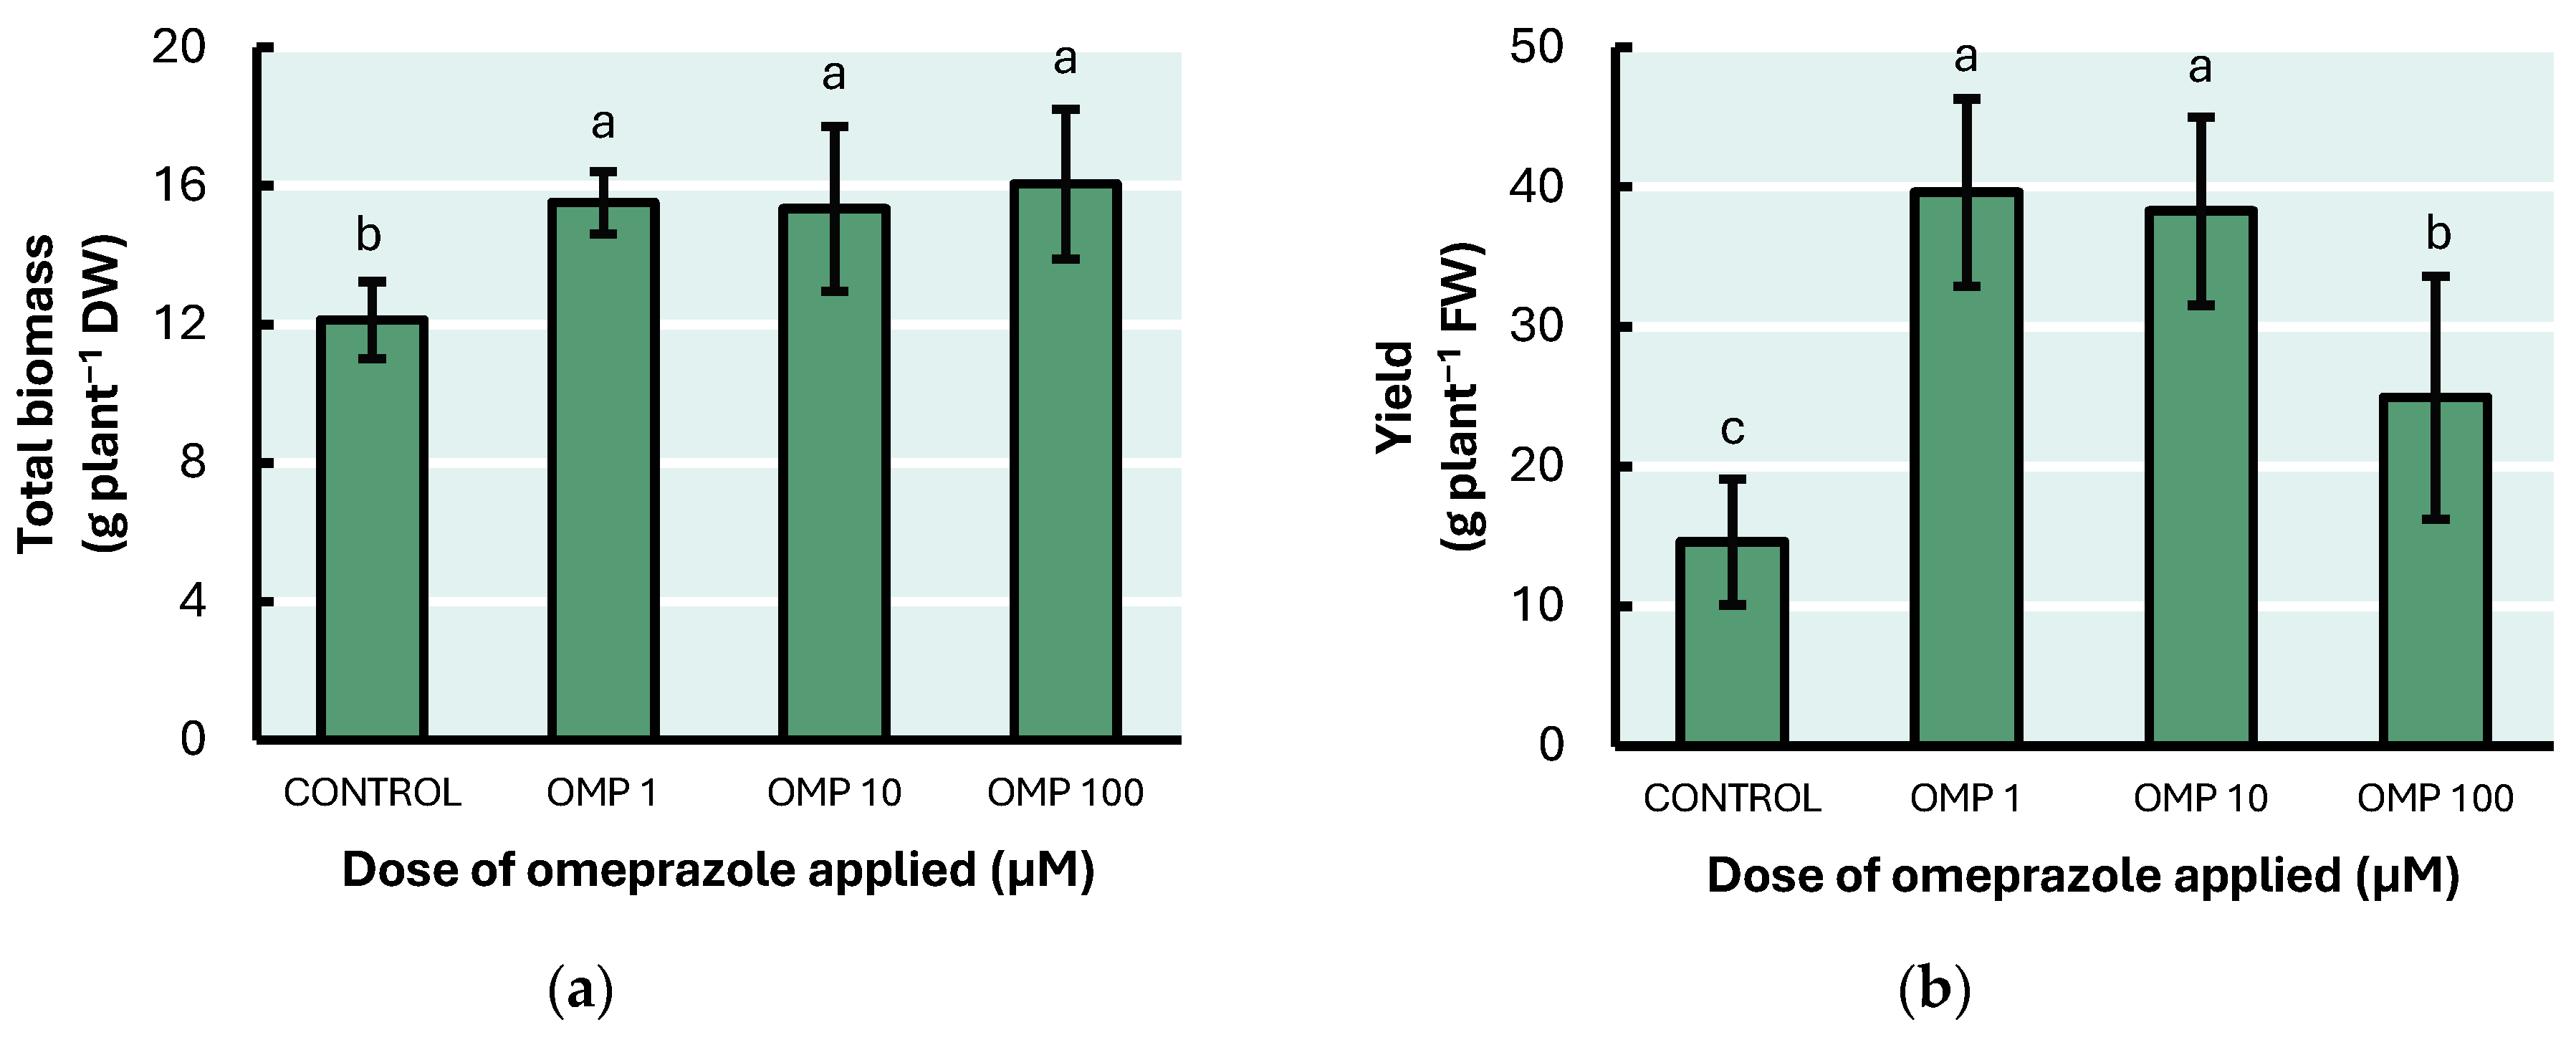
3.1. Total Biomass and Yield
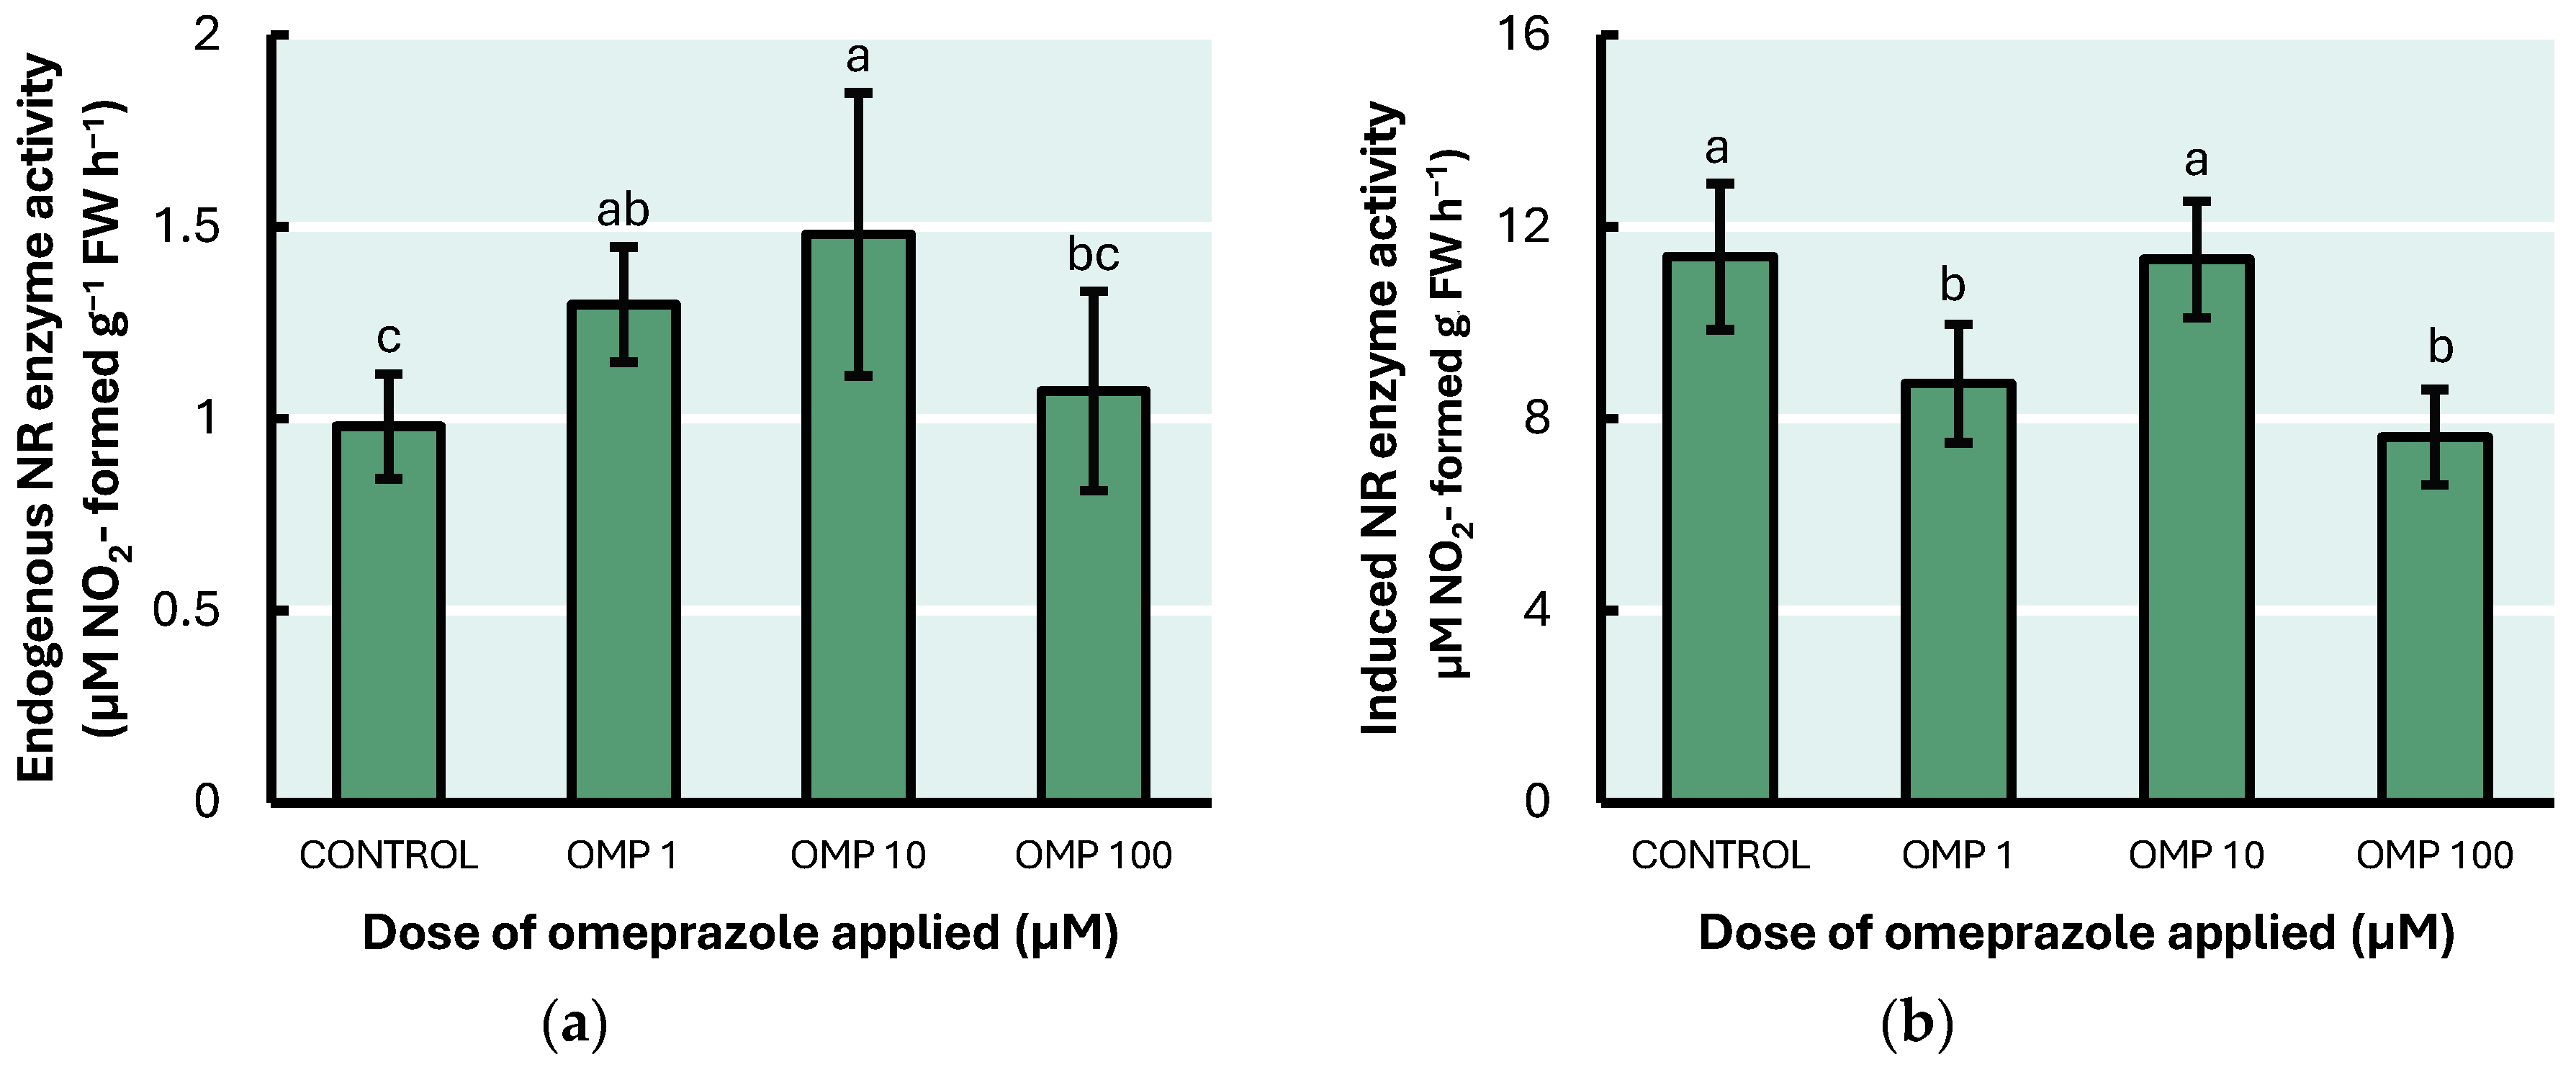
3.2. “In Vivo” Nitrate Reductase Enzyme Activity (NR) (E.C. 1.7.1.1)
3.3. Photosynthetic Pigments Concentration
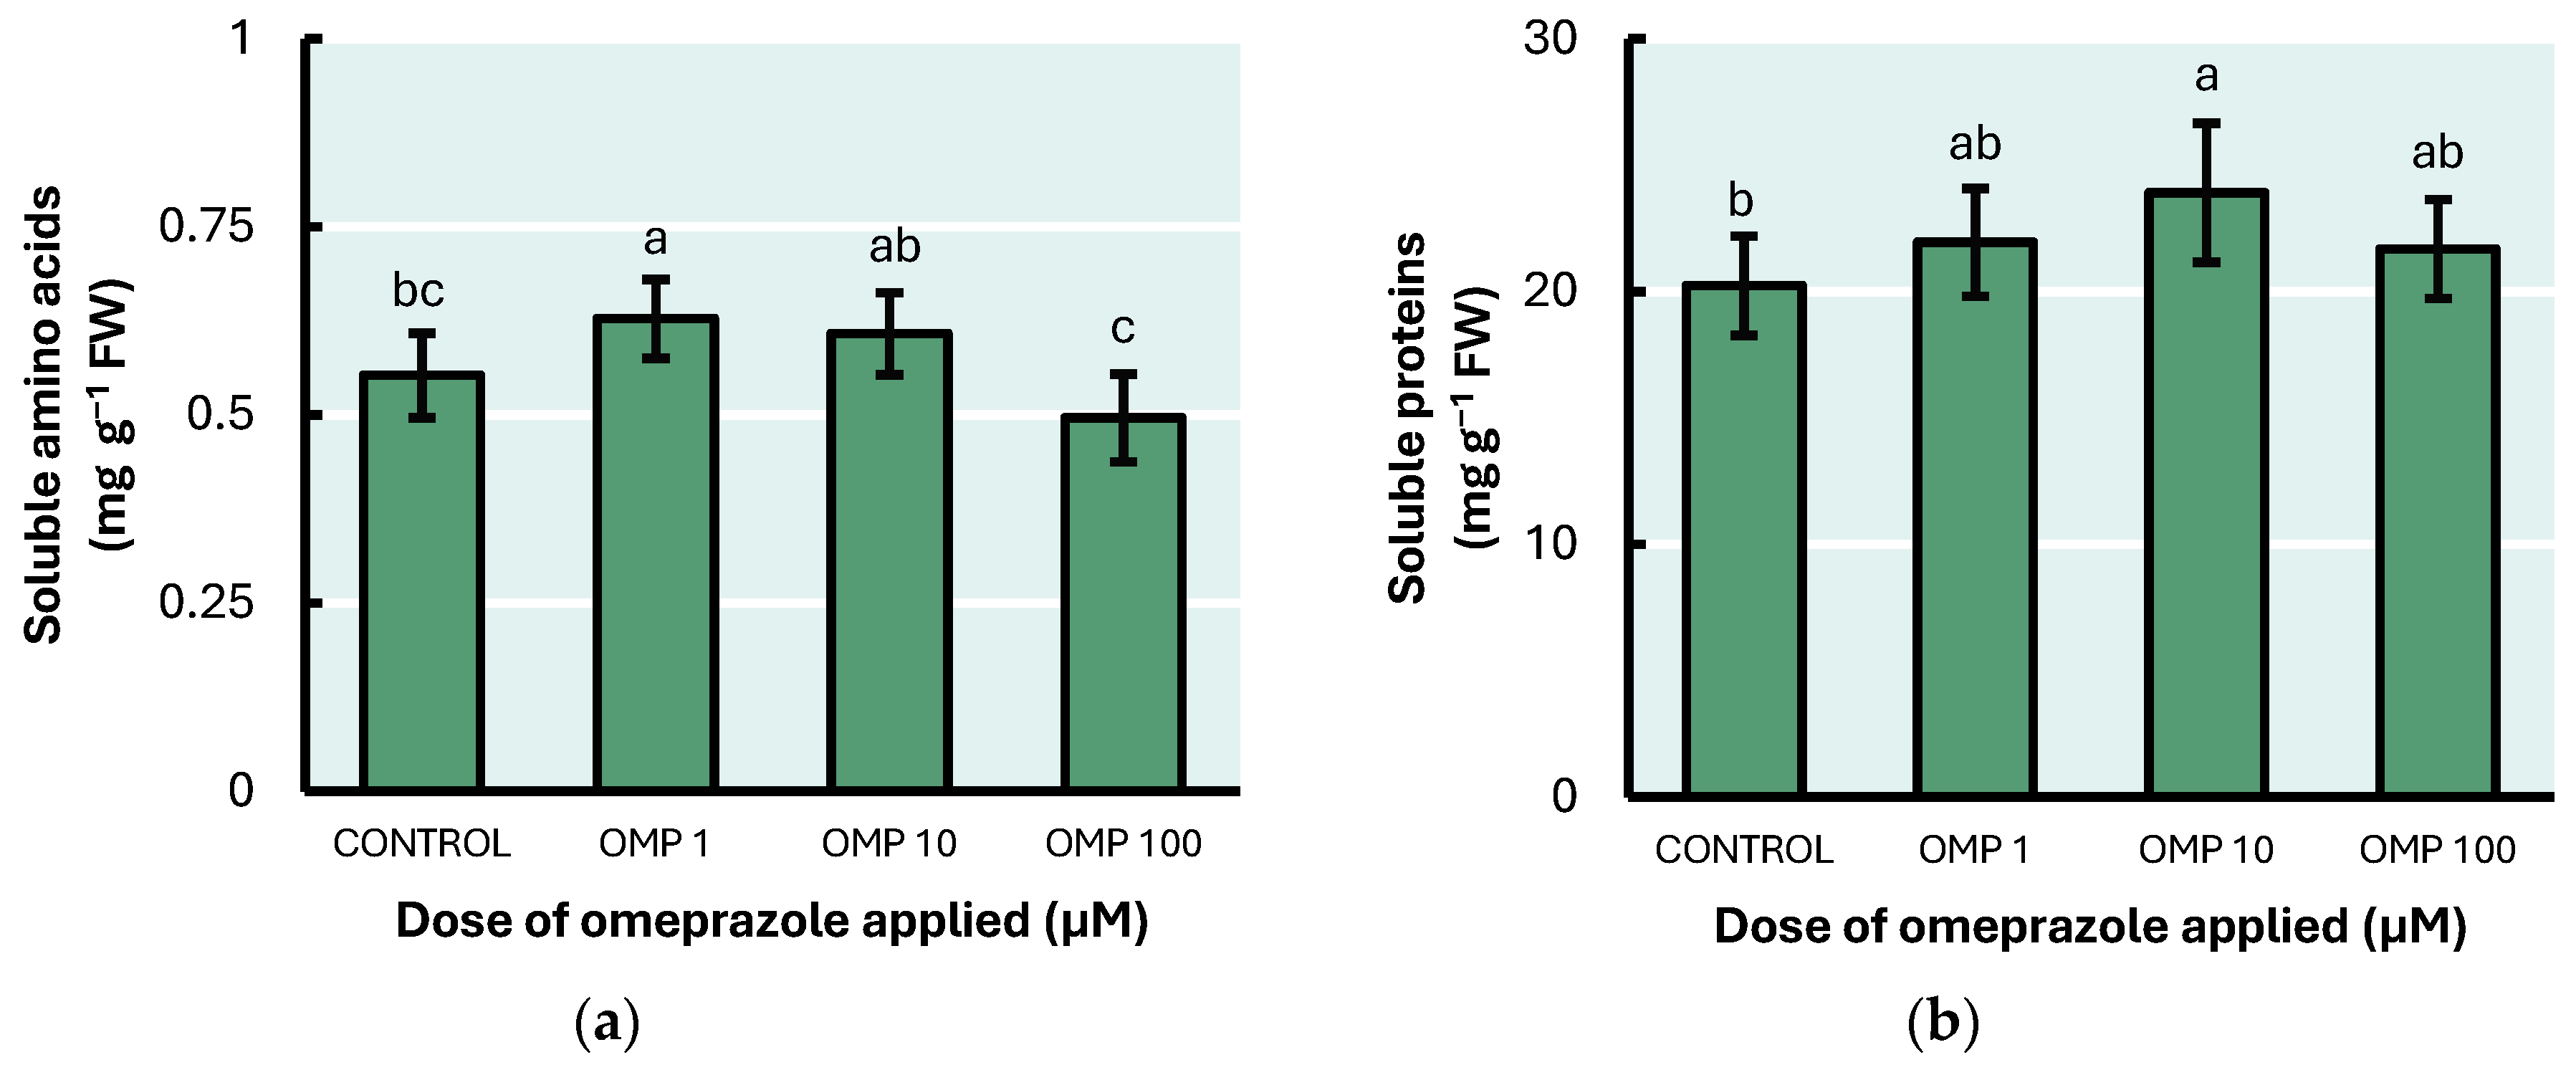
3.4. Soluble Amino Acid and Soluble Protein Concentrations
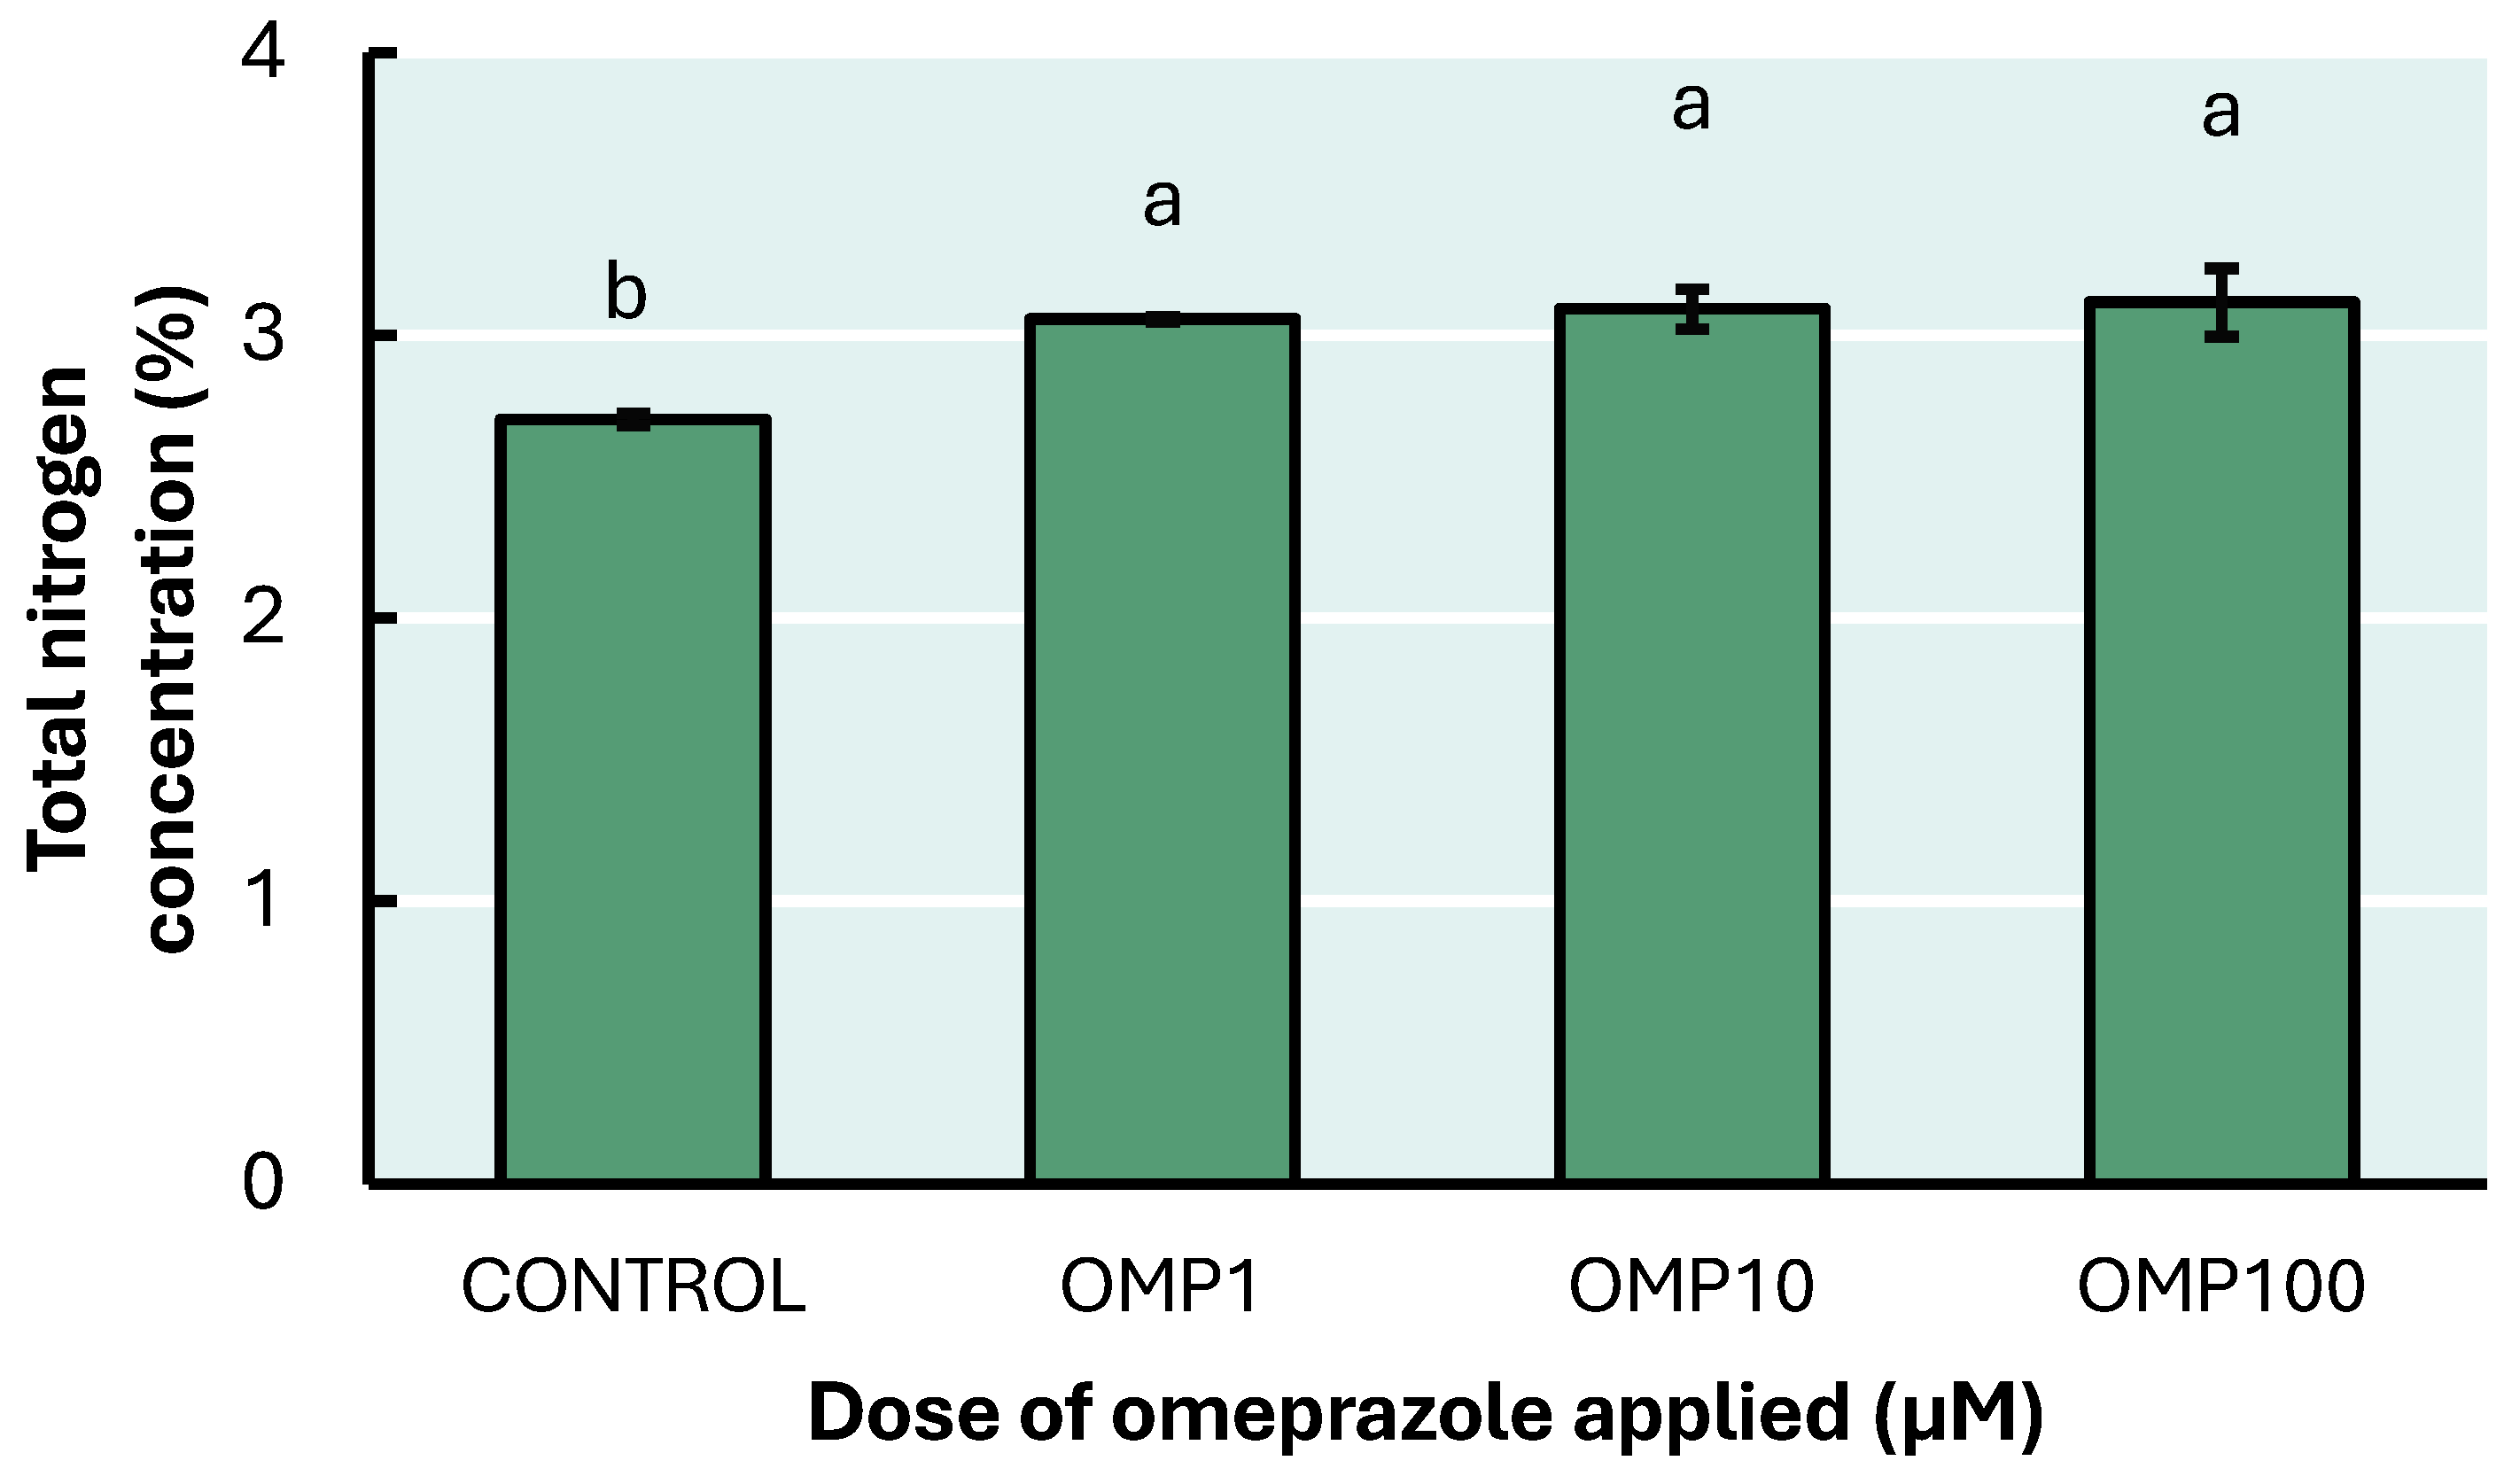
3.5. Total Nitrogen Concentration
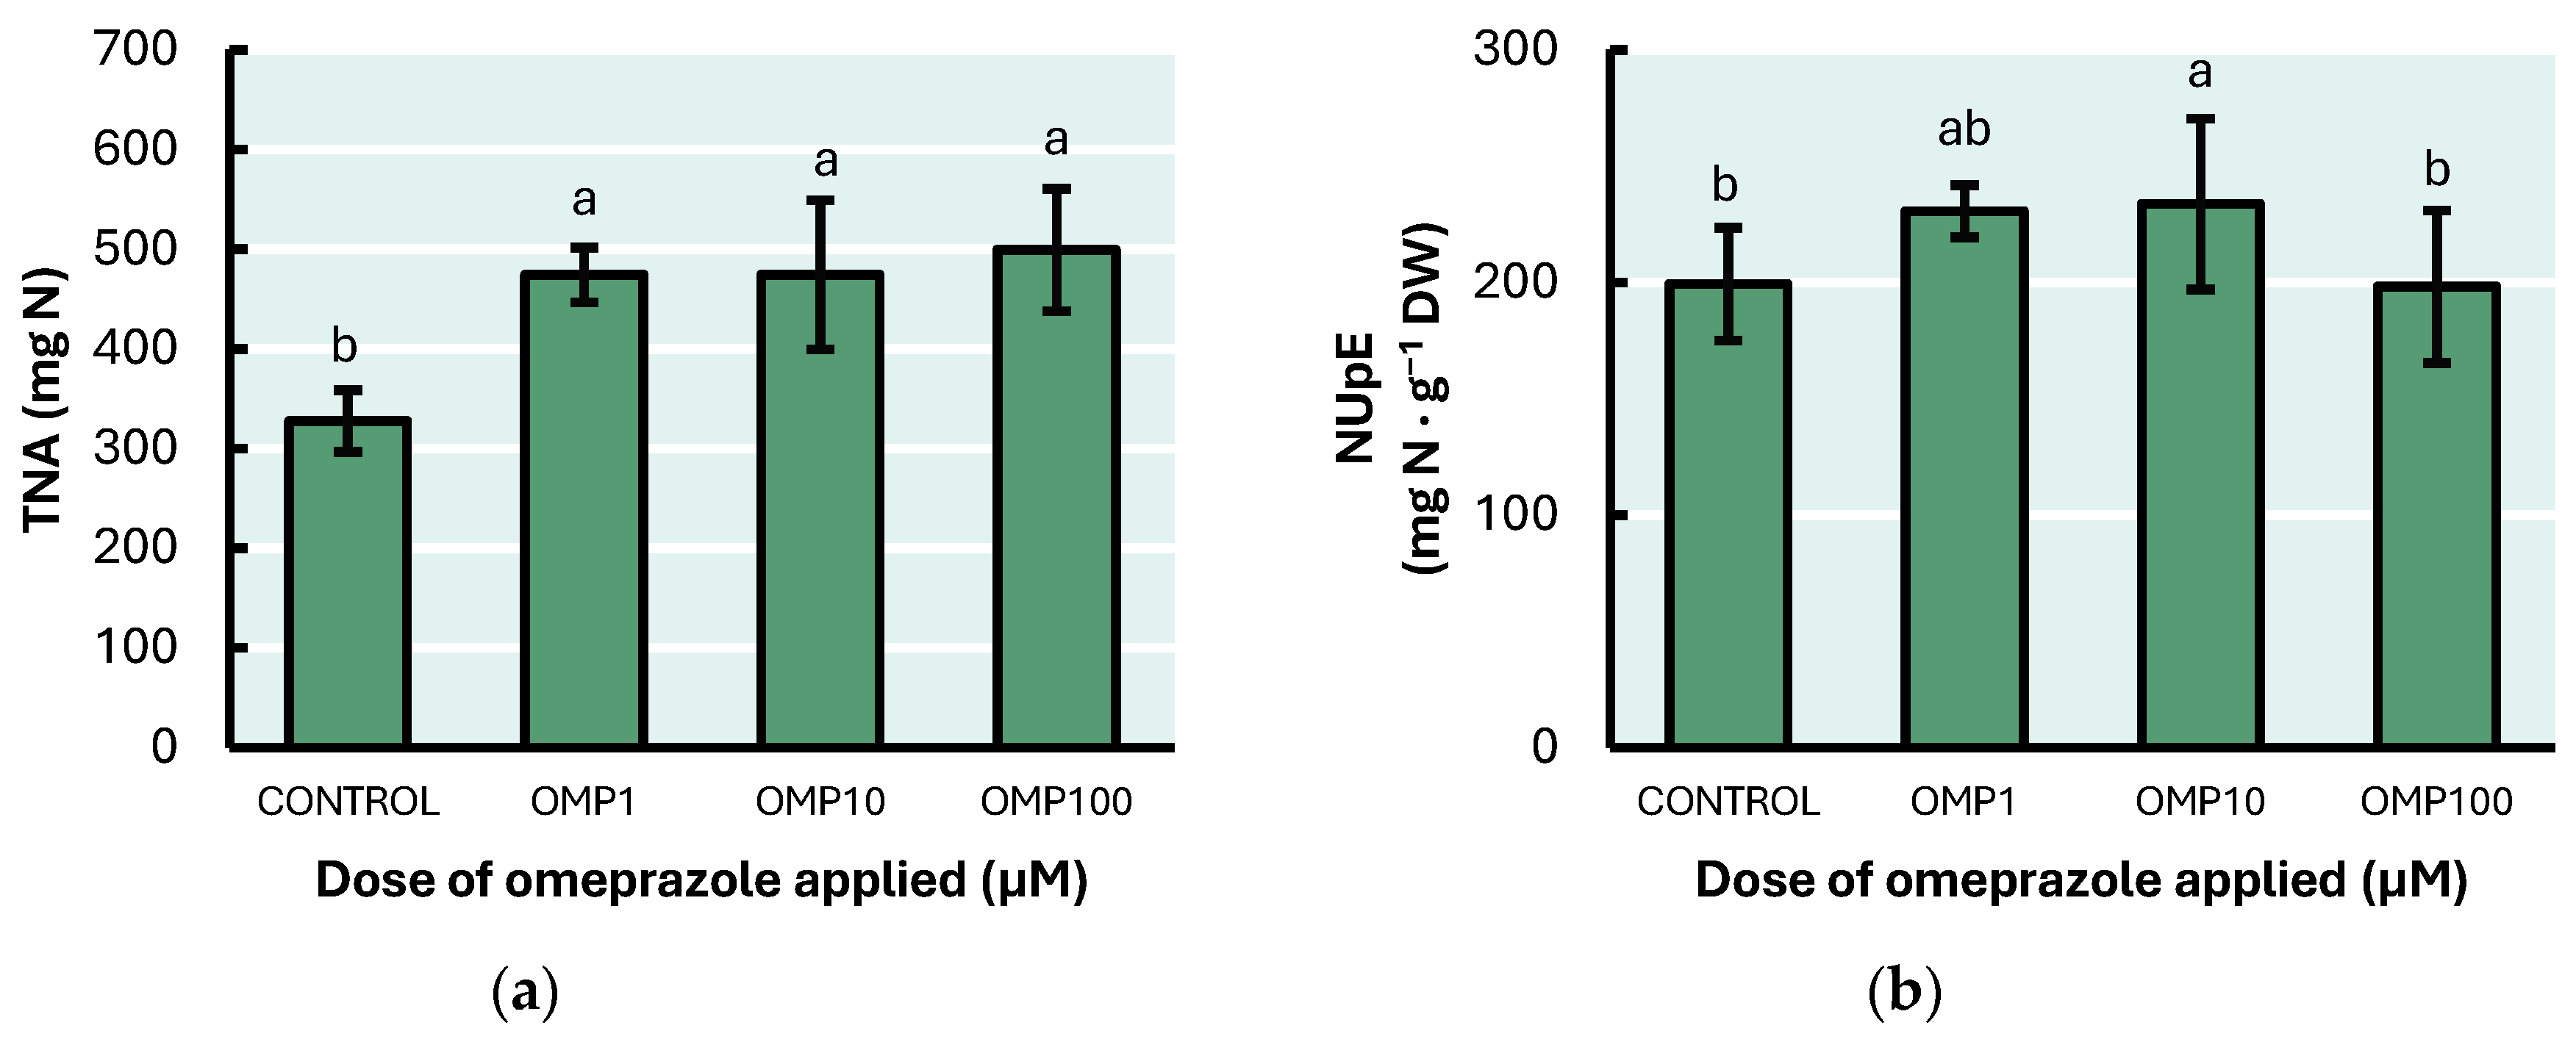
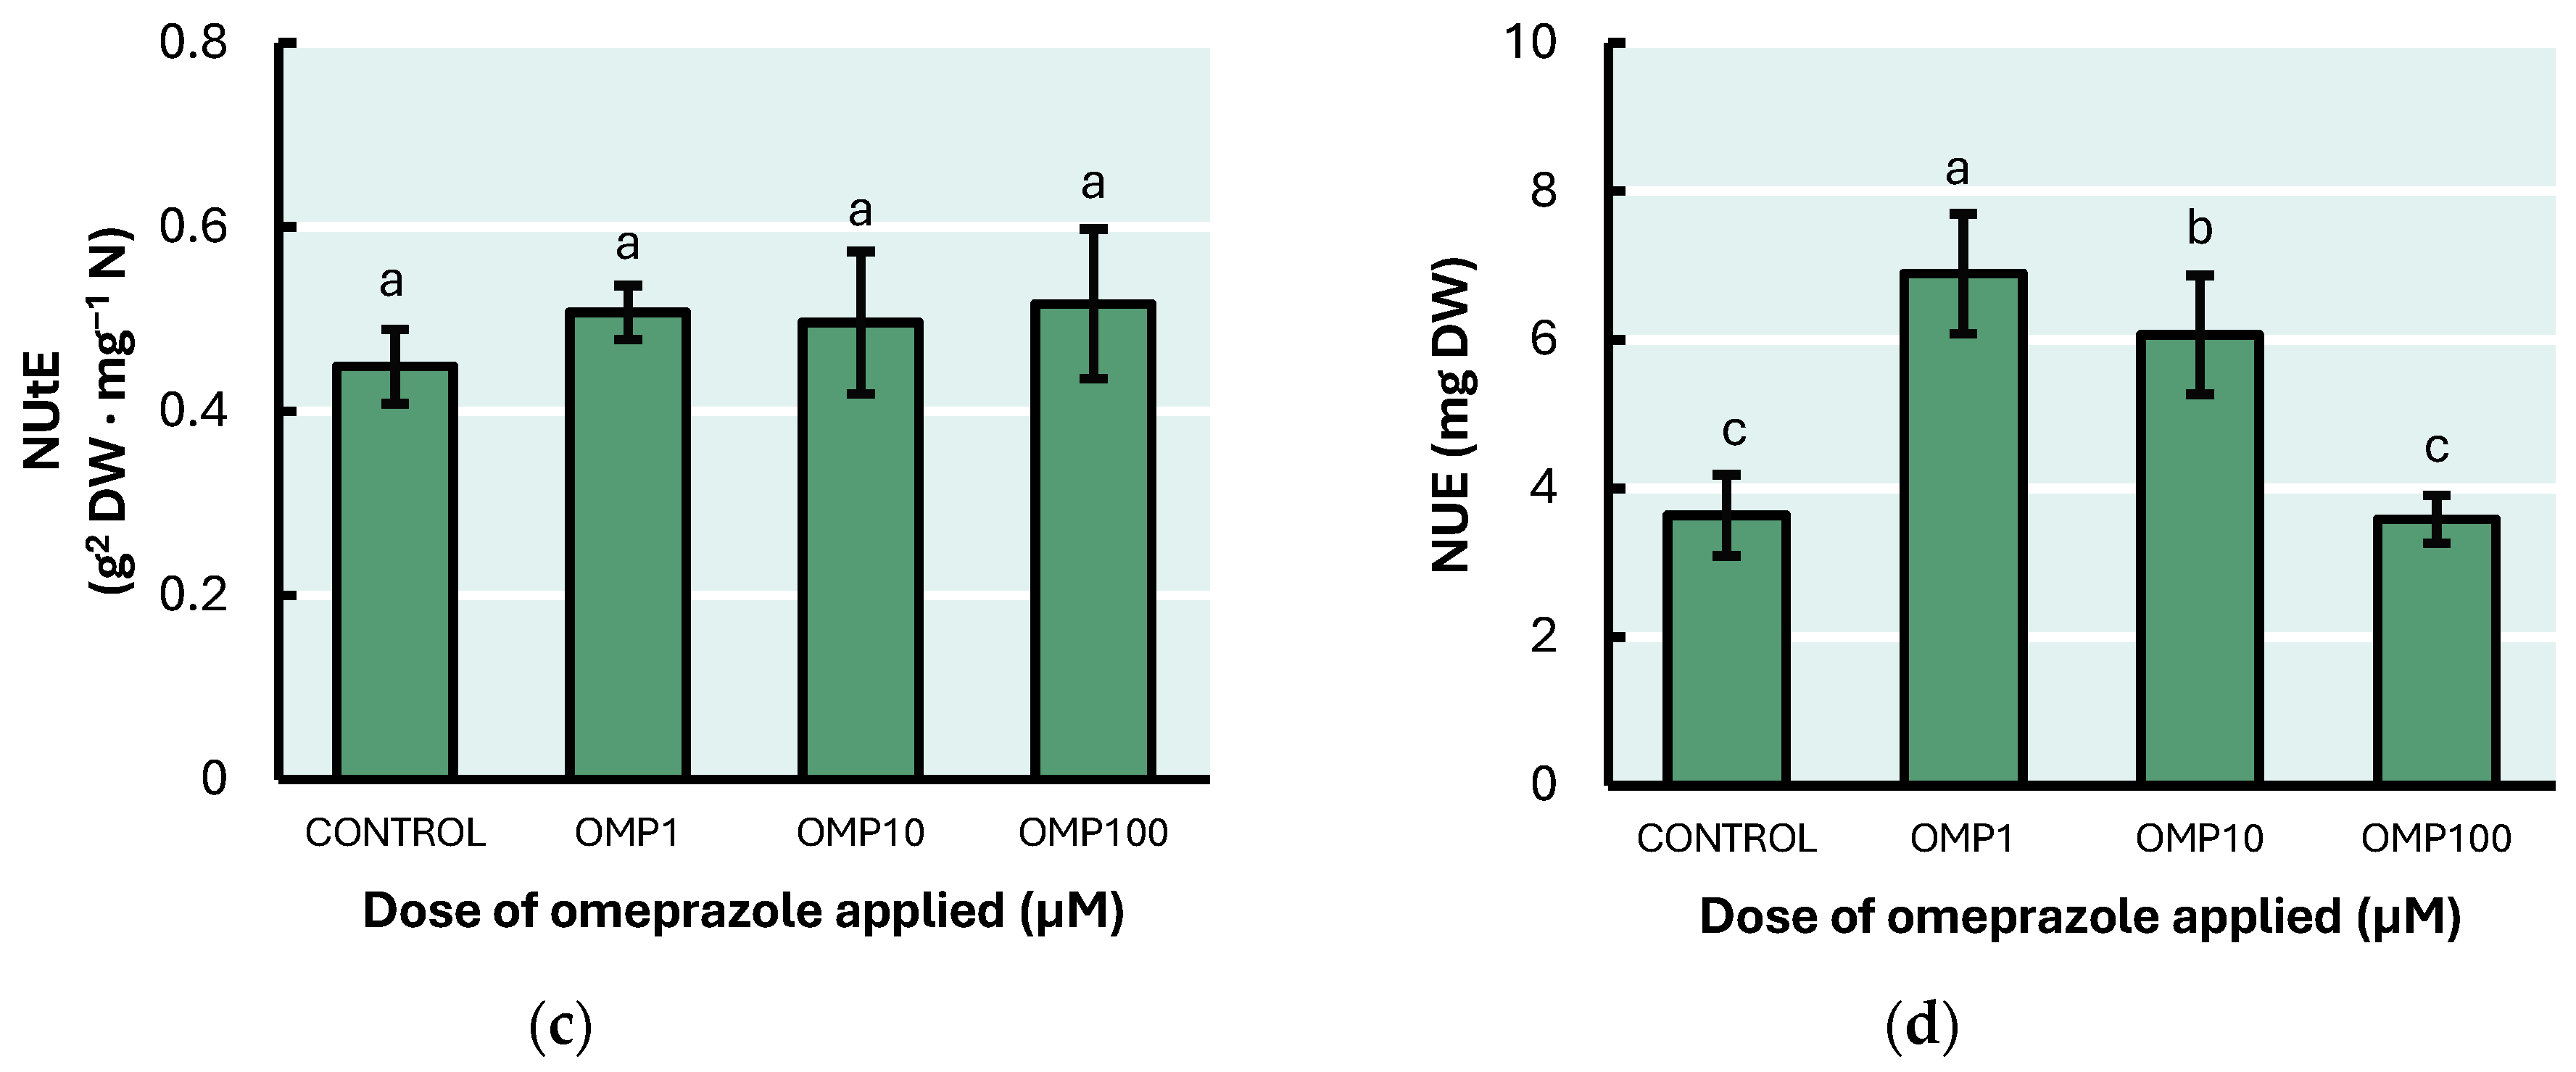
3.6. Nitrogen Use Efficiency Parameters
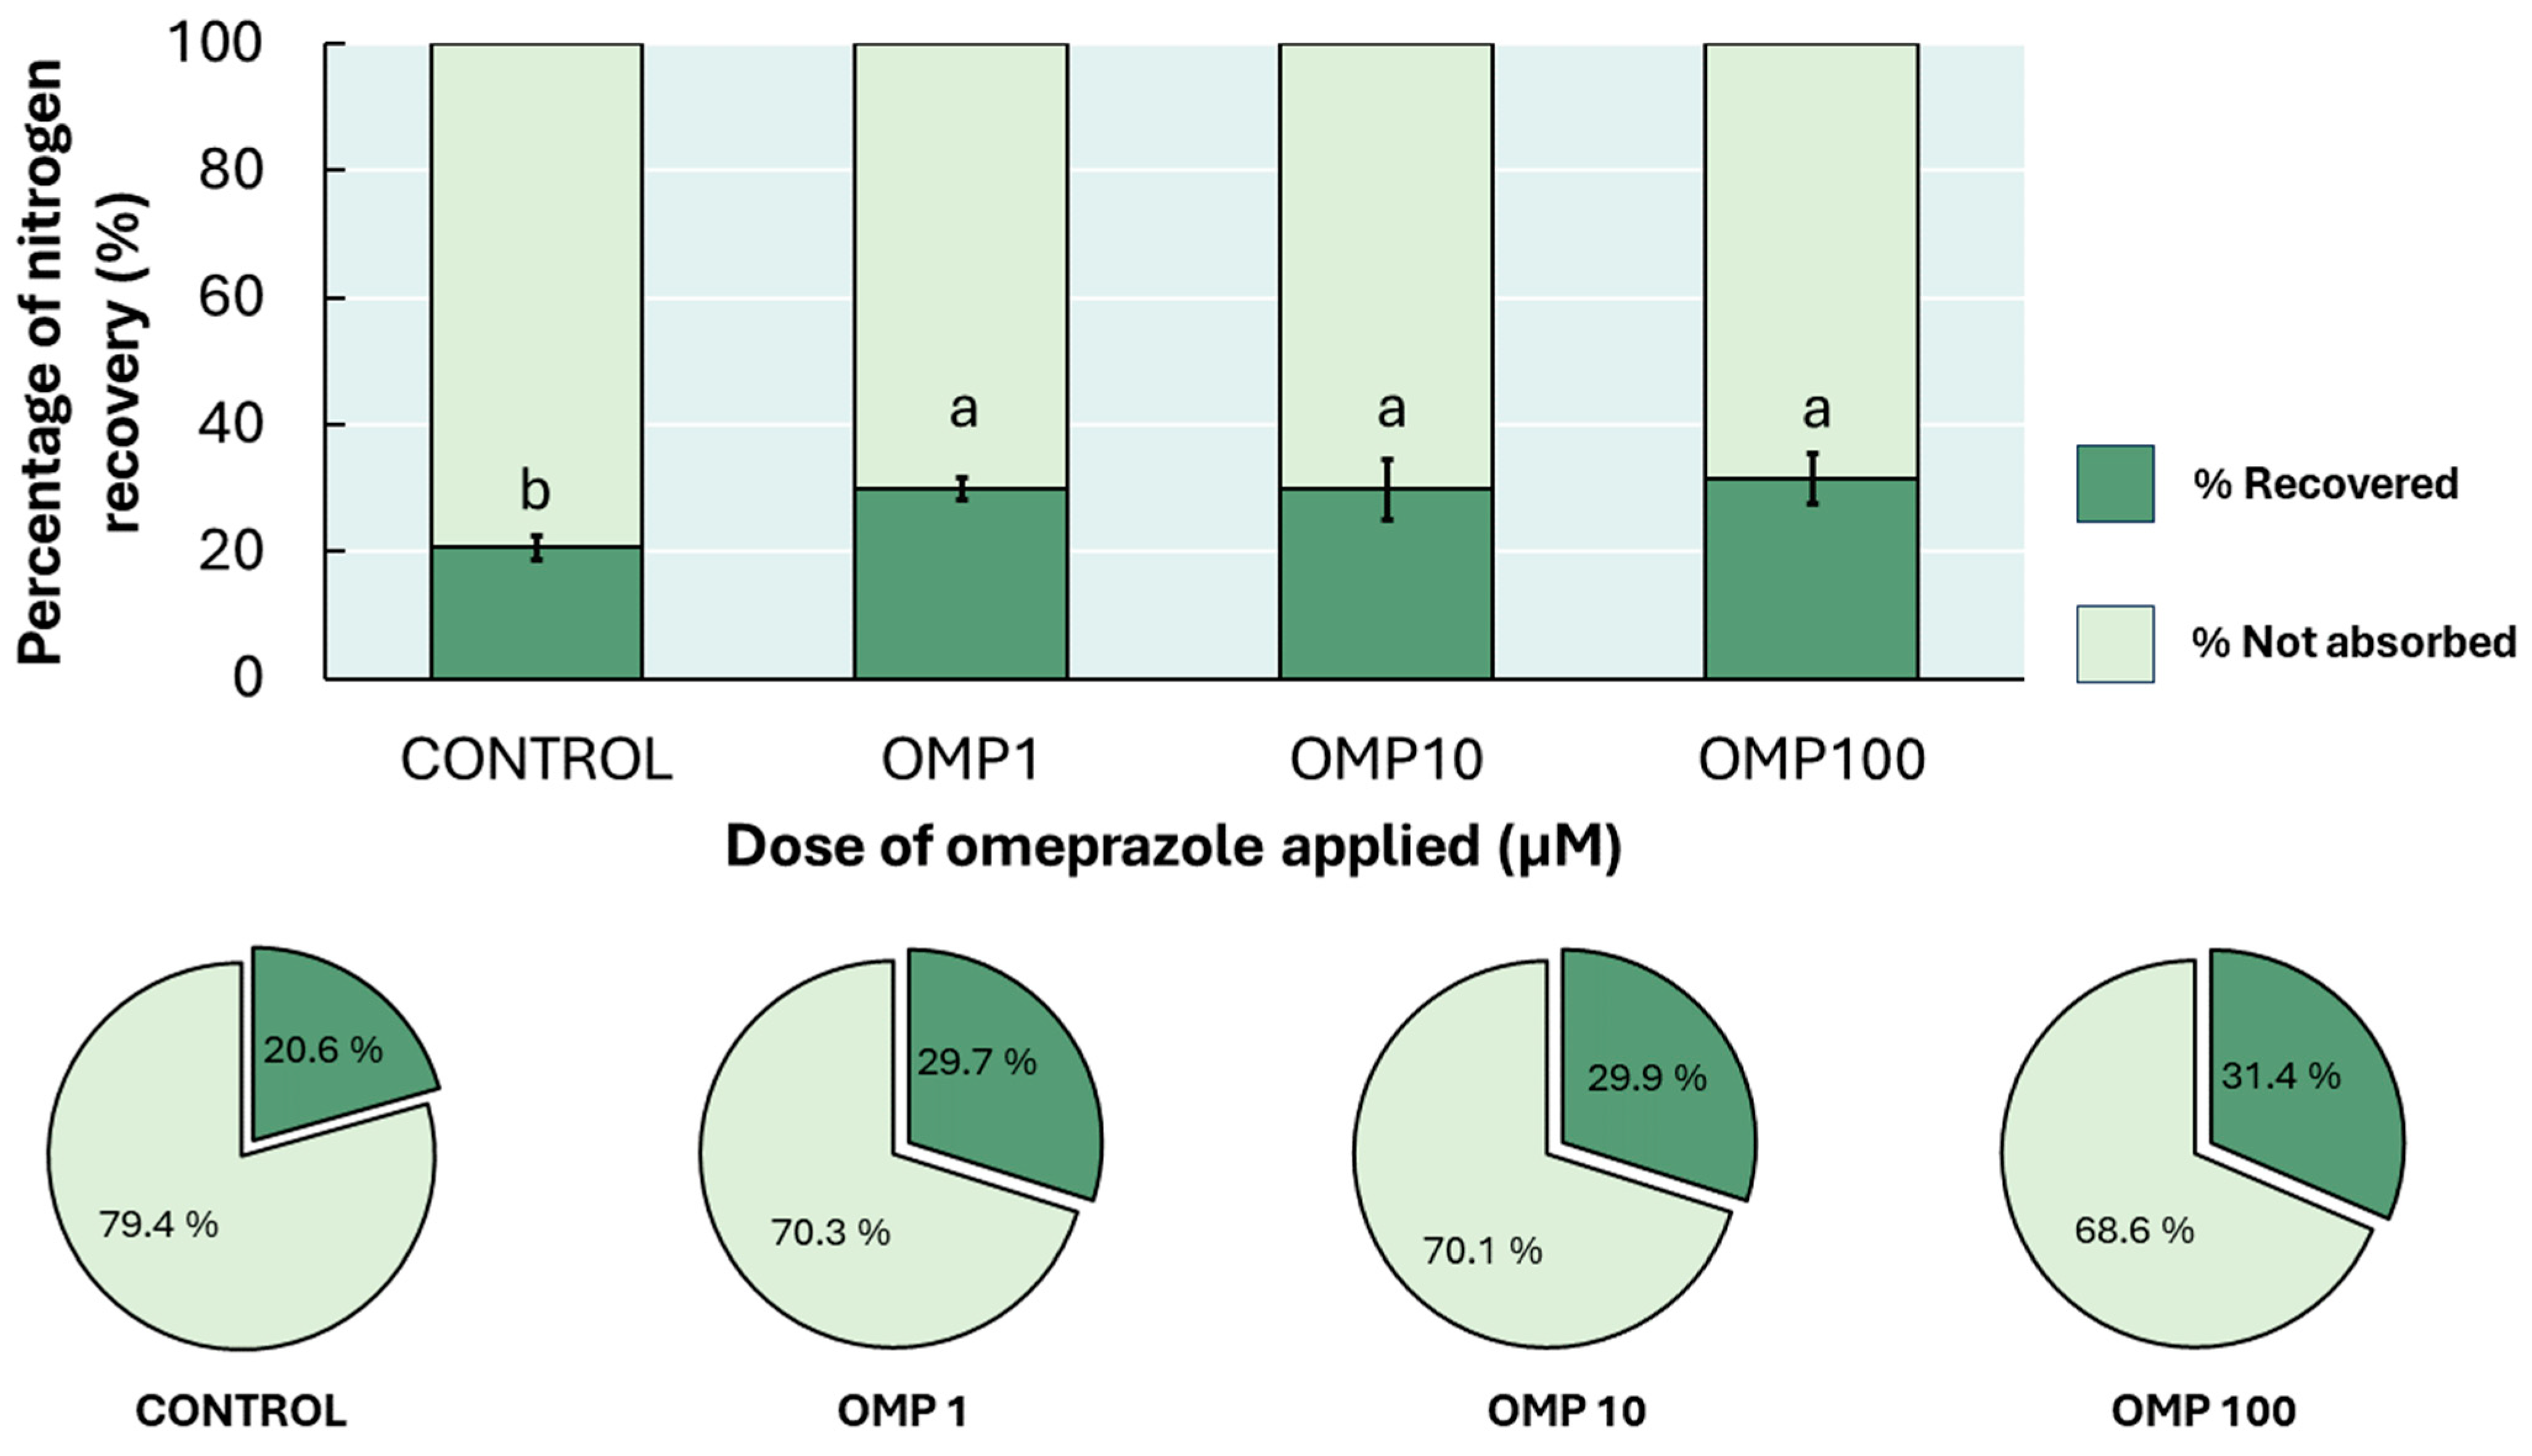
3.7. Nitrogen Recovery Percentage
4. Discussion
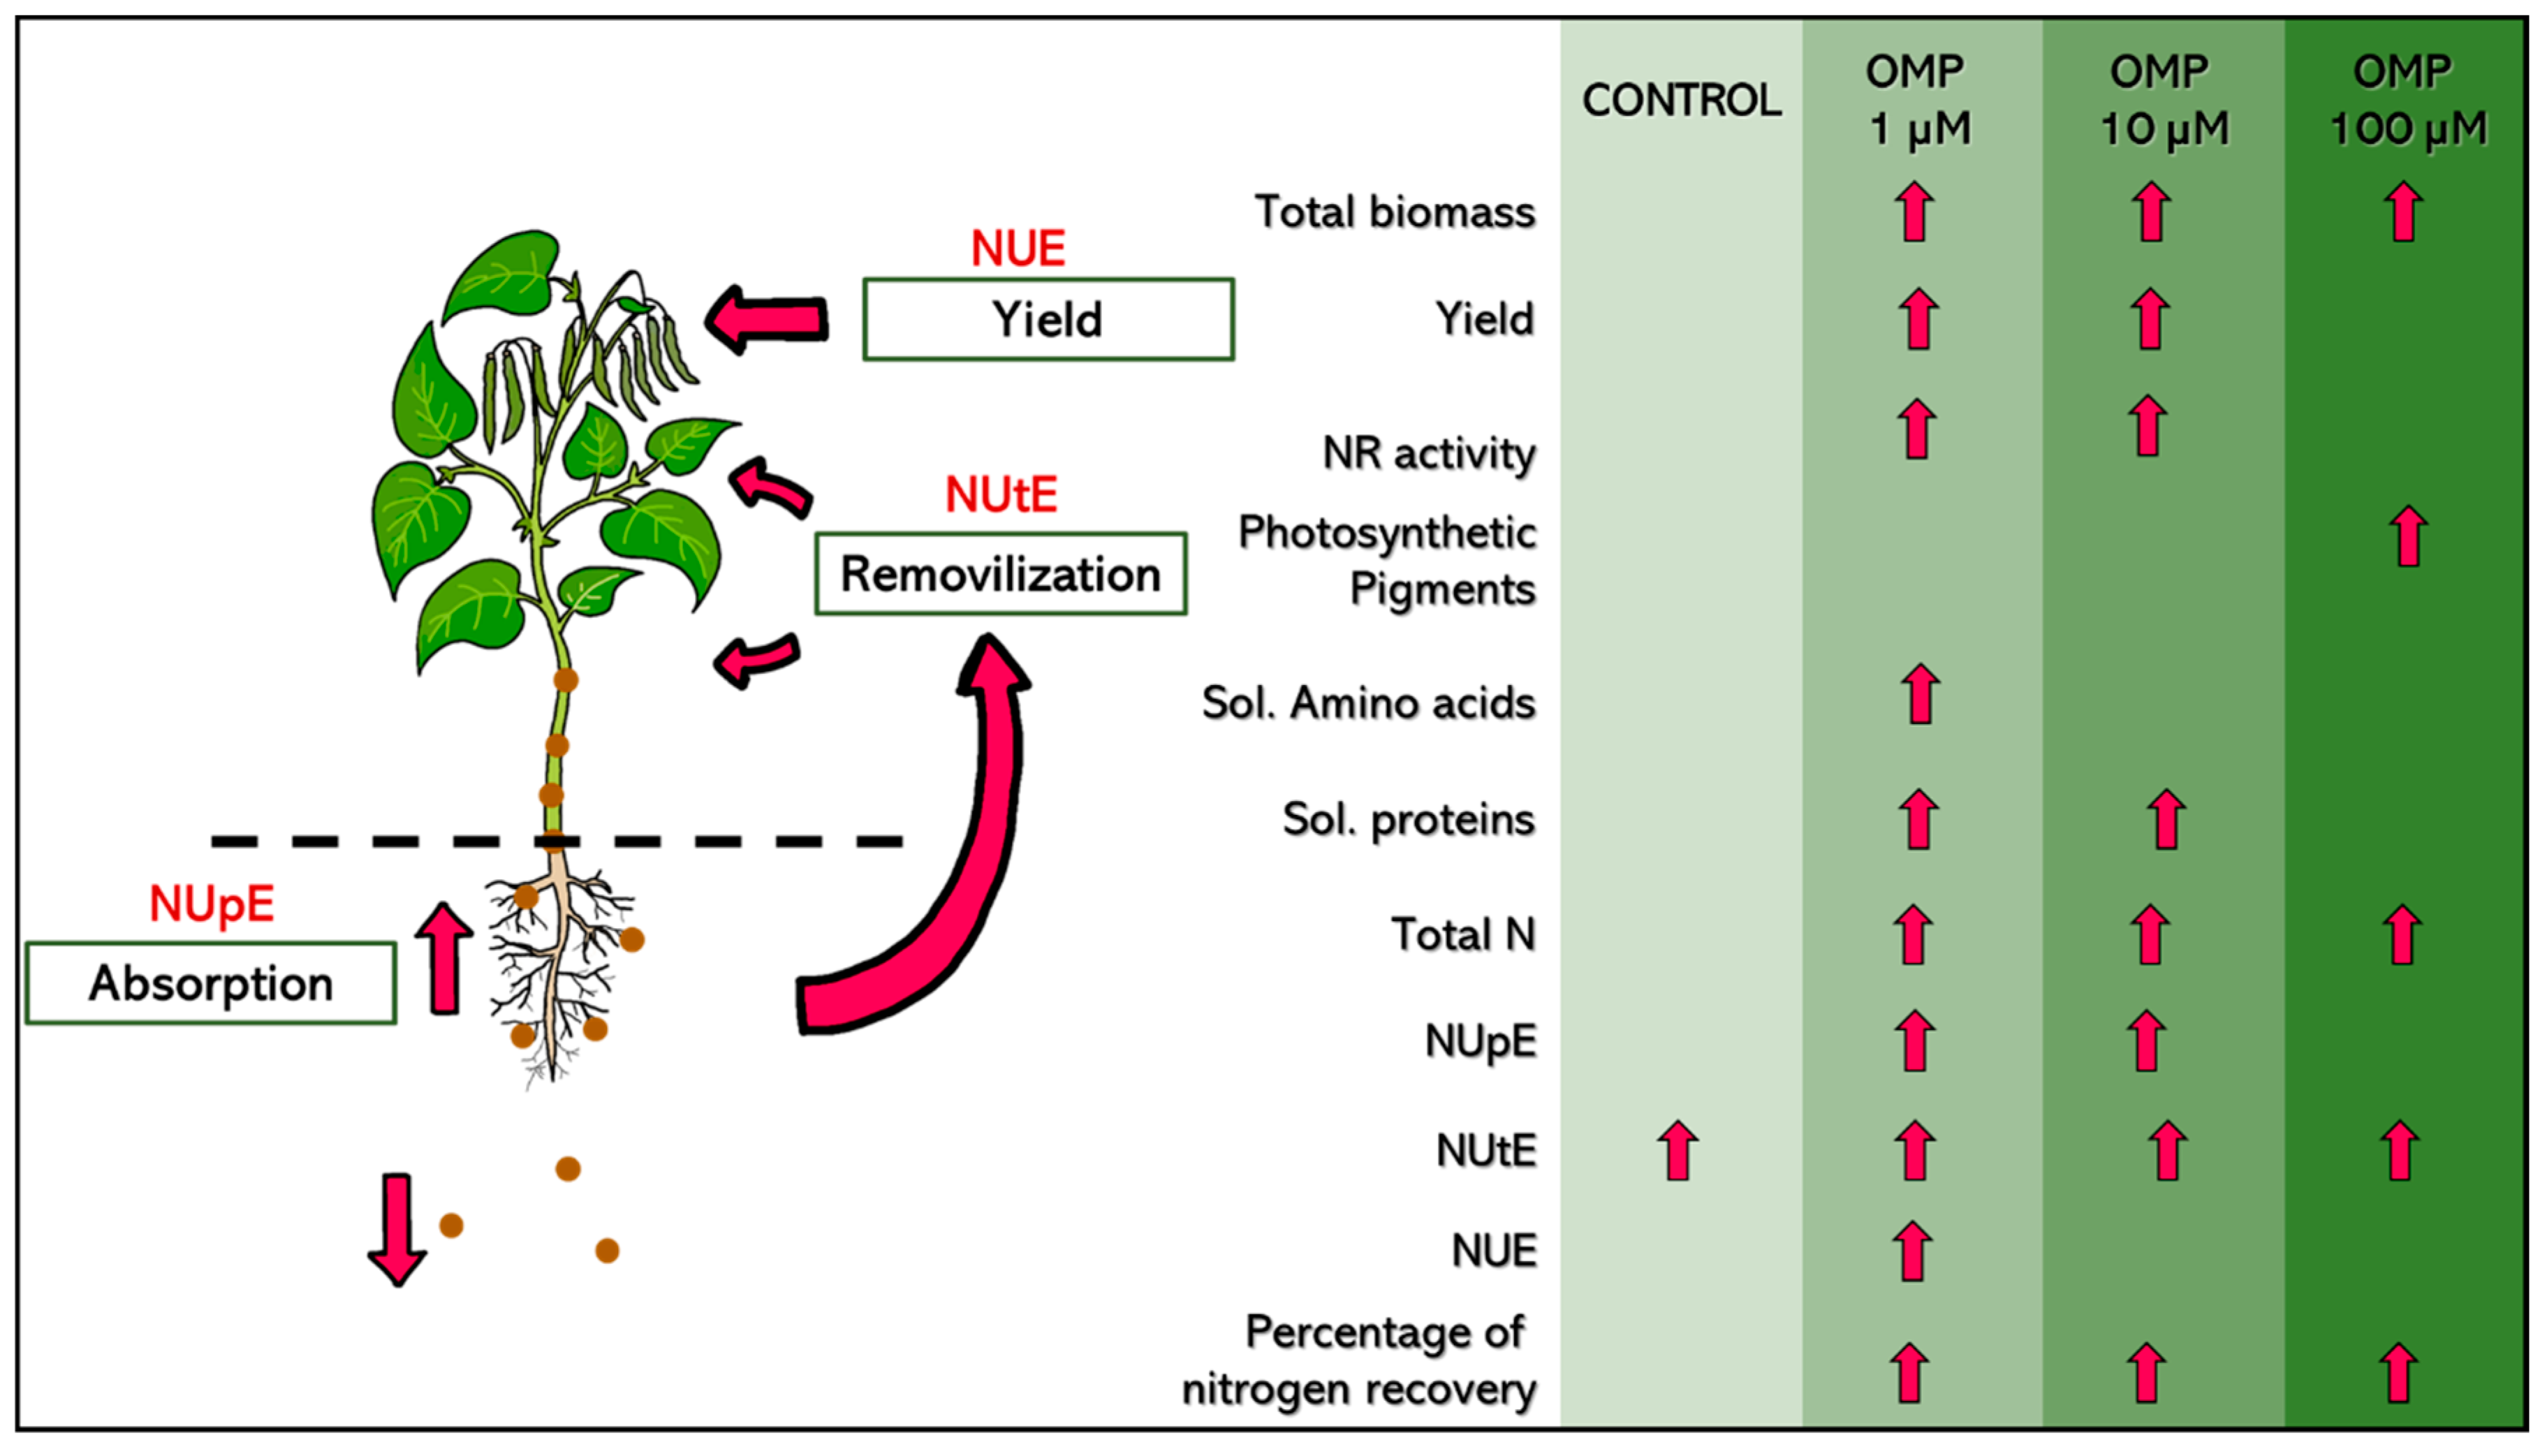
5. Conclusions
Author Contributions
Funding
Data Availability Statement
Acknowledgments
Conflicts of Interest
References
- Huang, S.; He, P.; Jia, L.; Ding, W.; Ullah, S.; Zhao, R.; Zhang, J.; Xu, X.; Liu, M.; Zhou, W. Improving nitrogen use efficiency and reducing environmental cost with long-term nutrient expert management in a summer maize-winter wheat rotation system. Soil Tillage Res. 2021, 213, 105117. [Google Scholar] [CrossRef]
- Cameron, K.C.; Di, H.J.; Moir, J.L. Nitrogen losses from the soil/plant system: A review. Ann. Appl. Biol. 2013, 162, 145–173. [Google Scholar] [CrossRef]
- Barker, A.V.; Bryson, G.M. Nitrogen. In Handbook of Plant Nutrition, 1st ed.; Barker, A.V., Pilbeam, D.J., Eds.; CRC Press: Boca Raton, FL, USA, 2006; pp. 37–66. [Google Scholar] [CrossRef]
- Snyder, C.S.; Davidson, E.A.; Smith, P.; Venterea, R.T. Agriculture: Sustainable crop and animal production to help mitigate nitrous oxide emissions. Curr. Opin. Environ. Sustain. 2014, 9, 46–54. [Google Scholar] [CrossRef]
- Li, H.; Hu, B.; Chu, C. Nitrogen use efficiency in crops: Lessons from Arabidopsis and rice. J. Exp. Bot. 2017, 68, 2477–2488. [Google Scholar] [CrossRef]
- Javed, T.; Singhal, R.K.; Shabbir, R.; Shah, A.N.; Kumar, P.; Jinger, D.; Dharmappa, P.M.; Shad, M.A.; Saha, D.; Anuragi, H.; et al. Recent advances in agronomic and physio-molecular approaches for improving nitrogen use efficiency in crop plants. Front. Plant Sci. 2022, 13, 877544. [Google Scholar] [CrossRef] [PubMed]
- Beatty, P.H.; Klein, M.S.; Fischer, J.J.; Lewis, I.A.; Muench, D.G.; Good, A.G. Understanding plant nitrogen metabolism through metabolomics and computational approaches. Plants 2016, 5, 39. [Google Scholar] [CrossRef]
- Karpova, N.V.; Shagdarova, B.T.; Lyalina, T.S.; Il’Ina, A.V.; Tereshina, V.M.; Varlamov, V.P. Influence of the main characteristics of low weight chitosan on the growth of the plant pathogenic fungus Botrytis cinerea. Appl. Biochem. Microbiol. 2019, 55, 405–413. [Google Scholar] [CrossRef]
- Gago, J.; Estrany, J.; Estes, L.; Fernie, A.R.; Alorda, B.; Brotman, Y.; Flexas, J.; Escalona, J.M.; Medrano, H. Nano and micro unmanned aerial vehicles (UAVs): A new grand challenge for precision agriculture? Curr. Protoc. Plant Biol. 2020, 5, e20103. [Google Scholar] [CrossRef]
- Van Oosten, M.J.; Dell’Aversana, E.; Ruggiero, A.; Cirillo, V.; Gibon, Y.; Woodrow, P.; Maggio, A.; Carillo, P. Omeprazole treatment enhances nitrogen use efficiency through increased nitrogen uptake and assimilation in corn. Front. Plant Sci. 2019, 10, 1507. [Google Scholar] [CrossRef]
- Rouphael, Y.; Raimondi, G.; Lucini, L.; Carillo, P.; Kyriacou, M.C.; Colla, G.; Cirillo, V.; Pannico, A.; El-Nakhel, C.; De Pascale, S. Physiological and metabolic responses triggered by omeprazole improve tomato plant tolerance to NaCl stress. Front. Plant Sci. 2018, 9, 249. [Google Scholar] [CrossRef]
- Maggio, A.; Cirillo, V. Omeprazole, a Proton-Pump Inhibitor on Humans, Acts as a Growth Enhancer and Stress Protectant in Plants. Doctoral Thesis, Università degli Studi di Napoli Federico II, Napoli, Italy, 2018. [Google Scholar]
- Cirillo, V.; Van Oosten, M.J.; Izzo, M.; Maggio, A. Omeprazole treatment elicits contrasting responses to salt stress in two basil genotypes. Ann. Appl. Biol. 2019, 174, 329–338. [Google Scholar] [CrossRef]
- Elansary, H.O.; El-Abedin, T.K.Z. Omeprazole alleviates water stress in peppermint and modulates the expression of menthol biosynthesis genes. Plant Physiol. Biochem. 2019, 139, 578–586. [Google Scholar] [CrossRef] [PubMed]
- Sánchez, E.; Ruiz, J.M.; Romero, L. Proline metabolism in response to nitrogen toxicity in fruit of French Bean plants (Phaseolus vulgaris L. cv Strike). Sci. Hortic. 2022, 93, 225–233. [Google Scholar] [CrossRef]
- Sánchez, E.; Rivero, R.M.; Ruiz, J.M.; Romero, L. Changes in biomass, enzymatic activity and protein concentration in roots and leaves of green bean plants (Phaseolus vulgaris L. cv. Strike) under high NH4NO3 application rates. Sci. Hortic. 2004, 99, 237–248. [Google Scholar] [CrossRef]
- Wellburn, A.R. The spectral determination of chlorophylls a and b, as well as total carotenoids, using various solvents with spectrophotometers of different resolution. J. Plant Physiol. 1994, 144, 307–313. [Google Scholar] [CrossRef]
- Yemm, E.E.; Cocking, E.C.; Ricketts, R.E. The determination of amino-acids whit ninhydrin. Analyst 1955, 80, 209–214. [Google Scholar] [CrossRef]
- Bradford, M.M. A rapid and sensitive method for the quantitation of microgram quantities of protein utilizing the principle of protein-dye binding. Anal. Biochem. 1976, 72, 248–254. [Google Scholar] [CrossRef]
- Dumas, J.B.A. Procédés de l’analyse organique. Annal. Chim. Phys. 1831, 47, 198–205. [Google Scholar]
- Krotz, L.; Giazzi, G. Nitrogen, Carbon and Sulfur Determination in Paper by Flash Combustion; Thermo Fisher Scientific: Monza, Italy, 2014; Available online: http://apps.thermoscientific.com/media/cmd/hypersite-events/Pittcon-2014/posters/PN42211_PC2014.pdf (accessed on 3 November 2023).
- Moll, R.H.; Kamprath, E.J.; Jackson, W.A. Analysis and interpretation of factors which contribute to efficiency of nitrogen utilization. Agron. J. 1982, 74, 562–564. [Google Scholar] [CrossRef]
- Congreves, K.A.; Otchere, O.; Ferland, D.; Farzadfar, S.; Williams, S.; Arcand, M.M. Nitrogen use efficiency definitions of today and tomorrow. Front. Plant Sci. 2021, 12, 637108. [Google Scholar] [CrossRef]
- Westermann, D.T.; Kleinkopf, G.E.; Porter, L.K. Nitrogen fertilizer efficiencies on potatoes. Am. Potato J. 1988, 65, 377–386. [Google Scholar] [CrossRef]
- Martin, R.J. The effect of nitrogen fertilizer on the recovery of nitrogen by a potato crop. Proc. Agron. Soc. N. Z. 1995, 25, 97–104. [Google Scholar]
- Carillo, P.; Woodrow, P.; Raimondi, G.; El-Nakhel, C.; Pannico, A.; Kyriacou, M.C.; Colla, G.; Mori, M.; Giordano, M.; De Pascale, S.; et al. Omeprazole promotes chloride exclusion and induces salt tolerance in greenhouse basil. Agronomy 2019, 9, 355. [Google Scholar] [CrossRef]
- Carillo, P.; Raimondi, G.; Kyriacou, M.C.; Pannico, A.; El-Nakhel, C.; Cirillo, V.; Colla, G.; De Pascale, S.; Rouphael, Y. Morpho-physiological and homeostatic adaptive responses triggered by omeprazole enhance lettuce tolerance to salt stress. Sci. Hortic. 2019, 249, 22–30. [Google Scholar] [CrossRef]
- Monreal, C.M.; DeRosa, M.; Mallubhotla, S.C.; Bindraban, P.S.; Dimkpa, C. Nanotechnologies for increasing the crop use efficiency of fertilizer-micronutrients. Biol. Fertil. Soils 2016, 52, 423–437. [Google Scholar] [CrossRef]
- Servicio de Información Agroalimentaria y Pesquera (SIAP). Cierre de la Producción Agrícola. 12 de octubre de 2023. Available online: https://nube.siap.gob.mx/cierreagricola/ (accessed on 12 October 2023).
- Kishorekumar, R.; Bulle, M.; Wany, A.; Gupta, K.J. An overview of important enzymes involved in nitrogen assimilation of plants. In Nitrogen Metabolism in Plants: Methods and Protocols; Springer: Berlin/Heidelberg, Germany, 2020; pp. 1–13. [Google Scholar] [CrossRef]
- Hao, X.; Jia, J.; Mi, J.; Yang, S.; Khattak, A.M.; Zheng, L.; Gao, W.; Wang, M. An optimization model of light intensity and nitrogen concentration coupled with yield and quality. Plant Growth Regul. 2020, 92, 319–331. [Google Scholar] [CrossRef]
- Filimon, R.V.; Rotaru, L.; Filimon, R.M. Quantitative investigation of leaf photosynthetic pigments during annual biological cycle of Vitis vinifera L. table grape cultivars. S. Afr. J. Enol. Vitic. 2016, 37, 1–14. [Google Scholar] [CrossRef]
- Benavente-Valdés, J.R.; Aguilar, C.; Contreras-Esquivel, J.C.; Méndez-Zavala, A.; Montañez, J. Strategies to enhance the production of photosynthetic pigments and lipids in chlorophycae species. Biotechnol. Rep. 2016, 10, 117–125. [Google Scholar] [CrossRef]
- Jia, K.P.; Mi, J.; Ali, S.; Ohyanagi, H.; Moreno, J.C.; Ablazov, A.; Balakrishna, A.; Berqdar, L.; Fiore, A.; Diretto, G.; et al. An alternative, zeaxanthin epoxidase-independent abscisic acid biosynthetic pathway in plants. Mol. Plant 2022, 15, 151–166. [Google Scholar] [CrossRef]
- Moe, L.A. Amino acids in the rhizosphere: From plants to microbes. Am. J. Bot. 2013, 100, 1692–1705. [Google Scholar] [CrossRef]
- Gomes, G.L.B.; Scortecci, K.C. Auxin and its role in plant development: Structure, signalling, regulation and response mechanisms. Plant Biol. 2021, 23, 894–904. [Google Scholar] [CrossRef] [PubMed]
- Galloway, J.N.; Winiwarter, W.; Leip, A.; Leach, A.M.; Bleeker, A.; Erisman, J.W. Nitrogen footprints: Past, present and future. Environ. Res. Lett. 2014, 9, 115003. [Google Scholar] [CrossRef]
- Conant, R.T.; Berdanier, A.B.; Grace, P.R. Patterns and trends in nitrogen use and nitrogen recovery efficiency in world agriculture. Glob. Biogeochem. Cycles 2013, 27, 558–566. [Google Scholar] [CrossRef]


| Chlorophyll a | Chlorophyll b | Carotenoids | |
|---|---|---|---|
| Treatment | |||
| CONTROL | 3.28 ± 0.35 ab | 1.4 ± 0.15 b | 0.42 ± 0.06 bc |
| OMP 1 | 3.14 ± 0.21 b | 1.4 ± 0.13 b | 0.47 ± 0.03 b |
| OMP 10 | 2.99 ± 0.23 b | 1.33 ± 0.10 b | 0.39 ± 0.03 c |
| OMP 100 | 3.65 ± 0.41 a | 1.59 ± 0.16 a | 0.55 ± 0.06 a |
| p ≤ 0.05 | *** | * | *** |
Disclaimer/Publisher’s Note: The statements, opinions and data contained in all publications are solely those of the individual author(s) and contributor(s) and not of MDPI and/or the editor(s). MDPI and/or the editor(s) disclaim responsibility for any injury to people or property resulting from any ideas, methods, instructions or products referred to in the content. |
© 2024 by the authors. Licensee MDPI, Basel, Switzerland. This article is an open access article distributed under the terms and conditions of the Creative Commons Attribution (CC BY) license (https://creativecommons.org/licenses/by/4.0/).
Share and Cite
Ramírez-Estrada, C.A.; Sánchez, E.; Flores-Córdova, M.A.; Chávez-Mendoza, C.; Pérez-Álvarez, S.; Yáñez-Muñoz, R.M. Can Foliar-Applied Omeprazole Improve the Yield, Assimilation, Recovery and Nitrogen Use Efficiency in Bean Plants? Nitrogen 2024, 5, 219-231. https://doi.org/10.3390/nitrogen5010015
Ramírez-Estrada CA, Sánchez E, Flores-Córdova MA, Chávez-Mendoza C, Pérez-Álvarez S, Yáñez-Muñoz RM. Can Foliar-Applied Omeprazole Improve the Yield, Assimilation, Recovery and Nitrogen Use Efficiency in Bean Plants? Nitrogen. 2024; 5(1):219-231. https://doi.org/10.3390/nitrogen5010015
Chicago/Turabian StyleRamírez-Estrada, Carlos Abel, Esteban Sánchez, María Antonia Flores-Córdova, Celia Chávez-Mendoza, Sandra Pérez-Álvarez, and Rosa María Yáñez-Muñoz. 2024. "Can Foliar-Applied Omeprazole Improve the Yield, Assimilation, Recovery and Nitrogen Use Efficiency in Bean Plants?" Nitrogen 5, no. 1: 219-231. https://doi.org/10.3390/nitrogen5010015
APA StyleRamírez-Estrada, C. A., Sánchez, E., Flores-Córdova, M. A., Chávez-Mendoza, C., Pérez-Álvarez, S., & Yáñez-Muñoz, R. M. (2024). Can Foliar-Applied Omeprazole Improve the Yield, Assimilation, Recovery and Nitrogen Use Efficiency in Bean Plants? Nitrogen, 5(1), 219-231. https://doi.org/10.3390/nitrogen5010015