Article

An Original Experimental Design to Quantify and Model Net Mineralization of Organic Nitrogen in the Field

1
INRAE, Institut Agro, SAS, F-35000 Rennes, France
2
Chambre d’Agriculture de Bretagne, F-35000 Rennes, France
3
INRAE, UR1158 Agro-Impact, F-02000 Laon, France
4
Benjamin U Consultance Formation, F-63110 Beaumont, France
*
Author to whom correspondence should be addressed.
Nitrogen 2022, 3(2), 197-212; https://doi.org/10.3390/nitrogen3020015
Submission received: 7 March 2022 / Revised: 8 April 2022 / Accepted: 11 April 2022 / Published: 15 April 2022

Abstract

:
Improving the assessment and prediction of soil organic nitrogen (N) mineralization is essential: it contributes significantly to the N nutrition of crops and remains a major economic and environmental challenge. Consequently, a network of 137 fields was established in Brittany, France, to represent the wide diversity of soils and cultivation practices in this region. The experimental design was developed to measure net N mineralization for three consecutive years, in order to improve the accuracy of measuring it. Net N mineralization was quantified by the mineral N mass balance, which was estimated from March to October for a maize crop with no N fertilization. The effect of climate on mineralization was considered by calculating normalized time (ndays) and, then, calculating the N mineralization rate (Vn) as the ratio of the mineral N mass balance to normalized time. Strict screening of the experimental data, using agronomic and statistical criteria, resulted in the selection of a subset of 67 fields for data analysis. Mean Vn was relatively high (0.99 kg N ha−1 nday−1) over the period and varied greatly, from 0.62 to 1.46 kg N ha−1 nday−1 for the 10th and 90th percentiles, respectively. The upper soil layer (0–30 cm) was sampled to estimate its physical and chemical properties, particulate organic matter carbon and N fractions (POM-C and POM-N, respectively), soil microbial biomass (SMB), and extractable organic N (EON) determined in a phosphate borate extractant. The strongest correlations between Vn and these variables were observed with EON (r = 0.47), SMB (r = 0.45), POM-N (r = 0.43), and, to a lesser extent, the soil N stock (r = 0.31). Vn was also strongly correlated with a cropping system indicator (r = 0.39). A modeling approach, using generalized additive models, was used to identify and rank the variables with the greatest ability to predict net N mineralization.

1. Introduction

The balance sheet method is widely used to predict nitrogen (N) fertilization of crops [1,2,3,4,5]. With this method, a balance sheet is drawn up, in which fertilizer requirements are calculated as crop N requirements minus soil N availability. The accuracy of this method, thus, depends on that of estimating N mineralization, which if overestimated can lead to yield losses, or if underestimated can lead to N losses through leaching.
Certain soil properties, soil conditions (especially water content and temperature), and cropping practices are known to determine mineralization of organic N in the soil [6]. Laboratory incubations are widely used to identify and rank the soil physical and chemical parameters that strongly influence mineralization, especially the organic N content, texture [6,7,8,9,10,11], calcium carbonate content [12], and pH [5,12,13]. More recently, researchers have focused on the particle-size fractions of organic matter, particularly particulate organic matter (POM). POM is sensitive to management [14,15], and its turnover is significantly higher than that of the heavy fraction of organic matter [16]. POM is known to be an organic matter compartment that is rapidly biodegradable [17,18,19,20], but which has, however, contrasting results for the mineralization of its N (POM-N). Some studies observed a positive correlation between N supply and POM-N [14,21], while others tended to observe that mineralization resulted more from the biodegradation of the heavy fraction of organic matter [17]. Nonetheless, there is a consensus on the utility of considering POM when studying mineralization [22].
Laboratory experiments can also assess effects of cropping practices studied in long-term field experiments, revealing the significant influence of crop rotations [23,24,25,26], intercrops [27], introduction of legume crops, the type of soil tillage, and mineral and organic fertilization on mineralization [28,29]. Laboratory experiments are ultimately useful for evaluating the many extractable organic N (EON) indicators of mineralization, based on chemical extraction of a fraction of the total N in a soil sample [30,31,32]. The meta-analysis of Ros et al. [31] identified indicators with a greater ability to predict mineralization than the organic N content of the soil.
Laboratory experiments are, ultimately, useful for evaluating the many extractable organic N (EON) indicators of mineralization based on the chemical extraction of a fraction of the total N in a soil sample [30,31,32]. The meta-analysis of [31] identified indicators with a greater ability to predict mineralization than the organic N content of the soil.
However, these laboratory data are poor predictors of mineralization under field conditions, due to the lack of considering (i) interactions between microorganisms and mesofauna, which are active in decomposition [33]; (ii) mineralization in deep soil layers; and (iii) plant effects on N mineralization–organization processes stimulated by rhizodeposition, which strongly influences net mineralization under crops. In addition, fluctuations in the environmental conditions that drive these processes also help to understand why laboratory experiments can only partially explain mineralization under field conditions.
These factors justify studying N mineralization under field conditions and quantifying it, which requires a modeling approach to estimate losses from nitrate leaching and assess the influence of weather conditions. An initial approach, developed by Mary et al. [34], was based on frequently measuring the water and mineral N contents of the soil (divided into several layers), calibrating the LIXIM model with these data, and predicting net mineralization and leaching for each time step. This approach was applied to many experimental sites in France, to create reference values for mineralization in French soils under contrasting soil and cropping conditions [12,35]. However, it has the disadvantage of being labor intensive and limited in the number of fields to which it can be applied. A second, simpler approach consists of estimating net mineralization using the N mass balance of a crop, which is based on measuring the N taken up by the crop and the difference between the initial and final contents of soil mineral N [4,5,36,37]. This method has the advantage of being based on the functioning of the soil–plant system under field conditions.
Mineralization estimated from these field experiments depends on the dynamics of soil water content and temperature, which are influenced by the weather conditions during each experiment. Consequently, it is necessary to control for the influence of weather to be able to assess the effects of the cropping system and soil properties [34], thus, converted “true time” into normalized time, which is calculated as the product of a temperature function and a water-content function, using the parameters developed by Rodrigo et al. [38]. Mineralization during a measurement period is, thus, estimated as a daily normalized mineralization rate (Vn) multiplied by the normalized time calculated during the period.
Applying the N mass balance method in France led to a compartment approach [39], in which one estimates, separately, the mineralization of residues of the previous crop, recent applications of organic waste, recent plowing of grassland, and the “baseline mineralization” of soil organic N (SON). Experiments to measure baseline mineralization based on the N mass balance in the field are rendered more complicated by this coexistence of flows from other compartments. Consequently, some studies have used models to subtract mineralization of residues of the previous crop [4,5], thus adding uncertainty to estimates of basal mineralization.
To create the best conditions possible for quantifying mineralization of organic N in the field, we developed an original experimental design, supported by five years of monitoring, of a network of 137 fields in Brittany, in western France. Net N mineralization (Mn) was quantified by field measurements of the mineral N mass balance of a maize crop that remained unfertilized for all five years, and whose aboveground biomass was completely removed from the field at harvest, in order to minimize the amount of crop residues returned to the soil. Only data from the last three years were analyzed, in order to limit biases resulting from inputs of fertilizers and crop residues incorporated into the soil before the experiment began. The innovations of this experimental approach were, thus, (i) to create the best possible conditions for estimating these N flows and (ii) to measure these flows frequently over a long period to obtain more accurate estimates of mineralization.

2. Materials and Methods

For more details on the methods, see Morvan et al. [40].

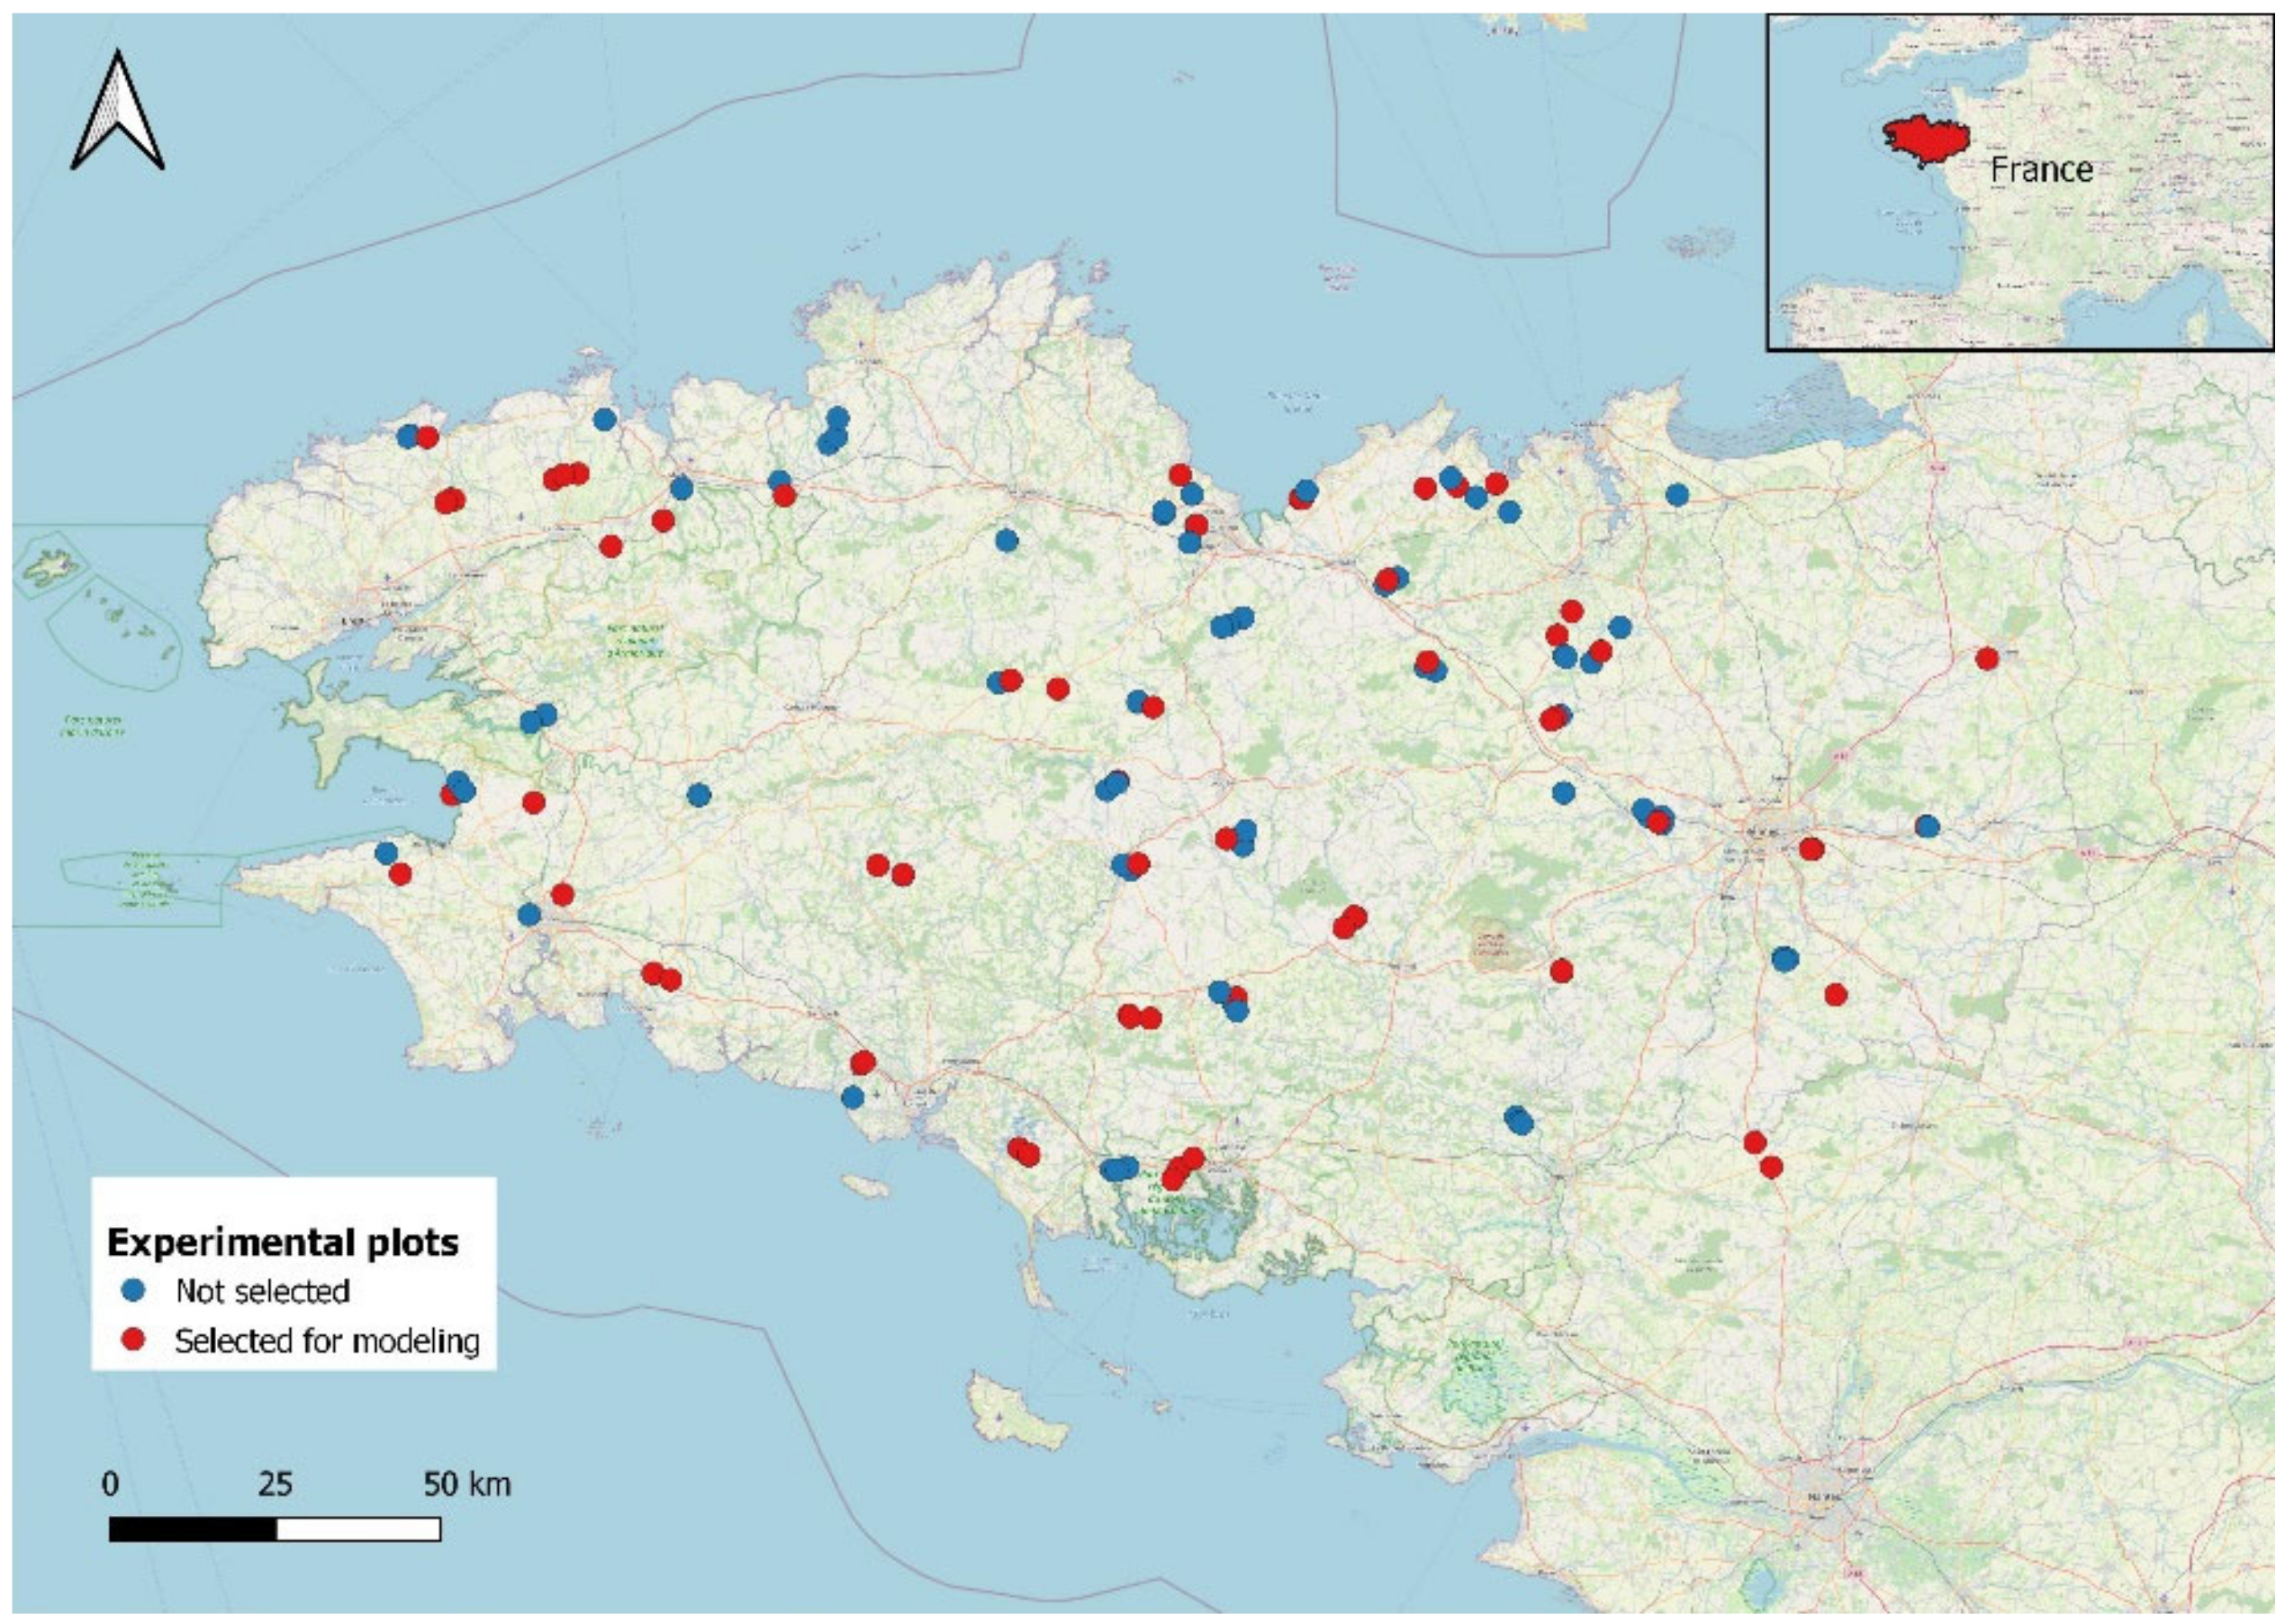
2.1. Network Presentation
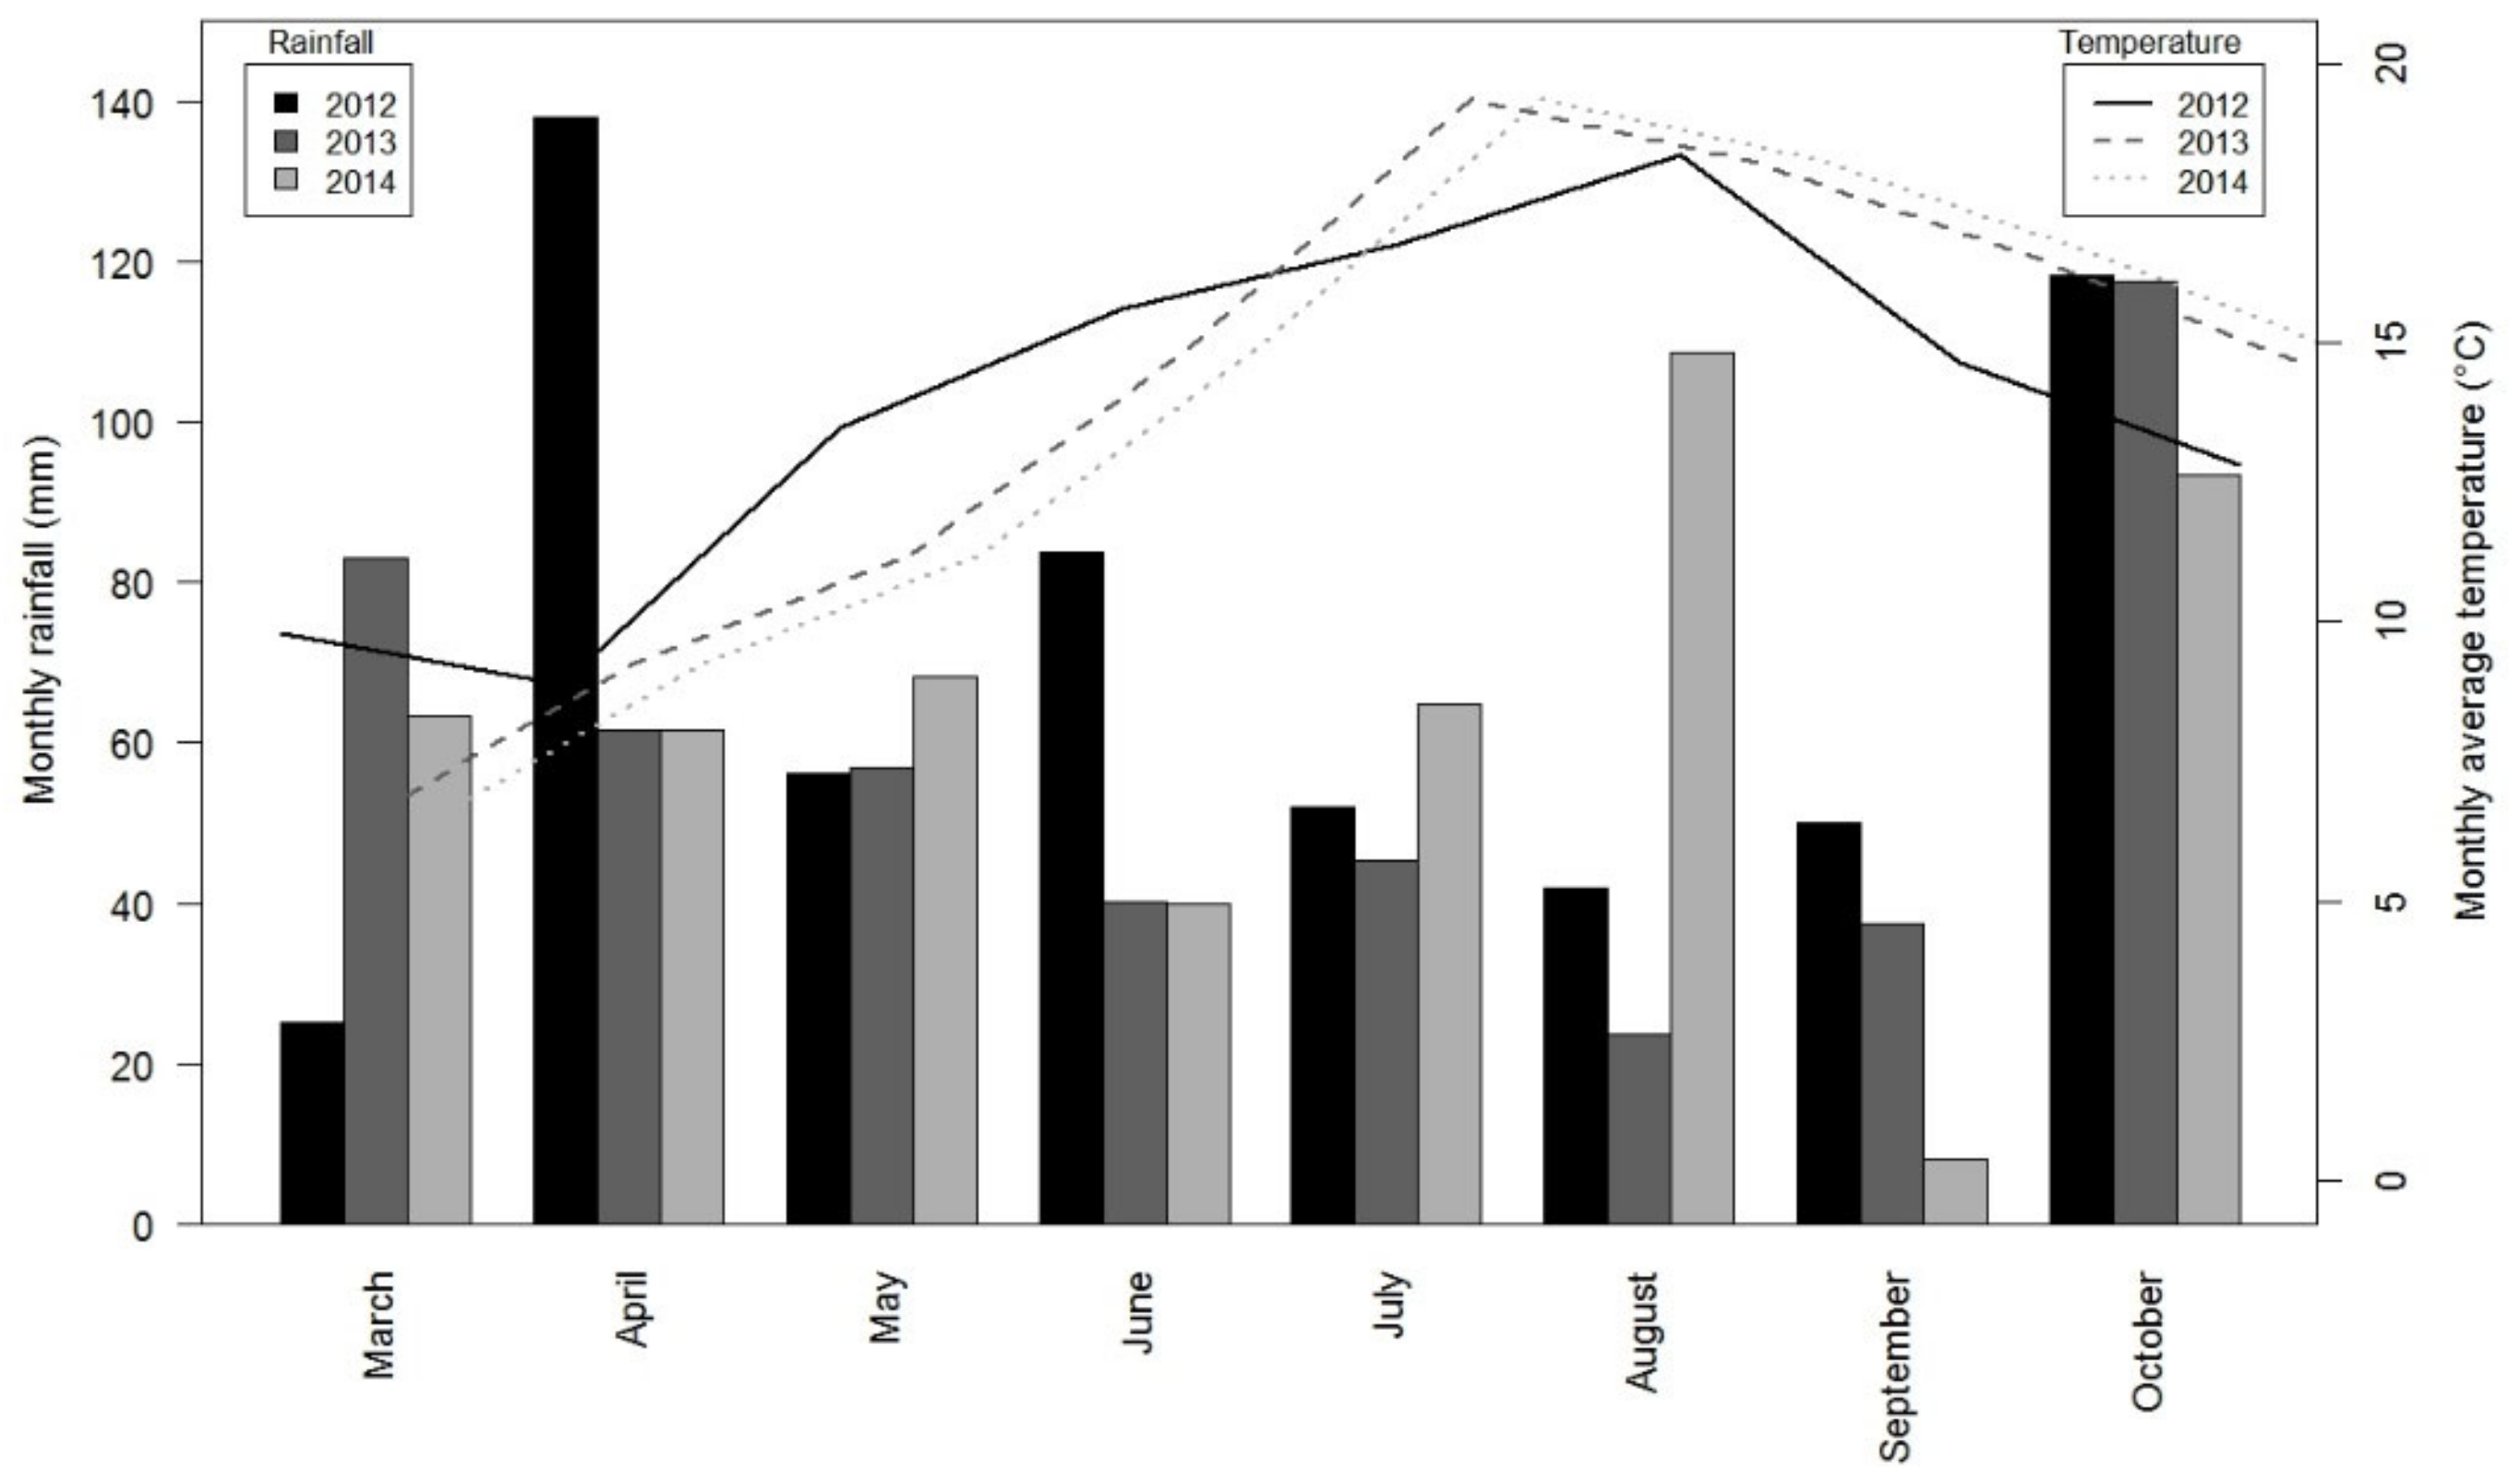
Experiments were performed in a network of 137 cultivated fields located throughout Brittany (Figure 1). The soil was sampled in each field to determine its depth, layers, and textural class. In the upper layer (0–30 cm), most soils had a silty loam (n = 81) or loamy (n = 33) texture. The other soils were sandy loam (n = 15), clay loam (n = 4), silty clay loam (n = 3), and silty clay (n = 1).
Before the experiments, 82 fields had annual crop rotations, 30 fields had grassland in their rotations, and the remaining 25 fields were summer fallow or cultivated with vegetables. Animal waste was regularly applied to half (n = 65) of the fields, especially on maize crops; of these fields, 26 received manure every year, with one or two applications per year. Fifty-seven fields received at least one application every four years of cattle manure (n = 36), pig slurry (n = 14), cattle slurry (n = 8), or poultry manure (n = 5).

2.2. Climate

The climate in Brittany is mild oceanic temperate, with a pronounced east-west rainfall gradient. The weather differed among the three experimental years analyzed. The year 2012 was variable, with dry periods in winter (January and February), rainy periods in April and June, and rainfall close to the mean observed from 1994–2014 in July (Figure 2). In contrast, 2013 was dry, especially in summer, with monthly rainfall that was much lower than the mean, while 2014 was rainy, especially in winter (January and February) and in summer (July and August). In addition to this inter-annual variability, the weather varied greatly among fields within a given year.

2.3. Experimental Design

The objective of the experiment was to quantify the “baseline” mineralization of soil organic N, since the N mass balance used in this experiment included N mineralization not only from this compartment, but also from other compartments, including animal waste and annual crop or grassland residues recently incorporated into the soil. To this end, (i) the 137 experimental fields were cropped with silage maize for four (since 2011) or five (since 2010) consecutive years without any mineral or organic fertilization, and (ii) only mineralization data for 2012, 2013 and 2014 were considered, to exclude N flows resulting from inputs of fertilizers and crop residues incorporated into the soil before the experiment began. The experimental design was, thus, based on estimating N mineralization for three consecutive years. Experimental monitoring was performed on an area of 1485 m² (33 m × 45 m), divided into three subplots of 45 m² (6.0 m × 7.5 m) in the middle for replicate measurements.

2.4. Calculating Net Soil N Mineralization
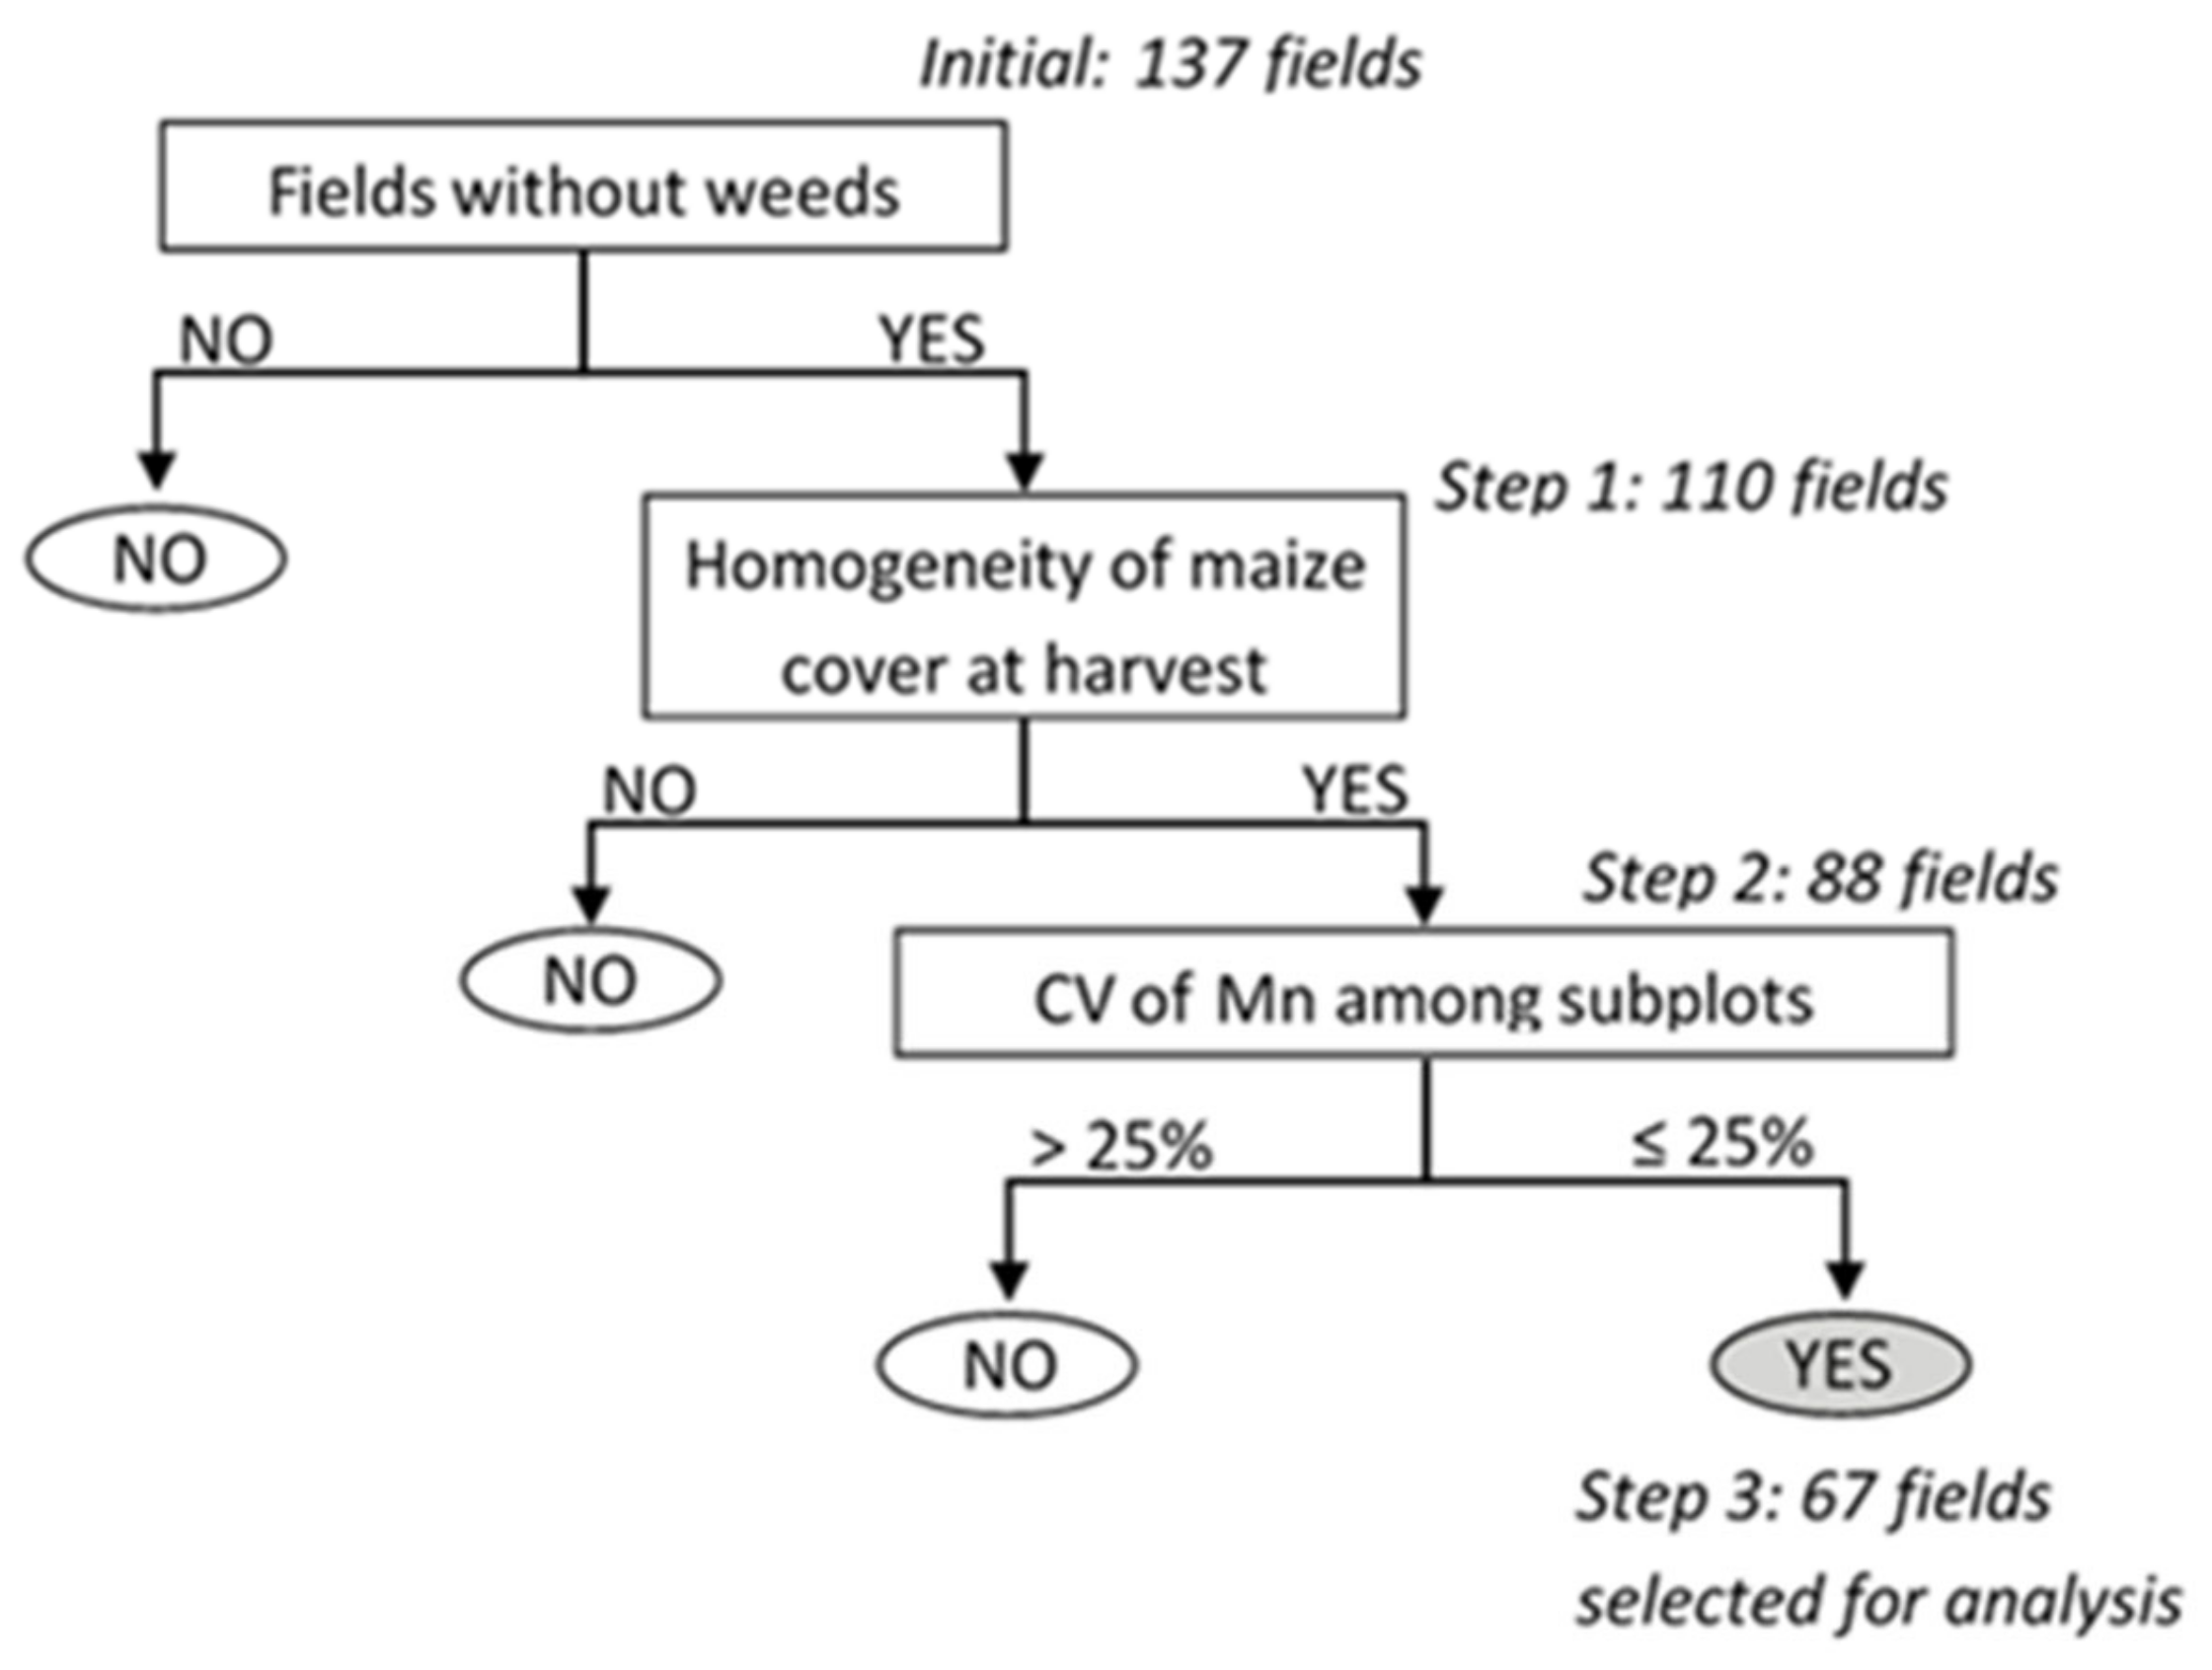
Mn was calculated from the end of winter to the beginning of autumn from the mineral N mass balance of a maize crop not fertilized with N, as follows:
Mn = Nf − Ni + N uptake + Nleached
with Ni and Nf corresponding to the soil mineral N content in the 0–90 cm soil profile in March and October, respectively; Nuptake corresponding to N uptake by the plant (kg N ha−1); and Nleached corresponding to nitrate leaching that may occur in spring, after measurement of Ni (kg N ha−1).
Ni, Nf, and Nuptake were measured in triplicate. Nleached was estimated using the STICS model [41], which was parameterized with the soil properties of each field, and initialized at the measurement date of Ni. Equation (1) is a simplified approach for estimating the mineral N mass balance, but it is valid in situations without N fertilization. Gaseous N losses can be assumed to be very low and compensated by atmospheric deposition and symbiotic fixation of N.
Since N mineralization depends strongly on weather conditions, we controlled for the influence of weather on mineralization by converting true time into normalized time (nday), using functions integrated into STICS [41], in order to model the effects of temperature and soil water content on N mineralization. The effect of soil temperature on mineralization is described by a logistic function, which is roughly exponential from 0–25 °C. This function is similar to an Arrhenius function, with an activation energy of 78 kJ mol−1 K−1 from 0–35 °C, and also equivalent to a Van ’t Hoff function, with a Q10 coefficient of 3.15 from 0–35 °C from 0–25 °C. The effect of soil water content on mineralization is described by a linear function. Mineralization in temperate soils peaks when soil water content equals field capacity and stops when the ratio of soil water content to field capacity is less than 0.3 [38]. The Mn estimated from the N mass balance for each year and field was then divided by the normalized time for each year, which gives a daily “normalized” rate of mineralization Vn (kg N ha−1 nday−1). Mean Vn (Vnmean) was calculated for each field by averaging Vn for all three years of measurements.

2.5. Data Screening

Data were screened to exclude the fields in which agronomic or measurement problems had occurred. They were represented in a decision tree with three nodes (Figure 3): (i) the presence of weeds, which can compete with maize and bias estimates of Mn; (ii) non-homogeneous maize cover at harvest, which can bias measurements of Nf and N uptake and, thus, estimates of Mn; and (iii) excessively high variability in Mn among the three subplots. We considered, as outliers, fields whose coefficient of variation of Mn was greater than or equal to 25% (i.e., the 95th percentile) in 2012, 2013, or 2014. To retain the most consistent data and, thus, decrease uncertainty in estimates of Mn, we excluded these fields from further analysis and modeling.

2.6. Soil and Plant Analysis

Initial soil mineral N content (Ni) was measured at the end of winter (March), and final soil mineral N content (Nf) was measured at the beginning of autumn (October), before resumption of nitrate leaching. A composite sample of 10 soil cores was created for each subplot, for three layers (0–30, 30–60 and 60–90 cm). Soil mineral N was extracted in a 1M KCl solution using a soil/KCl ratio of 1:2, and the NH4+ and NO3 contents of the soil extracts were then determined by continuous flow colorimetry by the methods developed by [42] and [43], respectively.
The soil of the upper layer was sampled in March 2013 to estimate soil properties. Samples consisted of 10 cores, which were pooled. Total carbon (C) and N were determined by the Dumas dry-combustion method. Cation exchange capacity was established using the Metson method [44], and pH was obtained in water [45]. Soil texture was based on measuring the particle size of five fractions: clay (<2 µm), fine silt (2–20 µm), coarse silt (20–50 µm), fine sand (50–200 µm), and coarse sand (200–2000 µm) [46]. POM was determined using a simple fractionation method, by wet sieving under water with a 50 mm sieve [16]. POM was recovered on the sieve, dried, weighed, and finely ground before analyzing the C and N contents by the Dumas dry-combustion method using a Thermo Finnigan Flash EA 1112 Series analyzer.
The fumigation-extraction method was used to estimate soil microbial biomass (SMB) [47], using 40 g of an oven-dried equivalent of soil, shaken in 200 mL of 0.025M K2SO4 for 45 min. Non-fumigated soils were also extracted in the same way. Oxidizable C in the fumigated and non-fumigated K2SO4 was determined using a V-WS SHIMADZU TOC analyzer. A kEC conversion factor of 0.38 was applied to convert the flush of oxidizable C into SMB. EON was determined using the method of [48]: 4 g of soil were steam distilled in 40 mL of phosphate borate extractant (buffered at pH 11.2) for 8 min, and ammonium in the distillate was back titrated using 0.0025 M H2SO4. The amount of organic N hydrolyzed, which corresponded to EON, was obtained by subtracting the total NH4-N extracted from native NH4-N. Mean soil properties, POM-N, SMB, and EON are summarized in Table 1.
Bulk density was measured once, in triplicate, in 2011, for each experimental field and each of the three soil layers (0–30, 30–60 and 60–90 cm), using an 8 cm diameter root auger, which cored undisturbed samples of a known volume. The bulk density of the fine-earth fraction calculated from the dry mass and the core volume was used to convert the mineral N content of the samples to kg N ha−1 and to calculate the stocks of SON and POM-N (t N ha−1), as well as those of EON and SMB (kg N ha−1).
Aboveground biomass and N content of the maize crop were quantified at harvest, when maize plants were harvested and weighed in all subplots. Total N uptake of maize was calculated by multiplying N in the aboveground biomass by 1.15 to estimate its belowground N at harvest [49].

2.7. Calculating an Indicator of the Cropping System

An indicator of the cropping system (I_Sys) was calculated to integrate the diversity of field management (i.e., crop rotation and organic waste application) among fields, considering a period of 15 years before the year of interest. I_Sys was calculated by summing an indicator of the effect of the N returned to the soil in crop residues and an indicator of the effect of repeated applications of organic waste on soil mineralization. See [40] for details on calculation of the indicator. To assess the influence of I_Sys on the N mass balance and soil N mineralization, we classified its values into three levels using k-means clustering: low (≤63 kg N ha−1), moderate (63–98 kg N ha−1), and high (>98 kg N ha−1). These three classes contained 32%, 53%, and 15% of the fields, respectively.

2.8. Statistical Analysis

All statistical analyses were performed with R, v 4.1.0 [50]. Pearson correlations were used to assess relations between variables. Analysis of variance (ANOVA) was used to compare means when data were normally distributed (according to the Shapiro–Wilk test) and had homogenous variances (Levene’s test); if not, the Kruskal–Wallis test was used.
Generalized additive models (GAMs) were used to predict Vn [51]. This innovative method consists of selecting soil properties for a given GAM, which can best explain the variation in N dynamics [51,52]. GAMs can distinguish the relative effects of covariates by allowing for nonlinear relations between them and the variable studied (i.e., Vnmean). Variables were chosen to obtain models with the smallest mean square error of prediction (MSEP) [53]. This criterion was calculated by applying a “leave-one-out” strategy, which represented an internal validation of the model and avoided over-fitting the model to the data. The agreement between predictions and observed Vnmean was evaluated statistically by calculating the coefficient of determination (R²) and the root mean squared error (RMSE) [53]. Additionally, the ratio of performance to inter-quartile distance (RPIQ) was calculated as the ratio of the inter-quartile range to the square root of the MSEP [51,54]. RPIQ represents the degree to which the dispersion of the response variable exceeds the model’s prediction error. We also calculated the indicator dMSEP, which represents the proportional increase in prediction error (MSEP) when a given variable is removed from the model, as a metric of the relative importance of the variable.

3. Results

3.1. Accuracy of the Dataset

The criteria applied using the decision tree (Figure 3) led to the final selection of 67 fields (26, 22, and 19 fields were excluded at the 1st, 2nd, and 3rd nodes of the tree, respectively). The selection was severe because a given field had to avoid problems all three years (2012, 2013, and 2014). The 67 fields selected remained representative of the diversity of soil characteristics, cropping systems (Table 1 and Figure 4) and geography of the initial network (Figure 1). To ensure that screening the data had not introduced bias, we verified that the distribution and mean of Mn had remained similar. Mn varied little among subplots over the three years (mean standard deviation of 15 kg N ha−1, with a mean CV of 10% for the 67 fields), which illustrates the high precision of the N mass balance in the selected dataset.

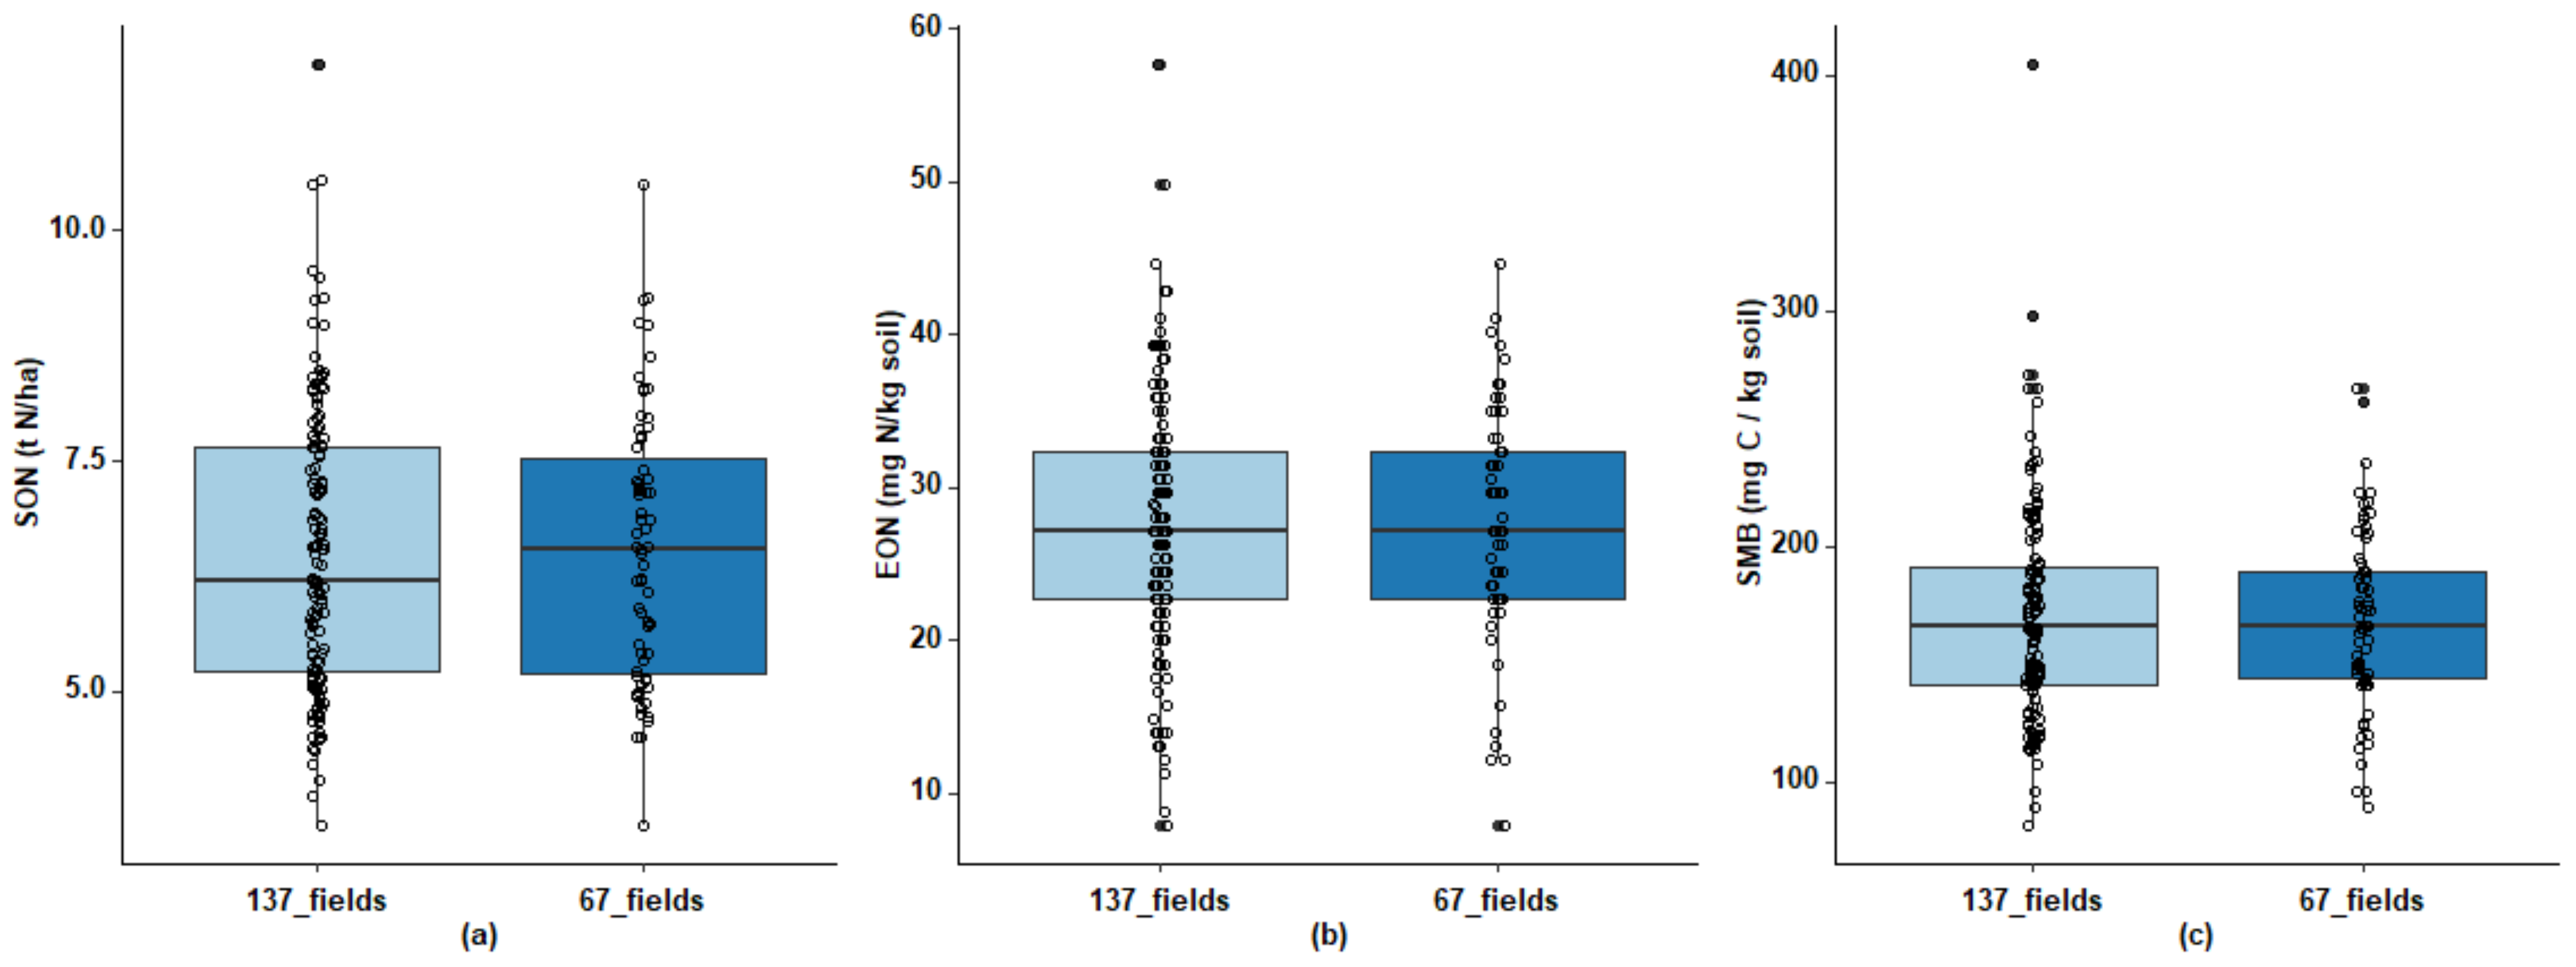
3.2. Soil N Mineralization: Mass Balance Components and N Rates

Mean, minimum or maximum Mn from March to October were similar for the 67 fields in all three years (e.g. mean Mn was 162, 146 and 154 kg N ha−1 in 2012, 2013 and 2014, respectively) (Table 2). Mean N uptake by maize was the main component of the N mass balance, particularly in 2014, when it repesented 95% of Mn vs. 88% in 2012 and 73% in 2013 (Table 2). Lower N uptake in 2013 was explained by the weather conditions, with low rainfall from June to September that induced hydric stress. Mean predicted nitrate leaching in early spring was low in 2013 and 2014 but was a significant component of the N mass balance in 2012 (21 kg N ha−1) (Table 2); this difference can be explained by higher Ni due to less leaching during the preceding winter and high rainfall in April (138 ± 32 mm).
Although the fields were unfertilized and soil N mineralization was the main source of N for plants, the mean N Nutrition Index (NNI) [55] was high for unfertilized crops, particularly in 2012 (0.88) and 2014 (0.92) (vs. 0.73 in 2013), reflecting high availability of N during the crop cycle. Mean Vn was similar in 2012, 2013, and 2014 (0.99, 1.06, and 0.92 kg N ha−1 nday−1, respectively), in agreement with the hypotheses on which the experimental design was developed (Table 2).

3.3. Correlations between Vn, Soil Properties, EON, and I_Sys

Vnmean correlated most strongly with EON (r = 0.47), SMB (r =0.45), POM-N (r = 0.43), and, to a lesser extent, SON (r = 0.31) (Table 3). Texture, particularly clay content, can influence N mineralization strongly, and Vnmean had a significant but weak negative correlation with clay content (r = −0.19), yet a stronger positive correlation with the coarse sand content (r = 0.32). Vnmean also correlated strongly with I_Sys (r = 0.39), which was highlighted by a significant effect of I_Sys class on Vnmean (p < 0.05) (Figure 5b): mean Vnmean of the high I_Sys class was 29% higher than that of the low I_Sys class (1.11 vs. 0.86 kg N ha−1 nday−1, respectively). This difference was due to much lower Vn measured in fields with low I_Sys, which corresponded to fields without grassland in their rotation and without organic manure application. SON was strongly correlated with EON (r = 0.64) and POM-N (r = 0.75), while POM-N was also correlated with EON (r = 0.50).

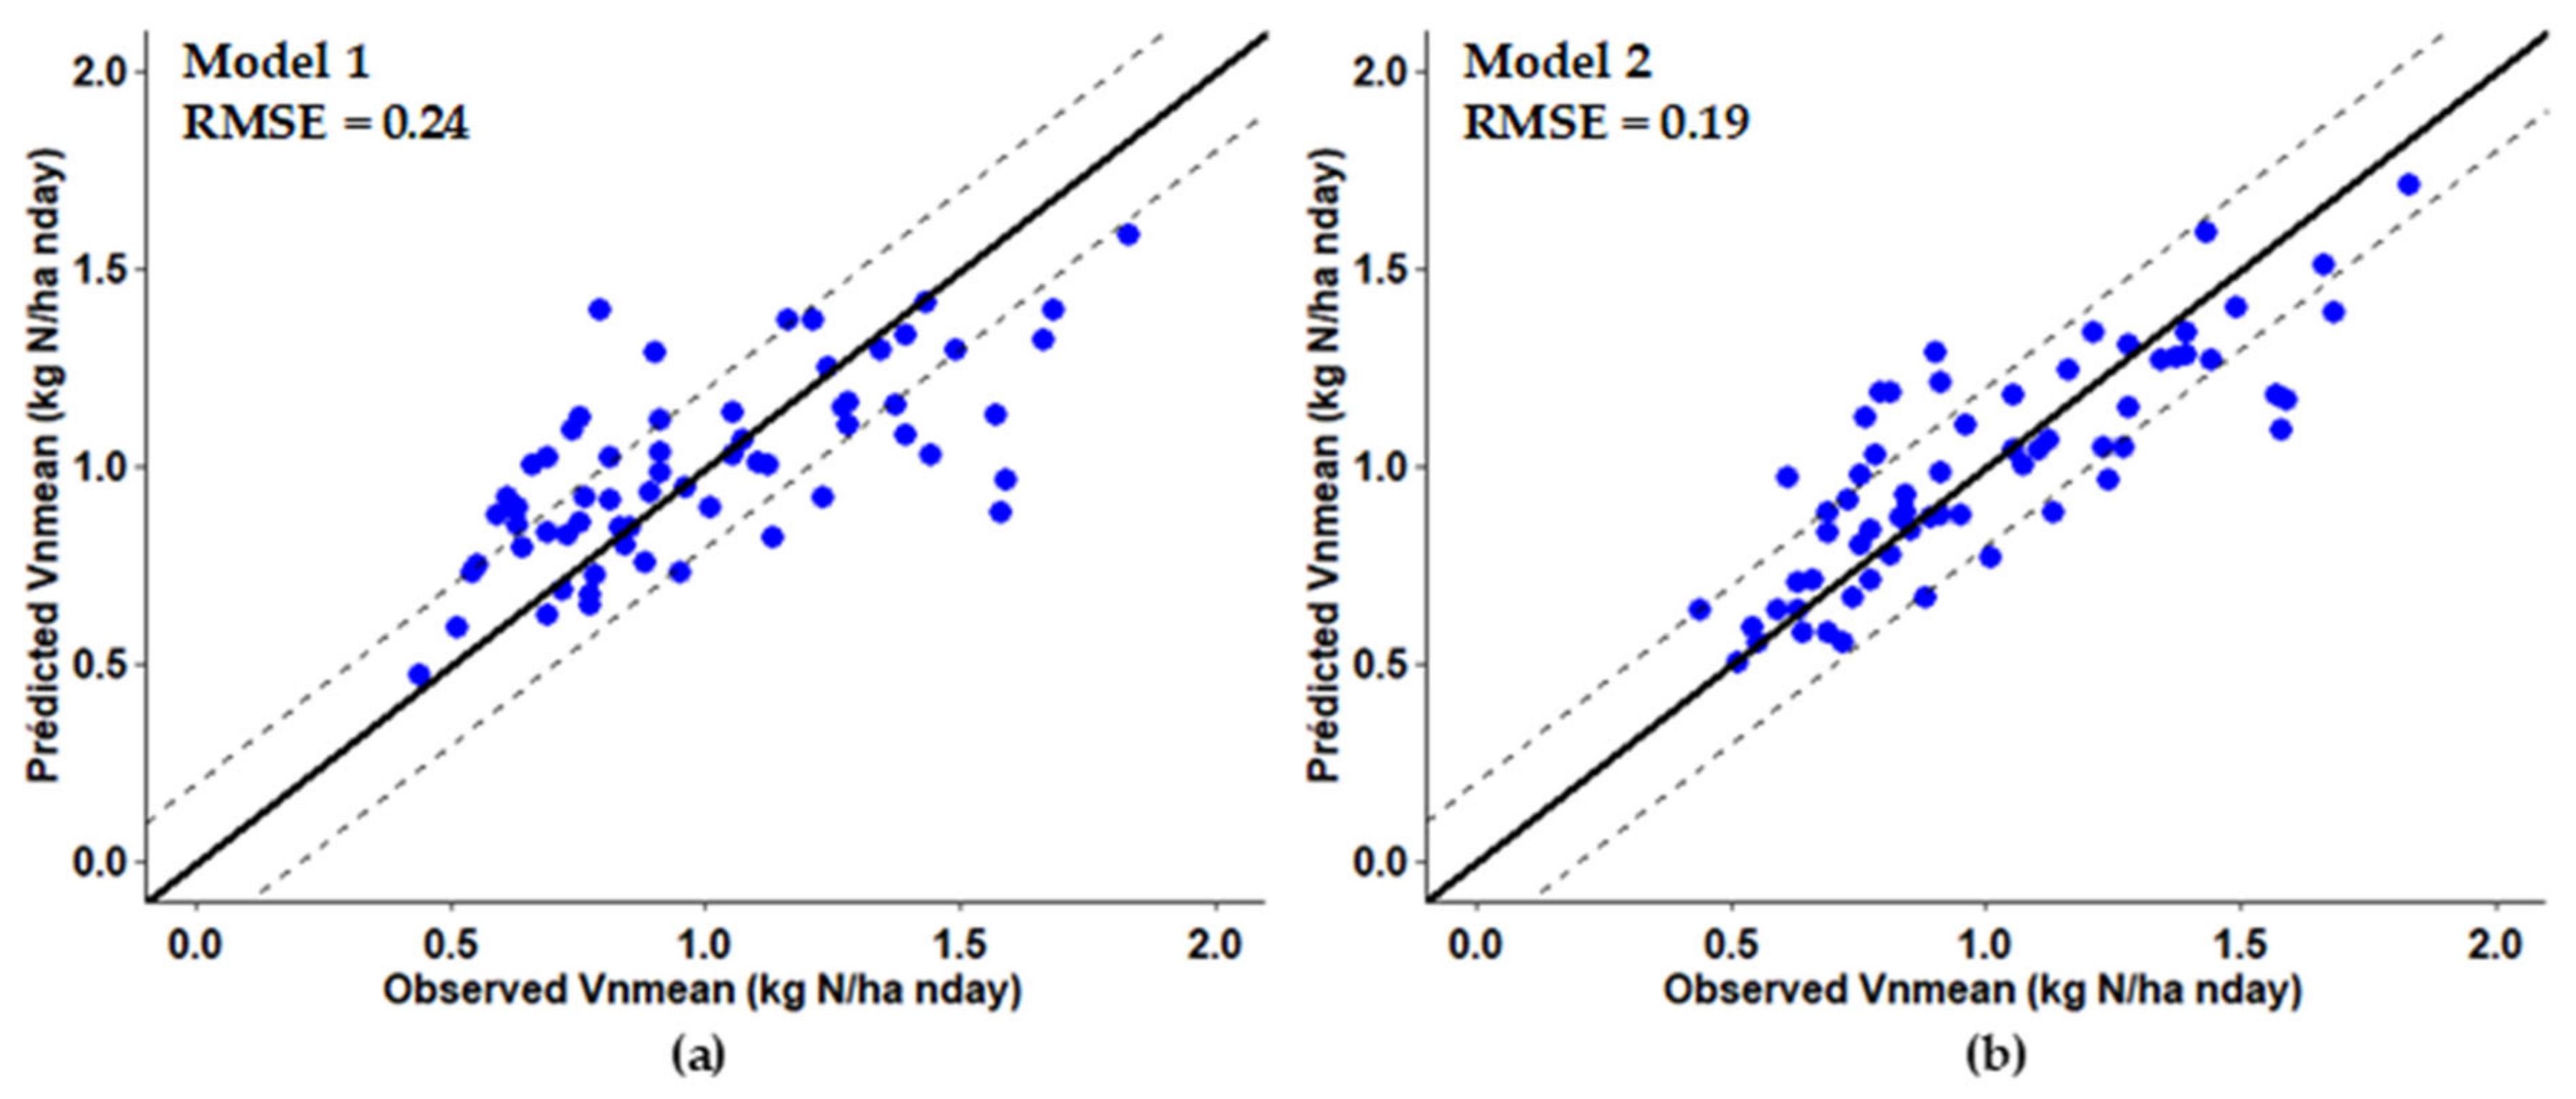
3.4. Modeling Normalized N Mineralization Rate

A model that predicted Vnmean using only soil properties and the I_Sys indicator (model 1) explained only 47% of the variance in mineralization (Table 4, Figure 6a). The soil properties selected were SON, clay, coarse sand and coarse silt. A quadratic relation was observed with coarse sand and clay, with a negative effect of clay contents that exceeded 22 g kg−1. A positive linear relation was observed with I_Sys, which was the most influential variable after coarse sand (Table 4). The model’s RPIQ value of 1.8 was moderate.
We then developed a model with EON, SMB and POM-N as additional input variables (model 2). The same soil physical properties as in model 1 were selected, as was the I_Sys indicator, and they had similar relationships (Table 4). The additional variables selected were EON and SMB, which significantly increased the proportion of variance explained (R² = 0.67) (Figure 6b) but increased the RPIQ value only moderately (2.2). EON and SMB were selected because they were the two variables most correlated with Vnmean but not correlated with each other (r = 0.14). Because they provided complementary information, it was useful to include them both in the model. SON was not selected due to its strong correlation with EON.

4. Discussion

4.1. Soil N Mineralization and N Rates

The approaches used to estimate Mn in crop fields agree that crop N uptake is the main component of the N mass balance [5,9,37,56,57]. Nonetheless, we observed relatively high variability in the contribution of N uptake to the mineral N mass balance among the three years: 95% in 2014, but only 73% in 2013 [40]. This can be explained by differing weather conditions between years, with high hydric stress in summer 2013, which may have decreased both soil N mineralization and plant growth. In addition, this drought period was followed by strong rainfall events at the end of summer, which could have created favorable conditions for N mineralization just before Nf was measured [58,59]. This can explain why the mean difference between Nf and Ni equaled 24% of Mn in 2013, and why Nf was higher that year. Calculating the N mass balance from March to October, thus including mineralization at the beginning of autumn, explains why mean Mn was similar among the three years. Mn likely would have differed even more if Nf had been measured immediately after harvest, as illustrated by the large inter-annual variability observed by Delin and Linden [9].
Comparing the Mn measured in the field to data from the literature is difficult because measurement periods can vary from 5–8 months depending on the crop (e.g., wheat, spring barley, maize, sugar beet), which has a huge influence on mineralization [36,37]. Comparisons must, thus, be made with daily Vn, either provided directly by studies (which is rare) or estimated later from their data. Delin and Linden [9] reported mean daily rates of 0.34 ± 0.12, 0.50 ± 0.17, and 0.69 ± 0.16 kg N ha−1 day−1 in a field experiment with 34 cereal fields studied for three consecutive years. Vnmean estimated from data of Engels and Kuhlmann [36] equals 0.37 ± 0.17 under wheat and 0.67 ± 0.23 under sugar beet, while those estimated from data of [37] and [60] under maize equal 0.71 and 0.68 ± 0.19 kg N ha−1 day−1, respectively, which lie in the same range as those we measured in our network (Table 2). These reference values show the high variability in Mn among fields.
Expressing Vn in normalized time is the best basis for comparison, since it controls for the influence of weather, but it has rarely been used in the literature. From a database of 65 soils, Clivot et al. [12] report a range of 0.17–1.67 kg N ha−1 nday−1 (mean = 0.72 ± 0.32 kg N ha−1 nday−1). Oorts et al. [35] calculated normalized Vn of 0.57 and 0.62 kg N ha−1 nday−1 at two experimental sites with field crops,. The normalized Vn that we calculated from the network (mean = 0.99 kg N ha−1 nday−1), thus, lie near the top of the range reported in the literature.

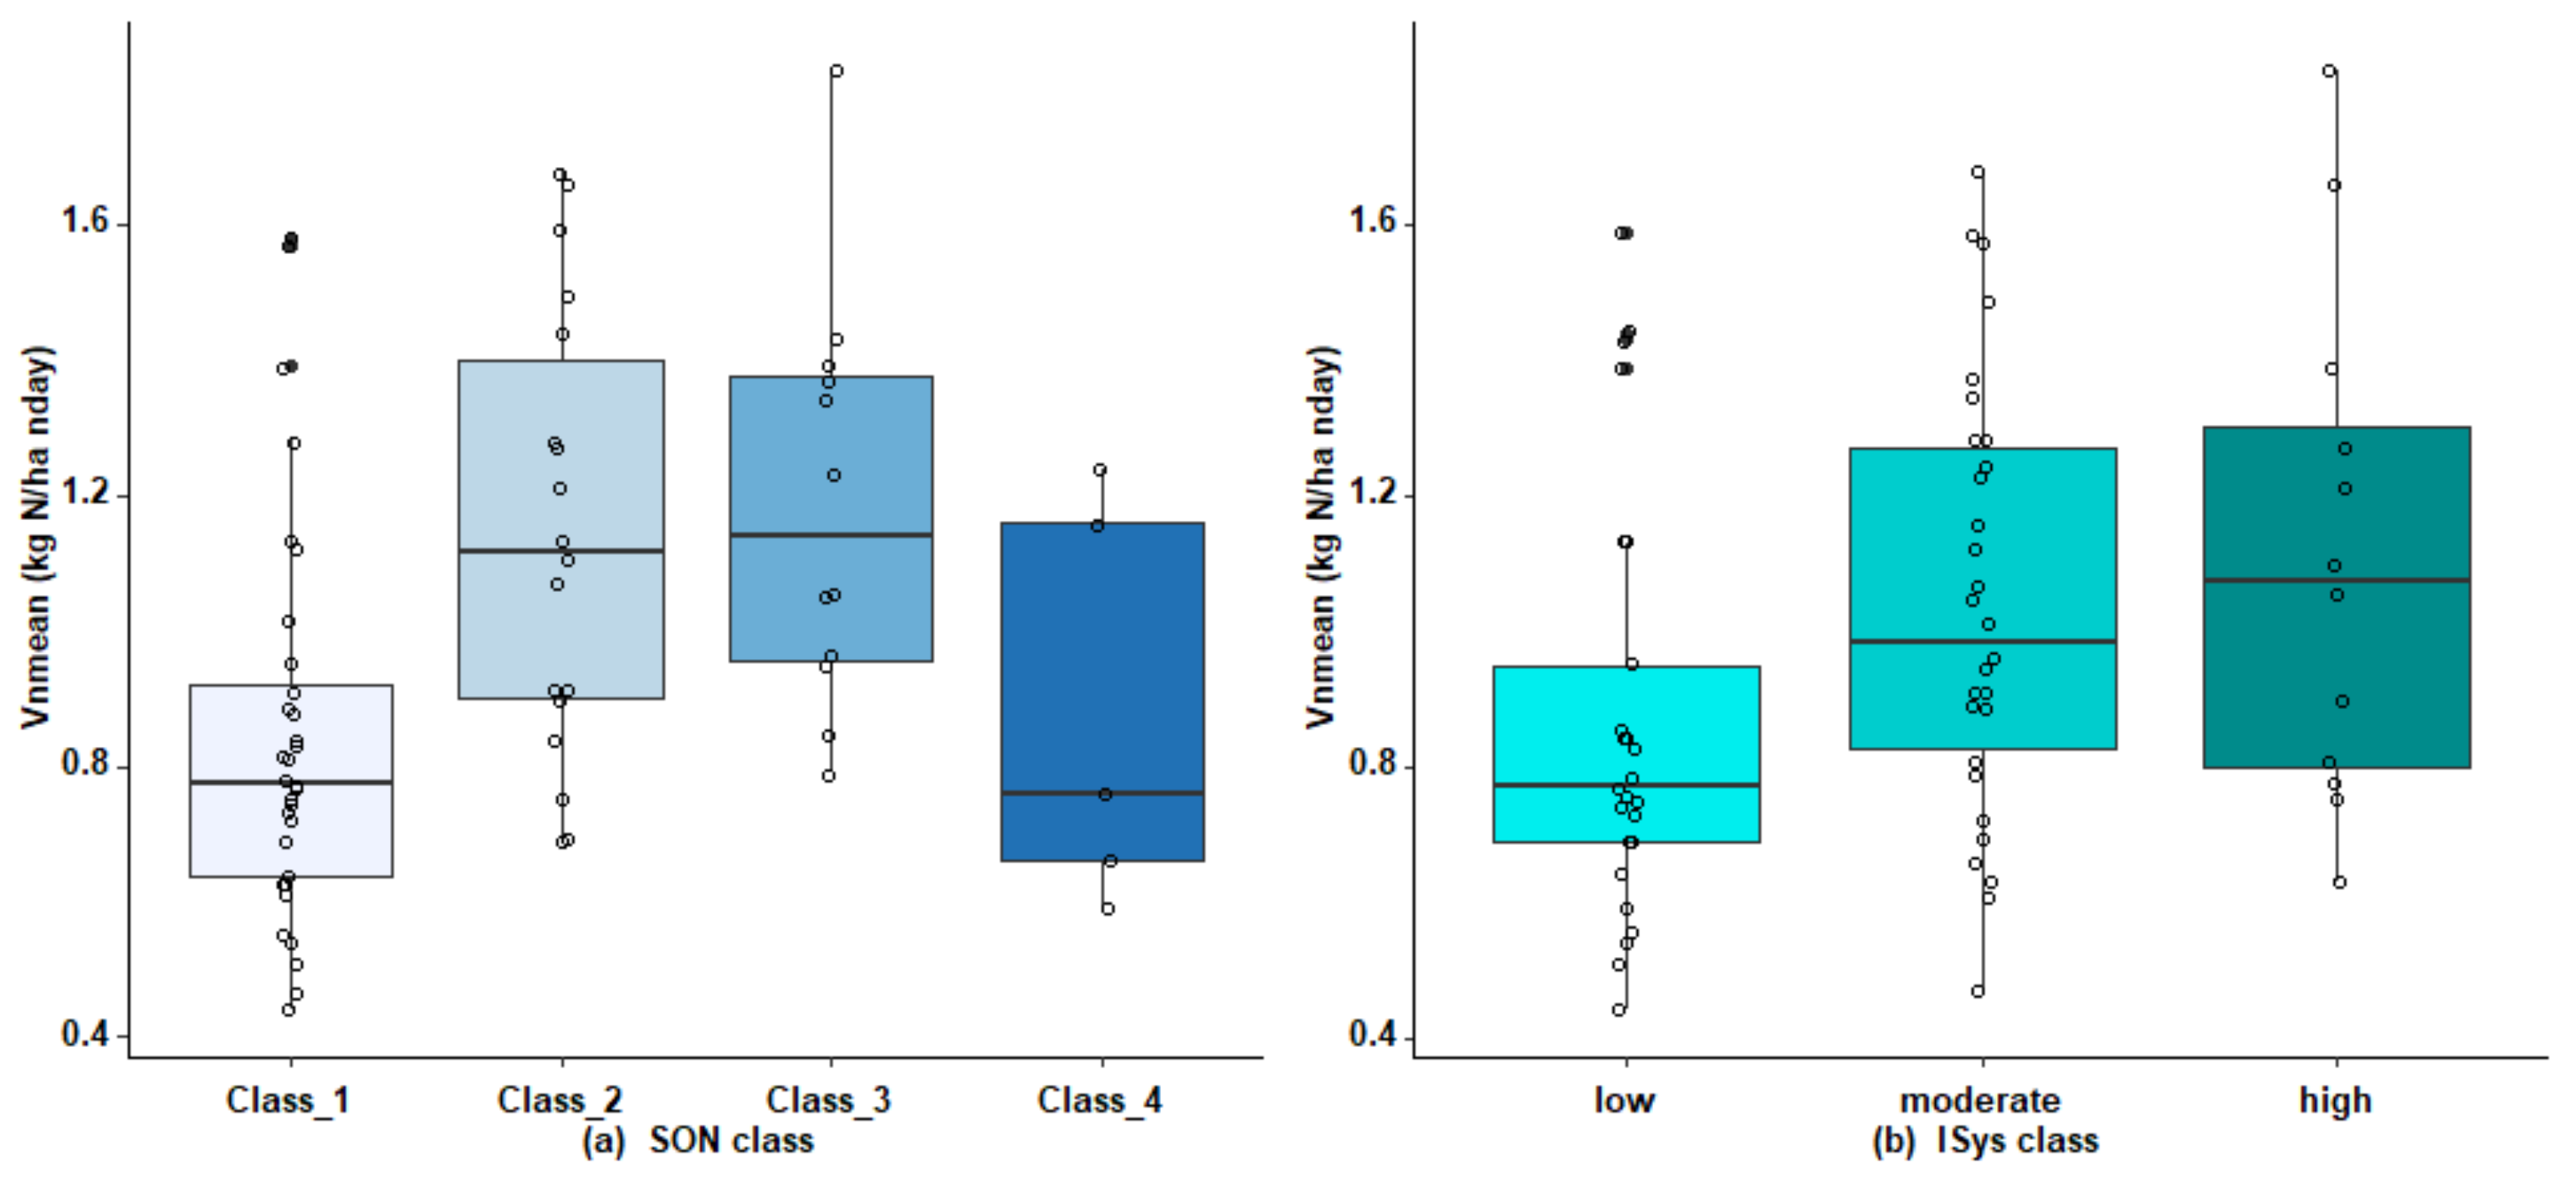
4.2. Effect of Cropping System on Net N Mineralization

Many studies of data from long-term experiments have demonstrated the influence of crop rotation and management practices on soil N availability [20,26,61,62,63,64,65]. The wide variety of cropping systems studied in the network confirmed this influence (Figure 5b) via the I_Sys indicator, which integrated the influence of the crop rotation and organic waste application only over the medium term, since the experiment was designed so that no organic waste had been applied or grassland had been plowed within the previous three years. I_Sys values varied widely, ranging from 14–185 kg N ha−1 and integrated the effects of crop rotation well, especially the presence of grassland in the rotation and the frequency of organic waste application [40]. I_Sys values were low for forage maize monocultures and even lower in fields in which no organic waste had been applied. In contrast, I_Sys values were highest for rotations with grazed grassland and increased as the age of grassland increased; it is well known that grassland age influences mineralization, since soil N mineralization increases as the age of temporary grassland increases and decreases for the annual crops planted for one–three years after a grassland [66]. I_Sys values were intermediate for common rotations, such as grain maize/wheat/rapeseed/barley (with maize and rapeseed fertilized with pig slurry) or grain maize/wheat/three years of grazed grassland (with maize fertilized with cattle manure).
Regular application of organic waste increases stocks of C and N over the medium term, which influence POM [26], SMB, and mineralization activity over the long term [67]. However, this influence depends greatly on the type of waste, the amount applied, and the frequency of application; frequent application of solid waste (e.g., manure, compost) has more influence on mineralization than that of liquid waste [29,68], which justifies the choice of a model that integrates these driving factors into the I_Sys indicator [40].

4.3. Correlations between Vn, Soil Properties, EON and I_Sys

The study confirms the significant correlation between Vnmean and SON, which has long been identified as an important variable that influences mineralization [9,12,28,69,70,71]. However, SON explained much less variance in Vnmean in our dataset (R² = 0.10) than in the study of Clivot et al. [12] (R² = 0.26) or the meta-analysis of Ros et al. [31] (R² = 0.40). This difference may be explained by the non-linear relation between SON and Vnmean, in which mineralization plateaus at high SON (Figure 5a), due to a larger proportion of stable organic matter in soils in the network. In fact, Vnmean was much more strongly correlated with SMB than with SON, thus confirming that SMB is a valuable indicator of soil N availability [23,72] and is more important for nutrient turnover and availability to plants than SON [73].
Vnmean was also more strongly correlated with POM-N than with SON, thus confirming the utility of measuring POM-N to estimate mineralization, since POM-N can be considered an unprotected potential source of N. Some studies identify POM-N as a strong predictor of mineralization [14] or one of its main drivers [21], while other studies indicate only that the N available from it depends greatly on its chemical composition and C:N ratio [17].
Among important soil properties, soil texture has often been observed to influence the availability of substrate for mineralization, since high clay content decreases SON decomposition by better protecting SON chemically and physically [9,10,74]. We observed a weakly significant negative correlation between Vn and clay content; the correlation itself was also weak, perhaps due to a relatively small range of clay contents in the soils studied. In contrast, we observed a stronger positive correlation between Vnmean and the coarse sand content, since the soils with higher SON also had higher coarse sand contents.
Finally, our results confirm the utility of the EON method we used, since its correlation with Vnmean was much stronger than that between SON and Vnmean. However, the variance explained by EON (R² = 0.23) was much lower than that observed by Gianello and Bremner [48] (R² = 0.81), Schomberg et al. [75] (R² = 0.58), and Ros et al. [31] (R² = 0.50). This can be explained in part by the fact that these strong correlations were observed from laboratory measurements of mineralization, while mineralization and these indicators usually have weaker correlations when mineralization is measured under field conditions [31].

4.4. Modeling the N Mineralization Rate

Evaluation of six process-based models of European cropping systems led Yin et al. [76] to conclude that all of the models had difficulties predicting both the mean of and variance in soil N mineralization. It is clear that predicting Mn remains a challenge, due to the complexity of N cycling, which demonstrates why even the best models can explain only 65–80% of the variance [12,77]. Model 2, calibrated with our dataset, lies in this range. We also observed that a model parameterized only with soil properties and the I_Sys indicator was less accurate than the “soil” model of Clivot et al. [12] (R² = 0.61). It confirms, in the present study, the utility of using mineralization indicators as input variables of models, obtained either by measuring EON [69] or by incubation measurements [5,77].
SMB is rarely used to predict mineralization because it is relatively labor intensive, and few laboratories measure it routinely. Clivot et al. [12] concluded that SMB improved prediction of mineralization little, if SON had already been included as an input variable; this can be explained by the weaker correlation between the mineralization rate and SMB in their study than that with SON (r = 0.54 vs. 0.62, respectively), even though both were highly significant. In contrast, Vnmean and SMB were more strongly correlated in our dataset than Vnmean and SON (r = 0.48 vs. 0.31, respectively), thus replacing SON with SMB increased the accuracy of the GAMs.
The I_Sys indicator significantly increased the accuracy of mineralization predictions and represents an original contribution of this study. The selection of I_Sys in the final GAM confirms the influence, in the medium term, of crop rotations and the application of organic waste on mineralization, while also providing information that complements that provided by SMB and EON. The lack of correlation between I_Sys and these two variables leads to the hypothesis that EON is relatively insensitive to the cropping history over the medium term but is strongly influenced by the geochemical background and the cropping history over the long term, as shown by its strong correlation with SON (r = 0.64).

5. Conclusions

The experimental design of this study, based on repeatedly measuring Mn for three consecutive years after two years of unfertilized maize, ultimately placed it in the best possible conditions for estimating mineralization of SON. The measurements confirmed the high variability in mineralization, which lay near the top of the range reported in the literature. It can be explained by the combined effects of soil types, with variable but generally high SON content; cropping systems representative of livestock-production regions, with regular application of organic waste and the frequent presence of grassland in rotations; and the semi-oceanic climate, which favors mineralization.
The drivers of mineralization were those identified in the literature: SON, POM-N, SMB, EON, and soil texture. Original results of this study include (i) experimental evidence of the influence of cropping history in the medium term on mineralization, and (ii) the fact that the I_Sys indicator provides information complementary to EON. This result strengthens the hypothesis of Ros et al. [31] that mineralizable N cannot be predicted from a single soil test alone, but instead requires a combination of components including EON and site-specific information, such as land-use and soil properties.
The modeling approach identified the most influential measured variables and showed that the proportion of variance explained by a model based only on basic soil properties and the I_Sys indicator (R² = 0.47) was not sufficient to consider the model operational. The accuracy of the model increased greatly when SMB and EON were included, but the proportion of the variance explained by model 2 remained relatively moderate, despite the supplemental information provided by the model’s covariates: basic soil properties, chemical and biological indicators, and a land-use indicator.

Author Contributions

Conceptualization, T.M. and Y.L.; methodology, T.M., Y.L., L.B., B.M. and N.B.; software, L.B.; validation, T.M., Y.L. and L.B.; formal analysis, T.M., P.G., B.L. and L.B.; investigation, T.M. and L.B.; resources, T.M. and L.B.; data curation, T.M., Y.L., L.B., B.M. and N.B.; writing—original draft preparation, T.M. and L.B.; writing—review and editing, T.M.; visualization, T.M. and L.B.; supervision, T.M.; project administration, T.M. and Y.L.; funding acquisition, T.M. and Y.L. All authors have read and agreed to the published version of the manuscript.

Funding

This study was financed by the Loire Bretagne Water Agency; the Regional Council of Brittany; the Departmental Councils of Côtes d’Armor, Finistère, and Morbihan; and the French government (DRAAF).

Institutional Review Board Statement

Not applicable.

Informed Consent Statement

Not applicable.

Data Availability Statement

The data analyzed in this article were published by Data in Brief: https://doi.org/10.1016/j.dib.2021.106795 (accessed on 1 April 2021). Raw data are deposited in the public repository Data INRAE. Data identification number: 10.15454/VYEYBK. Direct URL to data: https://doi.org/10.15454/VYEYBK (accessed on 19 January 2021).

Acknowledgments

This study was supported by partnerships with the SEMSE, AUREA, and Galys laboratories. The authors thank Michael Corson for proofreading the manuscript’s English.

Conflicts of Interest

The authors declare no conflict of interest. The funders had no role in the design of the study; in the collection, analyses, or interpretation of data; in the writing of the manuscript, or in the decision to publish the results.

References

  1. Makowski, D.; Wallach, D.; Meynard, J. Models of Yield, Grain Protein, and Residual Mineral Nitrogen Responses to Applied Nitrogen for Winter Wheat. Agron. J. 1999, 91, 377–385. [Google Scholar] [CrossRef]
  2. Neeteson, J.J. Development of nitrogen fertilizer recommendations for arable crops in the Netherlands in relation to nitrate leaching. Nutr. Cycl. Agroecosystems 1990, 26, 291–298. [Google Scholar] [CrossRef]
  3. Meynard, J.; Justes, E.; Machet, J.; Recous, S. Nitrogen fertilizers for annuals. Control. Nitrogen Conc. Agrosystems 1997, 83, 183–199. [Google Scholar]
  4. Alvarez, R.; Steinbach, H.S.; Grigera, S.M.; Cartier, E.; Obregon, G.; Torri, S.; García, R. The Balance Sheet Method as a Conceptual Framework for Nitrogen Fertilization of Wheat in a Pampean Agroecosystem. Agron. J. 2004, 96, 1050–1057. [Google Scholar] [CrossRef] [Green Version]
  5. Romano, N.F.; Alvarez, R.; Bono, A.A.; Steinbach, H.S. Comparison of nitrogen fertilizer demand for wheat production between humid and semi-arid portions of the Argentinean Pampas using a mass balance method. Arch. Agron. Soil Sci. 2015, 61, 1409–1422. [Google Scholar] [CrossRef]
  6. Griffin, T.S.; Honeycutt, C.W.; Albrecht, S.L.; Sistani, K.R.; Torbert, H.A.; Wienhold, B.J.; Woodbury, B.L.; Hubbard, R.K.; Powei, J.M. Nationally coordinated evaluation of soil nitrogen mineralization rate using a standardized aerobic incubation protocol. Commun. Soil Sci. Plant Anal. 2008, 39, 257–268. [Google Scholar] [CrossRef] [Green Version]
  7. Stanford, G.; Smith, S.J. Nitrogen Mineralization Potentials of Soils. Soil Sci. Soc. Am. J. 1972, 36, 465–472. [Google Scholar] [CrossRef]
  8. Sharifi, M.; Zebarth, B.J.; Burton, D.L.; Grant, C.A.; Bittman, S.; Drury, C.F.; McConkey, B.G.; Ziadi, N. Response of Potentially Mineralizable Soil Nitrogen and Indices of Nitrogen Availability to Tillage System. Soil Sci. Soc. Am. J. 2008, 72, 1124–1131. [Google Scholar] [CrossRef]
  9. Delin, S.; Lindén, B. Relations Between Net Nitrogen Mineralization and Soil Characteristics Within an Arable Field. Acta Agric. Scand. Sect. B Soil Plant Sci. 2002, 52, 78–85. [Google Scholar] [CrossRef]
  10. Hassink, J. Effects of soil texture and grassland management on soil organic C and N and rates of C and N mineralization. Soil Biol. Biochem. 1994, 26, 1221–1231. [Google Scholar] [CrossRef]
  11. Parfitt, R.L.; Salt, G.J. Carbon and nitrogen mineralisation in sand, silt, and clay fractions of soils under maize and pasture. Soil Res. 2001, 39, 361. [Google Scholar] [CrossRef]
  12. Clivot, H.; Mary, B.; Valé, M.; Cohan, J.-P.; Champolivier, L.; Piraux, F.; Laurent, F.; Justes, E. Quantifying in situ and modeling net nitrogen mineralization from soil organic matter in arable cropping systems. Soil Biol. Biochem. 2017, 111, 44–59. [Google Scholar] [CrossRef]
  13. Kemmitt, S.; Wright, D.; Goulding, K.; Jones, D. pH regulation of carbon and nitrogen dynamics in two agricultural soils. Soil Biol. Biochem. 2006, 38, 898–911. [Google Scholar] [CrossRef]
  14. Luce, M.S.; Ziadi, N.; Zebarth, B.J.; Whalen, J.K.; Grant, C.A.; Gregorich, E.G.; Lafond, G.P.; Blackshaw, R.E.; Johnson, E.N.; O’Donovan, J.T.; et al. Particulate organic matter and soil mineral nitrogen concentrations are good predictors of the soil nitrogen supply to canola following legume and non-legume crops in western Canada. Can. J. Soil Sci. 2013, 93, 607–620. [Google Scholar] [CrossRef]
  15. Blanco-Canqui, H.; Francis, C.A.; Galusha, T.D. Does organic farming accumulate carbon in deeper soil profiles in the long term? Geoderma 2017, 288, 213–221. [Google Scholar] [CrossRef]
  16. Balesdent, J.; Besnard, E.; Arrouays, D.; Chenu, C. The dynamics of carbon in particle-size fractions of soil in a forest-cultivation sequence. Plant Soil 1998, 201, 49–57. [Google Scholar] [CrossRef]
  17. Whalen, J.K.; Bottomley, P.J.; Myrold, D.D. Carbon and nitrogen mineralization from light- and heavy-fraction additions to soil. Soil Biol. Biochem. 2000, 32, 1345–1352. [Google Scholar] [CrossRef]
  18. Gregorich, E.; Beare, M.; Mckim, U.; Skjemstad, J. Chemical and biological characteristics of physically uncomplexed organic matter. Soil Sci. Soc. Am. J. 2006, 70, 975–985. [Google Scholar] [CrossRef]
  19. Mirsky, S.B.; Lanyon, L.E.; Needelman, B.A. Evaluating Soil Management Using Particulate and Chemically Labile Soil Organic Matter Fractions. Soil Sci. Soc. Am. J. 2008, 72, 180–185. [Google Scholar] [CrossRef]
  20. Spargo, J.T.; Cavigelli, M.A.; Mirsky, S.B.; Maul, J.E.; Meisinger, J.J. Mineralizable soil nitrogen and labile soil organic matter in diverse long-term cropping systems. Nutr. Cycl. Agroecosystems 2011, 90, 253–266. [Google Scholar] [CrossRef]
  21. Bu, R.; Lu, J.; Ren, T.; Liu, B.; Li, X.; Cong, R. Particulate Organic Matter Affects Soil Nitrogen Mineralization under Two Crop Rotation Systems. PLoS ONE 2015, 10, e0143835. [Google Scholar] [CrossRef] [PubMed]
  22. Kader, M.A.; Sleutel, S.; Begum, S.A.; D’Haene, K.; Jegajeevagan, K.; De Neve, S. Soil organic matter fractionation as a tool for predicting nitrogen mineralization in silty arable soils. Soil Use Manag. 2010, 26, 494–507. [Google Scholar] [CrossRef]
  23. Franzluebbers, A.J.; Hons, F.M.; Zuberer, D.A. Long-Term Changes in Soil Carbon and Nitrogen Pools in Wheat Management Systems. Soil Sci. Soc. Am. J. 1994, 58, 1639. [Google Scholar] [CrossRef]
  24. Wienhold, B.J.; Halvorson, A.D. Nitrogen Mineralization Responses to Cropping, Tillage, and Nitrogen Rate in the Northern Great Plains. Soil Sci. Soc. Am. J. 1999, 63, 192–196. [Google Scholar] [CrossRef] [Green Version]
  25. Poudel, D.D.; Horwath, W.R.; Lanini, W.T.; Temple, S.R.; van Bruggen, A.H.C. Comparison of soil N availability and leaching potential, crop yields and weeds in organic, low-input and conventional farming systems in northern California. Agric. Ecosyst. Environ. 2002, 90, 125–137. [Google Scholar] [CrossRef]
  26. Sharifi, M.; Zebarth, B.J.; Burton, D.L.; Grant, C.A.; Porter, G.A. Organic Amendment History and Crop Rotation Effects on Soil Nitrogen Mineralization Potential and Soil Nitrogen Supply in a Potato Cropping System. Agron. J. 2008, 100, 1562–1572. [Google Scholar] [CrossRef]
  27. Constantin, J.; Beaudoin, N.; Laurent, F.; Cohan, J.-P.; Duyme, F.; Mary, B. Cumulative effects of catch crops on nitrogen uptake, leaching and net mineralization. Plant Soil 2011, 341, 137–154. [Google Scholar] [CrossRef]
  28. Mallory, E.B.; Griffin, T.S. Impacts of Soil Amendment History on Nitrogen Availability from Manure and Fertilizer. Soil Sci. Soc. Am. J. 2007, 71, 964–973. [Google Scholar] [CrossRef]
  29. Schroder, J.; Jansen, A.; Hilhorst, G. Long-term nitrogen supply from cattle slurry. Soil Use Manag. 2005, 21, 196–204. [Google Scholar] [CrossRef]
  30. Sharifi, M.; Zebarth, B.J.; Burton, D.L.; Grant, C.A.; Cooper, J.M. Evaluation of Some Indices of Potentially Mineralizable Nitrogen in Soil. Soil Sci. Soc. Am. J. 2007, 71, 1233–1239. [Google Scholar] [CrossRef]
  31. Ros, G.H.; Temminghoff, E.J.M.; Hoffland, E. Nitrogen mineralization: A review and meta-analysis of the predictive value of soil tests. Eur. J. Soil Sci. 2011, 62, 162–173. [Google Scholar] [CrossRef]
  32. McDonald, N.T.; Watson, C.J.; Lalor, S.T.J.; Laughlin, R.J.; Wall, D.P. Evaluation of Soil Tests for Predicting Nitrogen Mineralization in Temperate Grassland Soils. Soil Sci. Soc. Am. J. 2014, 78, 1051–1064. [Google Scholar] [CrossRef]
  33. Scheu, S. Linkages between tree diversity, soil fauna and ecosystem processes. In Forest Diversity and Function; Springer: Berlin/Heidelberg, Germany, 2005; Volume 176, pp. 211–233. [Google Scholar]
  34. Mary, B.; Beaudoin, N.; Justes, E.; Machet, J.M. Calculation of nitrogen mineralization and leaching in fallow soil using a simple dynamic model: N mineralization and leaching in fallow soil. Eur. J. Soil Sci. 1999, 50, 549–566. [Google Scholar] [CrossRef]
  35. Oorts, K.; Laurent, F.; Mary, B.; Thiebeau, P.; Labreuche, J.; Nicolardot, B. Experimental and simulated soil mineral N dynamics for long-term tillage systems in northern France. Soil Tillage Res. 2007, 94, 441–456. [Google Scholar] [CrossRef]
  36. Engels, T.; Kuhlmann, H. Effect of the rate of N fertilizer on apparent net mineralization of N during and after cultivation of cereal and sugar beet crops. Z. Pflanzenernähr. Bodenkd. 1993, 156, 149–154. [Google Scholar] [CrossRef]
  37. Alvarez, R.; Steinbach, H.S. A review of the effects of tillage systems on some soil physical properties, water content, nitrate availability and crops yield in the Argentine Pampas. Soil Tillage Res. 2009, 104, 1–15. [Google Scholar] [CrossRef]
  38. Rodrigo, A.; Recous, S.; Neel, C.; Mary, B. Modelling temperature and moisture effects on C-N transformations in soils: Comparison of nine models. Ecol. Model. 1997, 102, 325–339. [Google Scholar] [CrossRef]
  39. Rémy, J.; Hébert, J. Le devenir des engrais azotés dans le sol. Acad. Agric. Fr. 1977, 63, 700–714. [Google Scholar]
  40. Morvan, T.; Lambert, Y.; Germain, P.; Beff, L. A dataset from a 3-year network of field measurements of soil organic nitrogen mineralization under a mild oceanic temperate climate. Data Brief 2021, 35, 106795. [Google Scholar] [CrossRef]
  41. Brisson, N.; Mary, B.; Ripoche, D.; Jeuffroy, M.; Ruget, F.; Nicoullaud, B.; Gate, P.; Devienne-Barret, F.; Antonioletti, R.; Durr, C.; et al. STICS: A generic model for the simulation of crops and their water and nitrogen balances. I. Theory and parameterization applied to wheat and corn. Agronomie 1998, 18, 311–346. [Google Scholar] [CrossRef]
  42. Krom, M.D. Spectrophotometric determination of ammonia: A study of a modified Berthelot reaction using salicylate and dichloroisocyanurate. Analyst 1980, 105, 305–316. [Google Scholar] [CrossRef]
  43. Sims, J.R.; Jackson, G.D. Rapid analysis of soil nitrate with chromotropic acid. Soil Sci. Soc. Am. J. 1970, 35, 603–606. [Google Scholar] [CrossRef]
  44. AFNOR. Norme NF X 31-130, Méthodes chimiques, Détermination de la capacité d’échange cationique (CEC) et des cations extractibles. In Normes Nationales et Documents Normatifs Nationaux; Qualité des Sols: Paris, France, 1999. [Google Scholar]
  45. AFNOR. Norme NF X 10390, Détermination du pH. In Normes Nationales et Documents Normatifs Nationaux; Qualité des Sols: Paris, France, 2005. [Google Scholar]
  46. AFNOR. Norme NF X 31-107, Détermination de la distribution granulométrique des particules du sol, Méthode à la pipette. In Normes Nationales et Documents Normatifs Nationaux; Qualité du Sol: Paris, France, 2003. [Google Scholar]
  47. Vance, E.D.; Brookes, P.C.; Jenkinson, D.S. An extraction method for measuring soil microbial biomass C. Soil Biol. Biochem. 1987, 19, 703–707. [Google Scholar] [CrossRef]
  48. Gianello, C.; Bremner, J.M. A rapid steam distillation method of assessing potentially available organic nitrogen in soil. Commun. Soil Sci. Plant Anal. 1988, 19, 1551–1568. [Google Scholar] [CrossRef]
  49. Hirte, J.; Leifeld, J.; Abiven, S.; Mayer, J. Maize and wheat root biomass, vertical distribution, and size class as affected by fertilization intensity in two long-term field trials. Field Crops Res. 2018, 216, 197–208. [Google Scholar] [CrossRef]
  50. R Core Team. R: A Language and Environment for Statistical Computing. 2021. Available online: www.R-Project.org (accessed on 18 May 2021).
  51. Louis, B.P.; Maron, P.-A.; Menasseri-Aubry, S.; Sarr, A.; Leveque, J.; Mathieu, O.; Jolivet, C.; Leterme, P.; Viaud, V. Microbial Diversity Indexes Can Explain Soil Carbon Dynamics as a Function of Carbon Source. PLoS ONE 2016, 11, e0161251. [Google Scholar] [CrossRef] [PubMed] [Green Version]
  52. Wood, S.N. Fast stable restricted maximum likelihood and marginal likelihood estimation of semiparametric generalized linear models. J. R. Stat. Soc. Ser. B Stat. Methodol. 2011, 73, 3–36. [Google Scholar] [CrossRef] [Green Version]
  53. Wallach, D. Working with Dynamic Crop Models. In Evaluation, Analysis, Parameterization and Applications; Elsevier: Amsterdam, The Netherlands, 2006. [Google Scholar]
  54. Bellon-Maurel, V.; Fernandez-Ahumada, E.; Palagos, B.; Roger, J.-M.; McBratney, A. Critical review of chemometric indicators commonly used for assessing the quality of the prediction of soil attributes by NIR spectroscopy. TrAC Trends Anal. Chem. 2010, 29, 1073–1081. [Google Scholar] [CrossRef]
  55. Lemaire, G.; Meynard, J. Part 1: On the Critical N Concentration in Agricultural Crops. Use of the Nitrogen Nutrition Index for the Analysis of Agronomical Data. In Diagnosis of the Nitrogen Status in Crops; Springer: Berlin, Germany, 1997; pp. 45–55. [Google Scholar]
  56. Rozas, H.R.S.; Echeverría, H.E.; Barbieri, P.A. Nitrogen Balance as Affected by Application Time and Nitrogen Fertilizer Rate in Irrigated No-Tillage Maize. Agron. J. 2004, 96, 1622–1631. [Google Scholar] [CrossRef]
  57. Bono, A.; Alvarez, R. Nitrogen mineralization in a coarse soil of the semi-arid Pampas of Argentina. Arch. Agron. Soil Sci. 2013, 59, 259–272. [Google Scholar] [CrossRef]
  58. Lado-Monserrat, L.; Lull, C.; Bautista, I.; Lidón, A.; Herrera, R. Soil moisture increment as a controlling variable of the “Birch effect”. Interactions with the pre-wetting soil moisture and litter addition. Plant Soil 2014, 379, 21–34. [Google Scholar] [CrossRef]
  59. Franzluebbers, A.J. Microbial activity in response to water-filled pore space of variably eroded southern Piedmont soils. Appl. Soil Ecol. 1999, 11, 91–101. [Google Scholar] [CrossRef]
  60. Delphin, J.-E. Estimation of nitrogen mineralization in the field from an incubation test and from soil analysis. Agronomie 2000, 20, 349–361. [Google Scholar] [CrossRef] [Green Version]
  61. Carpenter-Boggs, L.; Pikul, J.L.; Vigil, M.F.; Riedell, W.E. Soil Nitrogen Mineralization Influenced by Crop Rotation and Nitrogen Fertilization. Soil Sci. Soc. Am. J. 2000, 64, 2038–2045. [Google Scholar] [CrossRef] [Green Version]
  62. Culman, S.W.; Snapp, S.S.; Green, J.M.; Gentry, L.E. Short- and Long-Term Labile Soil Carbon and Nitrogen Dynamics Reflect Management and Predict Corn Agronomic Performance. Agron. J. 2013, 105, 493–502. [Google Scholar] [CrossRef]
  63. Osterholz, W.R.; Liebman, M.; Castellano, M.J. Can soil nitrogen dynamics explain the yield benefit of crop diversification? Field Crops Res. 2018, 219, 33–42. [Google Scholar] [CrossRef]
  64. Zhang, X.; Fang, Q.; Zhang, T.; Ma, W.; Velthof, G.L.; Hou, Y.; Oenema, O.; Zhang, F. Benefits and trade-offs of replacing synthetic fertilizers by animal manures in crop production in China: A meta-analysis. Glob. Change Biol. 2020, 26, 888–900. [Google Scholar] [CrossRef]
  65. Liu, S.; Wang, M.; Yin, M.; Chu, G.; Xu, C.; Zhang, X.; Abliz, B.; Tang, C.; Wang, D.; Chen, S. Fifteen years of crop rotation combined with straw management alters the nitrogen supply capacity of upland-paddy soil. Soil Tillage Res. 2022, 215, 105219. [Google Scholar] [CrossRef]
  66. Verloop, J.; Hilhorst, G.J.; Oenema, J.; Van Keulen, H.; Sebek, L.B.J.; Van Ittersum, M.K. Soil N mineralization in a dairy production system with grass and forage crops. Nutr. Cycl. Agroecosystems 2014, 98, 267–280. [Google Scholar] [CrossRef]
  67. Crystal-Ornelas, R.; Thapa, R.; Tully, K.L. Soil organic carbon is affected by organic amendments, conservation tillage, and cover cropping in organic farming systems: A meta-analysis. Agric. Ecosyst. Environ. 2021, 312, 107356. [Google Scholar] [CrossRef]
  68. Schroder, J.J.; Uenk, D.; Hilhorst, G.J. Long-term nitrogen fertilizer replacement value of cattle manures applied to cut grassland. Plant Soil 2007, 299, 83–99. [Google Scholar] [CrossRef] [Green Version]
  69. Dessureault-Rompré, J.; Zebarth, B.J.; Burton, D.L.; Georgallas, A. Predicting soil nitrogen supply from soil properties. Can. J. Soil Sci. 2015, 95, 63–75. [Google Scholar] [CrossRef] [Green Version]
  70. Griffin, G.F.; Laine, A.F. Nitrogen Mineralization in Soils Previously Amended with Organic Wastes 1. Agron. J. 1983, 75, 124–129. [Google Scholar] [CrossRef]
  71. Cabrera, M.L.; Kissel, D.E. Potentially Mineralizable Nitrogen in Disturbed and Undisturbed Soil Samples. Soil Sci. Soc. Am. J. 1988, 52, 1010–1015. [Google Scholar] [CrossRef]
  72. Hassink, J. Effect of soil texture on the size of the microbial biomass and on the amount of c and n mineralized per unit of microbial biomass in dutch grassland soils. Soil Biol. Biochem. 1994, 26, 1573–1581. [Google Scholar] [CrossRef]
  73. Moharana, P.C.; Sharma, B.M.; Biswas, D.R.; Dwivedi, B.S.; Singh, R.V. Long-term effect of nutrient management on soil fertility and soil organic carbon pools under a 6-year-old pearl millet–wheat cropping system in an Inceptisol of subtropical India. Field Crops Res. 2012, 136, 32–41. [Google Scholar] [CrossRef]
  74. Bechtold, J.S.; Naiman, R.J. Soil texture and nitrogen mineralization potential across a riparian toposequence in a semi-arid savanna. Soil Biol. Biochem. 2006, 38, 1325–1333. [Google Scholar] [CrossRef]
  75. Schomberg, H.H.; Wietholter, S.; Griffin, T.S.; Reeves, D.W.; Cabrera, M.L.; Fisher, D.S.; Endale, D.M.; Novak, J.M.; Balkcom, K.S.; Raper, R.L.; et al. Assessing Indices for Predicting Potential Nitrogen Mineralization in Soils under Different Management Systems. Soil Sci. Soc. Am. J. 2009, 73, 1575–1586. [Google Scholar] [CrossRef]
  76. Yin, X.; Kersebaum, K.-C.; Beaudoin, N.; Constantin, J.; Chen, F.; Louarn, G.; Manevski, K.; Hoffmann, M.; Kollas, C.; Armas-Herrera, C.M.; et al. Uncertainties in simulating N uptake, net N mineralization, soil mineral N and N leaching in European crop rotations using process-based models. Field Crops Res. 2020, 255, 107863. [Google Scholar] [CrossRef]
  77. Alvarez, R.; Steinbach, H.S. Modeling Apparent Nitrogen Mineralization under Field Conditions Using Regressions and Artificial Neural Networks. Agron. J. 2011, 103, 1159–1168. [Google Scholar] [CrossRef]
Figure 1. Locations of experimental fields in the network in Brittany, France (red points indicate the 67 fields selected).
Nitrogen 03 00015 g001
Figure 2. Monthly rainfall and mean air temperature from March-October for the 3 years of the experiment.
Nitrogen 03 00015 g002
Figure 3. Decision tree used to filter the data from each field. Conditions had to be true for 2012, 2013, and 2014 to pass to the next step. CV: coefficient of variation, Mn: soil net nitrogen mineralization.
Nitrogen 03 00015 g003
Figure 4. Boxplots of (a) soil organic nitrogen (SON), (b) extractable organic nitrogen (EON), and (c) soil microbial biomass (SMB) for all 137 fields and for the 67 fields selected from the network. Whiskers extend to 1.5 times the interquartile range.
Nitrogen 03 00015 g004
Figure 5. Boxplots of Vnmean as a function of (a) soil organic nitrogen (SON) class (class_1: SON < 5.7 t N ha−1; class_2: [5.7; 7.15]; class_3: [7.15; 8.2]; class_4: >8.2 t N ha−1) and (b) I_Sys class. Whiskers extend to 1.5 times the interquartile range.
Nitrogen 03 00015 g005
Figure 6. Comparison of observed Vnmean to that predicted by (a) model 1, whose covariates were the basic soil parameters and I_Sys, and (b) model 2, with SMB and EON as additional variables. Solid lines are 1:1 lines, while dashed lines indicate ± 0.2 kg N ha−1 nday−1 around each 1:1 line. (RMSE: Root Mean Square Error).
Nitrogen 03 00015 g006
Table 1. Measured mean (±1 standard deviation) soil variables for the 137 fields of the network and the 67 fields selected. Physico-chemical properties of the 0–30 cm soil layer include texture, C and N contents, pH, Metson cation exchange capacity (CEC), soil microbial biomass (SMB), extractable organic N (EON), particulate organic matter (POM-N), and soil organic nitrogen (SON) stocks.
VariableUnit137 Fields67 Fields
Clayg kg−1194 (±52.0)183 (±36.0)
Fine Siltg kg−1247.8 (±87.5)237.4 (±73.7)
Coarse Siltg kg−1268.3 (±118.8)264.9 (±112.4)
Siltg kg−1516 (±135.0)502 (±132.0)
Fine Sandg kg−1125.6 (±53.6)129.8 (±52.0)
Coarse Sandg kg−1164.5 (±129.3)185.0 (±136.4)
Sandg kg−1290 (±145.0)315 (±145.0)
C contentg C kg−119.8 (±6.5)20.2 (±6.1)
N contentg N kg−11.8 (±0.6)1.8 (±0.5)
pH 6.1 (±0.5)6.0 (±0.5)
CEC Metsonmeq 100g−19.8 (±2.5)9.9 (±2.2)
SMBmg C kg−1171.3 (±45.3)168.4 (±38.2)
EONmg N kg−127.3 (±8.4)27.7 (±7.4)
POM-Nt N ha−10.67 (±0.24)0.68 (±0.24)
SONt N ha−16.5 (±1.5)6.5 (±1.5)
Table 2. Mean, minimum, maximum, and standard deviation (SD) of the mass-balance components and nitrogen (N) mineralization rates for the 67 fields selected. N uptake is N taken up by maize plants, Ni and Nf are, respectively, the initial and final amount of mineral N in the soil profile (0–90 cm), N leached is N leached out of the soil profile predicted by the STICS crop model, Mn is net N mineralization, ndays is normalized time between initial and final N measurements, and Vn is normalized N mineralization rate.
YearMetricN UptakeNiNfN LeachedMntnVn
kg N ha−1kg N ha−1kg N ha−1kg N ha−1kg N ha−1ndaykg N ha−1 nday−1
2012mean1444746221621650.99
min50671531120.28
max292145155633022021.68
SD4729301452160.31
2013mean106367191461391.06
min3912171661020.41
max25782167303261812.3
SD411330660160.45
2014mean147343861541720.92
min731080751220.39
max334116168274542132.39
SD561728571200.44
Table 3. Correlation coefficients (r) between Vn for the years 2012, 2013, 2014, Vnmean, the cropping system indicator (I_Sys), and soil properties for the 67 fields selected. (p < 0.05 for r > 0.24, p < 0.01 for r > 0.31, and p < 0.001 for r > 0.39). F: fine, C: Coarse.
Vn12Vn13Vn14VnmeanI_SysSONEONSMBPOM-NClayF SiltC SiltSiltF SandC SandSandpHCEC
Vn121.000.630.530.810.370.380.340.450.45−0.12−0.08−0.10−0.13−0.210.240.150.060.26
Vn13 1.000.560.880.380.270.400.360.45−0.07−0.17−0.16−0.23−0.100.280.23−0.030.16
Vn14 1.000.840.250.170.440.350.21−0.25−0.20−0.04−0.15−0.180.280.20−0.14−0.03
Vnmean 1.000.390.310.470.450.43−0.17−0.19−0.12−0.21−0.190.320.23−0.050.14
I_Sys 1.000.140.120.200.170.07−0.090.110.04−0.05−0.04−0.060.040.01
SON 1.000.640.070.750.160.15−0.48−0.33−0.160.330.26−0.180.78
EON 1.000.140.500.070.02−0.23−0.19−0.150.220.15−0.400.42
SMB 1.000.250.250.18−0.110.01−0.08−0.04−0.070.10−0.04
POM-N 1.000.050.18−0.45−0.29−0.150.320.25−0.020.57
Clay 1.000.54−0.040.27−0.15−0.46−0.490.040.25
F Silt 1.00−0.050.52−0.48−0.46−0.600.060.09
C Silt 1.000.83−0.09−0.76−0.740.32−0.47
Silt 1.00−0.34−0.90−0.970.31−0.35
F Sand 1.00−0.010.35−0.080.05
C Sand 1.000.93−0.280.25
Sand 1.00−0.290.25
pH 1.00−0.11
CEC 1.00
Table 4. Assessment of the models, covariates selected, and dMSEP values. Relation indicates the type of relation selected: L, linear; P2, 2nd-degree polynomial.
ModelMSEPRPIQCovariatesRelationdMSEP
10.470.0751.82I_SysL0.214
Coarse SandP20.244
ClayP20.100
SONL0.053
Coarse SiltL0.024
20.670.052.25SMBL0.320
EONL0.245
Coarse SandP20.250
ClayP20.200
I_SysL0.159
Coarse SiltL0.090
Publisher’s Note: MDPI stays neutral with regard to jurisdictional claims in published maps and institutional affiliations.

