Article

Nitrogen Pools in Tropical Plantations of N2-Fixing and Non-N2-Fixing Legume Trees under Different Tree Stand Densities

by
Kelly Nery Bighi
1,
Ranieri Ribeiro Paula
1,2,*,
Marcos Vinícius Winckler Caldeira
1,
Diego Lang Burak
2,
Eduardo de Sá Mendonça
2,
Paulo Henrique de Souza
3,
William Macedo Delarmelina
4 and
Fabiano de Carvalho Balieiro
5
1
Centro de Ciências Agrárias e Engenharias, Departamento de Ciências Florestais e da Madeira, Programa de Pós-Graduação em Ciências Florestais, Universidade Federal do Espírito Santo, Jerônimo Monteiro 29550-000, Brazil
2
Centro de Ciências Agrárias e Engenharias, Departamento de Agronomia, Programa de Pós-Graduação em Produção Vegetal, Universidade Federal do Espírito Santo, Alegre 29500-000, Brazil
3
Departamento Acadêmico de Agricultura e Ambiente, Instituto Federal de Educação, Ciência e Tecnologia do Sudeste de Minas Gerais, Rio Pomba 36180-000, Brazil
4
Coordenadoria do Curso Técnico em Florestas, Instituto Federal de Educação, Ciência e Tecnologia do Espírito Santo, Ibatiba 29395-000, Brazil
5
Embrapa Solos, Rio de Janeiro 05407-002, Brazil
*
Author to whom correspondence should be addressed.
Nitrogen 2021, 2(1), 86-98; https://doi.org/10.3390/nitrogen2010006
Submission received: 19 January 2021 / Revised: 3 March 2021 / Accepted: 8 March 2021 / Published: 15 March 2021

Abstract

:
We investigated the nitrogen pools in monocultures of legume species widely used in reforestation in Brazil that have contrasting growth and nitrogen acquisition strategies. The plantations were established with the slow-growing and N2-fixing tree Anadenanthera peregrina var. peregrina, and the fast-growing and non-fixing tree Schizolobium parahyba var. amazonicum. The measurements of N pools in the tree biomass and the soil followed standard methods and were carried out on 54 experimental plots. The N2 fixation pools were evaluated by abundance natural of 15N and the N accretion methods. The soil N content was of similar magnitude between species and stand densities. The species showed similar amounts of N in the biomass, but divergent patterns of N accumulation, as well as the 15N signature on the leaves. S. parahyba accumulated most N in the stem, while A. peregrina accumulated N in the roots and leaves. However, the N accumulation in biomass of A. peregrina stand was less constrained by environment than in S. parahyba stands. The percentage of N derived from N2 fixation in A. peregrina stands decreased with the increase of stand density. The biological N2 fixation estimates depended on the method and the response of tree species to environment.

1. Introduction

The expansion of forest restoration is expected for this decade in tropical regions as one important way to improve many ecosystem services [1,2]. The Atlantic Forest biome has experienced an increase in forest cover (forest transition), with the new land-cover map revealing the cover of 28% of native vegetation [3], 12–17% higher than the previously available estimates [4]. In addition to socioeconomic drivers, such as farm credit and economic development, part of this expansion was attributed to Atlantic Forest remnants, but also the vicinity of eucalyptus plantations [5].
The Brazilian forestry sector has improved planted areas and businesses [6]. However, the sustainability of plantations faces challenges related to tree growth and survival affected by biotic and abiotic constraints [7,8]. Moreover, the silvicultural behavior of tree species native to the Brazilian flora is less known than for exotic commercial species of the genera Eucalyptus and Pinus [9,10,11]. The choice of the tree stand density is a relevant question that directly affects biomass and nutrient accumulation. Furthermore, the response to competition is highly variable as a function of the demands for growth resources [12]. As pointed out by some authors [13], the fast-slow plant economics spectrum predicts that faster-growing species has a large biomass accumulation rate per individual trees, and nutrient uptake and water consumption (high-rate acquisition resources), while the resistance to environmental stress is in general higher from slow-growing species (with higher tissue density, long tissue lifespan and lower rates of resource acquisition) [13].
The forest expansion in Brazil and other tropical countries have occurred on previous cropland and grassland, and these areas are often degraded [5,7]. Biomass production and tree survival are limited by N availability in the soil, which is intimately associated with soil organic matter pools. N is abundant in the atmosphere (78%) but under this chemical form (N2) is unavailable for most plants [14]. Legume trees are most abundant in the tropics and several tree species are used for wood production and forest restoration. The use of legume tree species capable to form an efficient symbiosis with diazotrophic bacteria strains (N2-fixing trees), is considered an important strategy to increase N transfer from the atmosphere to the soil [15,16,17,18,19] and for companion plants [20,21]. Thus, the use of these species can reduce costs with nitrogen fertilizers in forest restoration or commercial plantations while increasing organic matter accumulation in the soil [18,22,23].
The percentage of N derived from atmosphere (%Ndfa), i.e., biologically fixed, can be affected by soil N availability and plant competition [24,25], also being influenced by stand density [26], as well as by phosphorus [27], iron [28], and other nutrients [29]. Furthermore, the growth rate of the species and the age of the trees are other factors that influence the N2 fixation rate [30,31]. The %Ndfa may oscillate from inexistent to more than 90% in tree species, including drought-adapted species [32,33]. Many methodologies were developed to estimate biological nitrogen fixation [34,35], each one with its potential and limitations [32,36,37]. The 15N natural abundance method is the most used technique to estimate the %Ndfa in undisturbed stands and natural forests, being relatively easy to apply and less sensitive to the choice of reference plant than enriched methods [37], besides to show relatively good accuracy [33,38]. Another technique commonly applied for its versatility about the components used (forest floor litter, soil, and biomass) and its low estimation costs is the N accretion method, calculated based on the differences in N accumulated in fixing and non-N2-fixing species [35,39]. Although both methods facilitate quantification, few studies employ both techniques simultaneously [19], in Brazilian conditions.
This study aimed to quantify the N accumulated in the biomass and topsoil of monocultures of Anadenanthera peregrina (L.) Speg. var. peregrina and Schizolobium parahyba var. amazonicum (Huber ex Ducke) Barneby grown under three stand densities (625, 1111, and 1666 trees ha−1), and to estimate the percentage of N derived from biological N2 fixation for A. peregrina using the 15N natural abundance and the N accretions methods. These two species are among the most planted in Brazil, for both commercial and restoration purposes, with stands of S. parahyba occupying an area of about 90 thousand ha in northern Brazil. This faster-growing species presents a low-density wood (0.30 g cm−3), has natural distribution throughout the Amazonian region and Atlantic Forest [40], and belongs to Fabaceae family and Caesalpinioideae subfamily, being considered a non-nodulation species [41]. The slow-growing A. peregrina presents a wood of higher density (0.66 g cm−3) [42] and distribution in all Brazil, and belongs to Mimosoideae subfamily, being capable of developing symbiosis with N2-fixing bacteria [43]. The research hypotheses were: (1) The N2-fixing legume tree species accumulates more N in the biomass and the topsoil layer than the non-N2-fixing tree species, regardless of stand density. (2) The stand densities affect the N2 fixation in the A. peregrina. (3) The 15N natural abundance and the N accretions methods generate similar fixed N estimates regardless of stand density.

2. Results

2.1. N Pools in the Biomass and Soil

The mean values of N concentration were in general larger for all tissues of A. peregrina than S. parahyba, with noticeable differences for leaves (22.3 versus 13.3 g kg−1), bark (4.0 versus 1.8 g kg−1), and roots (9.0 versus 3.9), and smaller differences for branches (5.8 versus 3.6) and wood (1.8 versus 1.7). The N concentration and content in the biomass of each species were not affected by stand density (data not shown).
The species showed contrasting patterns of biomass allocation independently of stand density (Figure 1). Aboveground N pools were larger in roots and leaves and roots of A. peregrina, while it was larger in stem of S. parahyba. Furthermore, proportion of N allocation in biomass was more affect by stand density in A. peregrina than S. parahyba.
The N pools at 0–20 cm soil depth were statistically equal between the stand density of the A. peregrina and S. parahyba, although soil N pools were smaller in the stand with 1666 trees ha−1 of both species (Table 1).
The N pools in the aboveground biomass were larger in S. parahyba than in A. peregrina for the density of 625 trees ha−1 (Table 1). However, N accumulation tended to be larger in denser stands of A. peregrina than in S. parahyba, with gains of 44% and 49% in N for the densities of 1111 and 1666 trees ha−1, respectively. Although no significant difference was observed, the N accumulated in the belowground biomass of A. peregrina was 1.4, 1.8, and 2.8 times higher than in S. parahyba for the densities of 625, 1111, and 1666 trees ha−1.
We observed soil N pools were affected by experimental blocks, with smaller values in one block to the other two for both species (Table 2). Moreover, the species showed contrasting responses related to N pools in the soil. The mean amount of N in the aboveground biomass of S. parahyba was lower in the block with a lower soil N amount, while the contrary was observed for A. peregrina.

2.2. N Pools via Biological N2 Fixation

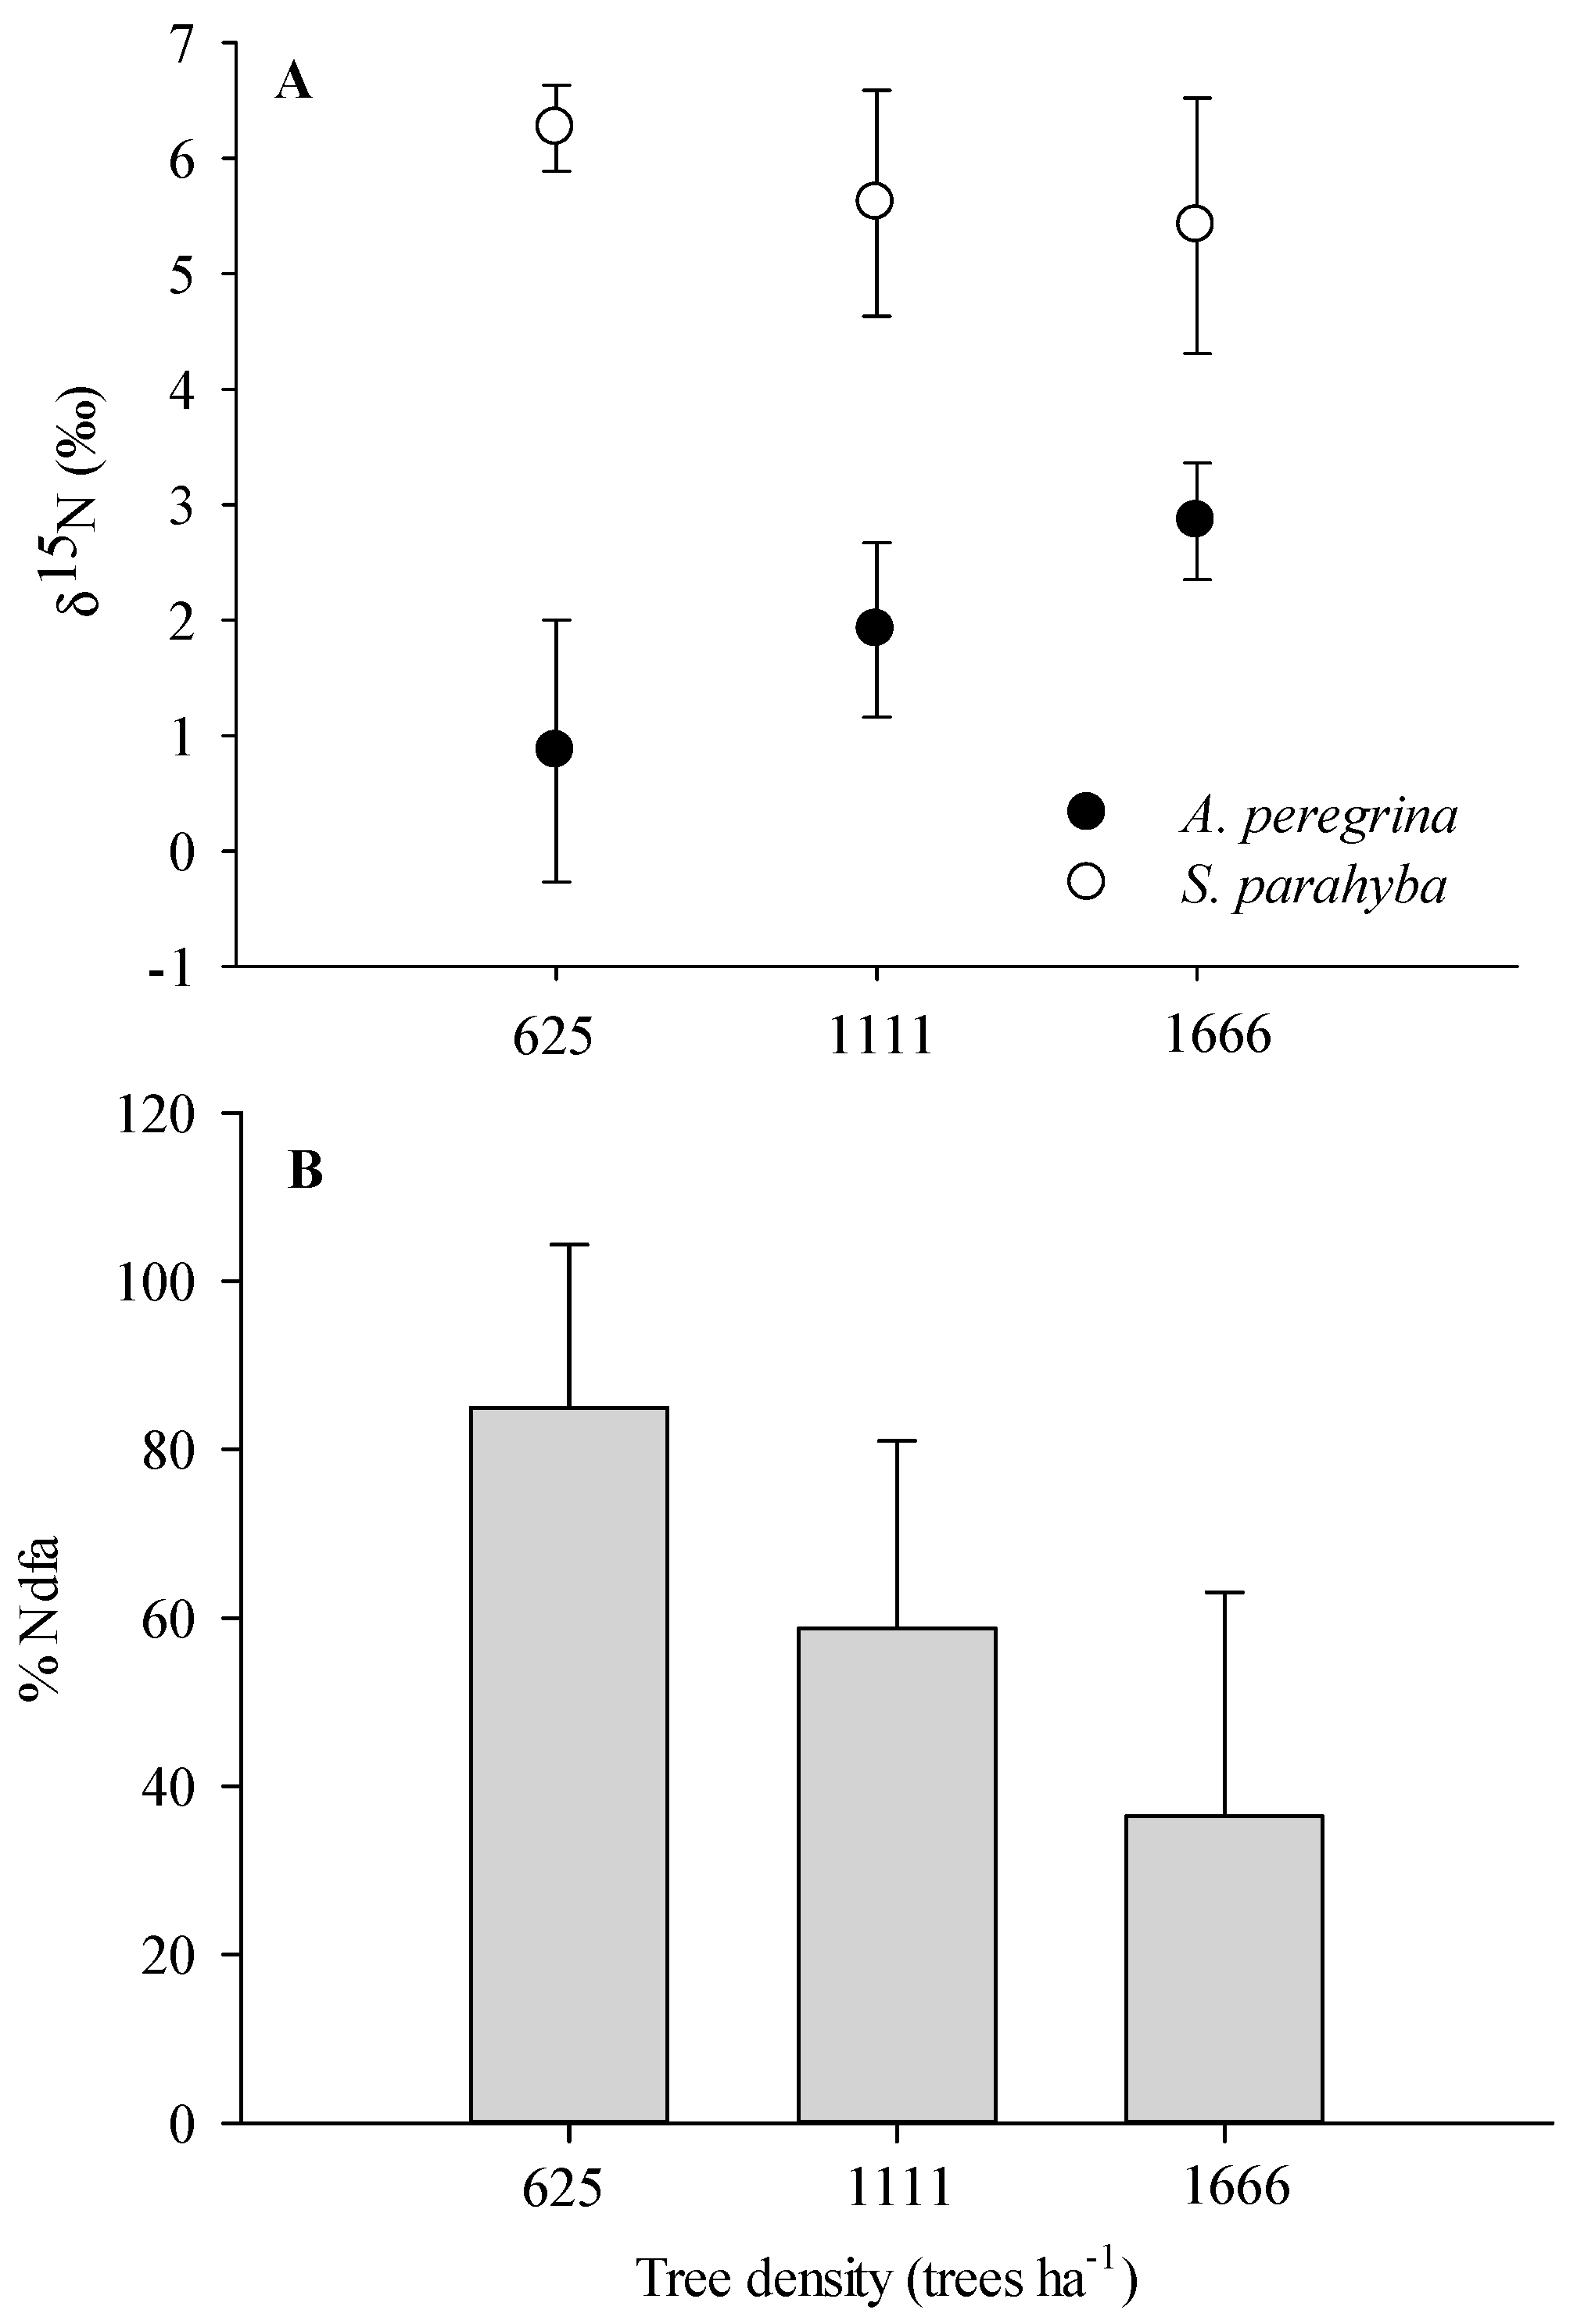
The mean values of δ15N were smaller in A. peregrina than in the non-fixing species S. parahyba, varying from 0.8 to 6.3, 1.9 to 5.6, and 2.8 to 5.4 for the respective densities of 625, 1111, and 1666 trees ha−1 (Figure 2A). Furthermore, the values of δ15N in the species S. parahyba tended to decrease between the lowest and the highest stand density, while in the N2-fixing species A. peregrina there was an upward trend in the values of δ15N with the increase in stand density. Thus, the proportion of N2 derived from fixation tended to decrease between the lowest and the highest density in the stands of A. peregrina, with mean values of 85%, 59%, and 36% for the densities of 625, 1111, and 1666 trees ha−1 (Figure 2B).
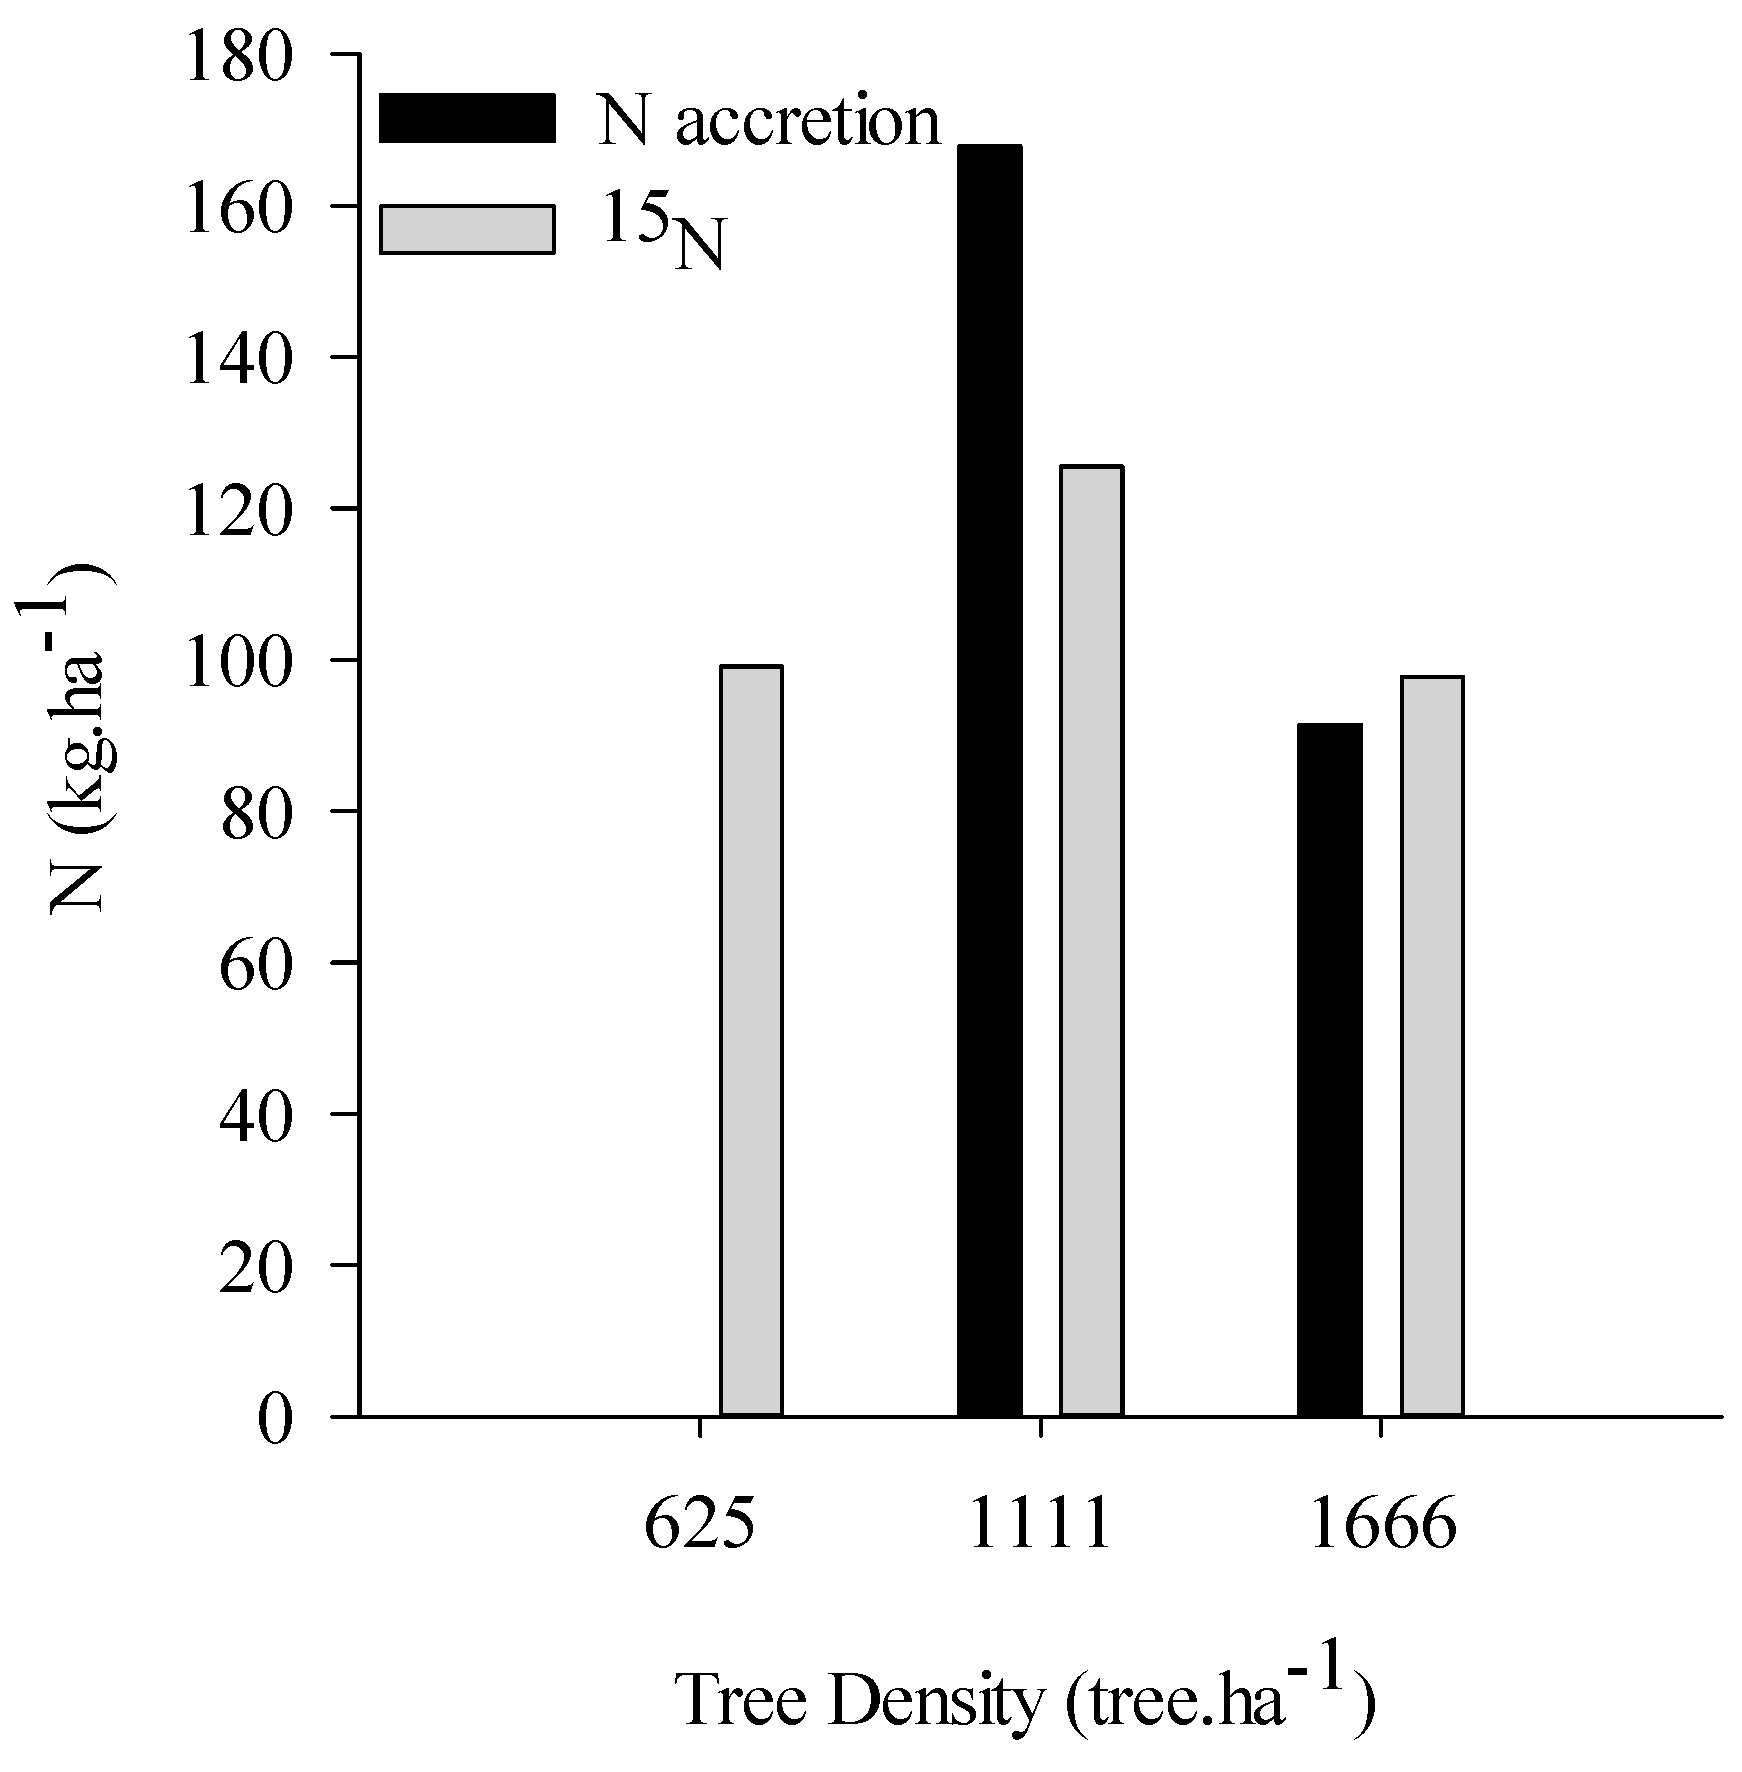
The total N pools in both soil and biomass were lower in A. peregrina than S. parahyba only when stand density was 625 trees ha−1 (Table 1). This result prevented the quantification of the N fixed in the lower density by the accretion method (Figure 3). In contrast, the total N pools were higher in N2-fixing than non-N2-fixing trees for the remaining densities (Table 1). Moreover, according to with accretion method, the biological N2 fixation may improve about 167.8 and 91.4 kg ha−1 for the densities of 1111 and 1666 trees ha−1 of A. peregrine, respectively (Table 1; Figure 3).
The mean amounts of N biologically fixed in the aboveground and belowground biomass of A. peregrina were similar in the three stand densities by the 15N natural abundance method, with values varying across 99, 125 and 101 kg ha−1. Thus, the N2 fixing rate in aboveground biomass of A. peregrina was remarkably similar for in the three stand densities ranging between 21 and 27 kg ha−1year−1. The accretion method estimates N2 fixation values 45% higher than the natural abundance for the density of 1111 trees ha−1 and 6% lower for the density of 1666 trees ha−1. Besides, the N2 fixing rate was different for the density of 1111 (36 kg ha−1 year−1) but similar for 1666 trees ha−1 (20 kg ha−1 year−1).
The %Ndfa in A. peregrina could be higher using only the two blocks with higher soil N pools (i.e., B1Ap; B2Ap and B2Sp; B3Sp). In this case, the %Ndfa was 100.0%, 73.4% and 53.2% for the stand density of 626, 1111, and 1666 trees ha−1. In contrast, the %Ndfa could be lower using only the block with the lower soil N pools (i.e., B3Ap and B1Sp), with 55.3%, 54.5%, and 37.1%. The use of the accretion method was unfeasible for blocks with the higher soil N pools lead to a negative estimative of N fixation for all the stand densities. Moreover, the accretion method applied to block with the lower soil N pools leads to larger N2 fixation, with 236; 1169 and 426 kg N ha−1 for densities 625, 1111, and 1666 trees ha−1, respectively.

3. Discussion

3.1. N Pools in Stands with N2 and Non-N2 Fixing Species

Slow-growing species allocate a large proportion of biomass in leaves and branches, while fast-growing species allocate more biomass in stem wood [13,29]. The larger leaf biomass of A. peregrina may explain larger root production to uptake water and nutrients to sustain physiological processes in the canopy [44]. The lack of statistical significance for N pools in the biomass between species prevents us from accepting the first hypothesis in full. Moreover, different explanations can justify these patterns, as the natural variability of N pools in the study area and by the exclusion of the belowground N of the analysis. Moreover, the larger N pools in the canopy and roots biomass of A. peregrina are counterbalanced by smaller stem wood biomass than in S. parahyba [45,46] (unpublished data). Furthermore, studies with the species S. parahyaba have suggested that wider spacings, such as 4 × 4 m, provide better development and final production [47], which corroborates with our data. On the other hand, the S. parahyba trees are more sensitive to environmental stresses. A mortality of trees was subtly larger for S. parahyba than for A. peregrina in the study area, been related to wind-breaking, rainfall variability, and attack by pests and diseases [45,46] (unpublished data). S. parahyaba tree was also more sensitive regarding soil fertility and tree competition than A. peregrina. The soil proprieties were in general similar between species and experimental blocks. However, in B1 of S. parahyba showed the most depleted soil fertility parameters and lower N accumulation in biomass, and for B3 of A. peregrina, which showed less concentration of Ca and Mg, the biomass N accumulation was larger [48] (Unpublished data). This pattern suggests soil proprieties were likely more limiting to S. parahyba than A. peregrina growth independently of stand density. The response of trees for the availability of nutrients in the soil is usually greater in fast-growing than in slow-growing species [13,29]. Further studies are necessary to assess the environmental factors affecting the growth of A. peregrina and S. parahyba in our study area.
The amount about four times higher of N in the leaf biomass and roots of A. peregrina compared with S. parahyba should be an important input of N to the soil. However, we observed no statistical difference between species regarding soil N pools, although a significant effect of the block was verified on the N pools. These patterns indicate that soil N pools are affected mainly by soil attributes on a local scale, as clay mineralogy and soil granulometry [49]. Furthermore, the relatively young age of the stands could explain the lack of differences between species for the N accumulated in the topsoil. Although N2-fixing species tend to provide greater N availability in the soil [16,19,23,30], the changes in the total soil N status could not see in the short-term, when trees are planted in pastures [50], and even in forestry stands [19]. Such processes not measured as leaching and denitrification may influence those patterns of N accumulation. We suspect that nitrification may be favored in plots of A. peregrina, as observed in other sites with N2-fixing species in Brazil [19,51]. This process could minimize differences between S. parahyba and A. peregrina plots. Moreover, we do not know the causes of the tendency to decrease soil N pools in the highest stand density in both species. An explanation may be the about three times higher inputs of N via fertilizer in stand density of 1666 than 625 trees ha−1 overplanting, that associated to inputs of litter could cause a priming effect [52]. These patterns suggest OM decay is affected by other environmental factors than only differences between leaves and roots biomass [53].

3.2. Biological N Fixation as a Function of Tree Densities and Methods

The stand density affected the %Ndfa in the A. peregrina confirming our second hypothesis. The intraspecific competition could increase δ15N abundance in the leaves due to the probably greater uptake of N from the soil. The soil N availability may be higher in the largest stand density due to microclimate and input of N via litterfall and root, and this may contribute to 15N fractionation in the leaves [26]. The larger roots biomass in denser stands improves soil N uptake to sustain the larger canopy biomass. Studies have indicated that biological fixation is more expensive in terms of ATP than the uptake of mineral N from the soil [52]. However, the metabolic cost explains partially the %Ndfa since larger %Ndfa was observed in the smallest stand density. Moreover, when we look at the fixation within the blocks with the highest amounts of N in the soil, the %Ndfa values were increased in all stand densities in a proportion like that observed for the general average showed in Figure 2. In contrast, the %Ndfa values were reduced and less affected by intraspecific competition when we used only the two blocks with the lowest soil N stock. The regulation trend of biological N2 fixation with stand density is reasonable since biogeochemistry cycling and competition were likely intensive. However, an important bias of this discussion is related to the number of repetitions to compare the δ15N and the %Ndfa simultaneously between stand density and blocks. Besides, the effect of rhizobium and mycorrhizal status on N2 fixing were not evaluated here [35]. We did not find articles to subside any conclusion related to 15N natural abundance values found in leaves of native species as a function of stand density and symbionts status. The possibility of them accessing different N sources may cause fractionation as stressed by some authors [19,35,54]. Although some authors argue that reference plant may differ in δ15N (lower) than 5‰ in the leaves of fixing [54], the difference between the means obtained in o our study was 3.88‰, similar to other studies that reported the N fixation estimative [31,39]. Other explanations for small differences in δ15N are the absence of inoculation with specific strains, and the natural microbiota of the soil, which is different from the original region [16].
The N accretion method indicated gains by biological fixation at the density of 1111 trees ha−1 and an equivalent value to the 15N natural abundance method at the density of 1666 trees ha−1. This method requires accurate quantification of N pools because the input and output of N should be similar between fixing and non-fixing species [54]. Furthermore, the method could involve measurements of the litter accumulated on the soil and deeper soil [39], which was not evaluated in the present study. In contrast, the 15N natural abundance was not applicable in several studies that showed noticeable inputs of N by N2 fixing legumes trees using the N accretion method [19,35]. The use of the accretion method was unfeasible for blocks with the higher soil N pools lead to a negative estimative of N fixation for all the stand densities. These patterns may be explained by the positive response of fast-growing and non-N2-fixing S. parahyba to soil conditions. Moreover, the very larger amounts of N2 fixation estimative by accretion method applied to block with the lower soil N pools and other soil fertility parameter, reinforce the divergent patterns of species response to soil proprieties and stand densities, as well as the positive impact of N2-fixing to improve N for the legume trees.

4. Materials and Methods

4.1. Characterization of the Study Area

The study was conducted in monospecific stands of A. peregrina and S. parahyba located within the area of the Federal Institute of Education, Science, and Technology of Espírito Santo (IFES) (20°46′15.46″ S and 41°27′13.04″ W), municipality of Alegre, state of Espírito Santo, Brazil. The elevation of the region varies from 130 to 205 m.a.s.l., and the climate type is Aw, according to the classification by Köppen. The mean annual temperature and rainfall are 23 °C and 1200 mm, respectively [55].
This study used data from experimental plots established according to three stand densities, corresponding to 625, 1111, and 1666 trees, ha−1 (4 × 4 m2, 3 × 3 m2, and 3 × 2 m2, respectively) for each species. For each stand density and species, nine plots with an area equal to 1500 m2 each were equally distributed in three blocks for the control of slopes, which ranged between <15% and 45% [45,46]. The stands were established in June 2011 in an area previously occupied by unmanaged pasture, with the predominance of Brachiaria sp. for more than 40 years. For the implantation of the experiment, the cattle were removed, and the pasture area was desiccated by applying glyphosate. The seedlings were planted in 30 × 30 × 30 cm planting holes. Despite seedlings of A. peregrina were not inoculated with any N2-fixing bacteria, the subfamily Mimosoideae easily establishes beta-rhizobial symbioses in the field [56,57]. Each plant received 220 g of the NPK 06-30-06 commercial fertilizer and micronutrients (0.2% Cu; 0.2% Zn) per planting hole at planting. Maintenance occurred for 12 months after planting through re-planting, weed control, and ant control.
The soils in the study area are Acrisols, Ferralsols, and Cambisols (FAO classification). The chemical attributes of the surface soil layer (0–20 cm) were determined before planting of species (Table S1, Supplementary Materials) [45,46]. In brief, the mean values for experimental plots were 5.7 for pH, 2.1 mg dm−3 for available phosphorus, 73.1 mg dm−3 for potassium, been statistically equal between species and blocks. The mean value of cation exchange capacity was slightly higher in A. peregrina than in S. parahyba blocks, with mean values of 7.9 and 6.2 cmolc dm−3, respectively. The organic matter (OM) was also slightly higher in A. peregrina than in S. parahyba plots, with mean values of 22.3 and 16.2 g kg−1, respectively.

4.2. N Pools in Tree Biomass

The N pools in aboveground biomass at stand level were estimated using inventory data, biomass equations, and N concentration in tree tissues. The forest inventory (e.g., height, diameter, and survival) was carried out at 44 months in all experimental plots; and biomass equations for leaves, branches, stembark, and stem wood were adjusted after selection and harvest of 45 trees by species at 56 months of age at the time of the study conducted by [45,46] (unpublished data). These measures were performed over the rain season (January–March). The biomass was measured in one medium-diameter tree ± one standard deviation per plot. The trees felled in the tested densities of 625, 1111, and 1666 trees ha−1 showed mean values of diameter at breast height equivalent to 7.4, 7.1, and 6.6 cm for A. peregrina and 14.3, 12.0, and 11.3 cm for S. parahyba, for the respective densities. The total tree height was 5.9, 6.3, and 6.2 m for A. peregrina and 11.4, 10.4, and 13.3 m for S. parahyba (details in [45,46]). The leaves, live branches, and trunk of all felled trees were separated and weighed in the field. One sample per biomass component was retrieved for moisture determination. Discs with bark were sampled, and the bark proportion in the discs was used to estimate the bark biomass. This study used samples collected from nine trees per species and stand density for N analysis (27 trees per species).
The roots of three trees per species and stand density (18 trees in all) were sampled with a backhoe loader in one of the blocks, and there was no separation of roots by size class. The excavation occurred in every projection of the crown and the maximum volume until the total pivoting root was obtained. The roots were separated from the soil using a 1.0 × 1.0 cm2 mesh sieve and weighed in the field. The roots were cleaned with a damp cloth, and a composite sample containing roots with different diameters was retrieved species and plot.
All samples were previously dried at 65 °C until constant weight and ground in a Willey mill (1.0 mm sieve). The N concentration was determined using the Kjeldahl method in the samples of leaves, branches, bark, wood, and roots of the trees felled in the three stand densities (243 samples in total).
N accumulation (kg ha−1) in the aboveground biomass was calculated using the data of biomass accumulated in each plot, estimated using the previous equations and data from the inventory [45,46] (unpublished data) multiplied by the mean N concentration in the biomass components of each stand density (N = 9). Thus, only trees present in the plot were accounted for N accumulation. The trees survival was subtly larger in A. peregrina (73%–82%) than S. parahyba (65%–70%). The mean values of root biomass observed in each stand density and species were converted to hectare using an estimative of the excavated area. The N accumulated in the roots (kg ha−1) was estimated for each stand density and species using the roots biomass multiplied by the mean N content (N = 3).

4.3. N Pools in the Soil

The N pool into 0–5, 5–10, and 10–20 cm soil layers was estimated to 67 months after planting of species. In each plot, six individual soil samples were collected in six different positions and distances to the trees and mixed, according to the methodology adapted from [19]. One sample per plot and soil layer was retrieved for N analysis. Soil density was determined in each soil layer using a 5-cm diameter metallic ring with a soil sample collected from the central region of each experimental plot. The N concentration was determined in dried, ground, and sieved soil samples according to the Kjeldahl method described by [58]. The samples used for density determination were dried at 105 °C for 72 h and weighed on a precision balance.
We calculated N pools for topsoil (0–20 cm soil depth) using the weighted value of N concentration in each plot (N = 54) and the corrected values of soil mass determined in each block per species (N = 9). The soil density was statistically equal between the stand density of the A. peregrina and S. parahyba in our study area [48].

4.4. N Pools via Biological N2 Fixation

4.4.1. 15N Natural Abundance Method

The natural abundance of 15N was determined in samples of the leaves collected for biomass evaluation at 56 months. For each tree species and stand density, we mixed leaf samples of three trees in the three plots of each block. Thus, the number of repetitions per species was nine, been three repetitions per stand density. The δ15N values [59] were determined with a Hydra 20–20 isotope ratio mass spectrometer connected to an ANCA-GSL automatic analyzer (Sercon Co., Krewe, UK), and approximately 10 mg of leaves were used in each analysis. The precision of isotopic measurements was 0.0001% × (15N) [54]. The percentage of N derived from fixation (%Ndfa) was estimated using the values of δ15N in the leaves of A. peregrina and S. parahyba in each stand density (Equation (1)) [60]:
  % Ndfa =   δ 15 N   S .   parahyba     δ 15 N   A .   peregrina   δ 15 N   S .   parahyba     B   × 100
where δ15N S. parahyba (reference plant) is the mean value of 103δ15N in the leaf samples of each stand density with S. parahyba (N = 3); δ15N A. peregrina is the mean value of 103δ15N in the leaf samples of each stand density with A. peregrina (N = 3). Only the leaves were used for the estimates of the %Ndfa, as suggested in other studies [61]. It was assumed that the species assessed soil N with a similar abundance of δ15N [38]. In the study, the value B was assumed to be zero. The B value represents the isotopic fractionation that occurs during the biological N fixation, and it is unknowledgeable for A. peregrine.

4.4.2. N Accretion Method

The estimative of biological N2 fixation in A. peregrina stands was also performed using the N accretion method [62], by comparing the N pool in topsoil and the biomass of the N2-fixing species with the non-N2-fixing species (Equation (2)).
N 2   fixed =   ( N   bio   A . peregrina     N   bio   S .   parahyba ) + ( N   soil   A .   peregrina N   soil   S .   parahyba )  
where N bio and N soil refer to the mean values of N pools (kg ha−1) in the aboveground and belowground biomass and the topsoil, in each stand density with A. peregrina and S. parahyba. The N pools in the forest floor, in understory vegetation and deep soil layer is not examined here. These N pools were not easy to assess since the presence of understory vegetation difficult sampling of forest floor and the understory was unequal among species and stand density ([48], unpublished data).

4.5. Statistical Analysis of the Data

We initially tested the effect of stand density and blocks on the N accumulated in the soil and biomass of each species using a two-way ANOVA. We disregarded the effect of the block in the comparisons between species for the N accumulated in the total biomass, as well as the 103 δ15N. Therefore, for each stand density, the differences between species for the N accumulated in the aboveground biomass and the 103 δ15N values were tested using a paired sample T-test. No statistical analysis was applied for the N content in the roots’ biomass, Total N of species and %Ndfa due to the reduced number of replications. The data were subjected to the test of homogeneity of variances and the Shapiro-Wilk normality test. The statistical analysis was performed with the software SigmaPlot® 13.0 (Systat Software Inc., San Jose, CA, USA, 2014), with a statistical threshold value of p = 0.05.

5. Conclusions

The species showed divergent patterns of the N pools in the biomass despite no significant differences in aboveground N. S. parahyba accumulated most N mainly in the stem, while A. peregrina accumulated N in the canopy and roots. A. peregrina was less affected by intraspecific competition, accumulating larger N in biomass in stand density of 1111 and 1666 trees ha−1 than S. parahyba. Soil N pools were statistically equal between the studied species and their respective densities. However, differences of soil N among experimental blocks highlighted contrasting patterns of response between N2-fixing and non-N2-fixing. On the other hand, the N pools in biomass of A. peregrina were not depleted by soil N or other soil fertility indicators, while the opposite behavior was observed for S. parahyba. Furthermore, differences in δ15N suggested more soil N dependence and lower %Ndfa by A. peregrina in higher stand density than in lower stand density. The methods used showed a similar magnitude of biological N2 fixation only in the largest stand density with 1666 trees ha−1. The biological N2 fixation estimates depended on the method and the response of tree species to environment.

Supplementary Materials

The following are available online at https://www.mdpi.com/2504-3129/2/1/6/s1, Table S1: Mean values of soil attributes (0–20 cm) before the establishment of the monospecific stands of A. peregrina and S. parahyba.

Author Contributions

Conceptualization: R.R.P.; writing original draft: K.N.B.; R.R.P.; formal analysis: K.N.B., P.H.S., W.M.D., R.R.P.; data collection: P.H.S., W.M.D.; funding acquisition: R.R.P.; M.V.W.C.; review and edition: R.R.P., K.N.B., D.L.B., E.S.M., F.d.C.B. All authors have read and agreed to the published version of the manuscript.

Funding

This research was funded by Fundação de Amparo à Pesquisa e Inovação do Espírito Santo grant number 71416382/2016 and 64946088/2013.

Institutional Review Board Statement

Not applicable.

Informed Consent Statement

Not applicable.

Data Availability Statement

The data presented in this study are available on request from the corresponding author.

Acknowledgments

We would like to thank Fundação de Amparo à Pesquisa e Inovação do Espírito Santo and Conselho Nacional de Desenvolvimento Científico e Tecnológico–CNPq—for the financial support (Post-Doc fellowships numbers 300369/2016-6 and 159972/2018-3). We are also grateful for Laboratório de Isótopos Estáveis of CENA/USP, Laboratório de Ecologia Aplicada of ESALQ/USP, and Laboratório de Recursos Hídricos e Solos of DCFM/UFES for their technical support. We would like to thank Instituto Federal de Ciência e Tecnologia do Espírito Santo, Campus de Alegre, and the partners and the partners for the available study formally called the “Floresta Piloto”. We are also grateful to Italo Favoretto Campanharo and Lucas José Mendes by support in field collection. We are also grateful to the anonymous reviewers by improvements to the manuscript.

Conflicts of Interest

The authors declare no conflict of interest.

Sample Availability

Not available.

References

  1. Aronson, J.; Goodwin, N.; Orlando, L.; Eisenberg, C.; Cross, A.T. A world of possibilities: Six restoration strategies to support the United Nation’s Decade on Ecosystem Restoration. Restor. Ecol. 2020, 28, 730–736. [Google Scholar] [CrossRef]
  2. Growing Better: Ten Critical Transitions to Transform Food and Land Use; The Global Consultation Report of the Food and Land Use Coalition. 2019, p. 237. Available online: https://www.foodandlandusecoalition.org/global-report/ (accessed on 5 May 2020).
  3. Rezende, C.L.; Scarano, F.R.; Assad, E.D.; Joly, C.A.; Metzger, J.P.; Straussburg, B.B.N.; Tabarelli, M.T.; Fonseca, G.A.; Mittermeier, R.A. From hotspot to hopespot: An opportunity for the Brazilian Atlantic Forest. Perspect. Ecol. Conserv. 2018, 16, 208–214. [Google Scholar] [CrossRef]
  4. Ribeiro, M.C.; Metzger, J.P.; Martensen, A.C.; Ponzoni, F.J.; Hirota, M.M. The Brazilian Atlantic Forest: How much is left, and how is the remaining forest distributed? Implications for conservation. Biol. Conserv. 2009, 142, 1141–1153. [Google Scholar] [CrossRef]
  5. Silva, R.F.B.; Batistela, M.; Moran, E.F. Drivers of land change: Human-environment interactions and the Atlantic forest transition in the Paraíba Valley, Brazil. Land Use Policy 2016, 58, 133–144. [Google Scholar] [CrossRef]
  6. IBÁ (Indústria Brasileira De Árvores). Relatório 2019. p. 80. Available online: https://iba.org/datafiles/publicacoes/relatorios/iba-relatorioanual2019.pdf (accessed on 5 May 2020).
  7. Gonçalves, J.L.M.; Alvares, C.A.; Higa, A.R.; Silva, L.D.; Alfenas, A.C.; Stahl, J.; Ferraz, S.F.B.; Lima, W.P.; Brancalion, P.H.S.; Hubner, A.; et al. Integrating genetic and silvicultural strategies to minimize abiotic and biotic constraints in Brazilian eucalypt plantations. For. Ecol. Manag. 2013, 301, 6–27. [Google Scholar] [CrossRef]
  8. Gonçalves, J.L.M.; Alvares, C.A.; Rocha, J.H.T.; Brandani, C.B.; Hakamada, R. Eucalyptus plantation managment in regions with water stress. South. For. 2017, 79, 169–183. [Google Scholar] [CrossRef]
  9. Rolim, S.G.; Piña-Rodrigues, F.C.M.; Piotto, D.; Batista, A.; Freitas, M.L.M.; Brienza, S., Jr.; Zakia, M.J.B.; Calmon, M. Research Gaps and Priorities in Silviculture of Native Species. In WRI Brasil; Working Paper; São Paulo, Brazil, 2019; Available online: https://wribrasil.org.br/pt/publicacoes (accessed on 5 May 2020).
  10. Ferreira, T.M.C.; De Carvalho, J.O.P.; Emmert, F.; Ruschel, A.R.; Nascimento, R.G.M. How long does the Amazon rainforest take to grow commercially sized trees? An estimation methodology for Manilkara elata (Allemão ex Miq.) Monach. For. Ecol. Manag. 2020, 473, 118333. [Google Scholar] [CrossRef]
  11. Gama-Rodrigues, A.C. Multifunctional Mixed-Forest Plantations: The Use of Brazilian Native Leguminous Tree Species for Sustainable Rural Development. In Mixed Plantations of Eucalyptus and Leguminous Trees, 1st ed.; Bran Nogueira Cardoso, E., Gonçalves, J., Balieiro, F., Franco, A., Eds.; Springer: Berlin/Heidelberg, Germany, 2020; pp. 241–256. [Google Scholar] [CrossRef]
  12. Silva, P.S.L.; Paiva, H.N.D.; Oliveira, V.R.D.; Siqueira, P.L.D.O.F.; Soares, E.B.; Monteiro, A.L.; Tavella, L.B. Biomassas de espécies arbóreas em resposta a densidades de plantio e à competição interespecífica. Rev. Árvore 2014, 38, 319–329. [Google Scholar] [CrossRef] [Green Version]
  13. Reich, P.B. The world-wide ‘fast–slow’ plant economics spectrum: A traits manifesto. J. Ecol. 2014, 102, 275–301. [Google Scholar] [CrossRef]
  14. Li, S.X.; Wang, Z.H.; Stewart, B.A. Responses of crop plants to ammonium and nitrate N. In Advances in Agronomy; Donald, L.B.T., Ed.; Academic Press: Cambridge, MA, USA, 2013; Volume 118, pp. 205–397. [Google Scholar] [CrossRef]
  15. Gehring, C.; Vlek, P.L.G.; Souza, L.A.G.; Denich, M. Biological nitrogen fixation in secondary regrowth and mature rainforest of central Amazonia. Agric. Ecosyst. Environ. 2005, 111, 237–2452. [Google Scholar] [CrossRef]
  16. Chaer, G.M.; Resende, A.S.; Campello, E.F.C.; De Faria, S.M.; Boddey, R.M. Nitrogen-fixing legume tree species for the reclamation of severely degraded lands in Brazil. Tree Physiol. 2011, 31, 139–149. [Google Scholar] [CrossRef] [PubMed] [Green Version]
  17. Nardoto, G.B.; Quesada, C.A.; Patiño, S.; Saiz, G.; Baker, T.R.; Schwarz, M.; Schrodt, F.; Feldpausch, T.R.; Domingues, T.F.; Marimon, B.S.; et al. Basin-wide variations in Amazon forest nitrogen-cycling characteristics as inferred from plant and soil 15N:14N measurements. Plant Ecol. Diveristy 2014, 7, 173–187. [Google Scholar] [CrossRef]
  18. Santos, F.M.; Chaer, G.M.; Diniz, A.R.; Balieiro, F.C. Nutrient cycling over five years of mixed-species plantations of Eucalyptus and Acacia on a sandy tropical soil. For. Ecol. Manag. 2017, 384, 110–121. [Google Scholar] [CrossRef]
  19. Voigtlaender, M.; Brandani, C.B.; Caldeira, D.R.M.; Tardy, F.; Bouillet, J.P.; Gonçalves, J.L.M.; Moreira, M.Z.; Leite, F.P.; Brunet, D.; Paula, R.R.; et al. Nitrogen cycling in monospecific and mixed-species plantations of Acacia mangium and Eucalyptus at 4 sites in Brazil. For. Ecol. Manag. 2019, 436, 56–67. [Google Scholar] [CrossRef]
  20. Munroe, J.W.; Isaac, M.E. N2-fixing trees and the transfer of fixed-N for sustainable agroforestry: A review. Agron. Sustain. Dev. 2014, 34, 417–427. [Google Scholar] [CrossRef]
  21. Paula, R.R.; Bouillet, J.P.; Trivelin, P.C.O.; Zeller, B.; Gonçalves, J.L.M.; Nouvellon, Y.; Bouvet, J.M.; Plassard, C.; Laclau, J.P. Evidence of short-term belowground transfer of nitrogen from Acacia mangium to Eucalyptus grandis trees in a tropical planted forest. Soil Biol. Biochem. 2015, 91, 99–108. [Google Scholar] [CrossRef] [Green Version]
  22. Kaye, J.P.; Resh, S.C.; Kaye, M.W.; Chimner, R.A. Nutrient and Carbon Dynamics in a Replacement Series of Eucalyptus and Albizia Trees. Ecology 2000, 81, 3267–3273. [Google Scholar] [CrossRef]
  23. Resh, S.C.; Binkley, D.; Parrotta, J.A. Greater Soil Carbon Sequestration under Nitrogen-fixing Trees Compared with Eucalyptus Species. Ecosystems 2002, 5, 217–231. [Google Scholar] [CrossRef]
  24. Vitousek, P.M.; Cassman, K.; Cleveland, C.; Crews, T.; Field, C.B.; Grimm, N.B.; Howarth, R.W.; Marino, R.; Martinelli, L.; Rastetter, E.B.; et al. Towards an ecological understanding of biological nitrogen fixation. Biogeochemistry 2002, 57, 1–45. [Google Scholar] [CrossRef]
  25. Paula, R.R.; Bouillet, J.P.; Gonçalves, J.L.M.; Trivelin, P.C.O.; Balieiro, F.C.; Nouvellon, Y.; Oliveira, J.C.; Deus Júnior, J.C.; Bordron, B.; Laclau, J.P. Nitrogen fixation rate of Acacia Mangium wild at mid rotation in Brazil is higher in mixed plantations with Eucalyptus Grandis Hill ex Maiden than in monocultures. Ann. For. Sci. 2018, 75, 14. [Google Scholar] [CrossRef] [Green Version]
  26. Gourion, B.; Berrabah, F.; Ratet, P.; Stacey, G. Rhizobium–legume symbioses: The crucial role of plant immunity. Trends Plant Sci. 2015, 20, 186–194. [Google Scholar] [CrossRef] [Green Version]
  27. Wang, Q.; Wang, J.; Li, Y.; Chen, D.; Ao, J.; Zhou, W.; Jiang, Y. Influence of nitrogen and phosphorus additions on N2-fixation activity, abundance, and composition of diazotrophic communities in a Chinese fir plantation. Sci. Total Environ. 2018, 619, 1530–1537. [Google Scholar] [CrossRef]
  28. Chikoti, Y.F.; Duangkhet, M.; Chungopast, S.; Tajima, S.; Ma, J.F.; Nomura, M. Effect of ferritin on nitrogen fixation in Lotus japonicus nodules under various iron concentrations. J. Plant Physiol. 2020, 252, 153247. [Google Scholar] [CrossRef] [PubMed]
  29. Petit, G.; Savi, T.; Consolini, M.; Anfodillo, T.; Nardini, A. Interplay of growth rate and xylem plasticity for optimal coordination of carbon and hydraulic economies in Fraxinus ornus trees. Tree Physiol. 2016, 36, 1310–1319. [Google Scholar] [CrossRef]
  30. Hoogmoed, M.; Cunningham, S.C.; Baker, P.; Beringer, J.; Cavagnaro, T.R. N-fixing trees in restoration plantings: Effects on nitrogen supply and soil microbial communities. Soil Biol. Biochem. 2014, 77, 203–212. [Google Scholar] [CrossRef]
  31. Faria, S.M.; Balieiro, F.C.; Paula, R.R.; Santos, F.M.; Zilli, J.L. Biological Nitrogen Fixation (BNF) in Mixed-Forest Plantations. In Mixed Plantations of Eucalyptus and Leguminous Trees: Soil, Microbiology and Ecosystem Services, 1st ed.; Cardoso, E.J.B.N., Gonçalves, J.L.M., Balieiro, F.C., Franco, A.A., Eds.; Springer: Cham, Switzerland, 2020; Volume 1, pp. 103–135. [Google Scholar] [CrossRef]
  32. Boddey, R.M.; Peoples, M.B.; Palmer, B.; Dart, P.J. Use of the 15N natural abundance technique to quantify biological nitrogen fixation by woody perennials. Nutr. Cycl. Agroecosyst. 2000, 57, 235–270. [Google Scholar] [CrossRef]
  33. Ruiz-Navarro, A.; Barberá, G.G.; Albaladejo, J.; Querejeta, J.I. Plant δ15N reflects the high landscape-scale heterogeneity of soil fertility and vegetation productivity in a Mediterranean semiarid ecosystem. New Phytol. 2016, 212, 1030–1043. [Google Scholar] [CrossRef] [PubMed]
  34. Peoples, M.B.; Faizah, A.W.; Rerkasem, B.; Herridge, D.F. Methods for Evaluating Nitrogen Fixation by Nodulated Legumes in the Field; ACIAR: Sidney, Australia, 1989; p. 76.
  35. Forrester, D.I.; Schortemeyer, M.; Stock, W.D.; Bauhus, J.; Khanna, P.K.; Cowie, A.L. Assessing nitrogen fixation in mixed-and single-species plantations of Eucalyptus globulus and Acacia mearnsii. Tree Physiol. 2007, 27, 1319–1328. [Google Scholar] [CrossRef] [PubMed]
  36. Unkovich, M.J.; Herridge, D.; Peoples, M.B.; Cadisch, G.; Boddey, B.; Giller, K.; Alves, B.; Chalk, P. Measuring Plant-Associated Nitrogen Fixation in Agricultural Systems; Australian Centre for International Agricultural Research: Canberra, Australia, 2008; p. 258.
  37. Chalk, P.M.; Inácio, C.T.; Balieiro, F.C.; Rouws, J.R.C. Do techniques based on 15N enrichment and 15N natural abundance give consistent estimates of the symbiotic dependence of N2-fixing plants? Plant Soil 2016, 399, 415–426. [Google Scholar] [CrossRef]
  38. Zhou, Y.; Mushinski, R.M.; Hyodo, A.; Wu, X.B.; Boutton, T.W. Vegetation change alters soil profile δ15N values at the landscape scale. Soil Biol. Biochem. 2018, 119, 110–120. [Google Scholar] [CrossRef]
  39. Yu, C.B.; Li, Y.Y.; Li, C.J.; Sun, J.H.; He, X.H.; Zhang, F.S.; Li, L. An improved nitrogen difference method for estimating biological nitrogen fixation in legume-based intercropping systems. Biol. Fertil. Soils 2010, 46, 227–235. [Google Scholar] [CrossRef]
  40. Cordeiro, I.M.C.C.; Barros, P.L.C.; Lameira, O.A.; Gazel Filho, A.B. Avaliação de plantios de paricá (Schizolobium parahyba var. amazonicum (Huber ex Ducke) Barneby) de diferentes idades e sistemas de cultivo no município de aurora do Pará-PA (BRASIL). Cienc. Florest. 2015, 25, 679–687. [Google Scholar] [CrossRef] [Green Version]
  41. Barberi, A.; Carneiro, M.A.; Moreira, F.M.; Siqueira, J.O. Nodulação em leguminosas florestais em viveiros no sul de Minas Gerais. Cerne 1998, 4, 145–153. [Google Scholar]
  42. Souza, C.O.; Silva, J.G.M.; Arantes, M.D.C.; Vidaurre, G.B.; Júnior, A.D.; Oliveira, M.P. Pyrolysis of Anadenanthera peregrina wood grown in different spacings from a forest plantation in Brazil aiming at the energy production. Environ. Dev. Sustain. 2019, 22, 5153–5168. [Google Scholar] [CrossRef]
  43. Gross, E.; Cordeiro, L.; Caetano, F.H. Nodulação e micorrização em Anadenanthera peregrina var. falcata em solo de cerrado autoclavado e não autoclavado. Rev. Bras. Cienc. Solo 2004, 28, 95–101. [Google Scholar] [CrossRef] [Green Version]
  44. Moshelion, M.; Halperin, O.; Wallach, R.; Oren, R.A.M.; Way, D.A. Role of aquaporins in determining transpiration and photosynthesis in water-stressed plants: Crop water-use efficiency, growth and yield. Plant Cell Environ. 2014, 38, 1785–1793. [Google Scholar] [CrossRef]
  45. Souza, P.H. Biomassa e Estoque de Carbono em Povoamento de Anadenanthera peregrina (l.) Speg Sob Diferentes Espaçamentos. Ph.D. Thesis, Universidade Federal do Espírito Santo, Jerônimo Monteiro, Brazil, 2018. [Google Scholar]
  46. Delarmelina, W.M. Biomassa e Carbono em Plantios de Schizolobium parahyba var. Amazonicum Sob Diferentes Espaçamentos em Área de Pastagem. Ph.D. Thesis, Universidade Federal do Espírito Santo, Jerônimo Monteiro, Brazil, 2019. [Google Scholar]
  47. Rondon, E.V. Produção de biomassa e crescimento de árvores de Schizolobium amazonicum (Huber) Ducke sob diferentes espaçamentos na região de mata. Rev. Árvore 2002, 26, 573–576. [Google Scholar] [CrossRef] [Green Version]
  48. Campanharo, I.F. Mudanças Edáficas após Plantio de Leguminosas Arbóreas em Pastagem no sul do Espírito Santo. Bachelor’s Thesis, Universidade Federal do Espírito Santo, Jerônimo Monteiro, Brazil, 2017. [Google Scholar]
  49. Feller, C.; Beare, M.H. Physical control of soil organic matter dynamics in the tropics. Geoderma 1997, 79, 69–116. [Google Scholar] [CrossRef]
  50. Shi, S.; Peng, C.; Wang, M.; Zhu, Q.; Yang, G.; Yang, Y.; Xi, T.; Zhang, T. A global meta-analysis of changes in soil carbon, nitrogen, phosphorus and sulfur, and stoichiometric shifts after forestation. Plant Soil 2016, 407, 323–340. [Google Scholar] [CrossRef]
  51. Rachid, C.T.C.C.; Balieiro, F.C.; Peixoto, R.S.; Pinheiro, Y.A.S.; Piccolo, M.C.; Chaer, G.M.; Rosado, A.S. Mixed plantations can promote microbial integration and soil nitrate increases with changes in the N cycling genes. Soil Biol. Biochem. 2013, 66, 146–153. [Google Scholar] [CrossRef]
  52. Sheffer, E.; Batterman, S.A.; Levin, S.A.; Hedin, L.O. Biome-scale nitrogen fixation strategies selected by climatic constraints on nitrogen cycle. Nat. Plants 2015, 1, 1–6. [Google Scholar] [CrossRef] [PubMed]
  53. Gholz, H.L.; Wedin, D.A.; Smitherman, S.M.; Harmon, M.E.; Parton, W.J. Long-term dynamics of pine and hardwood litter in contrasting environments: Toward a global model of decomposition. Glob. Chang. Biol. 2000, 6, 751–765. [Google Scholar] [CrossRef]
  54. Högberg, P. 15N natural abundance in soil–plant systems. New Phytol. 1997, 137, 179–203. [Google Scholar] [CrossRef]
  55. Alvares, C.A.; Stape, J.L.; Sentelhas, P.C.; Gonçalves, J.L.M. Modeling monthly mean air temperature for Brazil. Theor. Appl. Climatol. 2013, 113, 407–427. [Google Scholar] [CrossRef]
  56. De Faria, S.M.; De Lima, H.C.; Sprent, J.I. Additional studies of the nodulation status of legume species in Brazil. Plant Soil 1998, 200, 185–192. [Google Scholar] [CrossRef]
  57. Reis Junior, F.B.; Simon, M.F.; Gross, E.; Boddey, R.M.; Elliott, G.N.; Neto, N.E.; De Fatima, L.M.; De Queiroz, L.P.; Scotti, M.R.; Chen, W.-M.; et al. Nodulation and nitrogen fixation by Mimosa spp. in the Cerrado and Caatinga biomes of Brazil. New Phytol. 2010, 186, 934–946. [Google Scholar] [CrossRef] [PubMed] [Green Version]
  58. Mendonça, E.S.; Matos, E.S. Matéria Orgânica do Solo: Métodos de Análises; UFV: Viçosa, Brazil, 2005; p. 107. [Google Scholar]
  59. Coplen, T.B. Guidelines and recommended terms for expression of stable-isotope-ratio and gas-ratio measurement results. Rapid Commun. Mass Spectrom. 2011, 25, 2538–2560. [Google Scholar] [CrossRef]
  60. Shearer, G.; Kohl, D.H. N2-fixation in field settings: Estimations based on natural 15N abundance. Aust. J. Plant Physiol. 1986, 13, 699–756. [Google Scholar] [CrossRef]
  61. Parrotta, J.A.; Baker, D.D.; Fried, M. Changes in dinitrogen fixation in maturing stands of Casuarina equisetifolia and Leucaena leucocephala. Can. J. For. Res. 1996, 26, 1684–1691. [Google Scholar] [CrossRef]
  62. Evans, J.; Taylor, A. Estimating dinitrogen (N2) fixation and soil accretion of nitrogen by grain legumes. J. Aust. Inst. Agric. Sci. 1987, 53, 78–82. [Google Scholar]
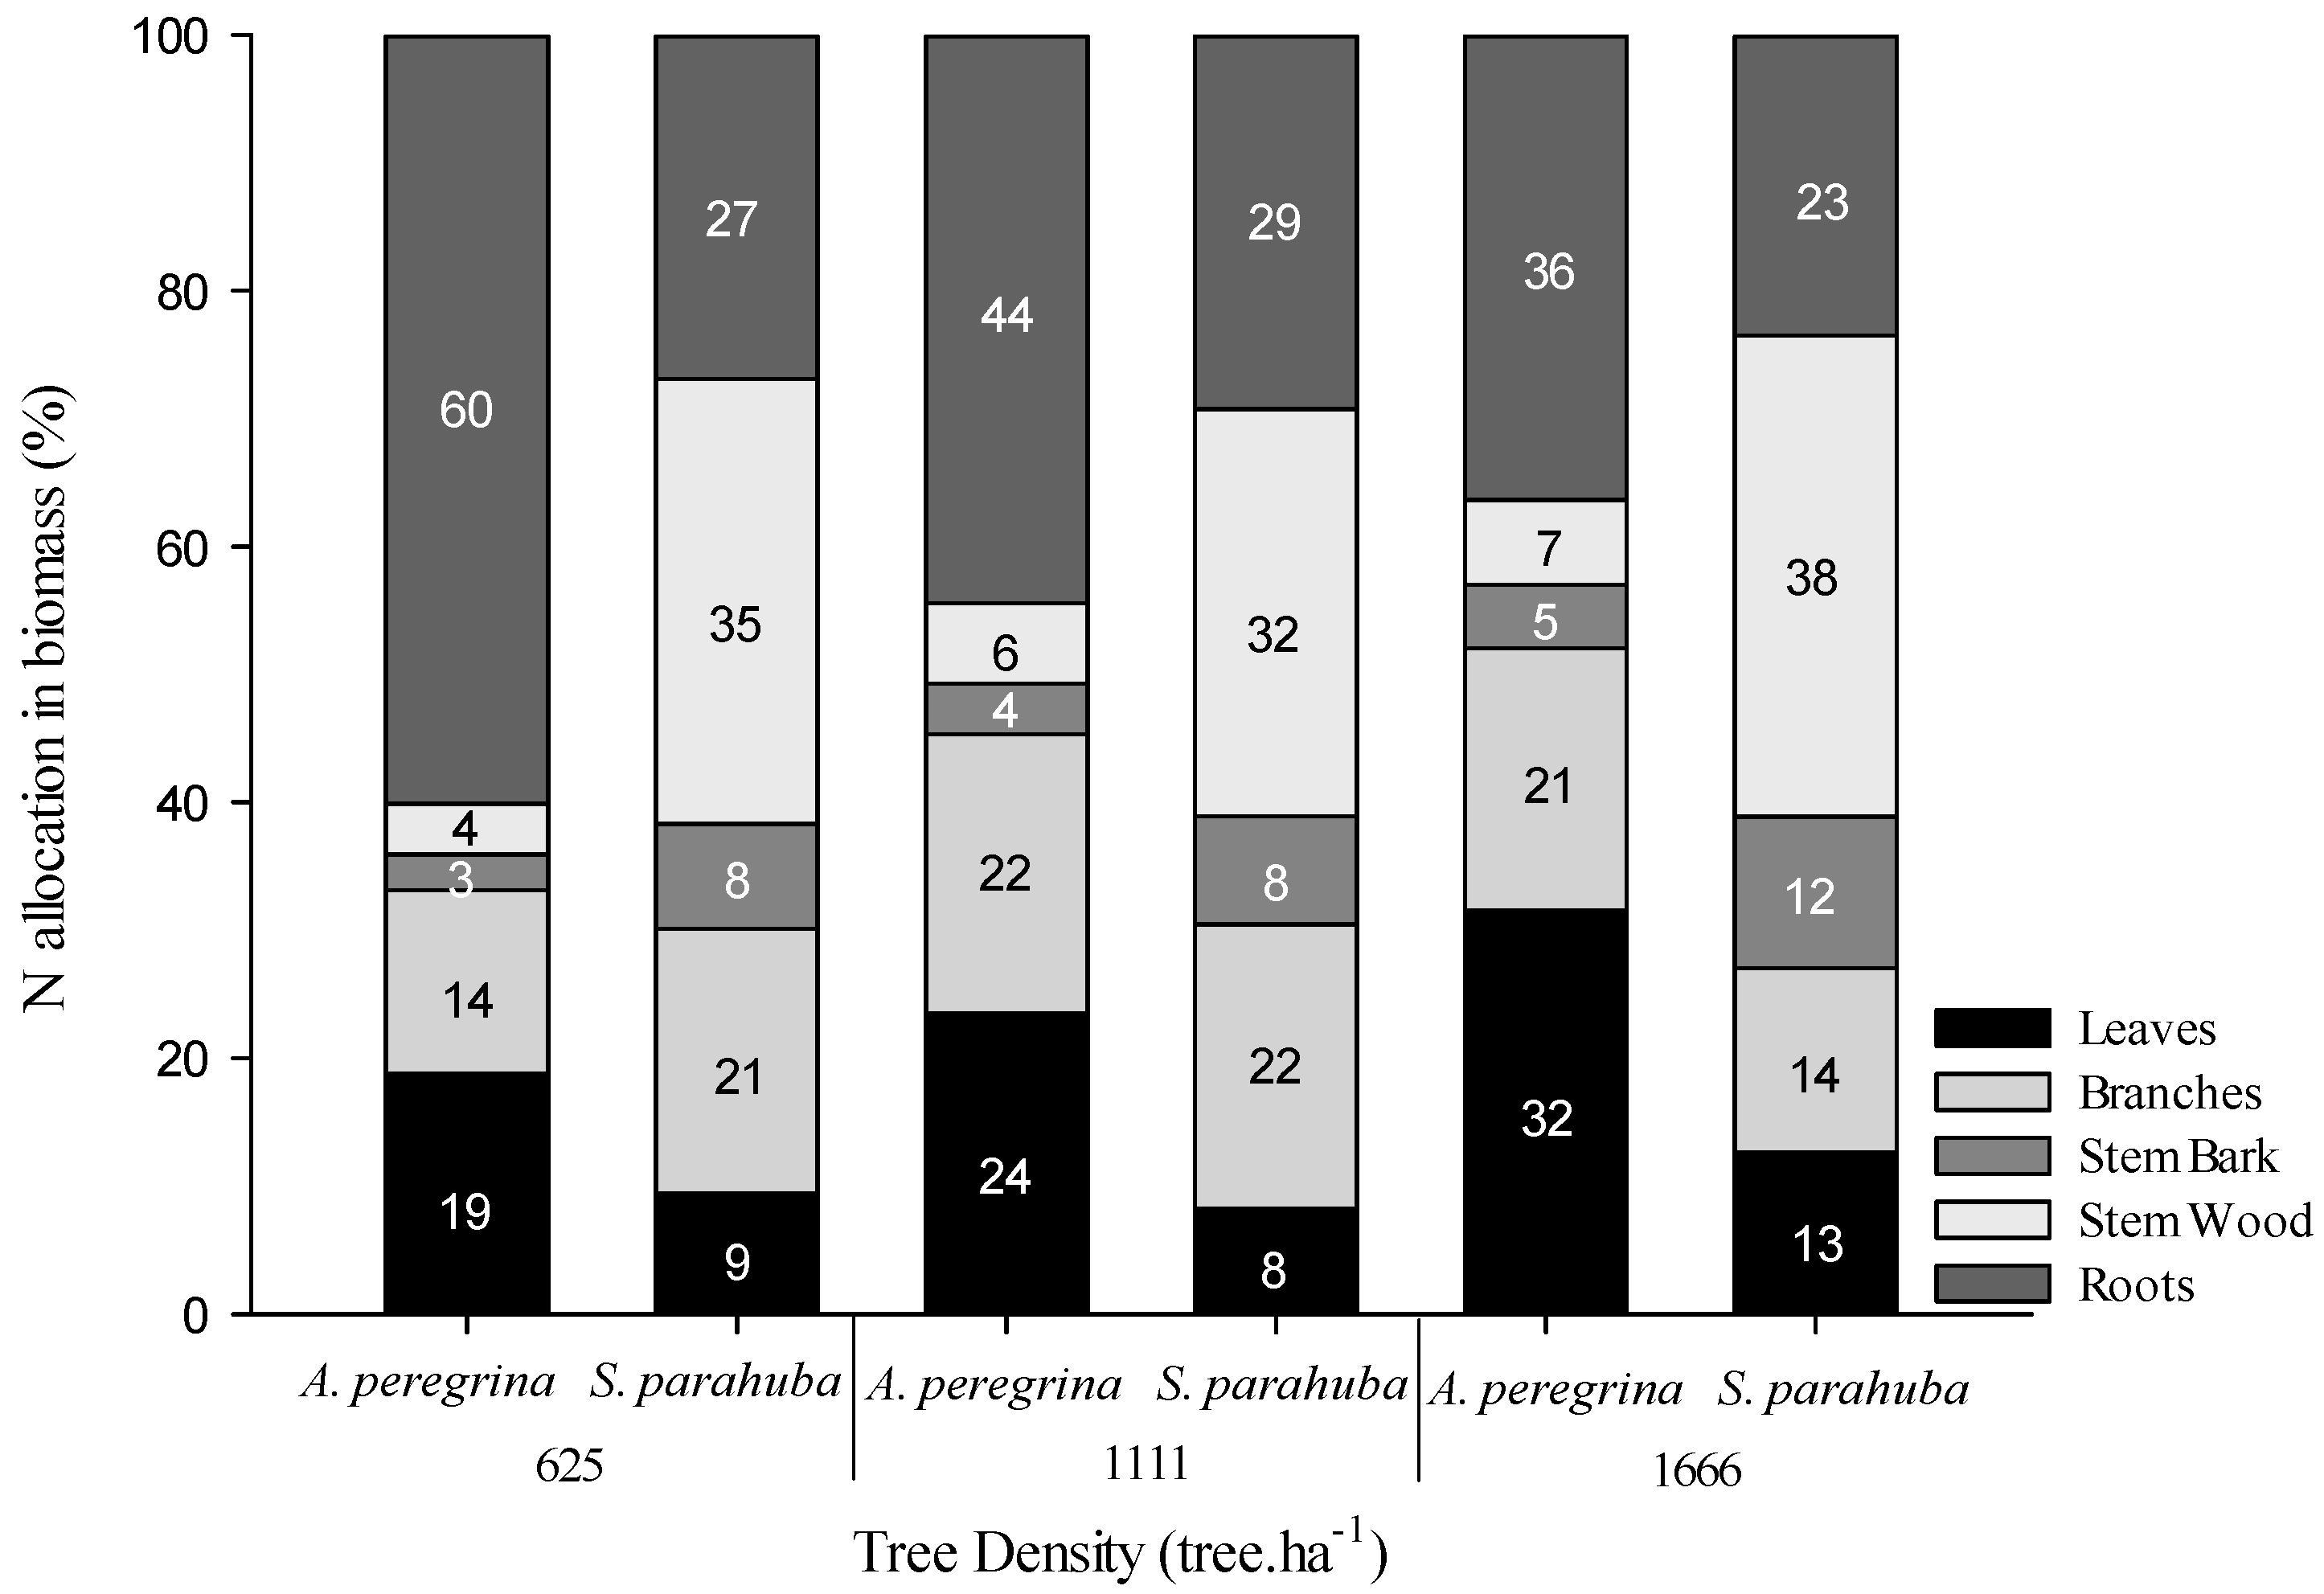
Figure 1. N pools in the leaves, branches, bark, and wood of A. peregrina and S. parahyba under different stand densities.
Nitrogen 02 00006 g001
Figure 2. (A) δ15N (‰) in leaves of A. peregrina and S. parahyba under three different stand densities, and (B) Percentage of N2 derived from fixation (%Ndfa) by A. peregrina, under three different stand densities. Vertical bars indicate the standard deviation of the mean (N = 3).
Nitrogen 02 00006 g002
Figure 3. N fixed (kg ha−1) by A. peregrina in three stand densities estimated by the N accretion (black columns) and by 15N natural abundance (grey columns) methods.
Nitrogen 02 00006 g003
Table 1. Mean values (±standard deviation) of N pools (kg ha−1) at 0–20 cm soil depth, and in aboveground and belowground biomass of A. peregrina and S. parahyba at the three stand densities. For a given species, different letters indicate statistical differences between stand density.
SpeciesDensitySoil NAboveground NBelowground NTotal N
(Trees ha−1)---------------------------- (kg ha−1) ----------------------------
6254902.8 ± 1088 a74.7 ± 43.6 b43.9 ± 33.25019.4
A. peregrina11114997.5 ± 1093 a143.1 ± 55.9 a71.7 ± 38.35211.4
16664464.7 ± 1113 a174.7 ± 52.2 a99.7 ± 26.34741.8
6254954.4 ± 1117 a87.5 ± 53.4 b32.1 ± 14.25074.8
S. parahyba11114906.7 ± 1111 a98.9 ± 55.1 b40.9 ± 17.05043.5
16664499.1 ± 1100 a115.8 ± 53.4 a35.5 ± 11.174650.3
Table 2. Effect of stand density (D, trees ha−1), block (B), and interaction (D × B) on the soil N pools (Nsoil, kg ha−1) and the N content of the aboveground biomass (Nbio, kg ha−1) in monospecific stands of A. peregrina and S. parahyba. For a given species and N pool, different letters indicate statistical differences between blocks.Significant differences in the mean values are indicated by different letters.
Species p-ValueMean per Block (n = 9)
DensityBlockD × B123
A. peregrinaNsoil0.5070.010.9635233.3 a5247.5 a3884.3 b
Nbio<0.0001<0.00010.827125.1 b84.3 b183.2 a
S. parahybaNsoil0.347<0.00010.3923479.8 b5298.6 a5582.0 a
Nbio<0.0001<0.0001<0.000156.6 c138.6 a109.5 b
Publisher’s Note: MDPI stays neutral with regard to jurisdictional claims in published maps and institutional affiliations.