Article

Fractional Calculus in Epigenetics: Modelling DNA Methylation Dynamics Using Mittag–Leffler Function

by
Hosein Nasrolahpour
1,2,
Matteo Pellegrini
3 and
Tomas Skovranek
4,*
1
School of Computational Science and Engineering, University of Tehran, Tehran 1417935840, Iran
2
Institute for Physics and Astronomy, Eotvos Lorand University, 1053 Budapest, Hungary
3
Department of Molecular, Cell and Developmental Biology, University of California, Los Angeles, CA 90095, USA
4
Faculty of BERG, Technical University of Kosice, 042 00 Kosice, Slovakia
*
Author to whom correspondence should be addressed.
Fractal Fract. 2025, 9(9), 616; https://doi.org/10.3390/fractalfract9090616
Submission received: 11 August 2025 / Revised: 15 September 2025 / Accepted: 20 September 2025 / Published: 22 September 2025

Abstract

DNA methylation is an epigenetic modification where a methyl group is added to a DNA molecule, typically at the cytosine base within a CpG dinucleotide. This process can influence gene expression without changing the underlying DNA sequence. Essentially, methylation can act like a switch that regulates which genes are active in a cell. DNA methylation (DNAm) models often describe the dynamic changes of methylation levels at specific DNA sites, considering methylation and demethylation processes. A common approach involves representing the methylation state as a continuous variable, and modelling its change over time or in response to various factors using differential equations. These equations can incorporate parameters such as the methylation and demethylation rates, factors like DNA replication, the influence of regulatory proteins, and other related parameters. Understanding DNAm dynamics in relation to age is crucial for elucidating ageing processes and developing biomarkers. This work introduces a theoretical framework for modelling DNAm dynamics using a fractional calculus approach, extending standard models based on the integer-order differential equations. The proposed fractional-calculus representation of the methylation process, defined by the fractional-order differential equation and its solution based on the Mittag–Leffler function, provides improved results compared to the standard model that uses a first-order differential equation, which contains an exponential function in its solution, in terms of the comparison criteria (sum of absolute errors, sum of squared errors, mean absolute percentage error, R-squared, and adjusted R-squared). Moreover, the Mittag–Leffler model provides a more general representation of DNAm dynamics, making the standard exponential model only one specific case.

1. Introduction

Epigenetics describes mechanisms of heritable changes in gene expression that do not involve mutations in the nucleotide sequence, and thus, do not alter the DNA code itself. Instead, they involve chemical modifications to DNA or the proteins that DNA wraps around (histones), thereby regulating gene activity, which affects how much, or if at all, a gene is transcribed into RNA and ultimately translated into a protein. Epigenetic changes are reversible and can be influenced by various factors (see, e.g., [1] and the historical references therein). The physics of epigenetics involves applying principles from mechanics, statistical physics, polymer science, and dynamic systems theory to understand the complex and dynamic nature of epigenetic regulation [2,3]. By integrating these physical models with biological data, researchers aim to unravel the mechanisms behind gene regulation, cellular memory, and development, providing a deeper and more quantitative understanding of how epigenetic modifications control biological processes. Examples of mechanisms that cause epigenetic changes are DNA methylation and histone modifications, each of which modifies how genes are expressed.
DNA methylation (DNAm) refers to the attachment of a methyl group to C-5 of the cytosine base, and because the cytosine-phosphate-guanine sequence (CpG) generally exhibits a higher methylation level than other cytosines, it is also known as CpG methylation. DNAm is an essential epigenetic modification that plays a significant role in regulating gene expression and preserving genomic stability. The CpG sites, which are regions in DNA where a cytosine nucleotide is followed by a guanine nucleotide, are often clustered in areas called CpG islands that are characterised by a high occurrence of CpG dinucleotides compared to the rest of the genome. The methylation level at a particular site is typically expressed as a beta value, derived from methylated and unmethylated signal intensities. The DNA methyltransferases (DNMTs) enzymes catalyse the addition of methyl groups to cytosine, while enzymes like ten-eleven translocation (TET) proteins can reverse the methylation process through demethylation.
As aberrant DNAm patterns have been linked to various diseases, including cancer and neurological disorders, DNAm has been extensively studied, resulting in evidence of age-related hypo- or hyper-methylation at specific CpG sites or islands; thus, many models have been developed to estimate age based on methylation patterns [4,5,6,7,8,9,10]. These findings have laid the groundwork for the development of epigenetic biomarkers of ageing, also known as epigenetic clocks. An epigenetic clock as a tool that measures the rate of ageing in cells and tissues by examining DNAm patterns, enabling the assessment of biological age (also called the epigenetic age or DNAm age), which may differ from chronological age, and can be used to predict lifespan and identify individuals with accelerated ageing.
The “first generation’’ of epigenetic clocks for predicting chronological age based on DNAm patterns is mainly represented by Horvath’s DNAmAge [11] and Hannum’s clock [12], both developed in 2013. Horvath’s clock, based on DNAm at 353 specific CpG sites, is a multi-tissue clock, meaning it can be used across various tissues. On the other hand, Hannum’s clock is based on DNA methylation patterns at 71 CpG sites in white blood cells, making it specific to blood. The “second generation” of epigenetic clocks, such as the DNAm PhenoAge [13] and DNAm GrimAge [14], are recognised for using not only epigenetic markers like DNA methylation but also functional stages (e.g., smoking) alongside chronological age for estimation. Levine’s PhenoAge focuses on clinical biomarkers associated with age-related diseases and mortality, while the GrimAge clock represents a linear combination of DNAm-based surrogate biomarkers for health-related plasma proteins, smoking pack-years, sex, and chronological age, making it superior to any other epigenetic clock in “predicting death’’.
As an alternative to DNAm-based clocks, epigenetic clocks that rely on changes in histone marks have been proposed [15]. The telomeres, nucleoprotein structures located at the ends of chromosomes, should also be noted, as telomeres shorten each time cells divide, making the telomere length a popular biomarker of ageing [16,17,18,19]. On the other hand, it should be noted that DNAm-based epigenetic clocks demonstrate significantly higher precision than telomere length measures in estimating both chronological and biological age. Methylation clocks, such as Horvath’s pan-tissue clock [11], typically achieve strong correlations with actual age ( r 0.8 ) and mean absolute errors of only a few years, making them among the most accurate molecular age markers. In contrast, leukocyte telomere length (LTL) shows only modest correlations with age (e.g., r 0.3 in [20]) and is subject to technical variability and confounding factors such as DNA extraction methods. Furthermore, for example, the DNAm-based estimators of telomere length (DNAmTL) outperformed measured LTL in predicting age-related outcomes like mortality and heart disease, with substantially stronger associations ( r 0.75 for DNAmTL vs. r 0.35 for LTL in [21]). Collectively, these findings underscore that methylation-based epigenetic clocks provide superior accuracy and biological relevance compared to conventional telomere-length biomarkers.
Fractional calculus, a generalisation of classical calculus, involves derivatives and integrals of noninteger order, making this mathematical tool particularly suitable for modelling processes with anomalous and complex behaviour, including memory effects and hereditary properties (see, e.g., [22,23,24,25,26,27,28,29,30]). The mathematical framework of fractional calculus, with its noninteger order derivatives, is particularly well-suited to describe complex behaviours and interactions in biological systems that often operate out of equilibrium, such as DNA methylation, especially during ageing or disease progression. Traditional models assume a steady-state condition, which is rarely reflective of real biological contexts. In contrast, fractional calculus, capable of modelling systems perpetually out of equilibrium, can offer a more realistic and dynamic understanding of methylation evolution over time. The Mittag–Leffler (ML) function [31,32] arises naturally in the solution of ordinary and partial fractional-order integro-differential equations, but also in random walks, Lévy flights, “fractal calculus”, the study of complex systems, and in other fields. The properties of the ML function and its generalisations, as well as the application of models based on the ML-type functions, have been examined by many authors, e.g., [27,33,34,35,36,37]. Furthermore, one can find several computational methods for numerical evaluation of the ML function e.g., [38,39].
The rapid progress in DNAm research highlights the need to use sophisticated approaches for modelling DNAm processes (epigenetic clocks) as complex and heterogeneous systems, as more precise models could improve the interpretation of commonly used age-related biomarkers, helping to identify individuals with accelerated ageing, and enabling interventions and therapies aimed at slowing the ageing process and enhancing health. Horvath’s clock [11] applies a logarithmic transformation to ages from birth to 20 years and assumes linear age-related methylation changes in adults. In [40], the authors used an epigenetic pacemaker framework to develop a model for epigenetic ageing, stating that a logarithmic trend rather than a linear model more accurately describes epigenetic ageing trajectories. In [41], a pseudotime analysis was used to determine the functional form of age-associated methylation trajectories in human blood and brain tissue, resulting in a methylation trajectory that follows an exponential pattern.
Motivated by the fact that mathematical models based on the ML function and its generalisations interpolate between a purely exponential law and a power-law-like behaviour, thus enabling better capture of the dynamics of the studied systems, this work presents a novel fractional calculus approach to modelling DNAm dynamics is presented, extending the standard model, which is based on an integer-order differential equation with a solution involving an exponential function. The proposed fractional-calculus representation of the methylation process, described by a fractional-order differential equation and a solution based on the ML function, not only achieves improved results in terms of selected comparison criteria (sum of absolute errors, sum of squared errors, mean absolute percentage error, R-squared, and adjusted R-squared) compared to the standard model, but also offers a more general form, where the standard exponential model is only one specific case.

2. Modelling Methylation Dynamics—DNAm vs. Chronological Age

DNAm is a fundamental epigenetic mechanism involved in the regulation of gene expression and various biological processes, including development, genomic imprinting, and ageing. Linear mathematical models of DNAm often involve ordinary differential Equations (ODEs) to describe the dynamics of methylation and demethylation at specific CpG sites. Tracking the changes at the CpG sites over time, which include their states (e.g., unmethylated, hemimethylated, or fully methylated), generally involves factors such as DNA replication and the actions of enzymes like DNA methyltransferases (DNMTs) and ten-eleven translocation (TET) enzymes. For instance, McGovern et al. [42] proposed a system of six ODEs, considering six different states of a CpG dyad, while a simplified version of the McGovern model, using three ODEs, was introduced in [43]. Recently, a system of differential equations of fractional order, describing the dynamics of DNAm, was presented in [44].
Motivated by this research direction, in this study, a standard model of DNAm dynamics described by a first-order ODE, whose solution contains an exponential function, is compared to the newly proposed model based on a fractional-order differential equation, with a solution containing the Mittag–Leffler function.

2.1. Standard Exponential Model of DNAm Dynamics

In a recent study [45], the authors explored the relationship between DNA methylation and chronological age, finding that DNAm levels at specific sites do not change linearly with age, but rather converge to a steady-state level exponentially. This indicates that DNAm dynamics, as a system, begins out of equilibrium (at x 0 ) and approaches equilibrium (at x ) exponentially with age, and can, therefore, be described by a first-order differential equation [45]:
d x d t = α ( 1 x ( t ) ) β x ( t ) = α ( α + β ) x ( t ) ,
where x ( t ) represents the fraction of methylated cells at time t, α is the methylation rate, and β is the demethylation rate. This model leads to an exponential approach to equilibrium:
x ( t ) = α α + β α α + β x 0 e ( α + β ) t ,
but due to the complex nature of the methylation dynamics observed empirically in [45], this model can capture the general trend only approximately.

2.2. Fractional Calculus Approach to DNAm Dynamics Modelling

To incorporate the complexity of the studied phenomena, the model (1) was extended by introducing Caputo fractional derivative of order μ of a function x ( t ) defined as [25,27]:
D t μ 0 C x ( t ) = 1 Γ ( n μ ) 0 t x ( n ) ( τ ) ( t τ ) μ + 1 n d τ ,
where n 1 < μ < n , n is the smallest integer greater than μ and Γ denotes the Gamma function defined as:
Γ ( z ) = 0 t z 1 e t d t ,
with the condition Re ( z ) > 0 . Thus, the model given in (1) is transformed into a fractional-order differential equation in the following form [46]:
D t μ 0 C x ( t ) = α ( 1 x ( t ) ) β x ( t ) , 0 < μ < 2 ,
where the fractional order μ represents a parameter to capture the memory effect and heterogeneity in methylation dynamics.
To solve the fractional differential equation given in (5), the Laplace transform was used. The Laplace transform of the Caputo fractional derivative D t μ 0 C x ( t ) is given by:
L D t μ 0 C x ( t ) = s μ x ˜ ( s ) s μ 1 x ( 0 ) ,
where x ˜ ( s ) is the Laplace transform of x ( t ) . Applying the Laplace transform to both sides of the differential Equation (5), one obtains:
x ˜ ( s ) = α s + s μ 1 x ( 0 ) s μ + α + β .
Therefore, the solution to the fractional differential Equation (5) can be represented by taking the inverse Laplace transform of Equation (7):
x ( t ) = x 0 t μ 1 E μ ( α + β ) t μ + α α + β 1 E μ ( α + β ) t μ ,
with E μ being the one-parameter Mittag–Leffler function [31,32], a generalisation of the exponential function, which can be defined as:
E μ ( z ) = n = 0 z n Γ ( μ n + 1 ) , ( Re ( μ ) > 0 , z C ) .
From (9), it follows that, in the simple case where μ = 1 , the Mittag–Leffler function reduces to the usual exponential function (see Appendix A for more information on the Mittag–Leffler function).

3. Experiments and Discussion on the Results

3.1. DNAm Dataset

Analysing a DNAm dataset obtained from a public functional genomics data repository “Gene Expression Omnibus” [47], collected from the prefrontal cortex of individuals ranging in age from neonates to centenarians, a set of 335 nonpsychiatric controls and 191 patients with schizophrenia across their lifespan was used. The data were collected using the Illumina DNA methylation microarray, which measures over 485,502 CpG sites across the genome. The reliability of Illumina DNA methylation microarrays is generally high at the sample level, providing robust measures for global and regional methylation analyses. However, probe-specific variability can affect accuracy, as performance depends on sequence context, cross-reactivity, and detection limits at very low or high methylation levels. Additionally, technical factors such as DNA quality, bisulphite conversion efficiency, and batch effects may introduce noise that impacts modelling results. These considerations emphasise the importance of proper normalisation, probe filtering, and statistical modelling strategies in interpreting the findings of this study. The analysis was focused on the 10,000 most highly age-correlated sites, as these exhibit the most significant changes with age. By observing various patterns across these sites, with some increasing and others decreasing over time, it can be concluded that, for the majority of sites, the link between methylation and age is nonlinear.

3.2. Comparison Metrics for Modelling Performance Evaluation

Five goodness-of-fit comparison criteria were used to evaluate the accuracy of the two compared models to describe the DNA methylation dynamics:
  • Sum of Absolute Errors (SAE) quantifies the total difference between predicted and actual values by summing the absolute value of the discrepancies, serving as a measure of the overall deviation in a dataset.
  • Sum of Squared Errors (SSE) measures the unexplained variance in the dependent variable that the model does not account for, with the primary aim to minimise the SSE value, resulting in a model that better fits the data.
  • Mean Absolute Percentage Error (MAPE) measures the average percentage difference between predicted and actual values, indicating forecast accuracy by averaging the absolute percentage errors across a set of data points, with a lower value signifying a more accurate model.
  • R-squared ( R 2 ) as a coefficient of determination from the interval [ 0 ,   1 ] , indicates the proportion of the variance in the dependent variable that can be predicted using the independent variable (one or more), with values closer to one signifying a better fit.
  • Adjusted R-squared ( R adj 2 ) accounts for the number of prediction parameters and sample size, penalising the addition of irrelevant independent variables and preventing model overfitting, being a superior criterion for comparing models with different numbers of parameters, providing a more realistic measure of their performance.
Unlike R 2 , which always increases or remains the same when more prediction parameters are added, R adj 2 can decrease if a new independent variable does not significantly improve the model’s explanatory power. This makes it a more reliable metric for comparing models with different numbers of prediction parameters.

3.3. Mathematical Models of DNAm Dynamics

For simplicity, the models (2) and (8) were reparameterised by combining the methylation and demethylation rates, using the relations:
x = α α + β , λ = α + β .
Substituting (10) in the standard exponential model (2) solution to model (1), one obtains the model in the form:
x ( t ) = x x x 0 e λ t .
Likewise, when substituting (10) into the model given in (8), the solution to model (5), which is based on the Mittag–Leffler function, one gets:
x ( t ) = x 0 t μ 1 E μ λ t μ + x 1 E μ λ t μ ,
with the additional parameter μ , which “tunes” the Mittag–Leffler function, in order to capture the memory effects and heterogeneity of the DNA methylation dynamics.

3.4. Experimental Results

The models given in (11) and (12) were used to describe the data composed of the DNAm levels x i from four sites of the prefrontal cortex of the examined individuals of different age t i , where i = 1 526 , including several individuals of each age, with a range of values of the methylation state, to describe the average population behaviour. In Figure 1A–D, the methylation levels as a function of age are displayed, representing four out of the 450K CpG sites that were measured in the analysed dataset. These four sites were selected as they exhibit a strong correlation between DNAm and age in this cohort. Two of the CpG sites (A, B) were selected as they exhibit an increasing correlation of methylated CpGs with age, while the other two sites (C, D) exhibit a decreasing correlation; note that all four sites demonstrate a strong nonlinear relationship between DNAm and age.
Evaluating the results visually (see Figure 1), the ability of the proposed Mittag–Leffler model to better fit the data, especially for the individuals in the age interval of approximately 0–20 years, is evident. This aligns with the fact that DNAm patterns exhibit nonlinear dependence until adulthood, when they “slow” to a linear dependence.
The modelling performance results, evaluated using the selected comparison criteria for both models, are shown in Table 1. In cases A, B, and D, the proposed Mittag–Leffler model provided better results across all criteria, namely SAE, SSE, MAPE, R 2 , and R adj 2 , in comparison to the standard exponential model. It is worth noting that, although the complexity of the proposed Mittag–Leffler model (with one additional parameter) is greater than that of the exponential model, it achieves superior R adj 2 results at the three selected CpG sites, thereby justifying its use and demonstrating its reliability. The only exception can be seen in case C, where both models yield the same comparison criteria results, apart from R adj 2 , which favours the exponential model due to its smaller complexity (one less parameter).
Although the Mittag–Leffler model achieved a smaller R adj 2 result at the CpG site C compared to the exponential model, a crucial observation emerges: the Mittag–Leffler model’s parameter μ equals 1, and the other two identified parameters, λ and x , are nearly identical for both compared models (with a minimal difference in λ due to the identification procedure); consequently, the Mittag–Leffler function becomes a standard exponential function, and the Mittag–Leffler model (12) reduces to the standard exponential model (11). Thus, it can be concluded that the proposed Mittag–Leffler model, as the solution to the fractional-order differential Equation (8), represents a generalisation of the mathematical description of the methylation process, whereas the standard exponential model, as the solution of a first-order ODE (1), represents only one special case.
The main advantage of using the proposed Mittag–Leffler model to describe DNAm dynamics is its ability to naturally interpolate between nonlinear and linear states by incorporating intrinsic memory kernels, enabling it to exhibit slower decay or faster growth compared to the exponential model, thereby providing a better fit for the empirically observed slow convergence to equilibrium and the heterogeneity across different sites. These findings can have future implications for understanding ageing and potentially for developing biomarkers for ageing.

4. Conclusions

The DNAm is a tightly regulated epigenetic mechanism fundamental for proper gene expression, cellular differentiation, and the maintenance of genome stability. Aberrant methylation is generally rare and context-specific, with stochastic changes arising primarily during ageing rather than as random, widespread events. These characteristics underscore the biological significance of the methylation alterations observed in this study, suggesting that they likely reflect meaningful age-related processes rather than background noise. This study investigates various analytical forms to characterise the dynamics of the DNAm process with age, proposing an approach based on fractional calculus, employing the Caputo fractional derivative and the Mittag–Leffler function. The findings demonstrate that fractional calculus offers a more precise description of age-related changes in DNAm than standard models based on integer-order differential equations.
The modelling performance results evaluated using the selected comparison criteria (SAE, SSE, MAPE, R 2 , and R adj 2 ) prove that the proposed fractional-order model, which incorporates the Mittag–Leffler function in its solution, provides a more accurate data representation by capturing the dynamics of DNAm rate changes with age at individual CpG sites, compared to the traditional model in the form of a first-order differential equation, whose solution involves an exponential function. The ability of the fractional calculus approach to account for nonlinear and memory-dependent behaviour aligns well with the biological complexity of methylation processes, which often involve gradual and cumulative changes over time. This enhanced modelling capability is particularly evident in the improved fit to experimental data and the ability to describe the age-dependent methylation patterns more effectively. These findings suggest that the fractional calculus framework could offer valuable insights into age-related epigenetic modifications, potentially advancing the understanding of the underlying mechanisms of ageing and its implications for health and disease. Developing more precise analytical models of DNAm changes with age allows the identification of CpGs that change reproducibly with age, which can potentially serve as biomarkers of ageing in future research.

Author Contributions

Conceptualisation, H.N. and M.P.; methodology, H.N. and T.S.; software, T.S.; validation, T.S.; formal analysis, H.N. and M.P.; investigation, H.N. and T.S.; resources, H.N., M.P. and T.S.; data curation, M.P.; writing—original draft preparation, H.N., M.P., and T.S.; writing—review and editing, T.S. and H.N.; visualisation, T.S.; supervision, M.P.; project administration, H.N.; funding acquisition, T.S. All authors have read and agreed to the published version of the manuscript.

Funding

This work was supported in part by the Slovak Research and Development Agency under the Contract no. APVV-22-0508 and no. APVV-18-0526, by the Slovak Grant Agency for Science under grant no. VEGA 1/0674/23, and the Cultural and Educational Grant Agency of the Ministry of Education, Research, Development and Youth of the Slovak Republic under grant no. KEGA 006TUKE-4/2024.

Data Availability Statement

The data used in the frame of this work are publicly available [47], and were obtained from a public functional genomics data repository “Gene Expression Omnibus” https://www.ncbi.nlm.nih.gov/geo/query/acc.cgi?acc=GSE74193 (accessed on 6 September 2024).

Acknowledgments

We would like to thank Grant Dufek for sharing the required data of the exponential model, which served for comparison purposes.

Conflicts of Interest

The authors declare no conflicts of interest. The funders had no role in the design of the study; in the collection, analyses, or interpretation of data; in the writing of the manuscript; or in the decision to publish the results.

Appendix A. Mittag–Leffler Function

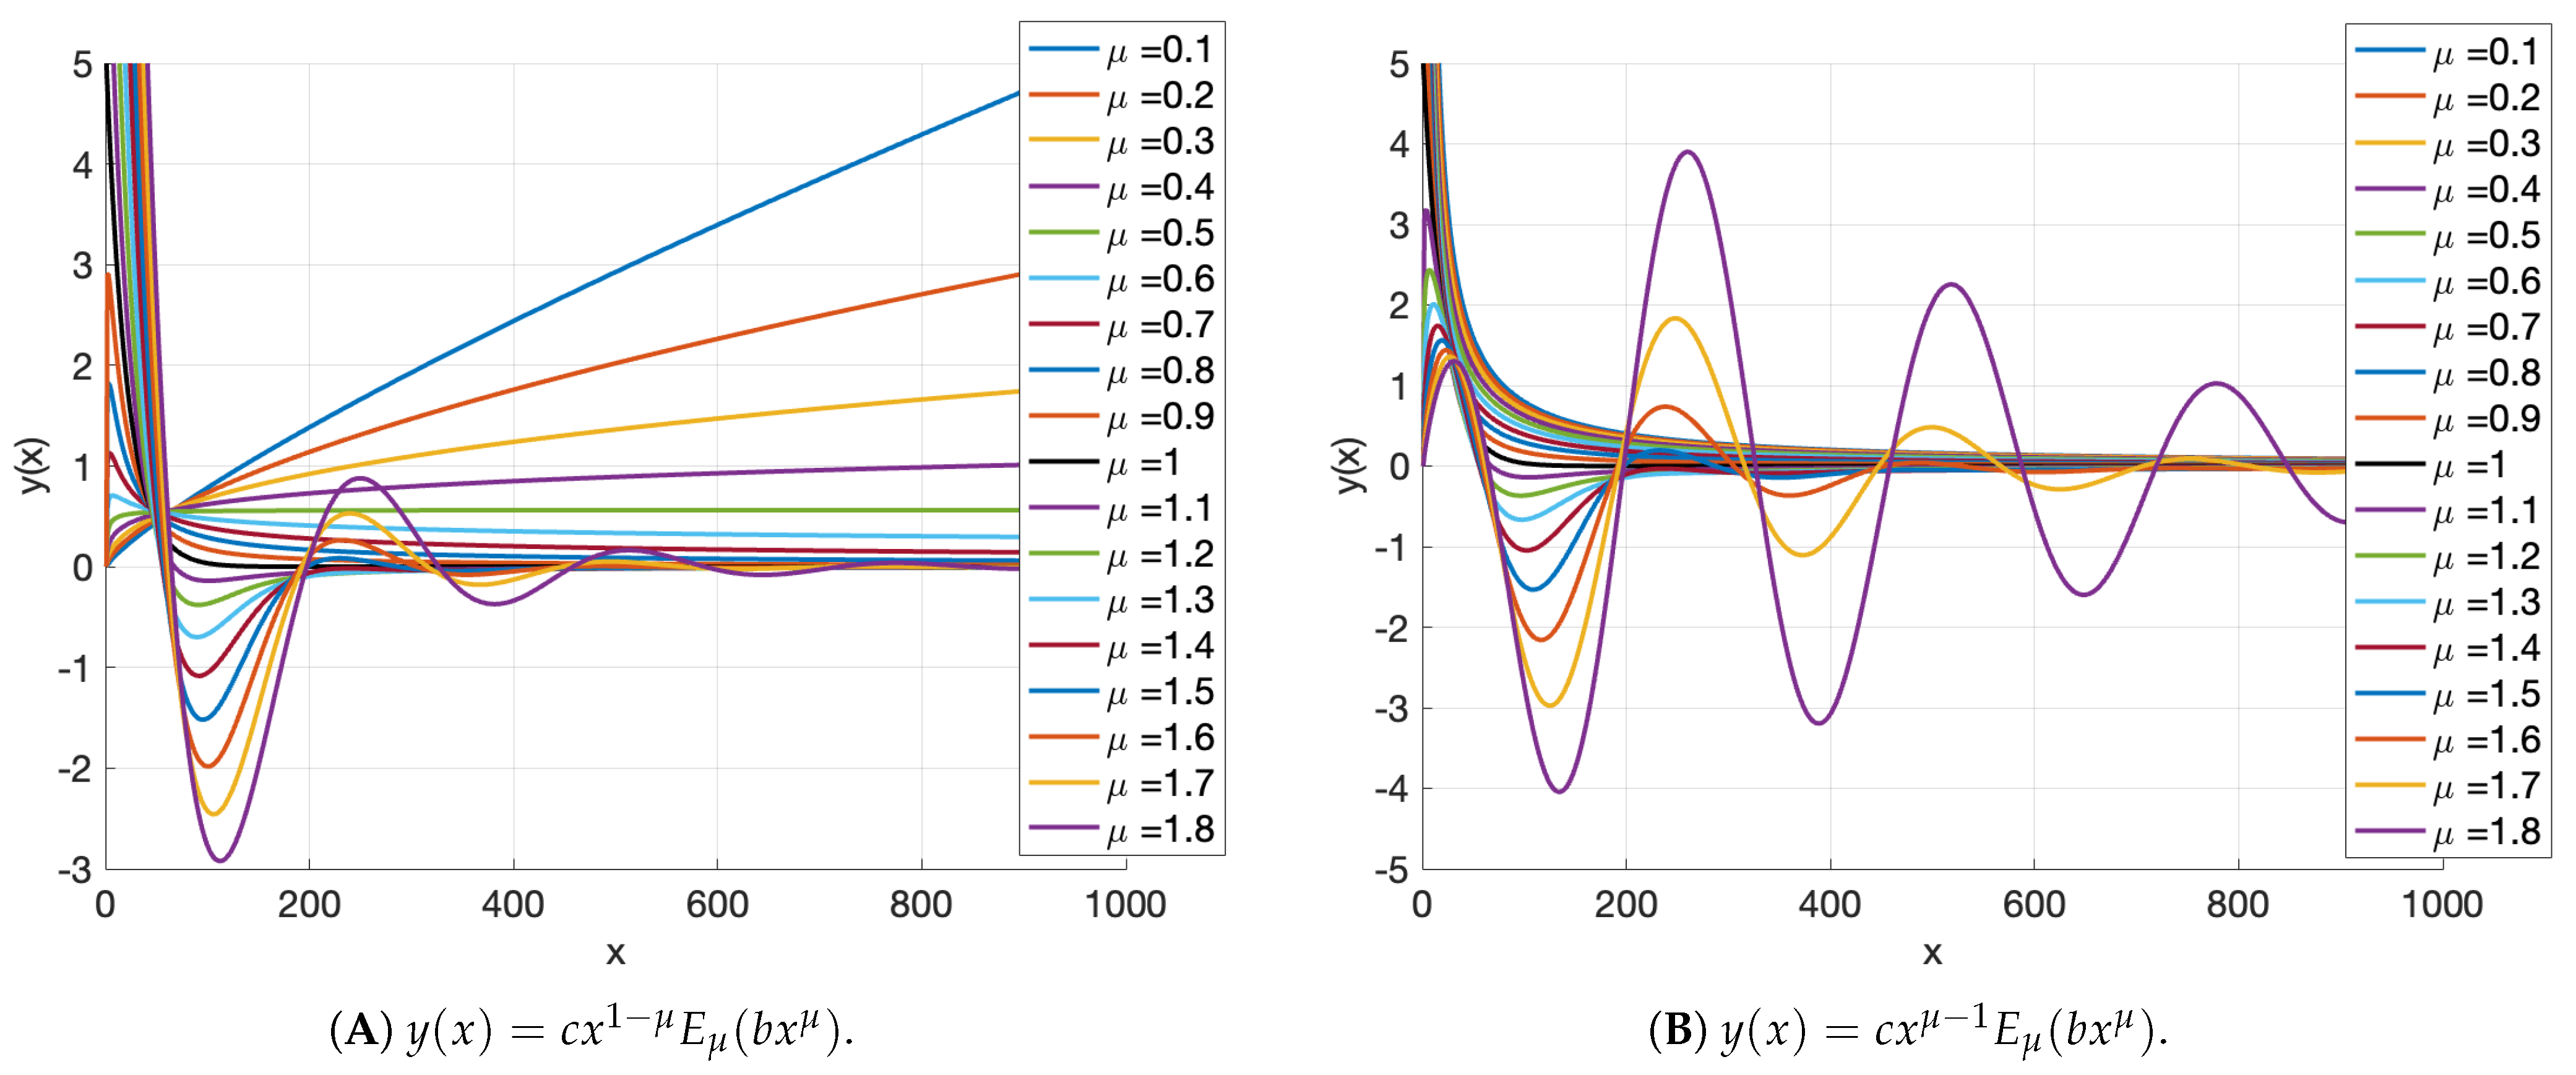
For better projection of the possible manifestations of the Mittag–Leffler function based models, some of the trajectories dependent on the parameter μ are shown in Figure A1A for the function y ( x ) = c x 1 μ E μ b x μ , and in Figure A1B for the function y ( x ) = c x μ 1 E μ b x μ , with c = 5 and b = 5 for both models.
Figure A1. The behaviour of two distinct analytic models y ( x ) , containing the Mittag–Leffler function.
Fractalfract 09 00616 g0a1
Some special cases of the Mittag–Leffler function are as follows [27,37]:
E 1 / 2 ( t ) = exp t 2 erfc ( t ) , E 1 ( t ) = exp ( t ) , E 2 ( t ) = cosh ( t ) , E 2 t 2 = cos ( t ) , E 3 ± t 3 = 1 3 e ± t + 2 e t / 2 cos 3 2 t ,
where erfc is the complementary error function, which has the following relation with the error function erf:
erfc ( t ) = 1 erf ( t ) = 1 2 π 0 t e τ 2 d τ = 2 π t e τ 2 d τ .
Furthermore, there is the following duplication formula for the one-parameter Mittag–Leffler function:
2 E 2 μ t 2 = E μ ( t ) + E μ ( t ) .
In addition:
E μ t μ = n = 0 ( 1 ) n t μ n Γ ( μ n + 1 ) , ( t > 0 , 0 < μ 1 ) ,
which provides the solution to the fractional relaxation equation. There are also the two commonly stated asymptotic representations for it as follows [37]:
E μ t μ = 1 t μ Γ ( 1 + μ ) + exp t μ Γ ( 1 + μ ) , t 0 , n = 1 ( 1 ) n 1 t μ n Γ ( 1 μ n ) , t , for n = 1 , t μ Γ ( 1 μ ) = sin ( μ π ) π Γ ( μ ) t μ , t .

References

  1. Moore, L.D.; Le, T.; Fan, G. DNA Methylation and Its Basic Function. Neuropsychopharmacology 2013, 38, 23–38. [Google Scholar] [CrossRef] [PubMed]
  2. Cortini, R.; Barbi, M.; Caré, B.R.; Lavelle, C.; Lesne, A.; Mozziconacci, J.; Victor, J.M. The physics of epigenetics. Rev. Mod. Phys. 2016, 88, 025002. [Google Scholar] [CrossRef]
  3. Guillemin, A.; Stumpf, M.P.H. Non-equilibrium statistical physics, transitory epigenetic landscapes, and cell fate decision dynamics. Math. Biosci. Eng. 2020, 17, 7916–7930. [Google Scholar] [CrossRef]
  4. Bocklandt, S.; Lin, W.; Sehl, M.E.; Sánchez, F.J.; Sinsheimer, J.S.; Horvath, S.; Vilain, E. Epigenetic predictor of age. PLoS ONE 2011, 6, e14821. [Google Scholar] [CrossRef] [PubMed] [PubMed Central]
  5. Chen, B.H.; Marioni, R.E.; Colicino, E.; Peters, M.J.; Ward-Caviness, C.K.; Tsai, P.C.; Roetker, N.S.; Just, A.C.; Demerath, E.W.; Guan, W.; et al. DNA methylation-based measures of biological age: Meta-analysis predicting time to death. Aging 2016, 8, 1844–1865. [Google Scholar] [CrossRef] [PubMed]
  6. Jylhävä, J.; Pedersen, N.L.; Hägg, S. Biological age predictors. EBioMedicine 2017, 21, 29–36. [Google Scholar] [CrossRef]
  7. Roetker, N.S.; Pankow, J.S.; Bressler, J.; Morrison, A.C.; Boerwinkle, E. Prospective Study of Epigenetic Age Acceleration and Incidence of Cardiovascular Disease Outcomes in the ARIC Study (Atherosclerosis Risk in Communities). Circ.-Genom. Precis. Med. 2018, 11, e001937. [Google Scholar] [CrossRef]
  8. Field, A.E.; Robertson, N.A.; Wang, T.; Havas, A.; Ideker, T.; Adams, P.D. DNA Methylation Clocks in Aging: Categories, Causes, and Consequences. Mol. Cell 2018, 71, 882–895. [Google Scholar] [CrossRef]
  9. Ryan, J.; Wrigglesworth, J.; Loong, J.; Fransquet, P.D.; Woods, R.L. A systematic review and meta-analysis of environmental, lifestyle, and health factors associated with DNA methylation age. J. Gerontol. Ser. A 2019, 75, 481–494. [Google Scholar] [CrossRef]
  10. Gems, D.; de Magalha, P.J. The hoverfly and the wasp: A critique of the hallmarks of aging as a paradigm. Ageing Res. Rev. 2021, 70. [Google Scholar] [CrossRef]
  11. Horvath, S. DNA methylation age of human tissues and cell types. Genome Biol. 2013, 14, R115. [Google Scholar] [CrossRef]
  12. Hannum, G.; Guinney, J.; Zhao, L.; Zhang, L.; Hughes, G.; Sadda, S.; Klotzle, B.; Bibikova, M.; Fan, J.B.; Gao, Y.; et al. Genome-wide methylation profiles reveal quantitative views of human aging rates. Mol. Cell 2013, 49, 359–367. [Google Scholar] [CrossRef]
  13. Levine, M.E.; Lu, A.T.; Quach, A.; Chen, B.H.; Assimes, T.L.; Bandinelli, S.; Hou, L.; Baccarelli, A.A.; Stewart, J.D.; Li, Y.; et al. An epigenetic biomarker of aging for lifespan and healthspan. Aging 2018, 10, 573–591. [Google Scholar] [CrossRef] [PubMed]
  14. Lu, A.T.; Quach, A.; Wilson, J.G.; Reiner, A.P.; Aviv, A.; Raj, K.; Hou, L.; Baccarelli, A.A.; Li, Y.; Stewart, J.D.; et al. DNA methylation GrimAge strongly predicts lifespan and healthspan. Aging 2019, 11, 303–327. [Google Scholar] [CrossRef]
  15. de Lima Camillo, L.P.; Asif, M.H.; Horvath, S.; Larschan, E.; Singh, R. Histone mark age of human tissues and cell types. Sci. Adv. 2025, 11, eadk9373. [Google Scholar] [CrossRef]
  16. Chang, E.; Harley, C. Telomere Length Furthermore, Replicative Aging In Human Vascular Tissues. Proc. Natl. Acad. Sci. USA 1995, 92, 11190–11194. [Google Scholar] [CrossRef]
  17. von Zglinicki, T.; Serra, V.; Lorenz, M.; Saretzki, G.; Lenzen-Grossimlighaus, R.; Gessner, R.; Risch, A.; Steinhagen-Thiessen, E. Short telomeres in patients with vascular dementia: An indicator of low antioxidative capacity and a possible risk factor? Lab. Investig. 2000, 80, 1739–1747. [Google Scholar] [CrossRef]
  18. von Zglinicki, T.; Martin-Ruiz, C. Telomeres as biomarkers for ageing and age-related diseases. Curr. Mol. Med. 2005, 5, 197–203. [Google Scholar] [CrossRef]
  19. Blackburn, E.H.; Greider, C.W.; Szostak, J.W. Telomeres and telomerase: The path from maize, Tetrahymena and yeast to human cancer and aging. Nat. Med. 2006, 12, 1133–1138. [Google Scholar] [CrossRef] [PubMed]
  20. Nordfjall, K.; Svenson, U.; Norrback, K.F.; Adolfsson, R.; Roos, G. Large-scale parent-child comparison confirms a strong paternal influence on telomere length. Eur. J. Hum. Genet. 2010, 18, 385–389. [Google Scholar] [CrossRef] [PubMed]
  21. Lu, A.T.; Seeboth, A.; Tsai, P.C.; Sun, D.; Quach, A.; Reiner, A.P.; Kooperberg, C.; Ferrucci, L.; Hou, L.; Baccarelli, A.A.; et al. DNA methylation-based estimator of telomere length. AGING-US 2019, 11, 5895–5923. [Google Scholar] [CrossRef]
  22. Oldham, K.B.; Spanier, J. The Fractional Calculus: Theory and Applications of Differentiation and Integration to Arbitrary Order; Academic Press: New York, NY, USA; London, UK, 1974. [Google Scholar]
  23. Miller, K.S.; Ross, B. An Introduction to the Fractional Calculus and Fractional Differential Equations; John Wiley and Sons Inc.: New York, NY, USA, 1993. [Google Scholar]
  24. Samko, S.G.; Kilbas, A.A.; Marichev, O.I. Fractional Integrals and Derivatives: Theory and Applications; Gordon and Breach Science Publishers: Yverdon, Switzerland; Philadelphia, PA, USA, 1993. [Google Scholar]
  25. Podlubny, I. Fractional Differential Equations. An Introduction to Fractional Derivatives, Fractional Differential Equations, Some Methods of Their Solution and Some of Their Applications; Academic Press: San Diego, CA, USA, 1999. [Google Scholar]
  26. Magin, R.L. Fractional Calculus in Bioengineering: Second Edition; Begell House Publishers: Redding, CT, USA, 2006. [Google Scholar]
  27. Mainardi, F. Fractional Calculus and Waves in Linear Viscoelasticity: An Introduction to Mathematical Models; Imperial College Press: London, UK, 2010. [Google Scholar] [CrossRef]
  28. Tarasov, V.E. Fractional Dynamics: Applications of Fractional Calculus to Dynamics of Particles, Fields and Media; Springer Science & Business Media: Berlin/Heidelberg, Germany, 2011. [Google Scholar]
  29. Magin, R.; Ortigueira, M.D.; Podlubny, I.; Trujillo, J. On the fractional signals and systems. Signal Process. 2011, 91, 350–371. [Google Scholar] [CrossRef]
  30. West, B.J. Fractional Calculus View of Complexity: Tomorrow’s Science; CRC Press, Taylor & Francis Group: Boca Raton, FL, USA, 2016. [Google Scholar]
  31. Mittag–Leffler, M.G. Sur la Nouvelle Fonction (x). Comptes Rendus L’Académie Sci. 1903, 137, 554–558. [Google Scholar]
  32. Mittag–Leffler, M.G. Une generalisation de l’integrale de Laplace-Abel. Comptes Rendus L’Académie Sci. 1903, 137, 537–539. [Google Scholar]
  33. Mainardi, F.; Gorenflo, R. On Mittag–Leffler-type functions in fractional evolution processes. J. Comput. Appl. Math. 2000, 118, 283–299. [Google Scholar] [CrossRef]
  34. Kilbas, A.; Saigo, M.; Saxena, R. Generalized Mittag–Leffler function and generalized fractional calculus operators. Integral Transform. Spec. Funct. 2004, 15, 31–49. [Google Scholar] [CrossRef]
  35. Haubold, H.J.; Mathai, A.M.; Saxena, R.K. Mittag–Leffler functions and their applications. J. Appl. Math. 2011, 2011, 51. 298628. [Google Scholar] [CrossRef]
  36. Gorenflo, R.; Kilbas, A.A.; Mainardi, F.; Rogosin, S.V. Mittag–Leffler Functions, Related Topics and Applications; Springer Monographs in Mathematics; Springer: Berlin/Heidelberg, Germany, 2014. [Google Scholar] [CrossRef]
  37. Mainardi, F. On some properties of the Mittag–Leffler function Eα(-tα), completely monotone for t>0 with 0<α<1. Discret. Contin. Dyn. Syst.—Ser. B 2014, 19, 2267–2278. [Google Scholar] [CrossRef]
  38. Podlubny, I. Mittag–Leffler Function. MathWorks, Inc. MATLAB Central File Exchange, 2005. Available online: http://www.mathworks.com/matlabcentral/fileexchange/8738 (accessed on 1 July 2025).
  39. Garrappa, R. The Mittag–Leffler Function. MathWorks, Inc. MATLAB Central File Exchange, 2015. Available online: http://www.mathworks.com/matlabcentral/fileexchange/48154 (accessed on 1 July 2025).
  40. Snir, S.; Farrell, C.; Pellegrini, M. Human epigenetic ageing is logarithmic with time across the entire lifespan. Epigenetics 2019, 14, 912–926. [Google Scholar] [CrossRef] [PubMed] [PubMed Central]
  41. Lapborisuth, K.; Farrell, C.; Pellegrini, M. Pseudotime analysis reveals exponential trends in DNA methylation aging with mortality associated timescales. Cells 2022, 11, 767. [Google Scholar] [CrossRef]
  42. McGovern, A.P.; Powell, B.E.; Chevassut, T.J. A dynamic multi-compartmental model of DNA methylation with demonstrable predictive value in hematological malignancies. J. Theor. Biol. 2012, 310, 14–20. [Google Scholar] [CrossRef] [PubMed]
  43. Zagkos, L.; Mc Auley, M.; Roberts, J.; Kavallaris, N.I. Mathematical models of DNA methylation dynamics: Implications for health and ageing. J. Theor. Biol. 2019, 462, 184–193. [Google Scholar] [CrossRef]
  44. Nasrolahpour, H. Fractional Dynamics of DNA Methylation. ResearchGate 2024. [Google Scholar] [CrossRef]
  45. Dufek, G.; Katriel, G.; Snir, S.; Pellegrini, M. Exponential dynamics of DNA methylation with age. J. Theor. Biol. 2024, 279. [Google Scholar] [CrossRef]
  46. Nasrolahpour, H.; Pellegrini, M.; Skovranek, T. Fractional Calculus in Epigenetics. bioRxiv 2024. [Google Scholar] [CrossRef]
  47. Jaffe, A.E.; Gao, Y.; Deep-Soboslay, A.; Tao, R.; Hyde, T.M.; Weinberger, D.R.; Kleinman, J.E. Mapping DNA methylation across development, genotype and schizophrenia in the human frontal cortex. Nat. Neurosci. 2016, 19, 40–50. [Google Scholar] [CrossRef] [PubMed]
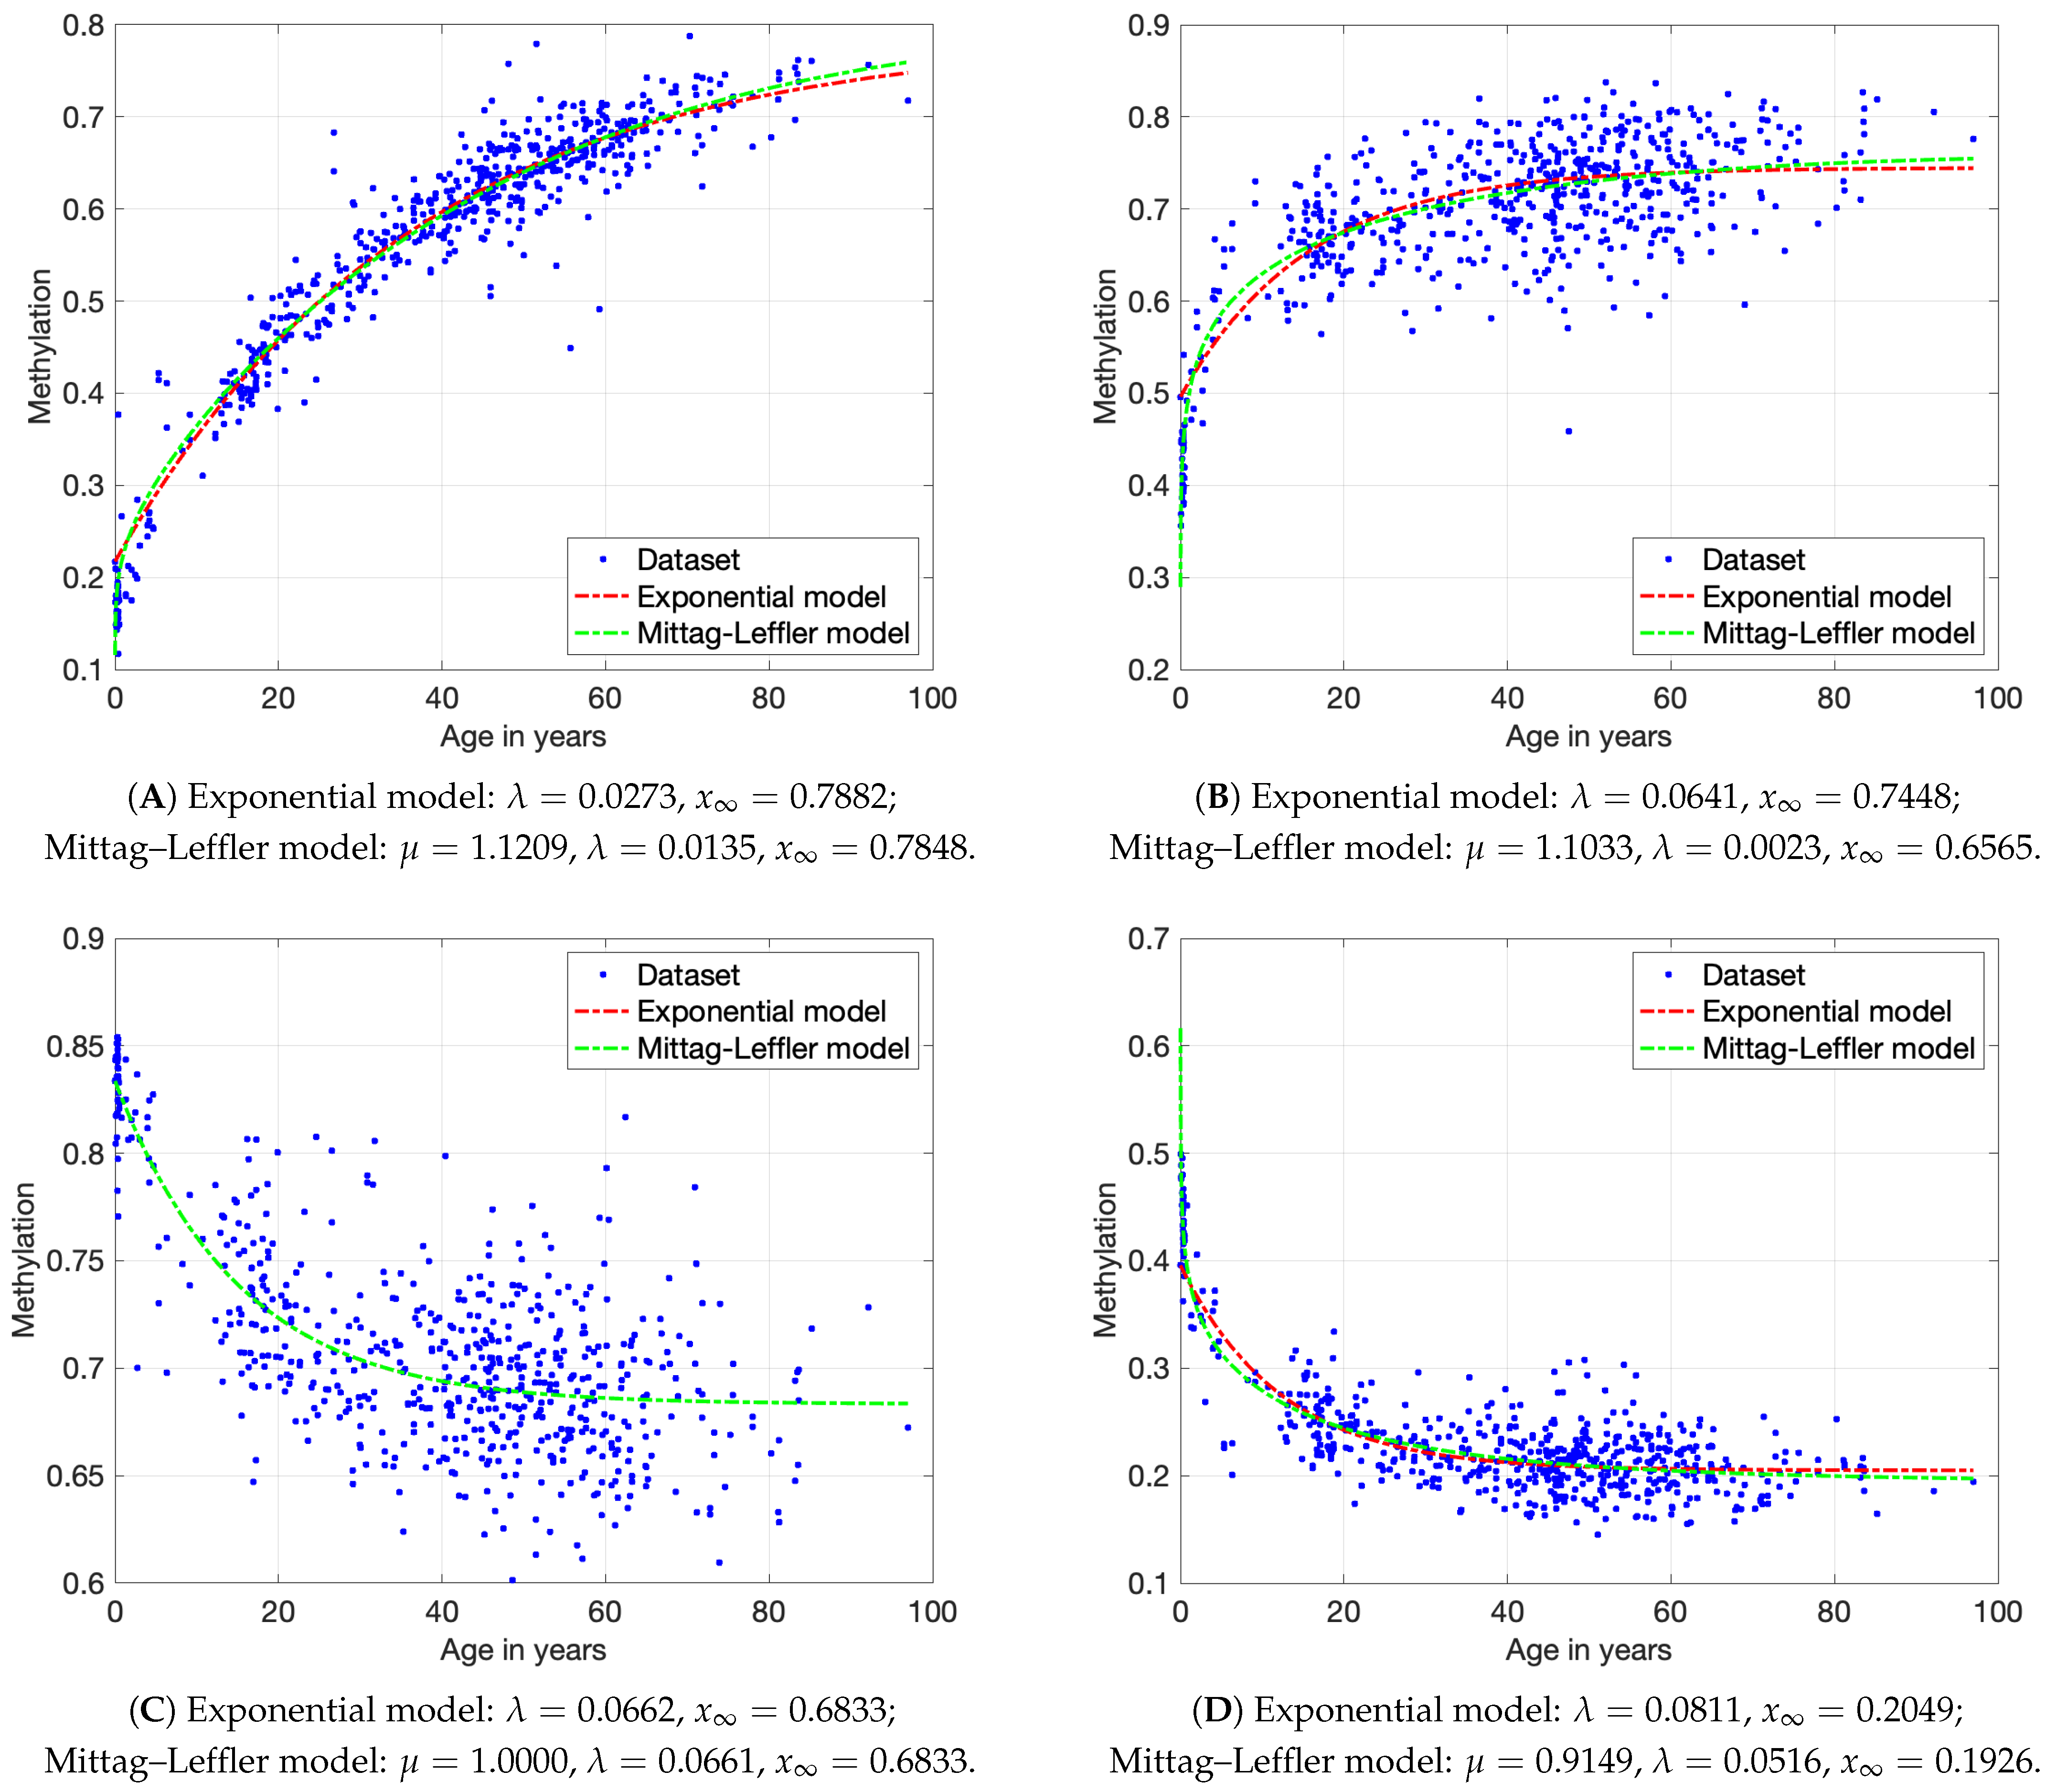
Figure 1. Methylation time scale for CpG sites (AD) from the prefrontal cortex dataset.
Fractalfract 09 00616 g001
Table 1. Modelling performance results for four CpG sites (A, B, C, D).
SAEABCD
Exponential model15.816025.578215.623713.8314
Mittag–Leffler model15.229823.806915.623812.9521
SSEABCD
Exponential model0.815031.736800.664980.56234
Mittag–Leffler model0.774471.522900.664970.50813
MAPEABCD
Exponential model6.058106.521103.633709.70770
Mittag–Leffler model5.383205.828503.633909.39840
R 2 ABCD
Exponential model0.936120.641370.558550.75920
Mittag–Leffler model0.939300.685550.558560.78241
R adj 2 ABCD
Exponential model0.936010.640780.557820.75880
Mittag–Leffler model0.939100.684510.557100.78170
Disclaimer/Publisher’s Note: The statements, opinions and data contained in all publications are solely those of the individual author(s) and contributor(s) and not of MDPI and/or the editor(s). MDPI and/or the editor(s) disclaim responsibility for any injury to people or property resulting from any ideas, methods, instructions or products referred to in the content.