Article

The Impact of Elastoplastic Deformation Behavior on the Apparent Gas Permeability of Deep Fractal Shale Rocks

1
State Key Laboratory of Deep Oil and Gas, China University of Petroleum (East China), Qingdao 266580, China
2
School of Petroleum Engineering, China University of Petroleum (East China), Qingdao 266580, China
3
School of Energy Resources, China University of Geosciences, Beijing 100083, China
*
Author to whom correspondence should be addressed.
Fractal Fract. 2025, 9(8), 526; https://doi.org/10.3390/fractalfract9080526
Submission received: 7 July 2025 / Revised: 6 August 2025 / Accepted: 7 August 2025 / Published: 13 August 2025

Abstract

Deep shale gas reservoirs are vital sources of unconventional natural gas and present unique challenges for exploration and development due to their multiscale flow characteristics and elastoplastic deformation behavior of reservoir rocks. Accurately predicting permeability in these reservoirs is crucial. This study introduces a novel model utilizing fractal theory and a thick-walled cylinder model to characterize stress-dependent apparent gas permeability. The model incorporates various flow mechanisms, including viscous flow, transition flow, Knudsen diffusion, surface diffusion, real gas effects, and gas slip effects. It enables predictions of how permeability changes with elastoplastic behavior and affects the pore volume fractions of different flow mechanisms. Experimental validation during elastic and elastoplastic deformations confirms the model’s accuracy, with each parameter having clear physical significance. Key findings reveal that, at the same effective stress, apparent gas permeability increases with pore radius fractal dimension, temperature, and Young’s modulus, while decreasing with capillary tortuosity fractal dimension. Additionally, during plastic deformation, greater magnitudes of plastic strain lead to more pronounced changes in apparent gas permeability compared to elastic deformation. These insights emphasize the importance of incorporating elastoplastic behavior in studies of deep shale gas reservoirs.

1. Introduction

With the rising global energy demand, deep shale oil and gas resources have emerged as a key exploration and development frontier for the petroleum industry [1]. However, determining how permeability changes is still a challenging task due to the coupled evolution of effective stress and permeability during production [2]. Compared with conventional shale oil and gas reservoirs, previous studies [3,4,5,6,7] have revealed that deep shale gas formations and reservoirs exhibit distinct elastoplastic deformation behavior and stress sensitivity to permeability. Dong et al. [8] conducted experiments by increasing the confining pressure from 3 to 120 MPa and then reducing it back to 3 MPa, finding that the changes in permeability and porosity during the loading-unloading process were irreversible. Huang et al. [9] also did some research on the stress sensitivity analysis of porous media, reporting consistent results: porous media undergo elastoplastic deformation, with findings applicable to sandstone gas reservoirs. Ghanizadeh et al. [10] studied the shale gas transport processes in the matrix system of European organic-rich shales under controlled effective stress, observing different migration media with varying permeabilities: kHelium > kArgon > kMethane > kWater for organic-rich shales. Meanwhile, they also found kHelium > kArgon > kMethane > for II. Posidonia Shale, although they only considered the effect of plastic deformation on apparent gas permeability. Wu et al. [4] investigated stress sensitivity under effective stresses ranging from 0 to 12 MPa, demonstrating that the porosity and permeability of shale decrease with increasing effective stress, indicating strong stress sensitivity. Yang et al. [11] explored permeability–stress dependencies using different hydrostatic stress and gas pressure conditions, finding that fractured shale permeability decreases with increasing hydrostatic stress, rebounds during unloading, and exhibits irreversibility in loading-unloading cycles. Liu et al. [12] recently studied the stress sensitivity of shale in the laboratory under elastic deformation conditions of shale porous media, evaluating reservoir quality by integrating microscopic pore characteristics with stress sensitivity. Through a large number of physical experiments, the study on the effect of the elastoplastic deformation behavior of shale on apparent gas permeability is carried out. However, the pore space of shale gas reservoirs exhibits multiscale characteristics, and gas migration involves various micro-mechanisms. Core experiments cannot quantify how the contribution of each flow micro-mechanism evolves with effective stress during rock elastoplastic deformation.
However, analytical solutions can theoretically reveal the weight proportion of various micro-mechanisms that contribute to the apparent gas permeability. Existing models have identified that the micro-flow mechanisms of shale gas include viscous flow, transition flow, Knudsen diffusion, surface diffusion, real gas effects, and gas slip effects [13,14,15,16,17,18,19]. Notably, these models fail to reflect the influence of effective stress on permeability. Chen et al. [20] investigated the change in permeability with effective stress in fractured gas reservoirs using a method of mutual verification between experiments and analytical solutions. Fan et al. [21] developed a fractal model to describe the evolution of pore structure under elastic deformation, focusing on the influence of adsorption parameters, the initial effective diffusion coefficient, and reservoir mechanical properties on the fractal dimension of shale structures and gas production throughout the entire shale reservoir. Huang et al. [9] further proposed a permeability and porosity model to express the change in permeability and porosity as a function of effective stress based on the fractal theory and the elastoplastic thick-walled cylinder model. Zhu et al. [22] derived elastic-brittle-plastic unified solutions for limiting internal pressure in double-layer combined thick-walled cylinders using the triple-shear unified strength criterion. Masoudian et al. [23] established an analytical approach to characterize the elastic-brittle-plastic behavior of shale reservoirs. However, the deformation behavior in deep shale gas reservoirs exhibits elastic-plastic behavior. Li et al. [24] conducted numerical simulations of coupled thermo-hydro-mechanical processes in deep shale gas reservoirs, whose governing equations do not account for elastic-plastic deformation in these reservoirs. Therefore, there is an urgent need to develop an analytical solution model that accounts for the elastoplastic deformation of deep shale gas reservoirs. This model should not only consider the various micro-flow mechanisms in deep shale gas reservoirs but also analyze how the apparent gas permeability of deep shale gas and the proportion of different flow mechanisms within shale pores change with effective stress.
This study presents a novel model to characterize the stress-dependent apparent gas permeability in deep shale gas reservoirs, accounting for the contributions of viscous flow, transition flow, Knudsen diffusion, surface diffusion, real gas effects, and slip effects of gas based on the fractal theory and thick-walled cylinder model. Firstly, according to the thick-walled cylinder model, as a result of the stress variation, the relationship between the stress and length, radius of a single capillary, and the overall shale rock sample is established in Section 2.1 and Section 2.2. Then, based on the fractal theory, the apparent gas permeability of deep shale gas model considering the stress sensitivity are derived in Section 3, this apparent gas permeability model integrates various transportation mechanisms. Next, in Section 4, the model’s validity is validated through comparisons with existing experimental data, demonstrating strong agreement. Parametric analyses systematically investigate how stress-dependent factors influence the apparent permeability of shale gas and the pore volume fractions of different flow mechanisms during elastoplastic deformation. Finally, conclusions are given in Section 5.

2. Mathematical Model

2.1. Capillary and Rock Sample Radius

In previous research [9], the thick-walled cylinder model was employed to analyze the stress sensitivity of porous media using fractal theory. Building upon this theoretical foundation, the current study extends its application to deep shale gas reservoirs to investigate the sensitivity of apparent gas permeability. The following simplifying assumptions are proposed prior to conducting the stress sensitivity analysis:
The theoretical diagram of the thick-walled cylinder is shown in Figure 1. The red region indicates the elastic zone, while the blue region represents the plastic zone. With the increase in effective stress, the inner radius of the capillary decreases, leading to plastic deformation within the capillary. Due to stress concentration, the stress plastic rings first form in the inner wall of the capillary and gradually expand outward. Figure 1a,b depict the pressure on a three-dimensional single capillary and its cross-sectional slice under elastic-plastic deformation conditions.
The following formulas can describe the radius deformation in different regions:
λ σ = 1 + C λ λ 0 , C λ = C e λ , σ λ σ e a C λ = C p λ , σ e < σ λ σ p b C λ = C p λ ( σ p ) , σ λ > σ p c
where σe is the elastic limit pressure, Pa; σp is the plastic limit pressure, Pa. Equation (1a) is the radius of the capillary changes when plastic deformation occurs. The Equation (1b) corresponds to plastic deformation. The Equation (1c) is the radius change when the stress exceeds the plastic limit. The specific expression of the C and C is as follows:
C e λ = 1 ν E p i t 2 p o t 2 1 + 1 + ν E p i p o t 2 t 2 1 C p λ = 1 ν E σ 0 2 ρ 2 t 2 p o ρ 2 + 1 + ν E σ 0 2 ρ 2
where λ represents the inner radius dimension of the capillary, m; represents the outer radius dimension of the capillary, m; pi is the pressure of the fluid inside the capillary, Pa; the external pressure is po, Pa. E is Young’s modulus, Pa; ν is Poisson’s ratio. Under the Tresca yield criterion. ρ is the ratio of the radius at the junction of the elastic zone and the plastic zones to the inner diameter of the capillary. The specific derivation process of C and C is described in the relevant article [9].
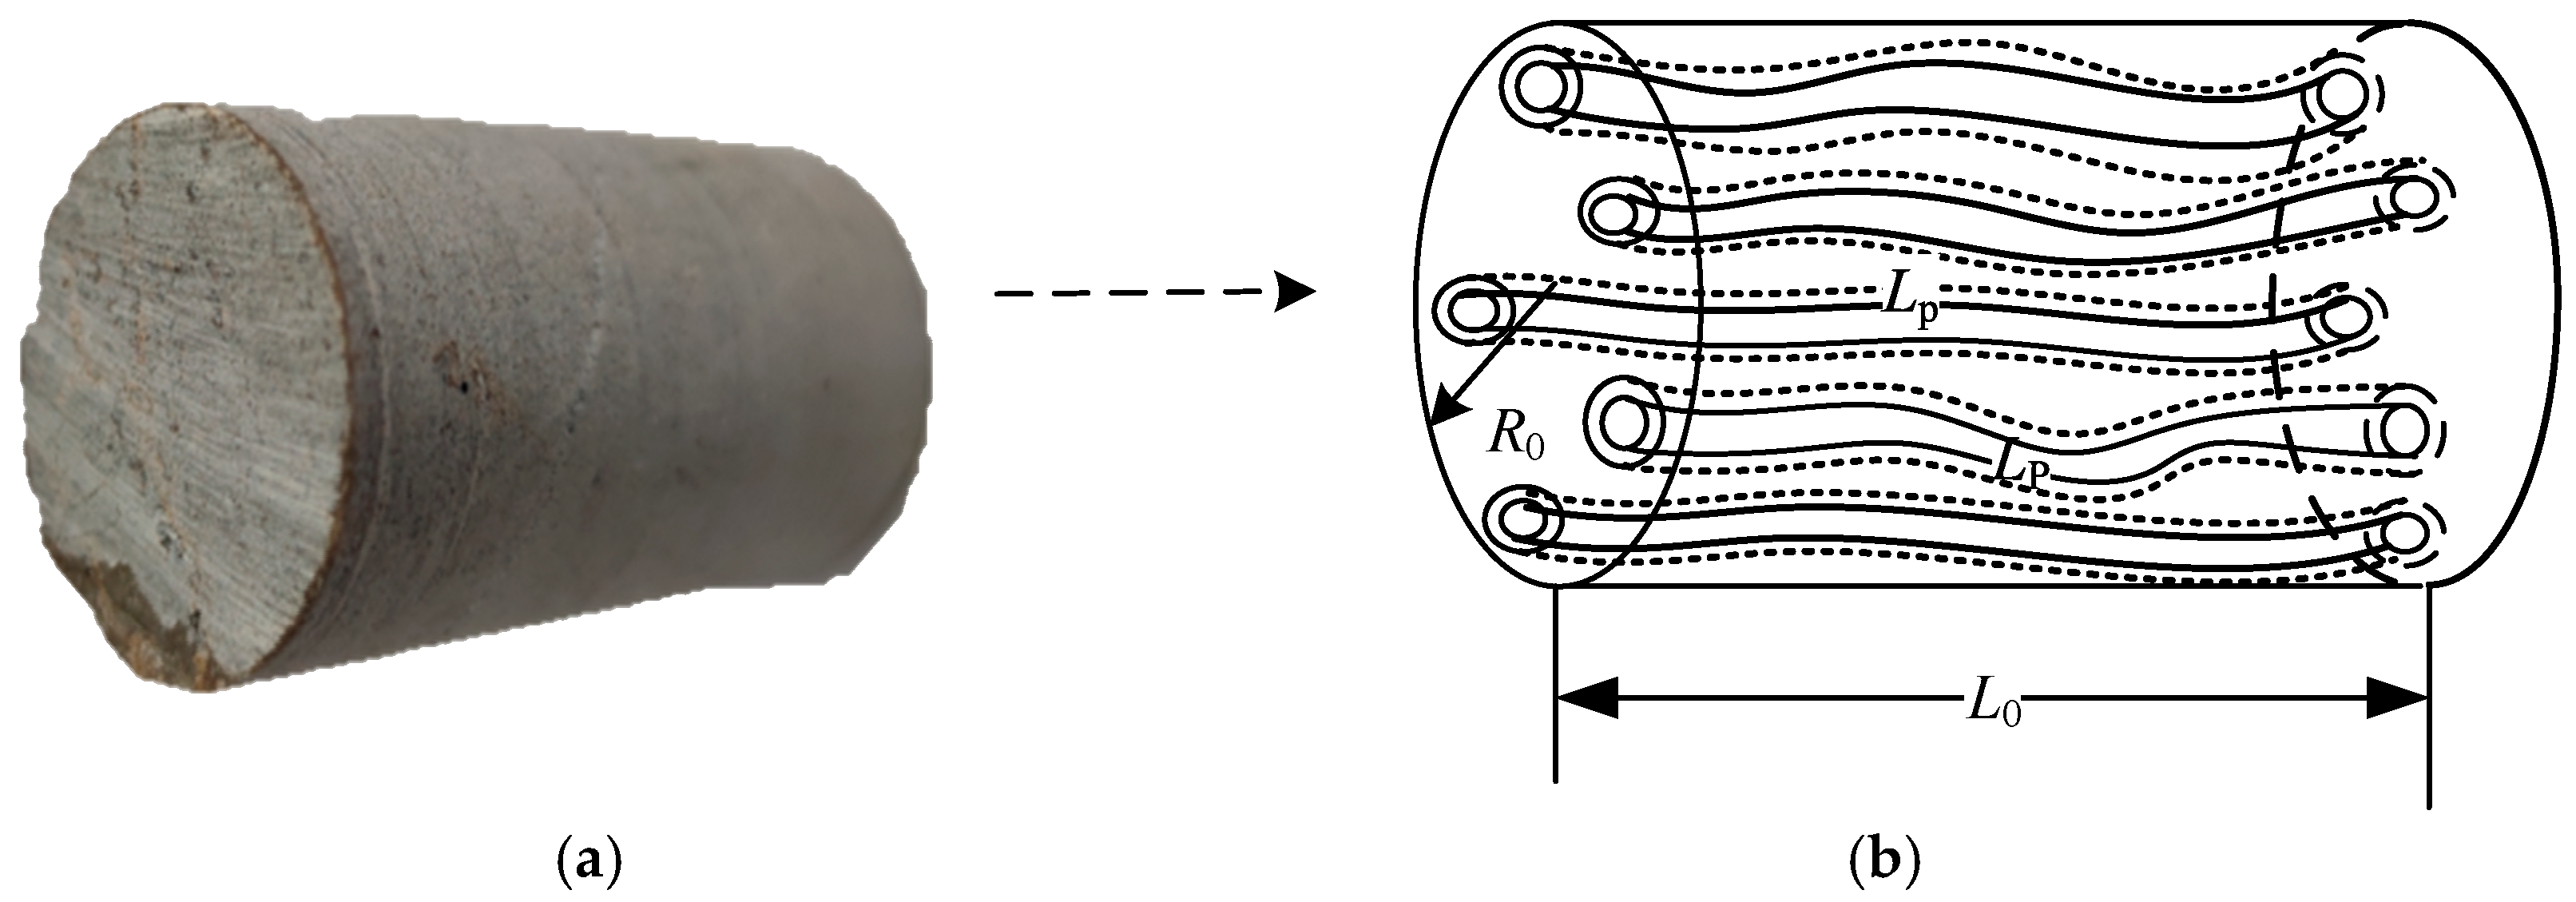
For actual shale core samples, the number of capillaries inside the shale core is quite large, and the degree of curvature between each capillary varies. Establishing the relationship between the variation in radius and the length change of each capillary from a single capillary is challenging. This paper addresses this challenge by assuming uniform variation in the length and radius of different capillaries with stress across the entire shale core sample. As shown in Equations (3) and (7). Figure 2 represents conversion of real rock sample of deep shale to capillary model.
When the stress is zero, the geometry of the shale core sample resembles a cylinder. The radius of the rock sample is R0, m, and the length of rock sample is L0, m, where the subscript 0 designates the stress-free state. According to Hooke’s law [25], the following formula can mathematically describe the radial deformation of shale core samples under the influence of stress.
R σ = 1 + σ E R 0
where Rσ is the radius of the rock sample changes with stress, m; R0 denotes the initial radius of the shale core sample, m.

2.2. Fractal Dimension of Capillary

A substantial body of literature has demonstrated that both the pore surfaces and pore size distributions in porous media conform to fractal scaling laws. In this paper, the shale rock core sample is also considered a porous medium. The relationship between the accumulated number of a diameter greater than or equal to λ, expressed mathematically as [26,27]:
N l λ = λ max λ D f
In Equation (4), N represents the cumulative number of capillaries in the shale porous medium core sample with a radius exceeding λ, λmax denotes the biggest radius of capillary, m; λ is a certain capillary radius, m; Df is the fractal dimension (in two-dimensional space, 0 < Df < 2, in three-dimensional space, 0 < Df < 3). By differentiating Equation (4) concerning the effective pore radius λ, the differential form can be derived as:
d N = D f λ max D f λ D f + 1 d λ
Equation (5) is the number of capillaries between the λ and dλ. According to the Fractal scaling law [28], the capillary length can be expressed as
L p = 2 λ 1 D T L 0 D T
where Lp is the length of the capillary, m; DT is the fractal dimension of capillary tortuosity, dimensionless.
The radius of the capillary not only decreases, but its length also changes under stress conditions. The Formula for the final length of capillaries is
L p σ = 1 1 ν σ E 2 λ σ 1 D T L 0 D T
Taking the logarithm of both sides of Equation (4) yields the following formula.
D f 0 = log λ max 0 λ 0 N 0 a D f σ = log λ m a x σ λ σ N σ b
When a strain occurs, it is assumed that the total number of capillaries remains unchanged. So, we can obtain the following equation.
D f σ = D f 0 = D f

3. The Fractal Descriptions of Shale Gas Reservoirs

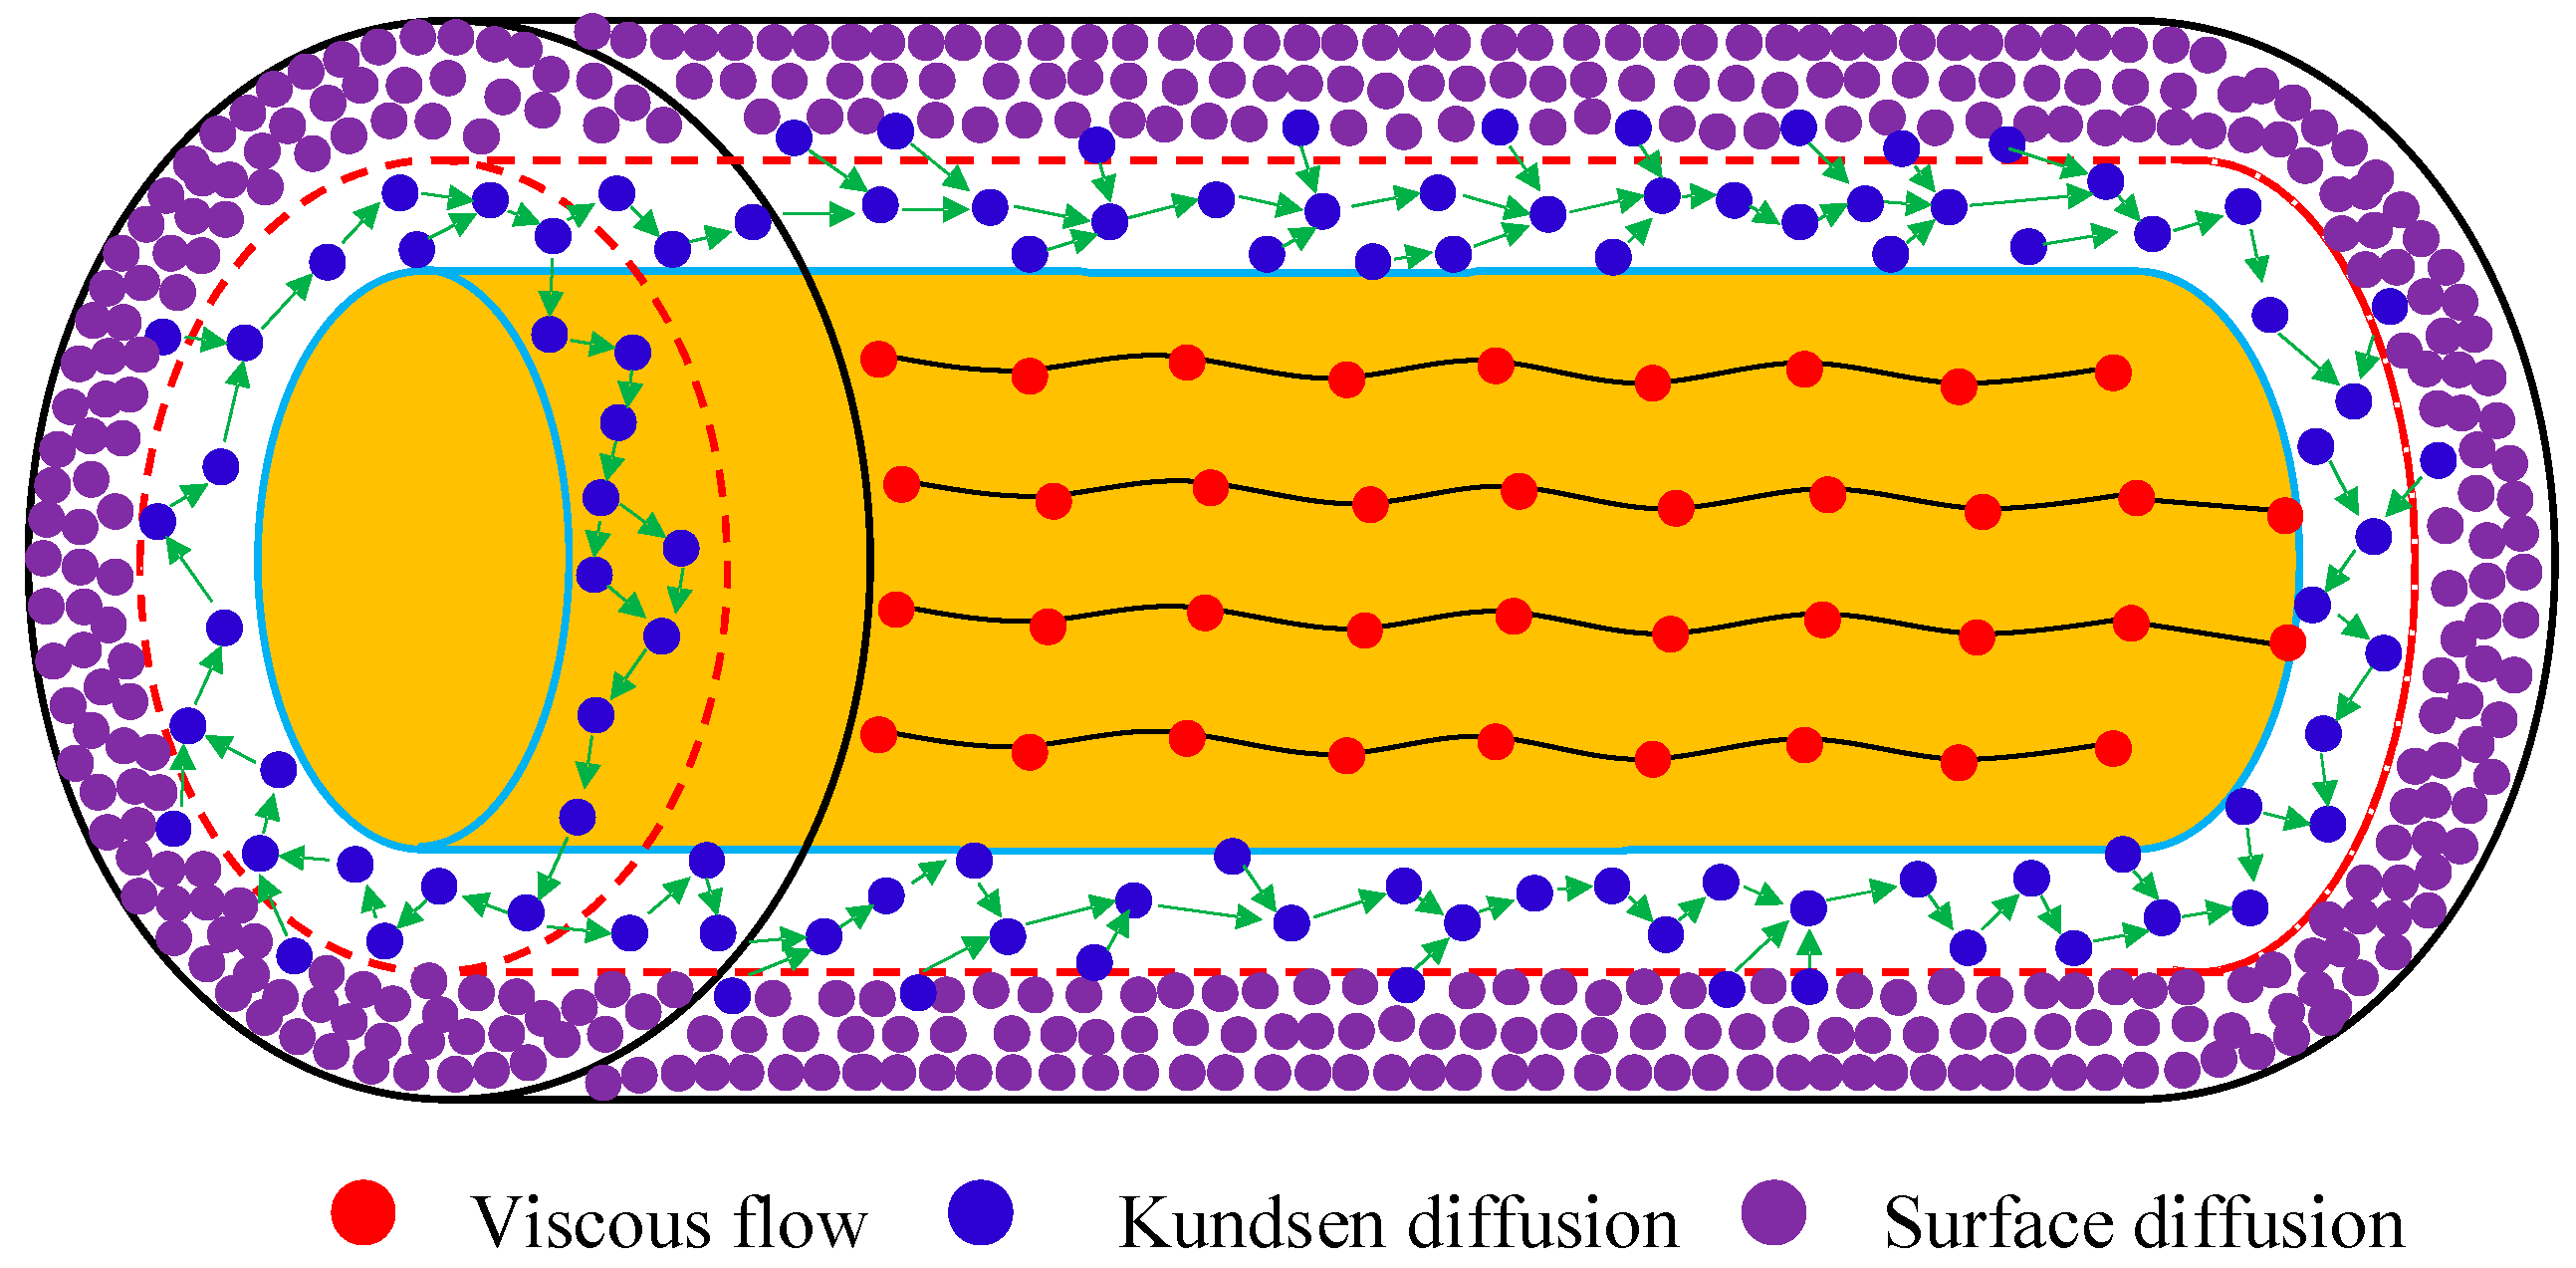
Under isothermal conditions, the mass transfer of shale gas in nanoporous media is governed by multiple transport mechanisms: viscous flow, Knudsen diffusion, molecular diffusion, and surface diffusion. Molecular diffusion refers to the phenomenon where molecules of a substance (such as gases, liquids, or solids) spontaneously migrate from regions of high concentration to regions of low concentration, driven by random thermal motion under a concentration gradient. In contrast, viscous flow refers to the directed macroscopic flow of gases driven by a pressure gradient through pores or fractures, which essentially represents the macroscopic manifestation of internal friction between fluid molecules (viscous forces). At the same time, surface diffusion involves gas molecules migrating along adsorbed layers on pore surfaces (refer to Figure 3). Typically, the Knudsen number Kn = lg/λ, which is the ratio of the free path length of gas molecules lg to the characteristic length L of the porous medium, is used to determine the gas transport mode in porous media [29]. The free path length of gas molecules lg can be mathematically expressed as:
l g = K B T 2 π δ g 2 p
where KB is Boltzmann constant, (1.3805 × 10⁻²³ J/K); δg is the molecular collision diameter of gas molecules, m; T is the absolute temperature, K; and p corresponds to the gas pressure within the shale porous medium, Pa.
When Kn < 0.1, the characteristic pore size of shale porous media is significantly greater than the mean free path of the gas molecule. The gas slippage is not neglected [30]. In this scenario [14,31], Beskok [16] obtained a formula for the volumetric flow rate of gas in a single tortuous capillary by the correcting Hagen-Poiseuille equation.
q vs λ = π λ 4 8 μ g 1 + α K n 1 + 4 K n 1 b K n Δ p L p
where Δp is the pressure differential, Pa; α is rarefaction coefficient, dimensionless; b is slip factor, dimensionless; a = 0, b = −1 in the slip flow zone. By substituting these values into Equation (11) and considering Kn ≪ 1, the formula for the volumetric flow rate of gas in a single tortuous capillary, accounting for slip flow, can be obtained.
q vs λ = π λ 4 8 μ g 1 + 8 l g λ Δ p L p
Combining Formula (1), the volume flow rate in a single tortuous capillary under effective stress can be derived:
q vs λ σ = π λ σ 4 8 μ g 1 + 8 l g λ σ Δ p L p σ
When Kn ≥ 1, the gas mean free path becomes comparable to the characteristic pore radius in nanoscale pores. In this transitional regime, molecule-wall collisions dominate over intermolecular interactions, and gas transport is governed by Knudsen flow. The volumetric flow rate of Knudsen diffusion in a single tortuous capillary can be theoretically expressed as [32]:
q k λ = 2 π λ 3 3 p 8 Z R T π M Δ p L p
Considering the effect of stress, the Equation (14) can be arranged as:
q k λ σ = 2 π λ σ 3 3 p 8 Z R T π M Δ p L p σ
When 0.1 ≤ Kn < 1, the Knudsen diffusion and Poiseuille flow may coexist. They can be combined like resistors in parallel. the volumetric flow rate of transition flow is
q vk λ σ = q vs λ σ + q k λ σ
where p is the pore pressure of shale porous media, Pa; M is the molecule weight of gas, kg/mol; R is gas constant, 8.314 J/(mol K); Z is the gas dimensionless compressibility factor. Mahmoud [33] proposed the corresponding method for calculating the real gas compression factor:
Z = 0.702 exp 0.25 T r P r 2 5.524 exp 0.25 T r + 0.044 T r 2 0.164 T r + 1.15
P r = P / P c
T r = T / T c
where Pr and Tr represent the dimensionless pseudo-pressure and pseudo-temperature, respectively, which are calculated using Equations (18) and (19), and Pc and Tc are critical pressure and critical temperature, respectively. As temperature and pressure vary, the viscosity of shale gas also changes. The formula is as follows [34]:
μ g = S exp X 0.001 ρ g Y ρ g = 10 3 p M Z R T
S = 22.7 + 48.3 T 1.5 209 + 19000 M + 1.8 T
X = 3.5 + 54.8 T + 10 M
Y = 2.4 0.2 X
Owing to the rich organic substances in shale reservoirs, substantial quantities of absorbed gas reside on the surface of shale nanopores [35]. The amount of adsorbed gas can be effectively characterized using Langmuir isotherm adsorption theory [36]:
θ = p / Z p L + p / Z
where pL and p are the Langmuir pressure and shale gas reservoir pressure, Pa; θ is the surface coverage of the adsorption gas under the equilibrium condition, dimensionless.
Combining Equation (24), the concentration of Langmuir single-layer adsorbed gas is defined as:
C s = θ C L = p / Z p L + p / Z C L
where Cs is the maximum adsorption capacity at constant temperature and infinite high pressure, mol/m3, based on Fick’s law, in the adsorption layer of a single capillary, the gas molar flux due to surface diffusion can be described by the following expression:
q d = A s D s Δ C / L p
where ΔC is concentration difference, mol/m3; Ds is effective surface diffusion coefficient, m2/s. The specific form of the surface diffusion coefficient can be expressed as [37]:
D s = D s 0 1 θ + κ 2 θ 2 θ + H 1 κ 1 θ κ 2 θ 2 1 θ + κ 2 θ 2
H 1 κ = 0 , κ 1   1 , 0 κ 1
κ = κ b κ m
D s 0 = 8.29 × 10 7 × T 0.5 exp Δ H 0.8 R T
where D s 0 is the surface diffusion coefficient with “0” gas coverage, m2/s, κb is the blocking coefficient of surface gas molecules, dimensionless; κm is the rate constant for forward migration, m/s. According to Equation (26), the volumetric gas flow rate due to surface diffusion in a single capillary is expressed as:
q d λ = A s D s Z R T Δ C p L p
where M is the molar mass of shale gas, kg/mol; ρ is the density of shale gas, kg/m3. By applying the chain rule and taking the derivative of Equation (25) with respect to pressure, and then substituting it into Equation (31), the volumetric flow rate due to surface diffusion can be rewritten as:
q d λ = A s D s R T C L p Z 2 C p L Z p L p Z p Z p L + p 2 Δ p L p
Due to the presence of an adsorption layer, the effective radius of the capillary bundle will decrease, and the surface diffusion area of shale gas will also change. The effective capillary pore radius and surface diffusion cross-sectional area can be expressed as:
λ e = λ d m θ
A s = π λ 2 π λ e 2 = π d m θ 2 λ d m θ
By incorporating the stress effect, and assuming that the surface coverage of adsorbed gas under equilibrium conditions remains unchanged under stress, the expression for the volumetric flow rate due to surface diffusion is derived as follows:
q d λ σ = π d m θ 2 λ σ d m θ D s C L R T p Z 2 p L Z p L p Z p Z p L + p 2 Δ p L p σ
The volumetric flow rate through a single tortuous capillary with a variable cross-section can be regarded as the linear combination of four transport mechanisms: viscous flow, transition flow, Knudsen diffusion, and surface diffusion, as referenced in [36]. To determine the overall flow rate in porous media of deep shale gas reservoirs, these individual contributions are integrated across the full spectrum of pore sizes—from the smallest to the largest pores—by incorporating the fractal nature of the pore size distribution. Consequently, by considering the varying pore radius of capillary, the total gas flux through shale porous media is described by the following expression:
Q σ = Q vs σ + Q vk σ + Q k σ + Q d σ
Substituting Equations (3), (13), (15), (16) and (35) into Equation (36), subsequently performing integration, the first term on the right-hand side of Equation (36) can be rewritten as:
Q v s σ = λ P λ max q vs λ σ d N = λ P λ max π λ σ 4 8 μ g 1 + 8 l g λ σ Δ p 1 1 ν σ E 2 λ σ 1 D T L 0 D T D f λ max D f λ D f + 1 d λ = π D f Δ p λ max D f 1 + C λ 3 + D T 2 4 D T μ g L 0 D T 3 + D T D f 1 1 ν σ E λ max 3 + D T D f λ P 3 + D T D f + 8 l g π D f Δ p λ max D f 1 + C λ 2 + D T 2 4 D T μ g L 0 D T 2 + D T D f 1 1 ν σ E λ max 2 + D T D f λ P 2 + D T D f
The second term on the right-hand side of Equation (36) is
Q vk σ = λ K λ P q v k λ σ d N = 2 D T π D f λ max D f Δ p 1 + C λ 2 + D T 3 p L 0 D T 2 + D T D f 1 1 ν σ E 8 Z R T π M λ P 2 + D T D f λ K 2 + D T D f + π D f Δ p λ max D f 1 + C λ 3 + D T 2 4 D T μ g L 0 D T 3 + D T D f 1 1 ν σ E λ P 3 + D T D f λ K 3 + D T D f + 8 l g π D f Δ p λ max D f 1 + C λ 2 + D T 2 4 D T μ g L 0 D T 2 + D T D f 1 1 ν σ E λ P 2 + D T D f λ K 2 + D T D f
We can get the third term on the right-hand side of Equation (36)
Q k σ = λ min λ K q k λ σ d N = λ min λ max 2 π λ 3 λ σ 3 3 p 8 Z R T π M Δ p 1 1 ν σ E 2 λ σ 1 D T L 0 D T D f λ max D f λ D f + 1 d λ = 2 D T π D f λ max D f Δ p 1 + C λ 2 + D T 3 p L 0 D T 2 + D T D f 1 1 ν σ E 8 Z R T π M λ K 2 + D T D f
The last term on the right-hand side of Equation (36) is
Q d σ = λ min λ max q d λ σ d N = 2 D T π θ d m D s C L Z 2 p L Z p L p Z p R T Δ p D f λ max D T 1 + C λ D T p Z p L + p 2 L 0 D T D T D f 1 1 ν σ E 1 λ min λ max D T D f π θ 2 d m 2 D s C L Z 2 p L Z p L p Z p R T Δ p D f λ max D T 1 2 1 D T p Z p L + p 2 L 0 D T D T D f 1 1 1 ν σ E 1 λ min λ max D T D f 1
According to generalized Darcy’s law, the apparent gas permeability of shale gas porous media can be as follows:
k app σ = k v s σ + k vk σ + k k σ + k d σ = Q σ μ g L 0 A σ Δ p
where characteristic pore radius λK and λP are defined based on Knudsen number as:
λ P = 10 l g
λ K = l g
k vs σ = D f λ max D f 1 + C λ 3 + D T 2 4 D T R 0 2 L 0 D T 1 3 + D T D f 1 1 ν σ E 1 + σ E 2 λ max 3 + D T D f λ P 3 + D T D f + 8 l g D f λ max D f 1 + C λ 2 + D T 2 4 D T R 0 2 L 0 D T 1 2 + D T D f 1 1 ν σ E 1 + σ E 2 λ max 2 + D T D f λ P 2 + D T D f
k vk σ = 2 D T μ g D f λ max D f 1 + C λ 2 + D T 3 R 0 2 p L 0 D T 1 2 + D T D f 1 1 ν σ E 1 + σ E 2 8 Z R T π M λ P 2 + D T D f λ K 2 + D T D f + D f λ max D f 1 + C λ 3 + D T 2 4 D T R 0 2 L 0 D T 1 3 + D T D f 1 1 ν σ E 1 + σ E 2 λ P 3 + D T D f λ K 3 + D T D f + 8 l g D f λ max D f 1 + C λ 2 + D T 2 4 D T R 0 2 L 0 D T 1 2 + D T D f 1 1 ν σ E 1 + σ E 2 λ P 2 + D T D f λ K 2 + D T D f
k k σ = 2 D T μ g D f λ max D f 1 + C λ 2 + D T 3 R 0 2 p L 0 D T 1 2 + D T D f 1 1 ν σ E 1 + σ E 2 8 Z R T π M λ K 2 + D T D f
k d σ = 2 D T μ g θ d m D s C L Z 2 p L Z p L p Z p R T D f λ max D T 1 + C λ D T p R 0 2 Z p L + p 2 L 0 D T 1 D T D f 1 1 ν σ E 1 + σ E 2 1 λ min λ max D T D f μ g θ 2 d m 2 D s C L Z 2 p L Z p L p Z p R T D f λ max D T 1 2 1 D T p R 0 2 Z p L + p 2 L 0 D T 1 D T D f 1 1 1 ν σ E 1 + σ E 2 1 λ min λ max D T D f 1
The specific derivation process of the Equations (44)–(47) is in Appendix A. Subsequently, the proportions of distinct flow mechanism regions within the shale pore volume will be calculated under varying stress conditions. The following expression gives the total pore volume:
V p σ = λ min σ λ max σ π λ 2 L p σ d N = 2 1 D T π D f L 0 D T λ max D f 1 1 ν σ E 3 D T D f λ max σ 3 D T D f λ min σ 3 D T D f
Equations (49)–(51) represent the volume changes associated with viscosity flow, transition flow, and Knudsen diffusion, respectively, under stress variation. The explicit formulations for the governing equations are presented below:
V v s σ = λ P λ max σ π λ 2 L p σ d N = 2 1 D T π D f L 0 D T λ max D f 1 1 ν σ E 3 D T D f λ max σ 3 D T D f λ P 3 D T D f
V vk σ = λ K λ P π λ 2 L p σ d N = 2 1 D T π D f L 0 D T λ max D f 1 1 ν σ E 3 D T D f λ P 3 D T D f λ K 3 D T D f
V k σ = λ min σ λ K π λ 2 L p σ d N = 2 1 D T π D f L 0 D T λ max D f 1 1 ν σ E 3 D T D f λ K 3 D T D f λ min σ 3 D T D f
where Vvsσ is the pore volume of viscosity flow, Vvkσ is the pore volume of transition flow, and Vkσ is the pore volume of Knudsen flow. The specific derivation process of the Equations (49)–(51) is in Appendix A. The pore volume proportion of each flow mechanism is as follows:
η v s = V v s σ V p σ × 100 % = λ max σ 3 D T D f λ P 3 D T D ff λ max σ 3 D T D f λ min σ 3 D T D f × 100 %
η v k = V v k σ V p σ × 100 % = λ P 3 D T D f λ K 3 D T D f λ max σ 3 D T D f λ min σ 3 D T D f × 100 %
η k = V k σ V p σ × 100 % = λ K 3 D T D f λ min σ 3 D T D f λ max σ 3 D T D f λ min σ 3 D T D f × 100 %
where ηvs is the proportion of pore volume of viscosity flow, ηvk is the proportion of pore volume of transition flow, and ηk is the proportion of pore volume of Knudsen flow. In this model, the pore volume of surface diffusion is significantly smaller than that of the other three flow mechanisms. Therefore, it will not be further elaborated.

4. Results and Discussion

In this section, the validity of the proposed fractal model is verified using experimental data. Then, the effect of the key parameters of the shale porous media is analyzed.

4.1. Model Validation

Within this section, the stress-sensitive mathematical model is validated by integrating multiple transport mechanisms: viscous flow with gas slippage, transition flow, Knudsen diffusion, and surface diffusion of adsorbed gas. Methane, as the primary component of shale gas, is selected as the target gas for analysis. The porosity of shale gas reservoirs is set to 10%, and the fractal dimension is calculated by Df = 2 − ln(ϕ)/ln(λmin/λmax). Model input parameters are detailed in Table 1.
Under varying effective stresses, the three-color curves represent the predicted values of the apparent gas permeability at different pore pressures in Figure 4. The three-color scatter displays Amin’s experimental data [10], with each color representing the values measured at different pore pressures. The close agreement between the model predictions and experimental data confirms the reliability of the proposed approach. Young’s modulus and Poisson’s ratio are smaller in our work than in the work of predecessors. The reason is that the deformation of the entire shale rock sample is the sum of the deformation of each individual capillary. From a scientific perspective, Young’s modulus and Poisson’s ratio represent the constitutive properties of the capillaries.
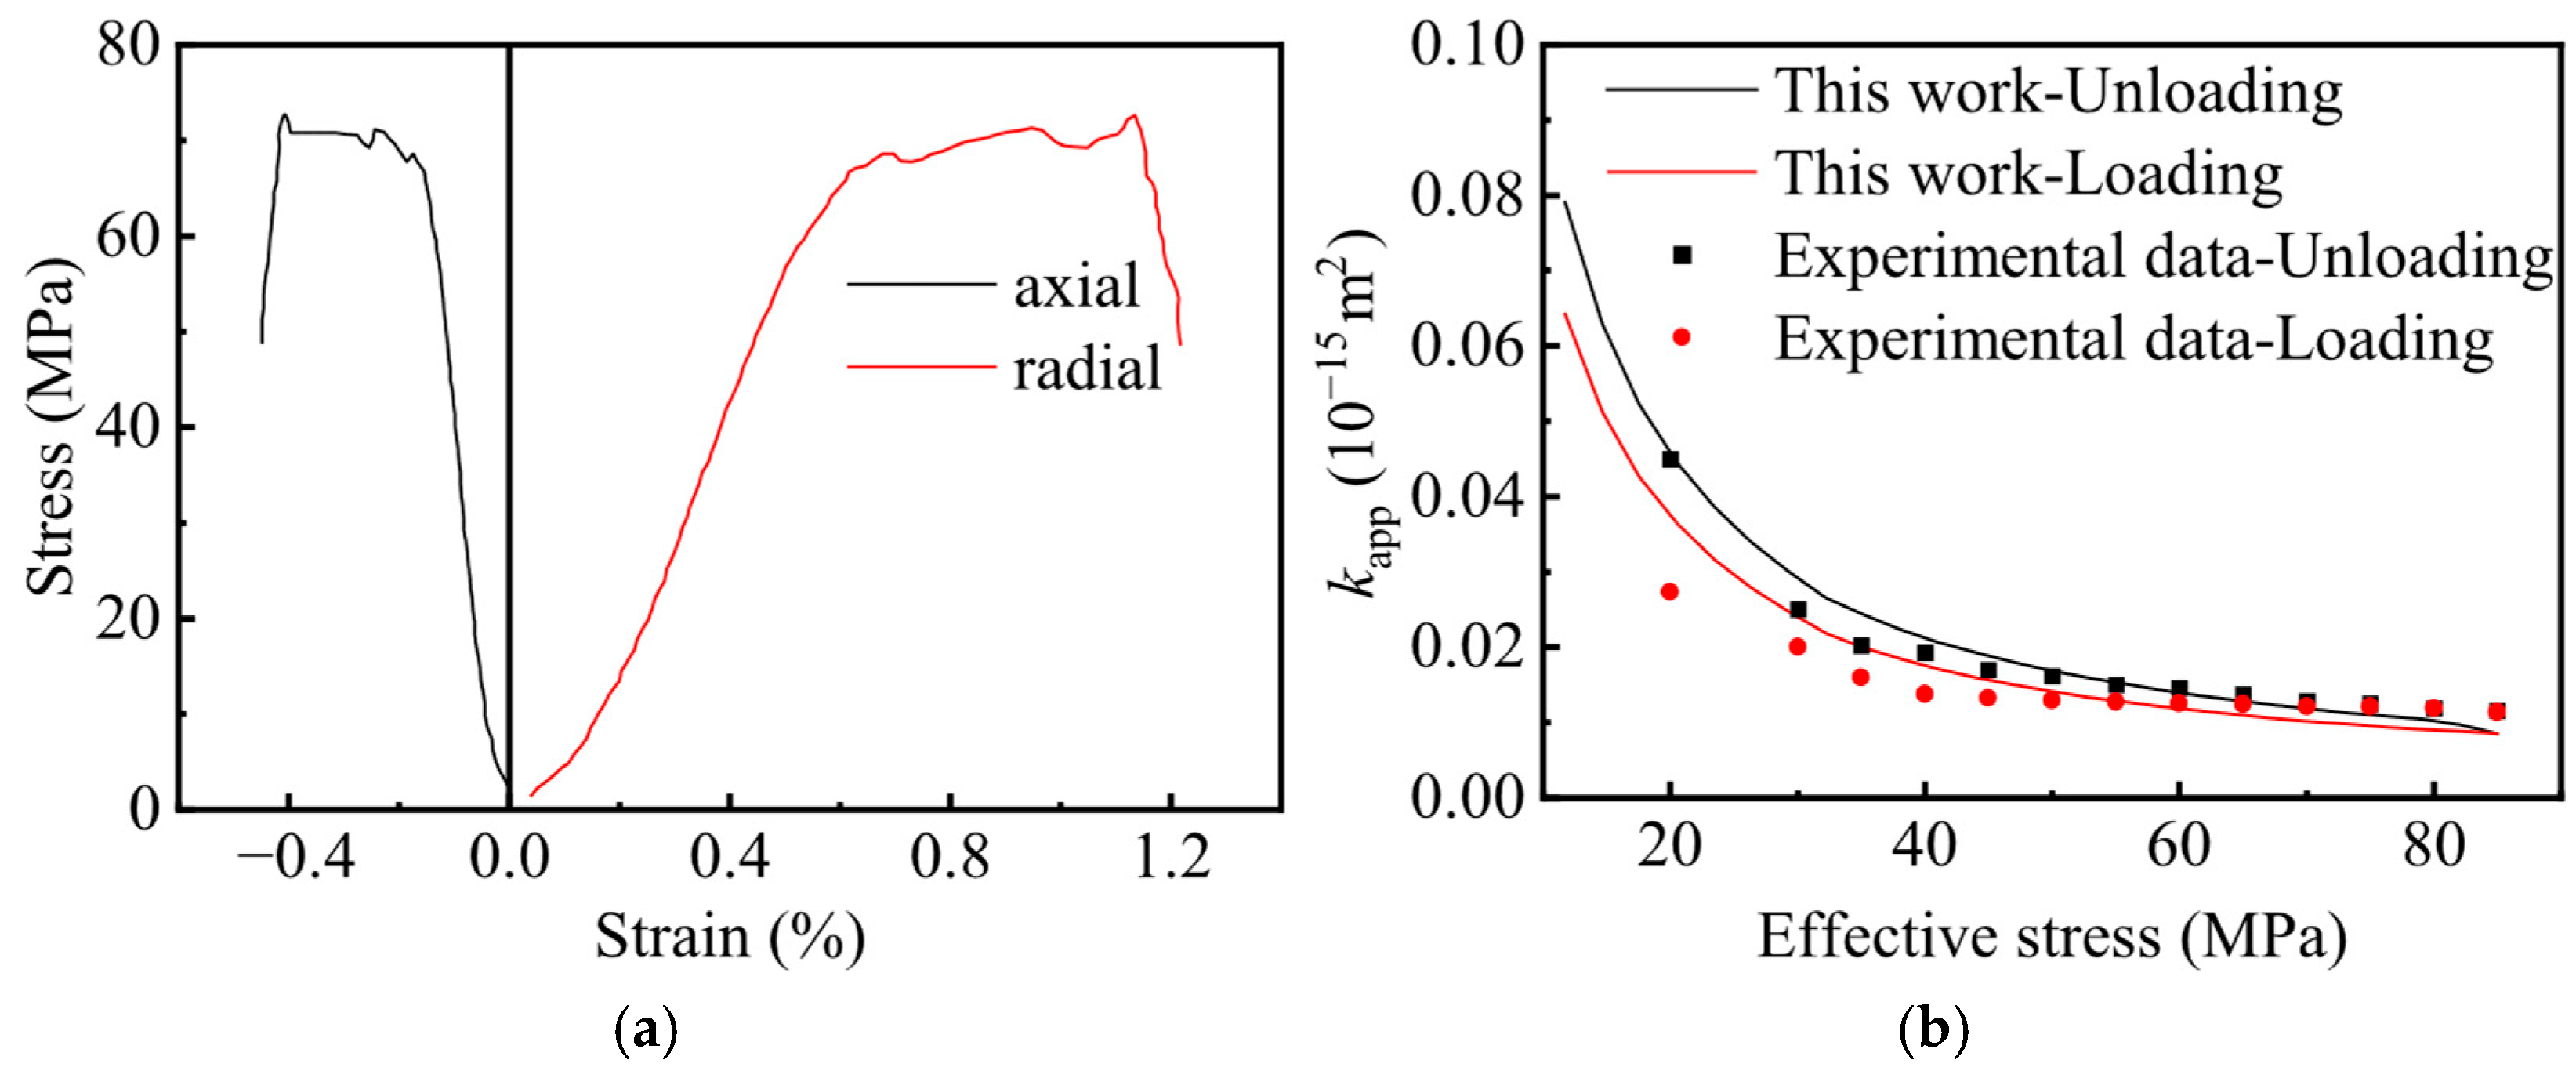
The CT image of the experimental core sample is shown in Figure 5a and Figure 6a. The number of fractal dimensions Df can be measured as 1.1 and 1.15, respectively. The two experimental core samples are real rock samples from China. For rock sample 1, Young’s modulus, Poisson’s ratio, and porosity are 15.67 GPa, 0.281, and 0.055, respectively. For rock sample 2, these parameters are 15.77 GPa, 0.237, and 0.052. The fitting data for rock sample 1, including Young’s modulus of 15 GPa, a Poisson’s ratio of 0.22, a porosity of 0.055, and a yield stress of 66 MPa, are used in the loading-unloading model. For rock sample 2, the fitting data include a Young’s modulus of 10 GPa, a Poisson’s ratio of 0.2, a porosity of 0.052, and a yield stress of 58 MPa. Additional fitting parameters are tabulated in Table 1. The proposed model can effectively predict the elastoplastic deformation behavior of fractal shale porous media under cyclic loading-unloading stress conditions. Figure 7b and Figure 8b present two examples comparing the present model with experimental data from loading-unloading stress cycle tests, and the black and red lines denote the relationship between apparent gas permeability and effective stress as predicted by the model. At the same time, the corresponding symbols represent the experimental measurements. The model predictions exhibit a high degree of consistency with experimental results, robustly validating the model’s accuracy in capturing permeability evolution under cyclic stress conditions. The related data used in this section to verify the apparent gas permeability sensitivity of shale porous media in Appendix B.

4.2. Parameter Sensitivity Analysis

Following this, based on the permeability prediction model that integrates fractal theory and the thick-walled cylinder model, we will conduct a parametric sensitivity analysis to study the degree of permeability response to each parameter.
According to the formula Df = 2 − ln(ϕ)/ln(λmin/λmax), the pore radius fractal dimension is determined by porosity, Euclidean dimensionality, and the ratio of maximum pore radius to minimum pore radius. As shown in Figure 9, the pore radius fractal dimension increases with the porosity of the shale gas rock sample. When the porosity of the shale gas core sample is smaller, the pore radius fractal dimension becomes more pronounced. A smaller ratio of minimum pore radius to maximum pore radius results in a larger pore radius fractal dimension. This is because a larger pore radius fractal dimension indicates a greater number of pores. Moreover, with an increase in the porosity of shale gas, the pore radius fractal dimension also becomes larger. This is attributed to the fact that as the porosity of shale gas porous media increases, the number of pores in the shale gas porous media also increases.
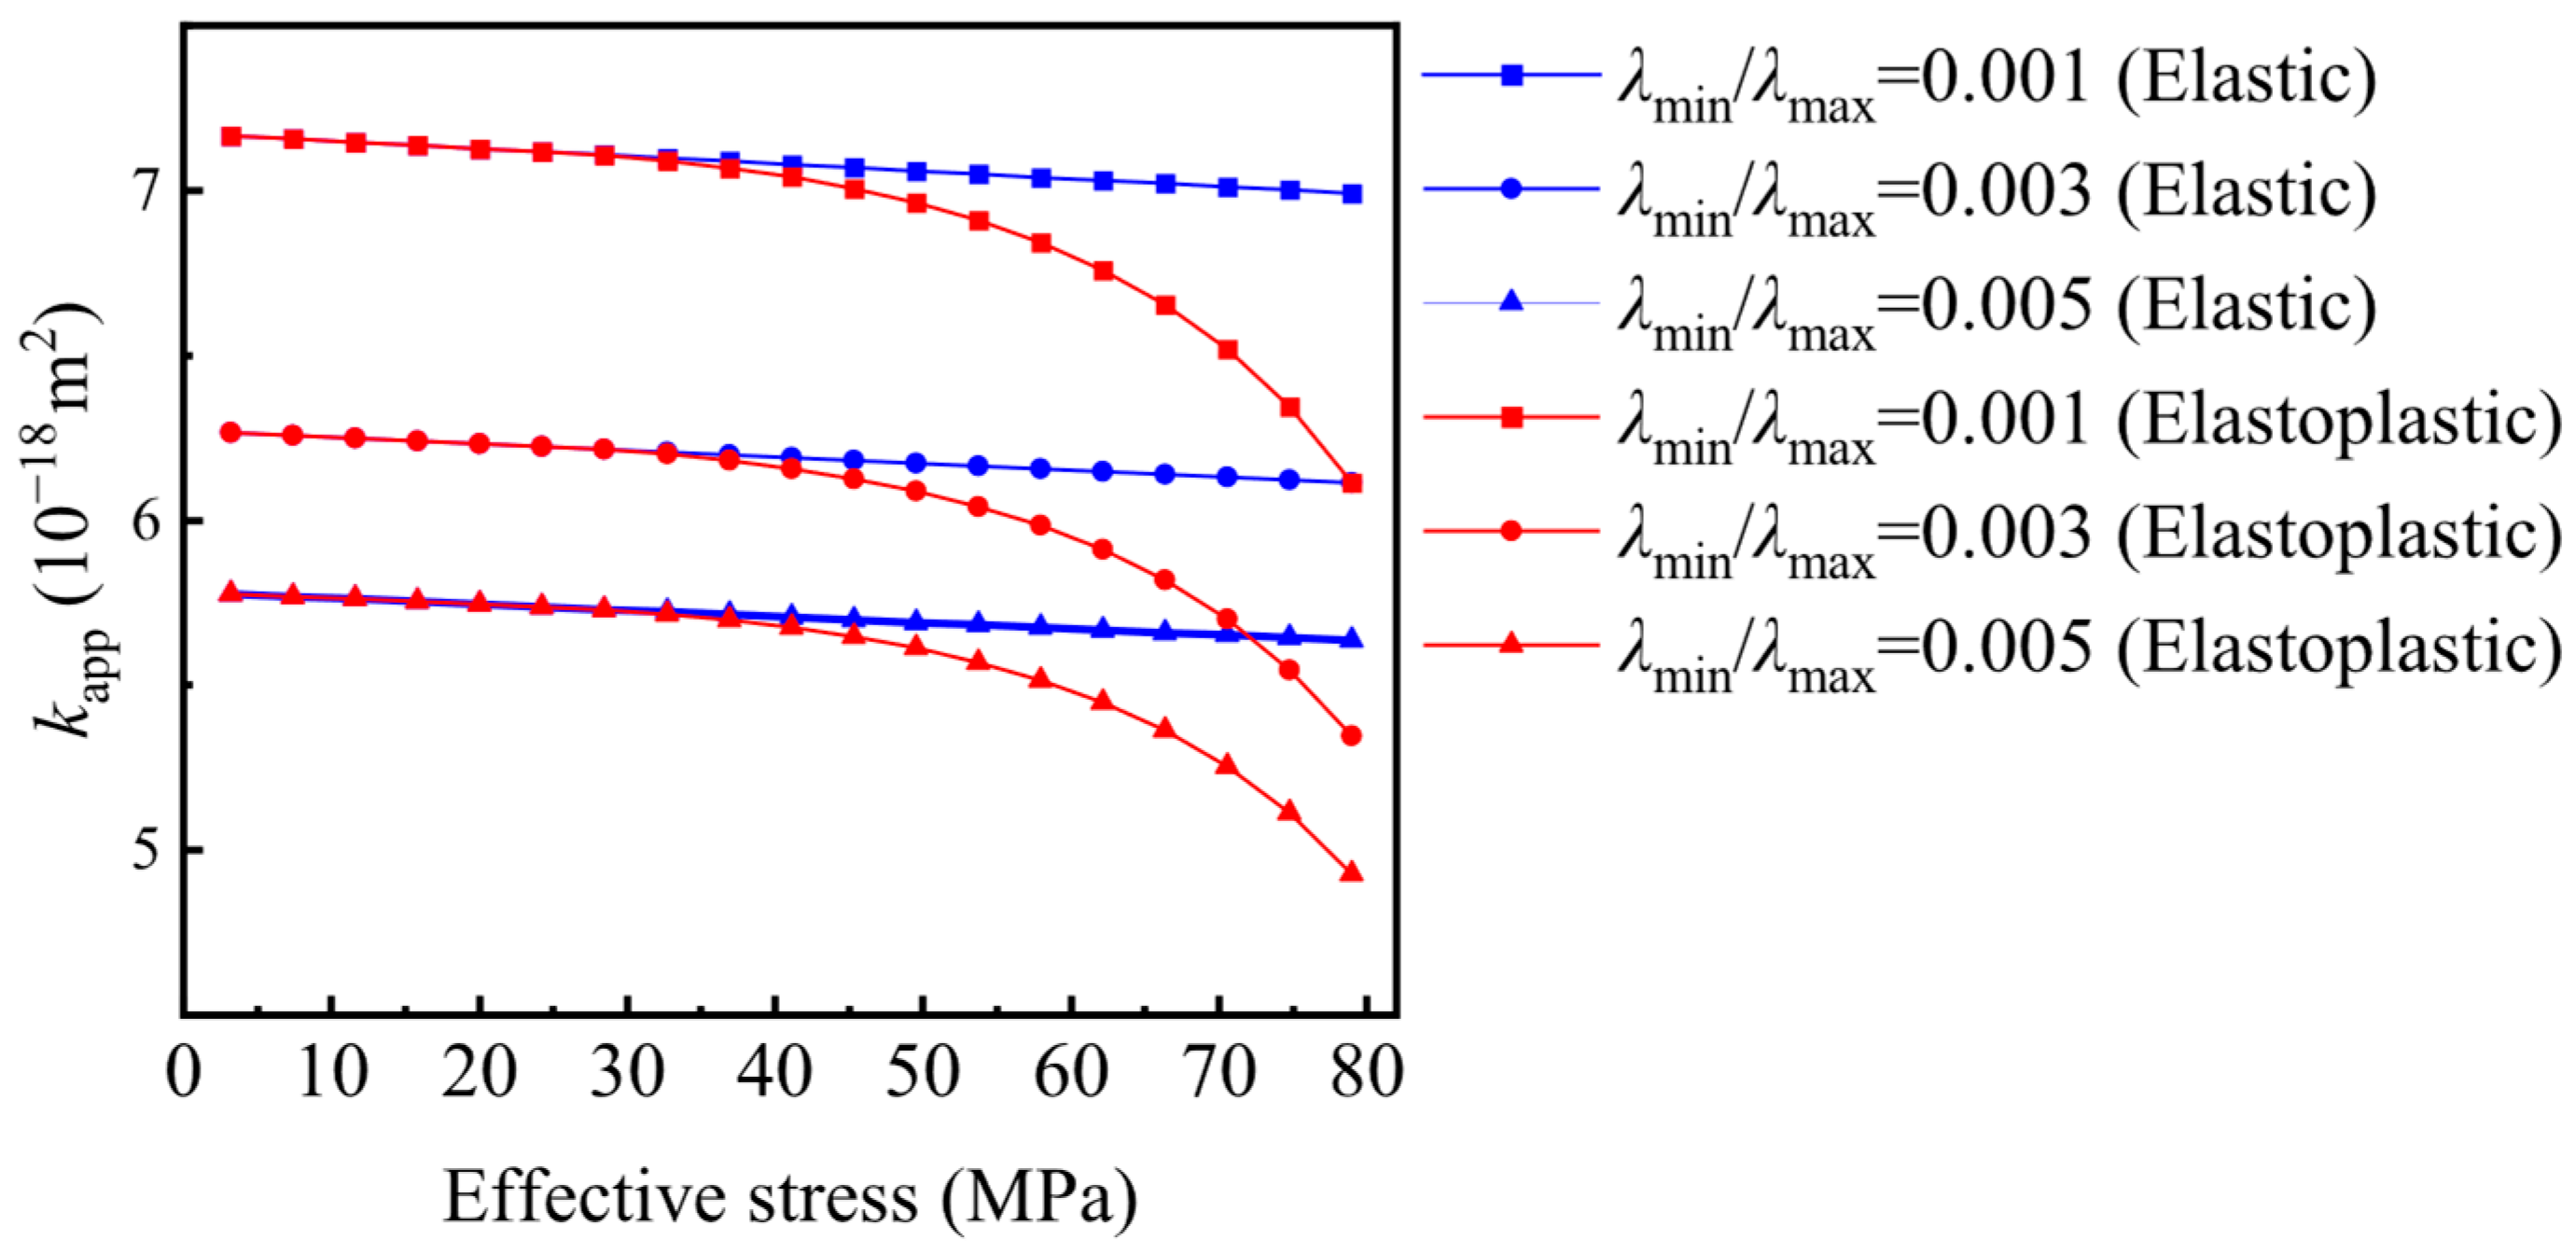
Figure 10 denotes the effect of effective stress on the shale gas’s apparent permeability at different ratios of minimum pore radius to maximum pore radius. As shown, a higher ratio of minimum pore radius to maximum pore radius corresponds to lower apparent gas permeability under the same effective stress. This phenomenon occurs because the reduction in pore radius is greater at higher effective stress levels. When stress exceeds the elastic limit, the permeability change from elastoplastic deformation surpasses that of elastic deformation under identical stress conditions. Consequently, shale gas’s apparent permeability decreases significantly with increasing pore radius fractal dimension. Whether shale is considered an elastic or a plastic medium also affects the evolution of permeability. The phenomenon is attributed to the fact that shale gas porous media with larger pore radius fractal dimensions have a larger pore space, resulting in smaller shale gas permeability at the same effective stress level. Additionally, plastic deformation induces larger pore radius strains than elastic deformation, amplifying permeability changes.
Based on Equations (49)–(51), the pore volume fractions of distinct flow mechanisms under varying effective stress conditions are numerically evaluated for both elastic and elastoplastic shale porous media, as presented in Figure 11, correspond to the viscous flow, transition flow, and Knudsen diffusion regions, respectively. The blue dotted line represents the elastic media, while the red dotted line represents the elastoplastic media.
(1)
For λmin/λmax = 0.001, the proportion of pore volume attributed to viscous flow decreases from 12.41% to 12.09%, transition flow increases from 47.54% to 47.71%, and Knudsen diffusion increases from 40.05% to 40.19% for elastic shale porous media. Similarly, the proportion of viscous flow pore volume decreases from 12.41% to 10.78%, transition flow increases from 47.54% to 48.43%, and Knudsen diffusion increases from 40.05% to 40.79% for elastoplastic shale porous media.
(2)
As for Figure 11b with λmin/λmax = 0.00, the pore volume proportion of viscous flow decreases from 15.08% to 14.71%, transition flow increases from 52.58% to 52.82% when shale porous media is considered as an elastic body. For the elastoplastic body, the proportion of viscous flow decreases from 15.08% to 13.13%, while the proportion of transition flow increases from 52.58% to 53.8%. The pore volume proportion of Knudsen diffusion increases from 32.34% to 32.48% for the elastic body and from 32.34% to 33.08% for the elastoplastic body.
(3)
For λmin/λmax = 0.005, for the elastic body, the proportion of the viscous flow region decreases from 16.66% to 16.24%, the transition flow region increases from 54.93% to 55.21%, and the Knudsen diffusion region increases from 28.41% to 28.55%, for elastoplastic body, the proportion of the viscous flow region decreases from 16.66% to 14.52%, the transition flow region increases from 54.93% to 56.35%, and the Knudsen diffusion region increases from 28.41% to 29.14%.
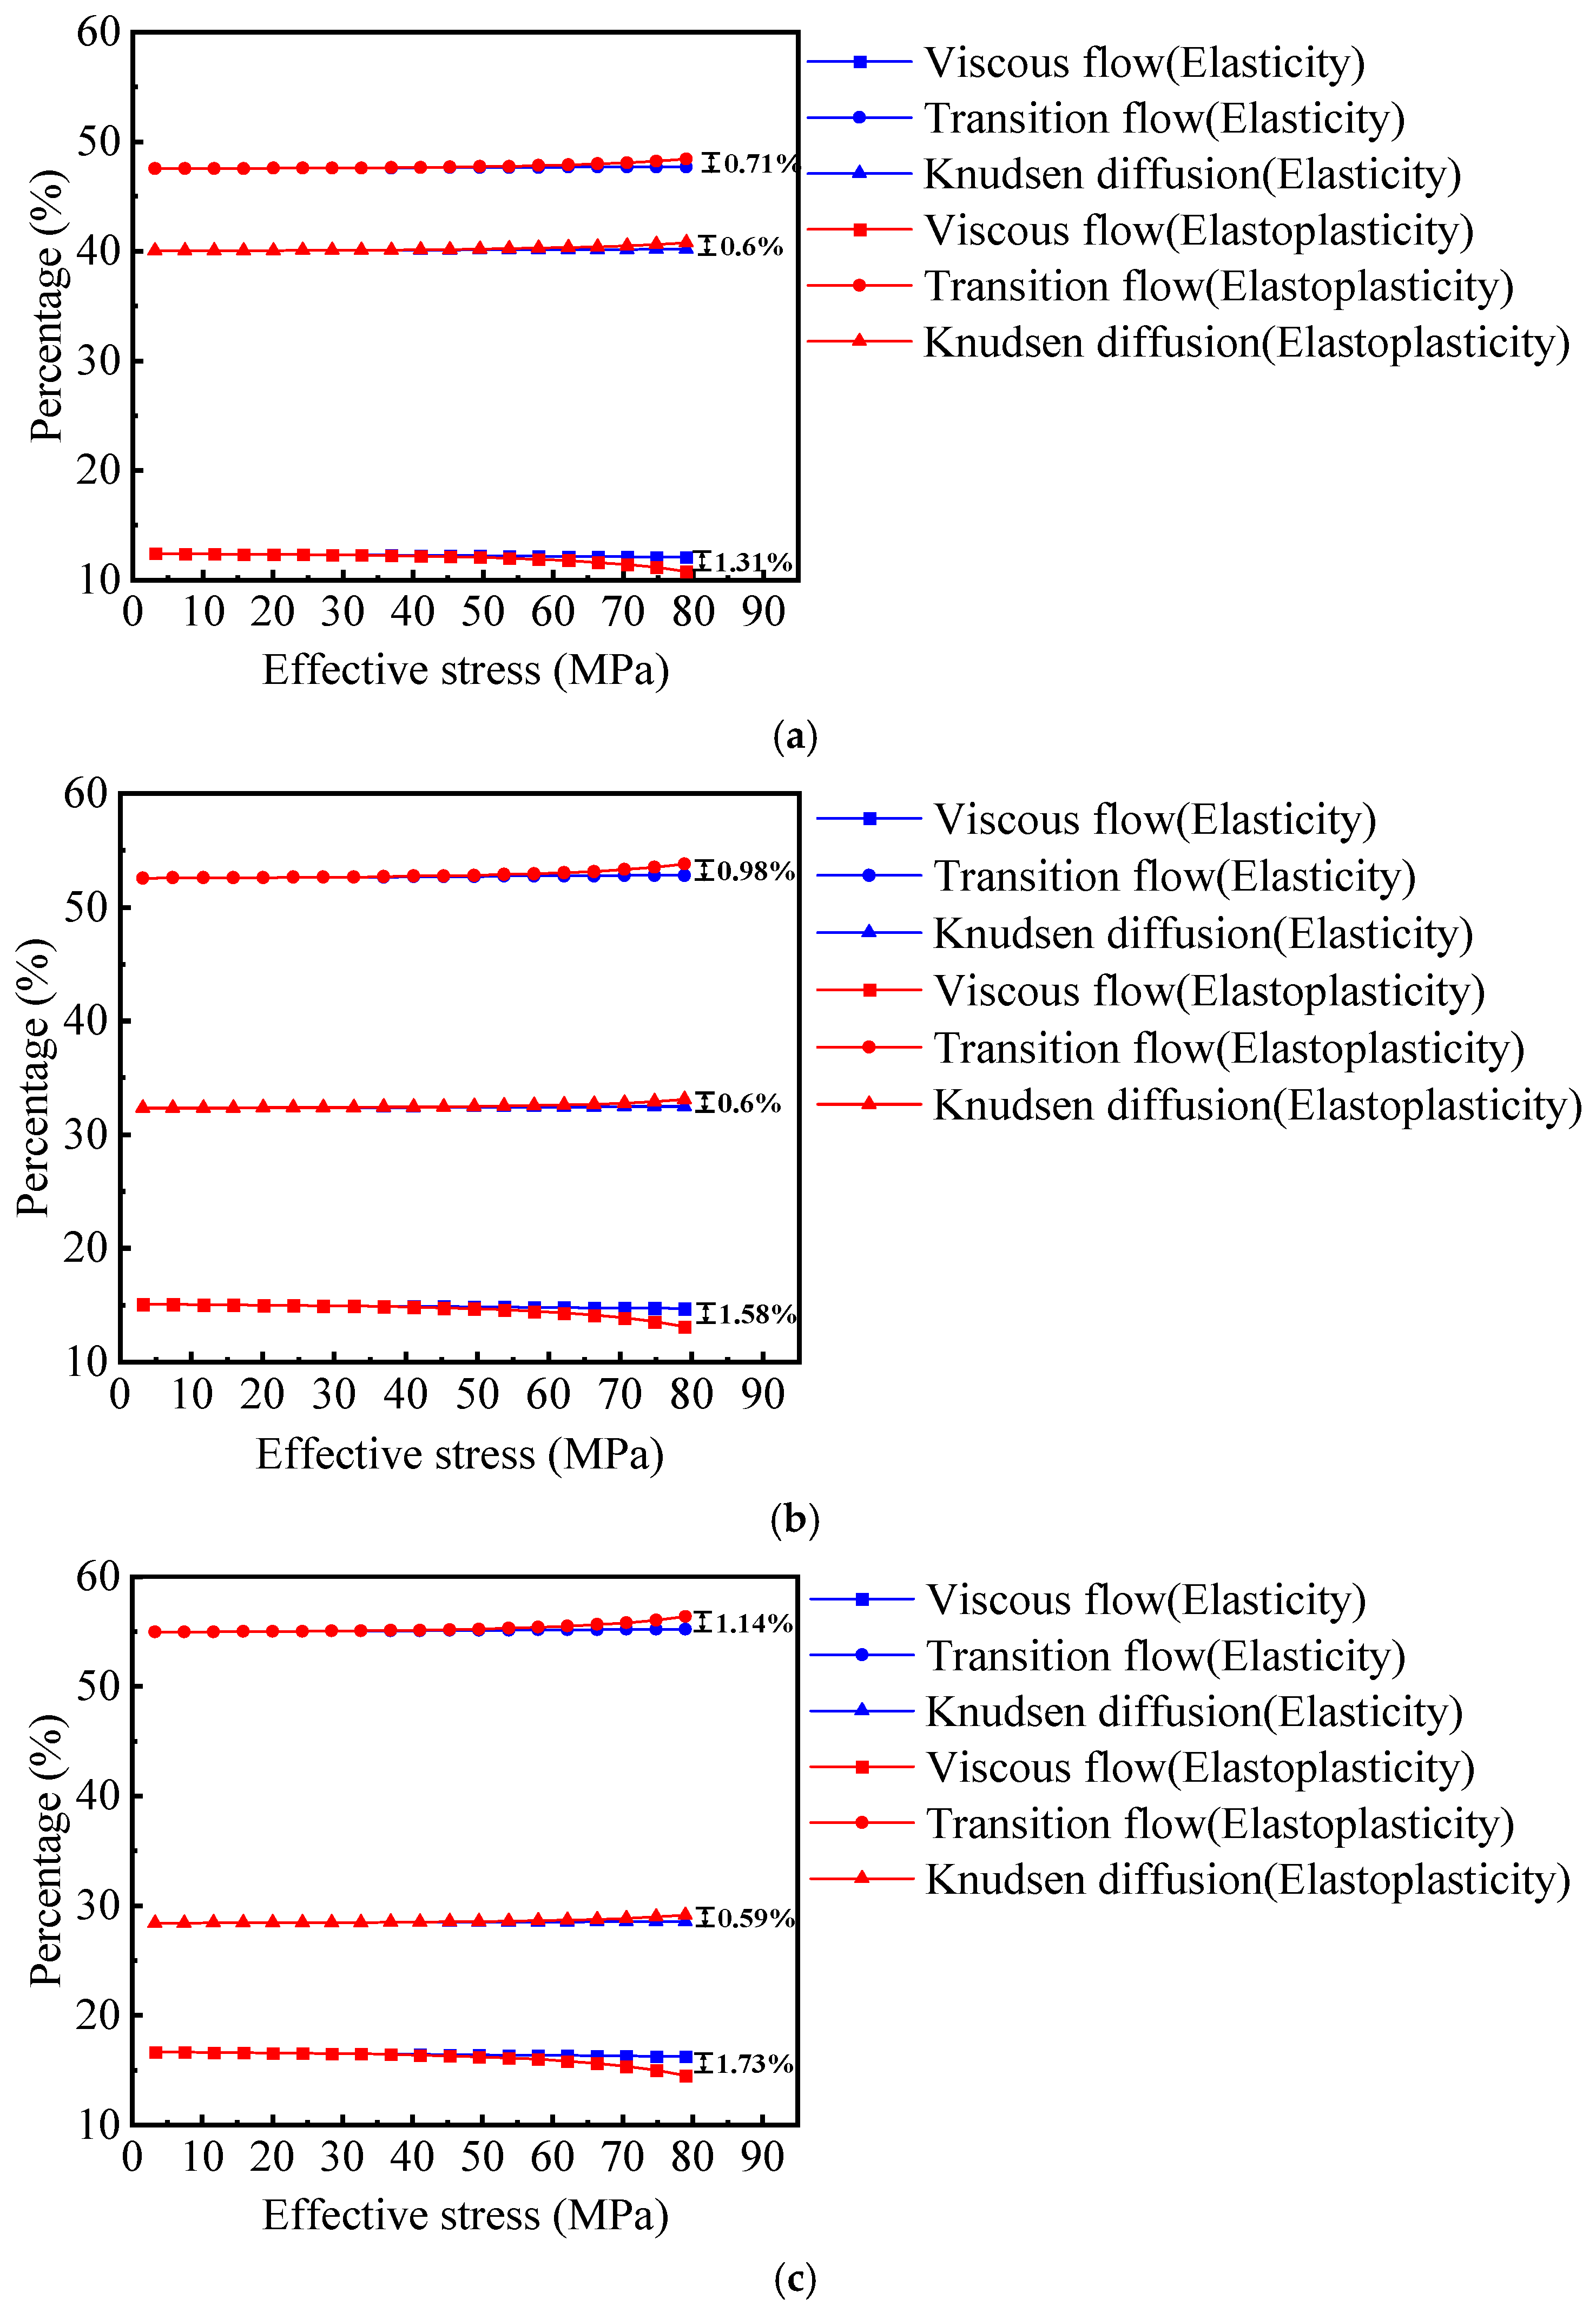
Figure 11. The relationship between the pore volume proportions of different flow mechanisms and effective stress when shale porous media is considered as an elastic body or an elastoplastic body: (a) λmin/λmax = 0.001; (b) λmin/λmax = 0.003; (c) λmin/λmax = 0.005.
Fractalfract 09 00526 g011
These trends indicate that increasing effective stress reduces the maximum pore radius, thereby diminishing the viscous flow domain while expanding the transition and Knudsen diffusion regions. Meanwhile, the number of capillary bundles in the transition flow and Knudsen diffusion regions increases, contributing to a higher volume fraction of these regions. During the plastic deformation of the rock sample, the strain exceeds that of elastic deformation, leading to more pronounced alterations in the proportions of various flow mechanisms compared to the elastic state.
Figure 12 illustrates the variations of shale gas apparent permeability with effective stress at different capillary tortuosity fractal dimensions. The results demonstrate that the apparent permeability of shale gas decreases with an increase in effective stress and capillary tortuosity fractal dimension. This trend can be explained by the fact that higher effective stress levels result in smaller shale gas permeability, leading to enhanced transport resistance through the shale matrix. A larger capillary tortuosity fractal dimension implies longer capillary lengths in shale porous media. Consequently, with an increased capillary tortuosity fractal dimension, the length of the flow path in shale porous media is also increased, leading to a decrease in shale gas apparent permeability. Figure 12 also reveals that shale gas apparent permeability is greatest when the capillary tortuosity fractal dimension tends to be 1. This suggests a more direct flow path with less tortuosity, resulting in higher permeability.
The percentage of different flow mechanisms at different capillary tortuosity fractal dimensions is illustrated in Figure 13. The effects of different fractal dimensions on various flow mechanisms vary with increasing effective stress.
(1)
For DT = 1.08, for the elastic porous media: the proportions of the viscous flow, transition flow, and Knudsen diffusion regions change slightly, from 16.74% to 16.33%, 55.05% to 55.32%, and 28.21% to 28.35%, respectively, for the elastoplastic porous media: the changes are more pronounced, the viscous flow region decreases from 16.74% to 14.59%, the transitional flow region increases from 55.05% to 56.47%, and the Knudsen diffusion region rises from 28.21% to 28.94%.
(2)
When DT increases to 1.15, for the elastic body, the proportions of the viscous flow, transition flow, and Knudsen diffusion regions change from 14.44% to 14.08%, 51.5% to 51.72%, and 34.06% to 34.21%, respectively. For the elastoplastic media, the viscous flow region decreases from 14.44% to 12.56%, the transitional flow region increases from 51.5% to 52.63%, and the Knudsen diffusion region increases from 34.06% to 34.81%.
(3)
When DT further increases to 1.2, for elastic media, the proportions of the viscous flow, transition flow, and Knudsen diffusion regions change from 12.75% to 12.43%, 48.28% to 48.45%, and 38.97% to 39.12%, respectively. However, for the elastoplastic porous media, the viscous flow region decreases more significantly, from 12.75% to 11.08%, the transition flow region increases from 48.28% to 49.2%, and the Knudsen diffusion region rises from 38.97% to 39.72%.
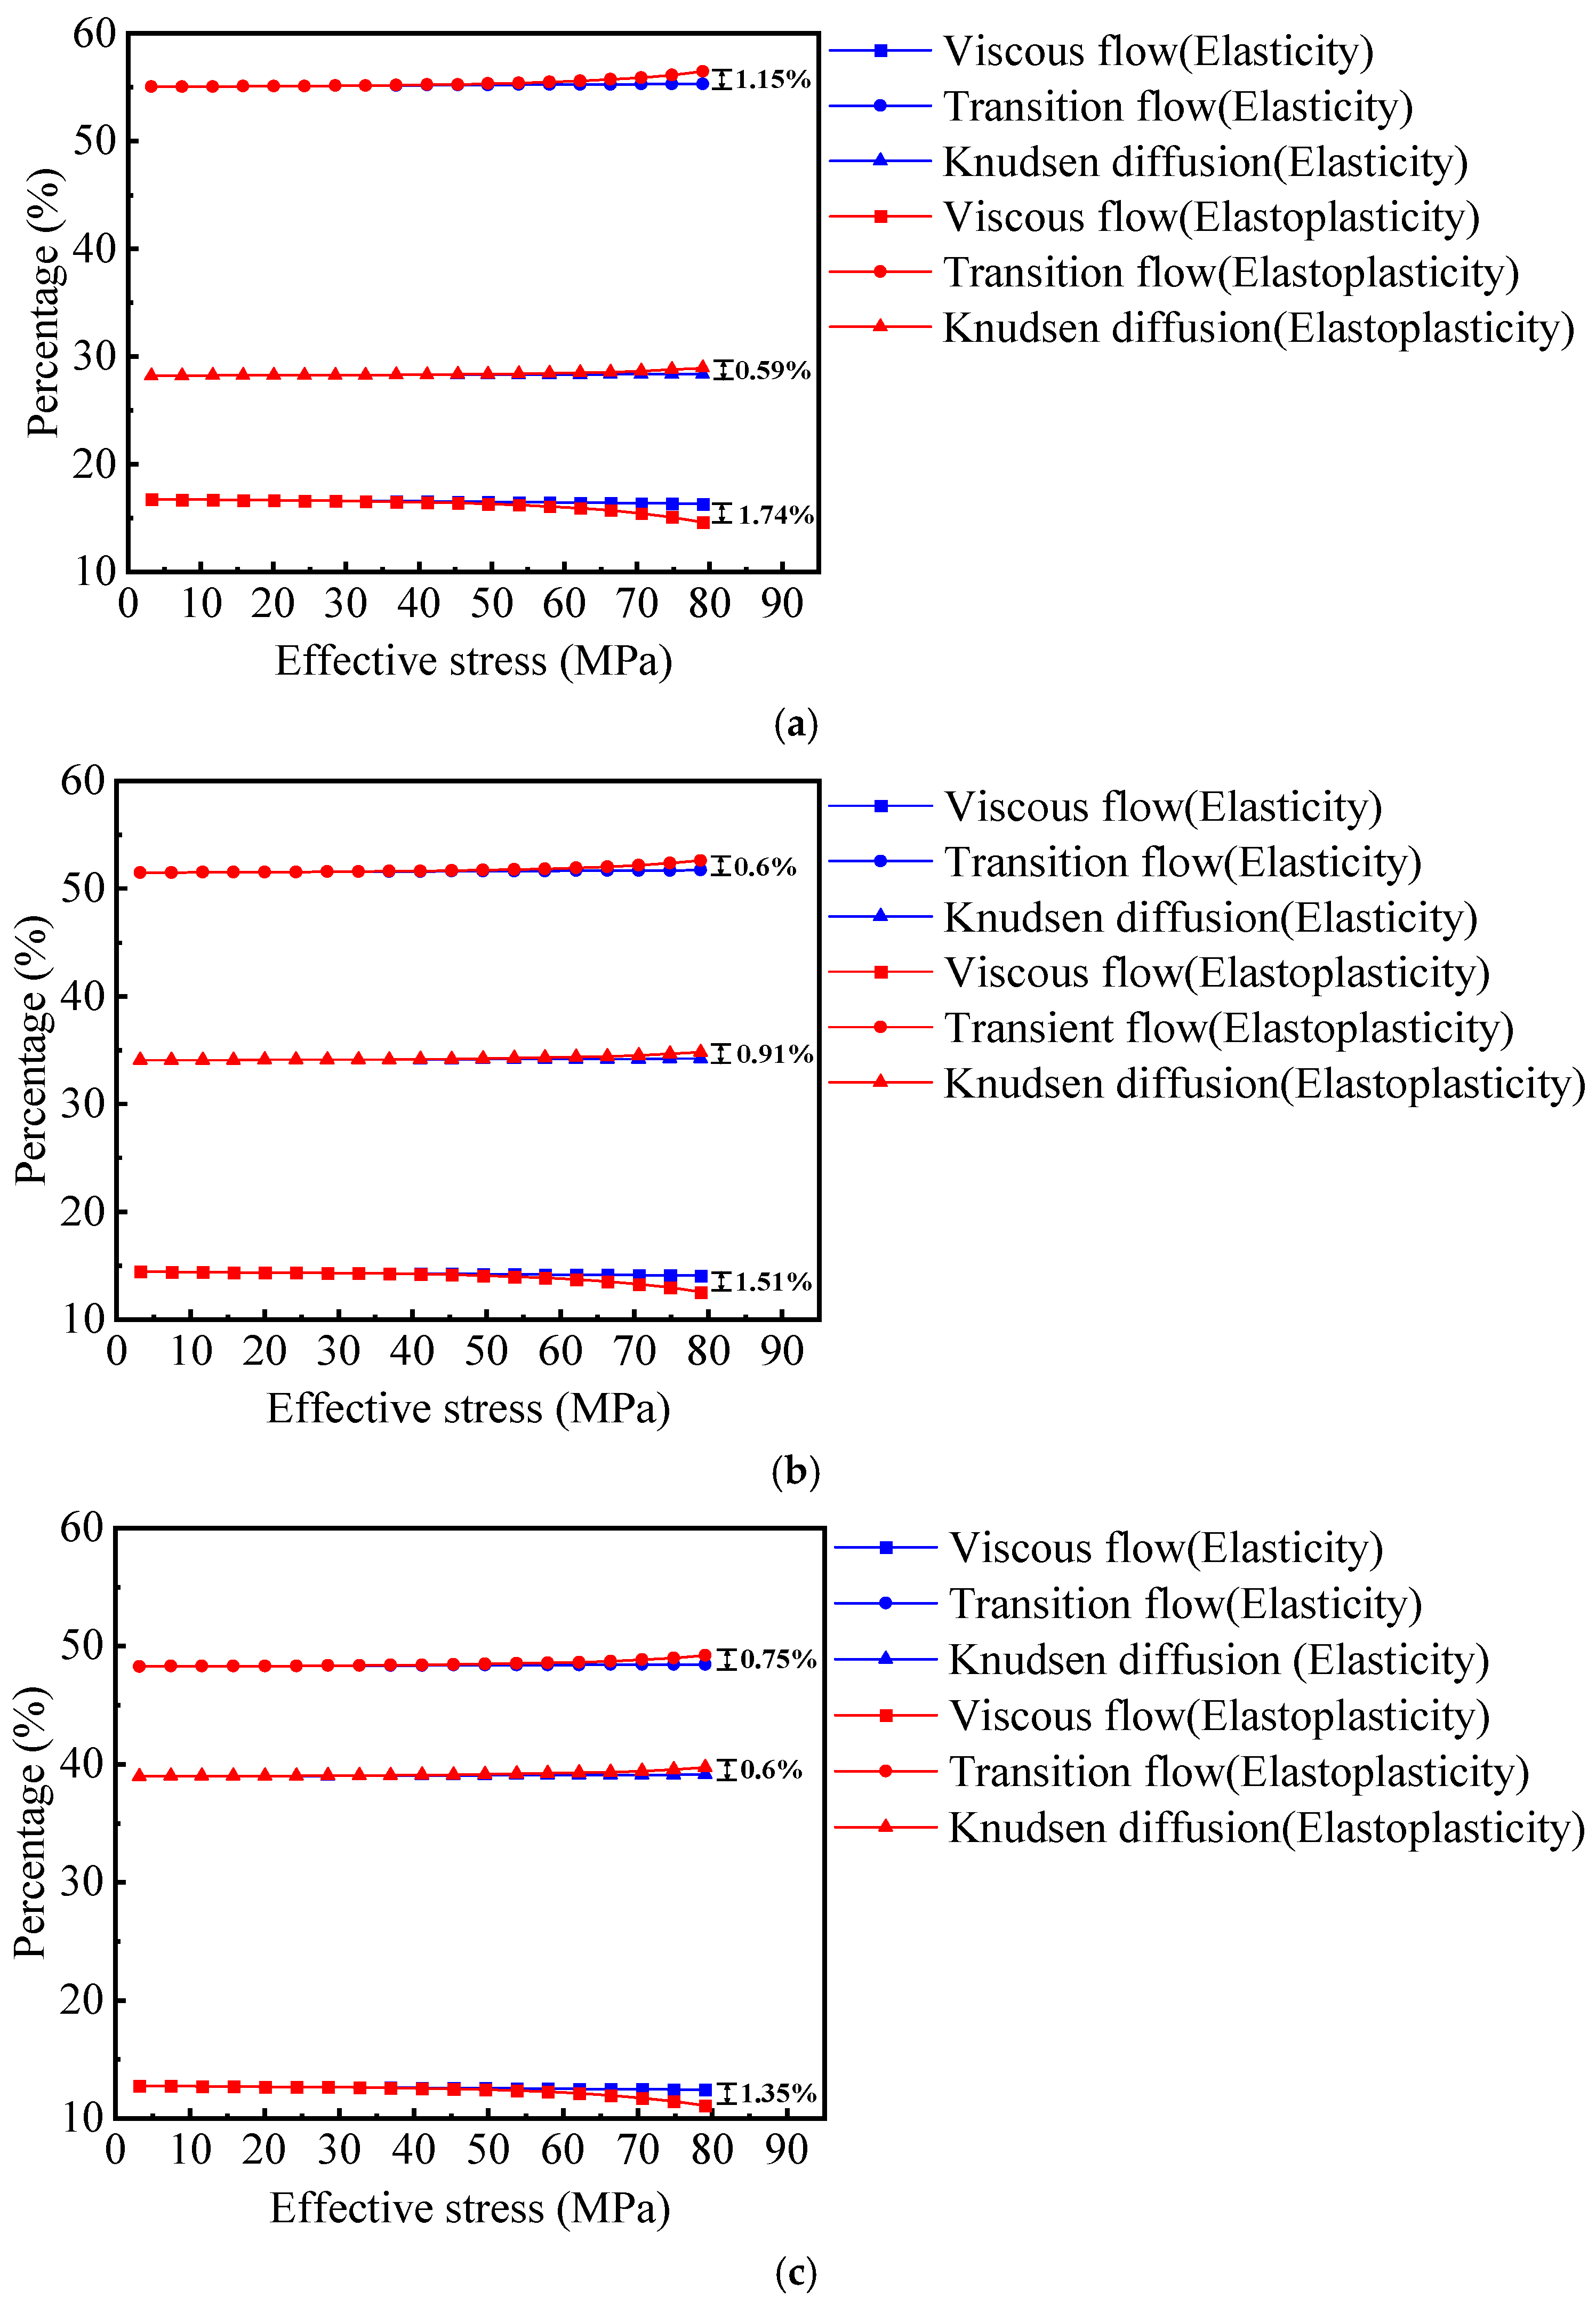
Figure 13. The relationship between the pore volume proportions of different flow mechanisms and effective stress when shale porous media is considered as an elastic body or an elastoplastic body: (a) DT = 1.08; (b) DT = 1.15; (c) DT = 1.2.
Fractalfract 09 00526 g013
As the capillary tortuosity fractal dimension increases, derived from Equation (7), the capillary bundles become smaller and longer, resulting in a higher proportion of the Knudsen diffusion region. Additionally, increasing effective stress reduces the capillary radius, decreasing the proportions of the viscous flow and transition flow regions while increasing the proportion of capillary bundles in the Knudsen diffusion region. Notably, during elastic deformation, the plastic strain exceeds the elastic strain, leading to more pronounced shifts in regional proportions compared to the elastic deformation regime.
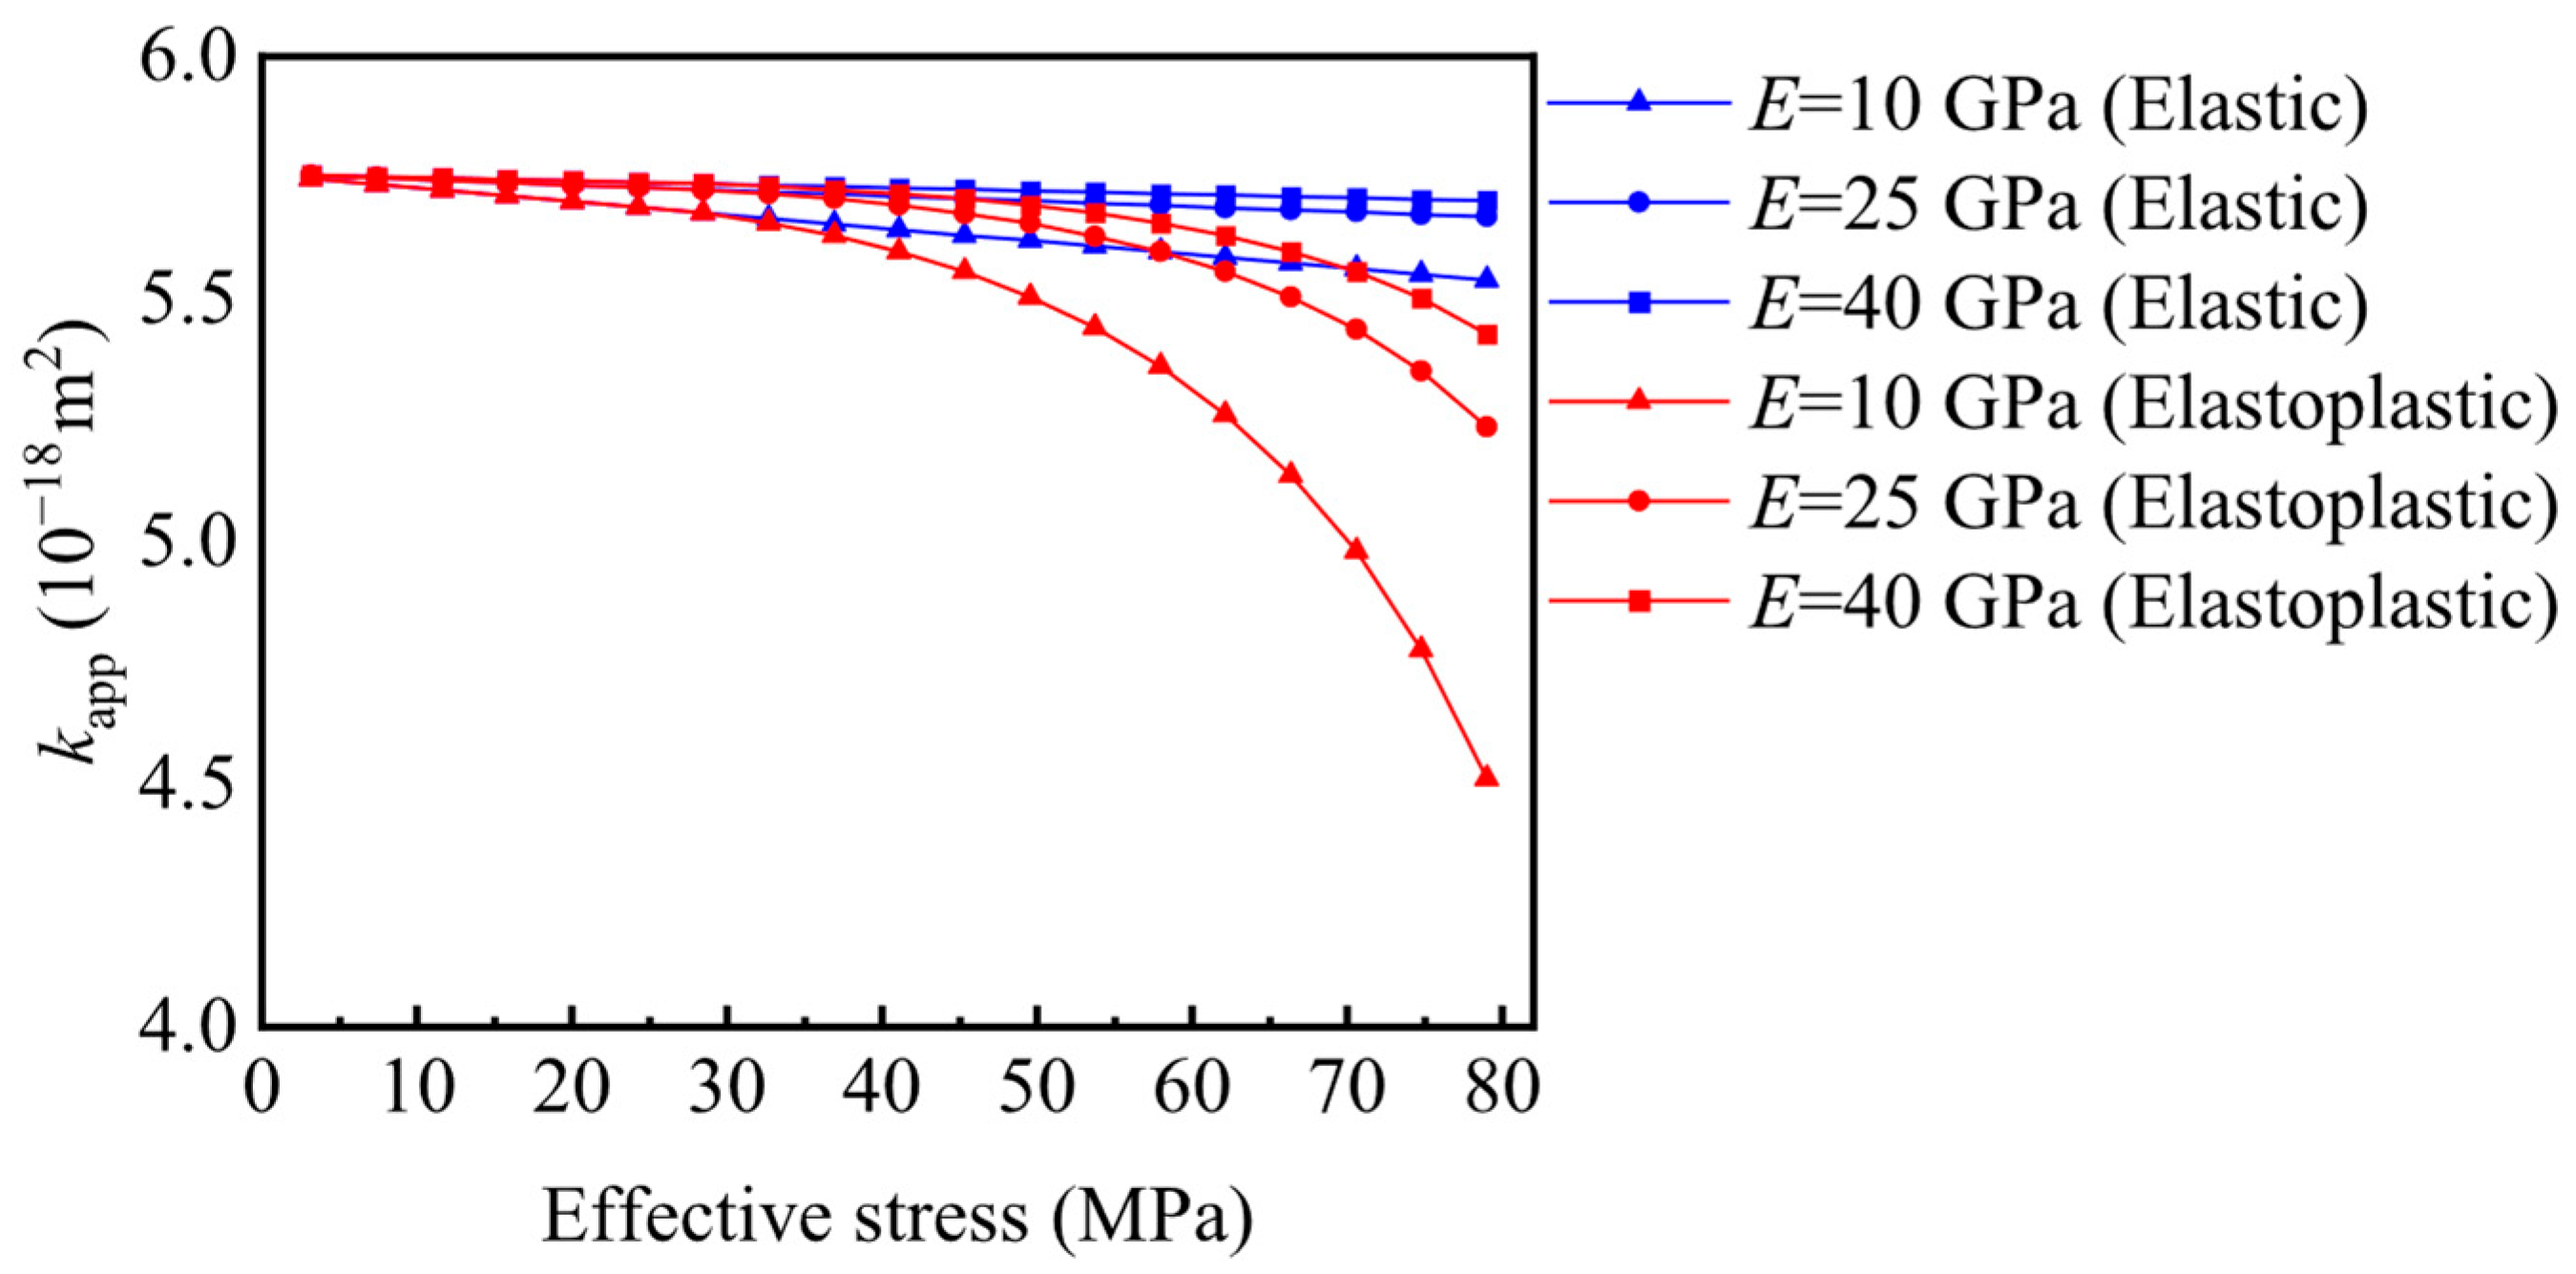
Figure 14 shows that the apparent gas permeability of shale gas varies with effective stress under varying Young’s modulus conditions. It is observed that with an increase in effective stress, the shale gas apparent permeability follows an opposite trend, decreasing. This phenomenon can be interpreted as follows: increased effective stress causes the size of capillary pore radius to decrease. Young’s modulus, which quantifies the stiffness of shale gas rock, plays a critical role in this relationship. A larger Young’s modulus indicates that the capillary pore space is more resistant to contraction, allowing more shale gas to flow through the shale porous media at the same effective stress. Therefore, the apparent permeability of shale gas increases with Young’s modulus. The relationship between the regional proportions of different flow mechanisms and effective stress under various Young’s moduli is illustrated in Figure 15.
(1)
For E = 10 GPa, Elastic media: viscous flow, transition flow, and Knudsen diffusion regions decrease from 16.73% to 16.11%, increase from 55.05% to 55.48%, and increase from 28.21% to 28.43%, respectively. In contrast, for the elastoplastic shale porous media, the viscous flow region decreases from 16.73% to 13.44%. In comparison, the transition flow region increases from 55.05% to 57.23%, and the Knudsen diffusion region increases from 28.22% to 29.33%.
(2)
When E = 25 GPa, for the elastic media, the viscous flow, transition flow region, and Knudsen diffusion regions change from 16.75% to 16.5%, 55.04% to 55.21%, and 28.21% to 28.29%, respectively. For the elastoplastic porous media, the viscous flow region decreases from 16.75% to 15.48%, the transition flow region increases from 55.04% to 55.88%, and the Knudsen diffusion region increases from 28.21% to 28.64%.
(3)
When Young’s modulus increases to E = 40 GPa, for the elastic media, the proportions of the viscous flow region, transition flow region, and Knudsen diffusion region decreases from 16.75% to 16.60%, increase from 55.04% to 55.14%, and increase from 28.21% to 28.26%, respectively. For the elastoplastic porous media, the viscous flow region decreases from 16.75% to 15.97%, the transition flow region increases from 55.04% to 55.56%, and the Knudsen diffusion region rises from 28.21% to 28.47%.
As Young’s modulus increases, the shale rock sample exhibits higher stiffness and lower compressibility, resulting in reduced variations in the volume fractions of distinct flow regions. Under identical stress conditions, plastic strain exceeds elastic strain, thereby inducing more pronounced alterations in the regional proportions of flow mechanisms during plastic deformation.
Figure 16 illustrates the impact of varying temperatures on the apparent permeability of shale gas under different effective stress conditions. The figure shows that shale gas’s apparent permeability decreases with increasing effective stress but increases with rising temperature. In this case, a trend is primarily governed by temperature-induced changes in Knudsen diffusion. This indicates that Knudsen diffusion contributes more significantly to apparent permeability at higher temperatures, as elevated temperatures enhance molecular motion rates, enabling faster gas transport through the porous matrix under the same effective stress. Figure 17 depicts the evolution of pore volume fractions for viscous flow, transition flow, and Knudsen diffusion with effective stress at various temperatures.
(1)
At 300 K, as stress increases, the proportions of flow mechanisms vary depending on whether the shale is considered an elastic or elastoplastic material. During elastic deformation, the proportion of viscous flow decreases from 16.74% to 16.33%, transition flow increases from 55.05% to 55.32%, and Knudsen diffusion increases from 28.21% to 28.35%. For elastoplastic deformation, viscous flow decreases to 14.59%, transition flow increases to 56.47%, and Knudsen diffusion increases to 28.94%.
(2)
At 353 K, for the elastic body, the proportion of viscous flow decreases from 10.13% to 9.68%, transition flow increases from 59.42% to 59.72%, and Knudsen diffusion increases from 30.45% to 30.61%. For the elastoplastic body, viscous flow decreases from 10.13% to 7.8%, transition flow increases from 59.42% to 60.96%, and Knudsen diffusion increases from 30.45% to 31.24%.
(3)
At 403 K, for the elastic body, the proportion of viscous flow decreases from 4.35% to 3.86%, transition flow increases from 63.24% to 63.54%, and Knudsen diffusion increases from 32.41% to 32.57%. For the elastoplastic body, viscous flow decreases dramatically, from 4.35% to 1.89%, while transition flow increases, from 63.24% to 64.87%, and Knudsen diffusion increases, from 30.41% to 33.25%.
As the temperature increases, the average free molecular path lg increases. According to Equations (42) and (43), this increase in characteristic length reduces the proportion of the viscous flow region while enhancing the fractions of Knudsen diffusion and transitional flow regions. Notably, under identical stress conditions, the shifts in proportions within the plastic deformation regime are more pronounced than those in the purely elastic regime.

5. Conclusions

This study proposes a novel theoretical model to characterize the stress-dependent apparent gas permeability of deep shale gas reservoirs. The model incorporates the effects of viscous flow, transition flow, Knudsen diffusion, surface diffusion, real gas effects, and the slippage effect and can be capable of studying the elastoplastic deformation behavior of deep shale gas media. Based on the proposed characteristic pore radius, the total gas flux formula is derived using the fractal law, and the equation of apparent gas permeability is obtained in accordance with generalized Darcy’s law. The influence of elastoplastic deformation behavior of deep shale gas on apparent gas permeability and the variation of pore volume proportion for various flow mechanisms with stress are studied based on the established mathematical model. Each parameter in the model retains clear physical significance. Validation against experimental data demonstrates the model’s high accuracy and strong consistency with existing literature, yielding several key findings:
  • At constant effective stress, shale gas apparent permeability increases with pore radius fractal dimension, temperature, and Young’s modulus, but decreases with capillary tortuosity fractal dimension.
  • During plastic deformation, plastic strain surpasses elastic strain, leading to more pronounced permeability variations and more significant shifts in pore volume contributions among flow mechanisms compared to purely elastic deformation.
Finally, these results offer critical insights into the transport mechanisms of deep shale gas reservoirs and enhance understanding of stress-dependent permeability. However, it should be noted that the effects of multi-layer adsorption of shale gas were not considered in this study, as it solely focused on the single gas component of shale gas without accounting for the effects of multicomponent gases. These effects will be addressed in future research. And the model is based on the following assumptions, which should be carefully considered by researchers when citing or applying it.
  • When the shale core sample is subjected to external circumferential pressure, the internal capillaries experience a uniform force.
  • The total number of internal capillaries remains constant even after the core sample is deformed by the applied force.
  • During the unloading process of a core sample subjected to peripheral pressure, the capillaries that have undergone plastic deformation do not recover.
  • The stress-strain relationship and gas transport properties of the core sample remain in a steady state.
  • The shale core sample ideally exhibits elastic-plastic behavior and does not undergo brittle changes.

Author Contributions

Conceptualization, X.Z. (Xu Zhou), Z.H., A.L., J.Y. and X.Z. (Xu Zhang); methodology, X.Z. (Xu Zhou), A.L. and J.Y.; software, X.Z. (Xu Zhou) and Z.H.; validation, X.Z. (Xu Zhou), Z.H., A.L. and J.Y.; resources, A.L. and J.Y.; data curation, Z.H.; writing—original draft preparation, X.Z. (Xu Zhou); writing—review and editing, X.Z. (Xu Zhang); funding acquisition, Z.H. All authors have read and agreed to the published version of the manuscript.

Funding

This research was funded by the National Natural Science Foundation of China Enterprise Innovation and Development Joint Fund Project (No. U24B6001).

Data Availability Statement

The data presented in this study are available on request from the corresponding author due to reasonable request.

Conflicts of Interest

The authors declare no conflicts of interest.

Abbreviations

AsSurface diffusion cross-sectional area
bSlip factor
ΔCConcentration difference
CsMaximum adsorption capacity at constant temperature and infinite high pressure
Cλ, C, CThe variation of the inner radius of capillary
Ds, D s 0 Effective surface diffusion coefficient and surface diffusion coefficient with “0” gas coverage
Df, Df0, Dfσ, DTFractal dimension, Fractal dimension without stress, Fractal dimension with stress, and fractal dimension of capillary tortuosity
EYoung’s modulus
ΔHIsosteric adsorption heat
KB, KnBoltzmann constant and Knudsen number
lgThe free path length of gas molecules
LCharacteristic length of the shale gas rock sample
Lpσ, L0Length of capillary with stress and length of capillary without stress
N, N0, NσCumulative number of capillaries, Cumulative number of capillaries without stress, and Cumulative number of capillaries with stress
PrThe dimensionless pseudo-pressure
ΔpPressure differential
pi, po, pL, pThe pressure of the fluid inside the capillary and the external pressure, Langmuir pressure, and shale gas reservoir pressure
RGas constant
Rσ, R0The radius of the rock sample changes with stress, and the initial radius without stress
T, TrAbsolute temperature and the dimensionless pseudo-temperature
tThe ratio of the outer radius of the capillary to the inner radius
Capillary outer radius
ZGas dimensionless compressibility factor
σe, σp, σλElastic limit stress, plastic limit stress, and effective stress
λCapillary inner radius
λ0, λσThe inner radius of the capillary without stress and with stress
λK, λPCharacteristic pore radius
λeEffective capillary pore radius
λmax, λminMaximum effective pore radius and minimum pore radius
λmaxσ, λminσMaximum effective pore radius and minimum pore radius with stress
νPoisson’s ratio
μgGas viscosity
ρgGas density
ρRatio of the radius at the junction of the elastic zone and the plastic zones to the inner radius of the capillary
δgMolecular collision diameter of gas molecules
αRarefaction coefficient
θSurface coverage of the adsorption gas under the equilibrium condition
κb, κmThe blocking coefficient of surface gas molecules and the rate constant for forward migration

Appendix A

The Appendix A is a section that contain detailed derivations of Equations (44)–(47) and Equations (49)–(51). The specific derivation process is as follows:
k app σ = k v s σ + k vk σ + k k σ + k d σ = Q σ μ g L 0 A σ Δ p = Q vs σ μ g L A σ Δ p + Q vk σ μ g L A σ Δ p + Q k σ μ g L A σ Δ p + Q d σ μ g L A σ Δ p
k v s σ = π D f Δ p λ max D f 1 + C λ 3 + D T 2 4 D T μ g L 0 D T 3 + D T D f 1 1 ν σ E λ max 3 + D T D f λ P 3 + D T D f + 8 l g π D f Δ p λ max D f 1 + C λ 2 + D T 2 4 D T μ g L 0 D T 2 + D T D f 1 1 ν σ E λ max 3 + D T D f λ P 3 + D T D f μ g L 0 π 1 + σ E R 0 2 Δ p = D f λ max D f 1 + C λ 3 + D T 2 4 D T R 0 2 L 0 D T 1 3 + D T D f 1 1 ν σ E 1 + σ E 2 λ max 3 + D T D f λ P 3 + D T D f + 8 l g D f λ max D f 1 + C λ 2 + D T 2 4 D T R 0 2 L 0 D T 1 2 + D T D f 1 1 ν σ E 1 + σ E 2 λ max 3 + D T D f λ P 3 + D T D f
k vk σ = 2 D T π D f λ max D f Δ p 1 + C λ 2 + D T 3 p L 0 D T 2 + D T D f 1 1 ν σ E 8 Z R T π M λ P 2 + D T D f λ K 2 + D T D f π D f Δ p λ max D f 1 + C λ 3 + D T 2 4 D T μ g L 0 D T 3 + D T D f 1 1 ν σ E λ P 3 + D T D f λ K 3 + D T D f + 8 l g π D f Δ p λ max D f 1 + C λ 2 + D T 2 4 D T μ g L 0 D T 2 + D T D f 1 1 ν σ E λ P 2 + D T D f λ K 2 + D T D f μ g L 0 π 1 + σ E R 0 2 Δ p = 2 D T μ g D f λ max D f 1 + C λ 2 + D T 3 R 0 2 p L 0 D T 1 2 + D T D f 1 1 ν σ E 1 + σ E 2 8 Z R T π M λ P 2 + D T D f λ K 2 + D T D f + D f λ max D f 1 + C λ 3 + D T 2 4 D T R 0 2 L 0 D T 1 3 + D T D f 1 1 ν σ E 1 + σ E 2 λ P 3 + D T D f λ K 3 + D T D f + 8 l g D f λ max D f 1 + C λ 2 + D T 2 4 D T R 0 2 L 0 D T 1 2 + D T D f 1 1 ν σ E 1 + σ E 2 λ P 2 + D T D f λ K 2 + D T D f
k k σ = 2 D T π D f λ max D f Δ p 1 + C λ 2 + D T 3 p L 0 D T 2 + D T D f 1 1 ν σ E 8 Z R T π M λ K 2 + D T D f μ g L 0 π 1 + σ E R 0 2 Δ p = 2 D T μ g D f λ max D f 1 + C λ 2 + D T 3 R 0 2 p L 0 D T 1 2 + D T D f 1 1 ν σ E 1 + σ E 2 8 Z R T π M λ K 2 + D T D f
k d σ = 2 D T π θ d m D s C L Z 2 p L Z p L p Z p R T Δ p D f λ max D T 1 + C λ D T p Z p L + p 2 L 0 D T D T D f 1 1 ν σ E 1 λ min λ max D T D f π θ 2 d m 2 D s C L Z 2 p L Z p L p Z p R T Δ p D f λ max D T 1 2 1 D T p Z p L + p 2 L 0 D T D T D f 1 1 1 ν σ E 1 λ min λ max D T D f 1 μ g L 0 π 1 + σ E R 0 2 Δ p = 2 D T μ g θ d m D s C L Z 2 p L Z p L p Z p R T D f λ max D T 1 + C λ D T p R 0 2 Z p L + p 2 L 0 D T 1 D T D f 1 1 ν σ E 1 + σ E 2 1 λ min λ max D T D f μ g θ 2 d m 2 D s C L Z 2 p L Z p L p Z p R T D f λ max D T 1 2 1 D T p R 0 2 Z p L + p 2 L 0 D T 1 D T D f 1 1 1 ν σ E 1 + σ E 2 1 λ min λ max D T D f 1
η v s = V v s σ V p σ × 100 % = 2 1 D T π D f L 0 D T λ max D f 1 1 ν σ E 3 D T D f λ max σ 3 D T D f λ P 3 D T D f 2 1 D T π D f L 0 D T λ max D f 1 1 ν σ E 3 D T D f λ max σ 3 D T D f λ min σ 3 D T D f = λ max σ 3 D T D f λ P 3 D T D ff λ max σ 3 D T D f λ min σ 3 D T D f × 100 %
η v k = V v k σ V p σ × 100 % = 2 1 D T π D f L 0 D T λ max D f 1 1 ν σ E 3 D T D f λ P 3 D T D f λ K 3 D T D f 2 1 D T π D f L 0 D T λ max D f 1 1 ν σ E 3 D T D f λ max σ 3 D T D f λ min σ 3 D T D f = λ P 3 D T D f λ K 3 D T D f λ max σ 3 D T D f λ min σ 3 D T D f × 100 %
η k = V k σ V p σ × 100 % = 2 1 D T π D f L 0 D T λ max D f 1 1 ν σ E 3 D T D f λ K 3 D T D f λ min σ 3 D T D f 2 1 D T π D f L 0 D T λ max D f 1 1 ν σ E 3 D T D f λ max σ 3 D T D f λ min σ 3 D T D f = λ K 3 D T D f λ min σ 3 D T D f λ max σ 3 D T D f λ min σ 3 D T D f × 100 %

Appendix B

The Appendix B is a section that contain the related data used in Section 4.1 to verify the permeability sensitivity of shale gas porous media in Figure 4, Figure 6b and Figure 8b.
Table A1. Experimental data in Figure 4.
ppore = 0.4 MPappore = 1.2 MPappore = 1.6 MPa
Effective Stress
(MPa)
Kapp
(10−18 m2)
Effective Stress
(MPa)
Kapp
(10−18 m2)
Effective Stress
(MPa)
Kapp
(10−18 m2)
8.796.638.125.628.674.9
10.436.4510.955.3710.474.76
12.616.2212.915.1912.254.62
15.225.9615.524.9614.034.49
17.745.7218.154.7416.124.34
20.115.5122.764.3819.254.13
23.565.2125.594.1722.753.9
26.664.9427.354.0425.343.74
28.844.7628.953.9527.13.61
Table A2. Simulation data in Figure 4.
ppore = 0.4 MPappore = 1.2 MPappore = 1.6 MPa
Effective Stress
(MPa)
Kapp
(10−18 m2)
Effective Stress
(MPa)
Kapp
(10−18 m2)
Effective Stress
(MPa)
Kapp
(10−18 m2)
1.587.481.586.221.585.52
3.167.283.166.063.165.37
4.747.094.745.904.745.23
6.326.916.325.746.325.10
7.896.737.895.597.894.96
9.476.559.475.459.474.83
11.056.3811.055.3011.054.70
12.636.2112.635.1612.634.58
14.216.0414.215.0214.214.46
15.795.8815.794.8915.794.34
17.375.7217.374.7617.374.22
18.955.5718.954.6318.954.11
20.535.4120.534.5020.534.00
22.115.2722.114.3822.113.89
23.685.1223.684.2623.683.78
25.264.9825.264.1425.263.67
26.844.8426.844.0326.843.57
28.424.7128.423.9128.423.47
304.58303.80303.38
Table A3. Experimental and simulation data in Figure 6b.
Experimental DataSimulation Data
Effective Stress
(MPa)
Unloading Kapp
(10−18 m2)
Loading Kapp
(10−18 m2)
Effective Stress
(MPa)
Unloading Kapp
(10−18 m2)
Loading Kapp
(10−18 m2)
250.05410.0368150.09510.0700
300.045250.0304180.07920.0585
350.03520.0289210.06780.0503
400.031780.0246230.05930.0442
450.030460.0239260.05260.0394
500.027330.0205290.04730.0356
550.025450.0199320.04300.0325
600.023860.0187350.03940.0299
650.02150.0183380.03640.0277
700.02130.0178410.03380.0259
750.01890.0172440.03150.0243
800.01850.0168470.02950.0229
850.01730.0173500.02780.0217
---530.02620.0206
---560.02480.0196
---590.02360.0188
---620.02250.0180
---640.02140.0173
---670.02050.0167
---700.01960.0162
---730.01890.0158
---760.01810.0154
---790.01750.0152
---820.01630.0151
---850.01500.0150
Table A4. Experimental and simulation data in Figure 8b.
Experimental DataSimulation Data
Effective Stress
(MPa)
Unloading Kapp
(10−18 m2)
Loading Kapp
(10−18 m2)
Effective Stress
(MPa)
Unloading Kapp
(10−18 m2)
Loading Kapp
(10−18 m2)
200.04500.0273120.07900.0642
300.02510.0201150.06290.0513
350.02030.0160180.05220.0426
400.01930.0137210.04440.0364
450.01700.0132230.03860.0317
500.01610.0129260.03400.0279
550.01500.0127290.03010.0248
600.01460.0125320.02660.0218
650.01380.0124350.02430.0200
700.01290.0121380.02240.0184
750.01250.0121410.02070.0171
800.01190.0119440.01930.0160
850.01160.0116470.01800.0150
---500.01690.0142
---530.01600.0134
---560.01510.0127
---590.01430.0121
---620.01360.0115
---640.01300.0110
---670.01240.0106
---700.01180.0102
---730.01130.0098
---760.01090.0094
---790.01040.0091
---820.00970.0088

References

  1. Longde, S.; Caineng, Z.; Rukai, Z.; Zhang, Y.; Zhang, S.; Zhang, B.; Guangyou, Z.; Zhiyong, G. Formation, Distribution and Potential of Deep Hydrocarbon Resources in China. Pet. Explor. Dev. 2013, 40, 687–695. [Google Scholar] [CrossRef]
  2. Hatami, M.; Bayless, D.; Sarvestani, A. A Model for Stress-dependence of Apparent Permeability in Nanopores of Shale Gas Reservoirs. AIChE J. 2020, 66, e16541. [Google Scholar] [CrossRef]
  3. Chen, L.; Zhang, D.; Xiao, Y.; Wang, S.; Lyu, S. Nanoindentation Characterization of Shale Micromechanics and Fracturing Ability Evaluation of Reservoir. J. China Coal Soc. 2025, 50, 1658–1666. [Google Scholar]
  4. Wu, Z.; Zuo, Y.; Wang, S.; Sunwen, J.; Liu, L. Experimental Study on the Stress Sensitivity and Influence Factors of Shale under Varying Stress. Shock Vib. 2018, 2018, 3616942. [Google Scholar] [CrossRef]
  5. Fan, L.; Liu, S. Evaluation of Permeability Damage for Stressed Coal with Cyclic Loading: An Experimental Study. Int. J. Coal Geol. 2019, 216, 103338. [Google Scholar] [CrossRef]
  6. Yang, Y.; Jiang, C.; Guo, X.; Peng, S.; Zhao, J.; Yan, F. Experimental Investigation on the Permeability and Damage Characteristics of Raw Coal under Tiered Cyclic Unloading and Loading Confining Pressure. Powder Technol. 2021, 389, 416–429. [Google Scholar] [CrossRef]
  7. Vogler, D.; Amann, F.; Bayer, P.; Elsworth, D. Permeability Evolution in Natural Fractures Subject to Cyclic Loading and Gouge Formation. Rock Mech. Rock Eng. 2016, 49, 3463–3479. [Google Scholar] [CrossRef]
  8. Dong, J.-J.; Hsu, J.-Y.; Wu, W.-J.; Shimamoto, T.; Hung, J.-H.; Yeh, E.-C.; Wu, Y.-H.; Sone, H. Stress-Dependence of the Permeability and Porosity of Sandstone and Shale from TCDP Hole-A. Int. J. Rock Mech. Min. Sci. 2010, 47, 1141–1157. [Google Scholar] [CrossRef]
  9. Huang, Z.; Su, X.; Li, Y.; Zhang, K.; Yao, J. Stress sensitivity analysis of fractal porous media based on the Elasto-plastic Thick-walled Cylinder Model. Fractals 2021, 29, 2150162. [Google Scholar] [CrossRef]
  10. Ghanizadeh, A.; Gasparik, M.; Amann-Hildenbrand, A.; Gensterblum, Y.; Krooss, B.M. Experimental Study of Fluid Transport Processes in the Matrix System of the European Organic-Rich Shales: I. Scandinavian Alum Shale. Mar. Pet. Geol. 2014, 51, 79–99. [Google Scholar] [CrossRef]
  11. Yang, D.; Wang, W.; Li, K.; Chen, W.; Yang, J.; Wang, S. Experimental Investigation on the Stress Sensitivity of Permeability in Naturally Fractured Shale. Environ. Earth Sci. 2019, 78, 55. [Google Scholar] [CrossRef]
  12. Liu, P.-Y.; Shen, Y.-H.; Gao, Y.; Lin, H.; Wan, Y.-Y.; Wang, Y.; Shen, Y.; Zhong, Y.; Ai, F. Laboratory Study of Stress Sensitivity Characterization and Reservoir Quality Evaluation of Yingxiongling Shale in Qaidam Basin. Energy Fuels 2024, 38, 5822–5833. [Google Scholar] [CrossRef]
  13. Wu, K.; Li, X.; Wang, C.; Yu, W.; Chen, Z. Apparent Permeability for Gas Flow in Shale Reservoirs Coupling Effects of Gas Diffusion and Desorption. In Proceedings of the 2nd Unconventional Resources Technology Conference, Denver, CO, USA, 25–27 August 2014; American Association of Petroleum Geologists: Denver, CO, USA, 2014; pp. 2328–2345. [Google Scholar]
  14. Bird, R.B. Transport Phenomena. Appl. Mech. Rev. 2002, 55, R1–R4. [Google Scholar] [CrossRef]
  15. Ho, C.K.; Webb, S.W. Gas Transport in Porous Media; Theory and Applications of Transport in Porous Media; Springer: Dordrecht, The Netherlands, 2006; Volume 20, ISBN 978-1-4020-3961-4. [Google Scholar]
  16. Beskok, A.; Karniadakis, G.E. REPORT: A Model for Flows in Channels, Pipes, and Ducts at Micro and Nano Scales. Microscale Thermophys. Eng. 1999, 3, 43–77. [Google Scholar] [CrossRef]
  17. Civan, F.; Rai, C.S.; Sondergeld, C.H. Shale-Gas Permeability and Diffusivity Inferred by Improved Formulation of Relevant Retention and Transport Mechanisms. Transp. Porous Med. 2011, 86, 925–944. [Google Scholar] [CrossRef]
  18. Rahmanian, M.R.; Aguilera, R.; Kantzas, A. A New Unified Diffusion-Viscous Flow Model Based on Pore Level Studies of Tight Gas Formations. In Proceedings of the SPE Canada Unconventional Resources Conference, Calgary, AB, Canada, 15–17 November 2011. SPE-149223-MS. [Google Scholar]
  19. Zhang, L.; Li, D.; Lu, D.; Zhang, T. A New Formulation of Apparent Permeability for Gas Transport in Shale. J. Nat. Gas Sci. Eng. 2015, 23, 221–226. [Google Scholar] [CrossRef]
  20. Chen, D.; Pan, Z.; Ye, Z. Dependence of Gas Shale Fracture Permeability on Effective Stress and Reservoir Pressure: Model Match and Insights. Fuel 2015, 139, 383–392. [Google Scholar] [CrossRef]
  21. Fan, S.; Liu, G.; Xue, H.; Zhang, X.; Liu, H. How Pore Structure Evolves in Shale Gas Extraction: A New Fractal Model. Gas Sci. Eng. 2023, 117, 205061. [Google Scholar] [CrossRef]
  22. Zhu, Q.; Zhao, J.; Zhang, C.; Li, Y.; Wang, S. Elastic–Brittle–Plastic Analysis of Double-Layered Combined Thick-Walled Cylinder Under Internal Pressure. J. Press. Vessel Technol. 2016, 138, 011201. [Google Scholar] [CrossRef]
  23. Masoudian, M.S.; Hashemi, M.A.; Tasalloti, A.; Marshall, A.M. Elastic–Brittle–Plastic Behaviour of Shale Reservoirs and Its Implications on Fracture Permeability Variation: An Analytical Approach. Rock Mech. Rock Eng. 2018, 51, 1565–1582. [Google Scholar] [CrossRef]
  24. Li, J.; Yao, J.; Huang, Z.; Wang, W.; Wu, Y.-S. An Efficient Numerical Simulation of Coupled Thermo-Hydro-Mechanical Processes in Deep Shale Gas Reservoirs. Phys. Fluids 2023, 35, 123112. [Google Scholar] [CrossRef]
  25. Ye, P.; Li, B.; Ren, C.; Song, H.; Fu, J.; Wu, X. Investigation on Damage-Permeability Model of Dual-Porosity Coal under Thermal-Mechanical Coupling Effect. Gas Sci. Eng. 2024, 123, 205229. [Google Scholar] [CrossRef]
  26. Yu, B.; Cheng, P. A Fractal Permeability Model for Bi-Dispersed Porous Media. Int. J. Heat Mass Transf. 2002, 45, 2983–2993. [Google Scholar] [CrossRef]
  27. Zhang, T.; Guo, J.; Zeng, F.; Zeng, J.; Lu, C.; Zhao, Z. Gas Mass Transfer Characteristics in Shales: Insights from Multiple Flow Mechanisms, Effective Viscosity, and Poromechanics. Gas Sci. Eng. 2024, 125, 205319. [Google Scholar] [CrossRef]
  28. Yu, B. Analysis of Flow in Fractal Porous Media. Appl. Mech. Rev. 2008, 61, 050801. [Google Scholar] [CrossRef]
  29. Javadpour, F.; Fisher, D.; Unsworth, M. Nanoscale Gas Flow in Shale Gas Sediments. J. Can. Pet. Technol. 2007, 46, 55–61. [Google Scholar] [CrossRef]
  30. Zhang, Y.; Yang, D. Modeling Two-Phase Flow Behaviour in a Shale Gas Reservoir with Complex Fracture Networks and Flow Dynamics. Gas Sci. Eng. 2023, 119, 205112. [Google Scholar] [CrossRef]
  31. Letham, E.A. Matrix Permeability Measurements of Gas Shales: Gas Slippage and Adsorption as Sources of Systematic Error. Bachelor’s Thesis, The University of British Columbia, Vancouver, BC, Canada, March 2011. [Google Scholar]
  32. Ren, W.; Li, G.; Tian, S.; Sheng, M.; Fan, X. An Analytical Model for Real Gas Flow in Shale Nanopores with Non-circular Cross-section. AIChE J. 2016, 62, 2893–2901. [Google Scholar] [CrossRef]
  33. Mahmoud, M. Development of a New Correlation of Gas Compressibility Factor (Z-Factor) for High Pressure Gas Reservoirs. J. Energy Resour. Technol. 2014, 136, 012903. [Google Scholar] [CrossRef]
  34. Lee, A.L.; Gonzalez, M.H.; Eakin, B.E. The Viscosity of Natural Gases. J. Pet. Technol. 1966, 18, 997–1000. [Google Scholar] [CrossRef]
  35. Chen, Y.; Tang, S.; Xi, Z.; Sun, S.; Zhao, N.; Tang, H.; Zhao, S. Estimation of Shale Adsorption Gas Content Based on Machine Learning Algorithms. Gas Sci. Eng. 2024, 127, 205349. [Google Scholar] [CrossRef]
  36. Wu, T.; Wang, S. A Fractal Permeability Model for Real Gas in Shale Reservoirs Coupled with Knudsen Diffusion and Surface Diffusion Effects. Fractals 2020, 28, 2050017. [Google Scholar] [CrossRef]
  37. Song, W.; Yao, B.; Yao, J.; Li, Y.; Sun, H.; Yang, Y.; Zhang, L. Methane Surface Diffusion Capacity in Carbon-Based Capillary with Application to Organic-Rich Shale Gas Reservoir. Chem. Eng. J. 2018, 352, 644–654. [Google Scholar] [CrossRef]
Figure 1. Thick-walled cylinder theoretical model; (a) pressure on a three-dimensional single capillary under elastic-plastic deformation; (b) pressure on a cross-sectional slice under elastic-plastic deformation.
Fractalfract 09 00526 g001
Figure 2. Conversion of real rock sample of deep shale to capillary model; (a) real rock sample of deep shale; (b) capillary model.
Fractalfract 09 00526 g002
Figure 3. Mechanisms of transport in a single tube of single-component gas.
Fractalfract 09 00526 g003
Figure 4. A comparison between this work and experimental data.
Fractalfract 09 00526 g004
Figure 5. CT scan image for rock sample 1; (a) 3D CT scan image; (b) 2D CT slice image; (c) processed CT image.
Fractalfract 09 00526 g005
Figure 6. CT scan image for rock sample 2; (a) 3D CT scan image; (b) 2D CT slice image; (c) processed CT image.
Fractalfract 09 00526 g006
Figure 7. Rock sample 1; (a) stress-strain curve; (b) a comparison between this work and loading-unloading experimental data.
Fractalfract 09 00526 g007
Figure 8. Rock sample 2; (a) stress-strain curve; (b) a comparison between this work and loading-unloading experimental data.
Fractalfract 09 00526 g008
Figure 9. The relationship between pore radius fractal dimension and porosity at different ratios of minimum pore radius to maximum pore radius.
Fractalfract 09 00526 g009
Figure 10. The relationship between apparent gas permeability of shale porous media and effective stress at different ratios of minimum pore radius to maximum pore radius.
Fractalfract 09 00526 g010
Figure 12. The relationship between shale gas apparent permeability and effective stress at different capillary tortuosity fractal dimensions.
Fractalfract 09 00526 g012
Figure 14. The relationship between shale gas apparent permeability and effective stress at different Young’s modulus.
Fractalfract 09 00526 g014
Figure 15. The relationship between the pore volume proportions of different flow mechanisms and effective stress when shale porous media is considered as an elastic body or an elastoplastic body: (a) E = 10 GPa; (b) E = 25 GPa; (c) E = 40 GPa.
Fractalfract 09 00526 g015aFractalfract 09 00526 g015b
Figure 16. The relationship between shale gas apparent permeability and effective stress at different temperature.
Fractalfract 09 00526 g016
Figure 17. The relationship between the pore volume proportions of different flow mechanisms and effective stress when shale porous media is considered as an elastic body or an elastoplastic body: (a) T = 300 K; (b) T = 353 K; (c) T = 403 K.
Fractalfract 09 00526 g017
Table 1. Model input parameters.
ParametersSymbolUnitValue
Gas molar massMkg/mol16 × 10−3
Gas molecule diameterdm0.38 × 10−9
Maximum effective pore radiusλmaxm1 × 10−7
TemperatureTK300
Gas constantRJ/(mol·K)8.314
Poisson’s ratioνdimensionless0.018
Young’s modulusEPa0.5 × 109
Langmuir PressurePLPa16.97 × 106
Maximum adsorption capacityCLmol/m3328.7
Isosteric adsorption heatΔHJ/mol16,000
The ratio of the rate constant for blockage to the rate constant for forward migrationκdimensionless0.5
The ratio of the outer radius of the capillary to the inner radiustdimensionless5
Disclaimer/Publisher’s Note: The statements, opinions and data contained in all publications are solely those of the individual author(s) and contributor(s) and not of MDPI and/or the editor(s). MDPI and/or the editor(s) disclaim responsibility for any injury to people or property resulting from any ideas, methods, instructions or products referred to in the content.