Article

FGFNet: Fourier Gated Feature-Fusion Network with Fractal Dimension Estimation for Robust Palm-Vein Spoof Detection

Division of Electronics and Electrical Engineering, Dongguk University, 30 Pildong-ro 1-gil, Jung-gu, Seoul 04620, Republic of Korea
*
Author to whom correspondence should be addressed.
Fractal Fract. 2025, 9(8), 478; https://doi.org/10.3390/fractalfract9080478
Submission received: 17 June 2025 / Revised: 14 July 2025 / Accepted: 20 July 2025 / Published: 22 July 2025

Abstract

The palm-vein recognition system has garnered attention as a biometric technology due to its resilience to external environmental factors, protection of personal privacy, and low risk of external exposure. However, with recent advancements in deep learning-based generative models for image synthesis, the quality and sophistication of fake images have improved, leading to an increased security threat from counterfeit images. In particular, palm-vein images acquired through near-infrared illumination exhibit low resolution and blurred characteristics, making it even more challenging to detect fake images. Furthermore, spoof detection specifically targeting palm-vein images has not been studied in detail. To address these challenges, this study proposes the Fourier-gated feature-fusion network (FGFNet) as a novel spoof detector for palm-vein recognition systems. The proposed network integrates masked fast Fourier transform, a map-based gated feature fusion block, and a fast Fourier convolution (FFC) attention block with global contrastive loss to effectively detect distortion patterns caused by generative models. These components enable the efficient extraction of critical information required to determine the authenticity of palm-vein images. In addition, fractal dimension estimation (FDE) was employed for two purposes in this study. In the spoof attack procedure, FDE was used to evaluate how closely the generated fake images approximate the structural complexity of real palm-vein images, confirming that the generative model produced highly realistic spoof samples. In the spoof detection procedure, the FDE results further demonstrated that the proposed FGFNet effectively distinguishes between real and fake images, validating its capability to capture subtle structural differences induced by generative manipulation. To evaluate the spoof detection performance of FGFNet, experiments were conducted using real palm-vein images from two publicly available palm-vein datasets—VERA Spoofing PalmVein (VERA dataset) and PLUSVein-contactless (PLUS dataset)—as well as fake palm-vein images generated based on these datasets using a cycle-consistent generative adversarial network. The results showed that, based on the average classification error rate, FGFNet achieved 0.3% and 0.3% on the VERA and PLUS datasets, respectively, demonstrating superior performance compared to existing state-of-the-art spoof detection methods.

1. Introduction

Biometric recognition utilizes an individual’s unique physical and physiological characteristics, making the likelihood of misidentification extremely low and ensuring high reliability. Unlike traditional identity verification methods, biometric recognition does not require possession of an item or memorization of information and carries a lower risk of external exposure. Due to these advantages, biometric recognition technology is widely used in various fields, including (1) security for personal devices such as smartphones, (2) access control and border management, (3) personal identification in banking transactions, and (4) identification of victims and perpetrators at accident and crime scenes. Among biometric recognition methods, vein recognition (for example, palm-vein, dorsal-vein, and finger-vein) utilizes near-infrared (NIR) illumination to capture vein patterns beneath the skin of the hand. As a result, it is less affected by external factors such as skin conditions, masks, and glasses, compared to other methods such as fingerprint, facial, or iris recognition. Additionally, vein patterns have a lower risk of being compromised due to external exposure and pose minimal privacy concerns related to biometric data collection, making them highly regarded. However, as in other biometric recognition methods, vein recognition compares a registered user’s biometric data with real-time input, making it susceptible to hacking or theft of stored biometric data and vulnerable to spoof attacks using stolen biometric information [1].
One of the recent advancements in generative artificial intelligence (AI) technology, the generative adversarial network (GAN), is used to generate high-quality images for creative content production in fields such as gaming, film, and advertising. Additionally, in fields that require complex or difficult-to-collect training data, GANs can enhance model training by generating training datasets and offer various applications through image restoration and resolution enhancement [2,3]. However, GANs have increasingly been exploited in cybercrime through deepfake technology. This has emerged as a growing concern, as GANs can be used to generate biometric information such as specific faces or fingerprints.
Previous studies have been conducted on spoof detection in finger-vein recognition systems to determine whether an input image is a real (live) image or a generated fake image [4,5]. However, in the field of palm-vein recognition, research on spoof detection has been scarce [6]. Additionally, in studies where fake palm-vein images were generated, the class identity information of the fake images differed from that of real palm-vein images. This indicates that spoof attack scenarios targeting the same class were not considered, which is a limitation. Moreover, palm-vein images generally capture a larger area of the hand compared to finger-vein images, resulting in lower resolution in the vein region. In contrast to finger-vein images acquired by transmitting NIR illumination through the fingers, palm-vein images are obtained by reflecting NIR illumination, leading to relatively lower contrast between the vein patterns and surrounding skin. As a result, real palm-vein images tend to exhibit lower quality and more blurriness compared to real finger-vein images. This makes the generation of fake palm-vein images easier, thereby making spoof detection for fake palm-vein images relatively more challenging. Taking these factors into account, this study proposes a novel spoof detection method for fake palm-vein images.
Compared to previous works, our study has the following four contributions:
-
This is the first study in the field of palm-vein recognition to generate fake palm-vein images that retain both visual and class identity information of real palm-vein images and propose a spoof detection method for them. To achieve this, we introduce a novel Fourier-gated feature-fusion network (FGFNet) for spoof detection.
-
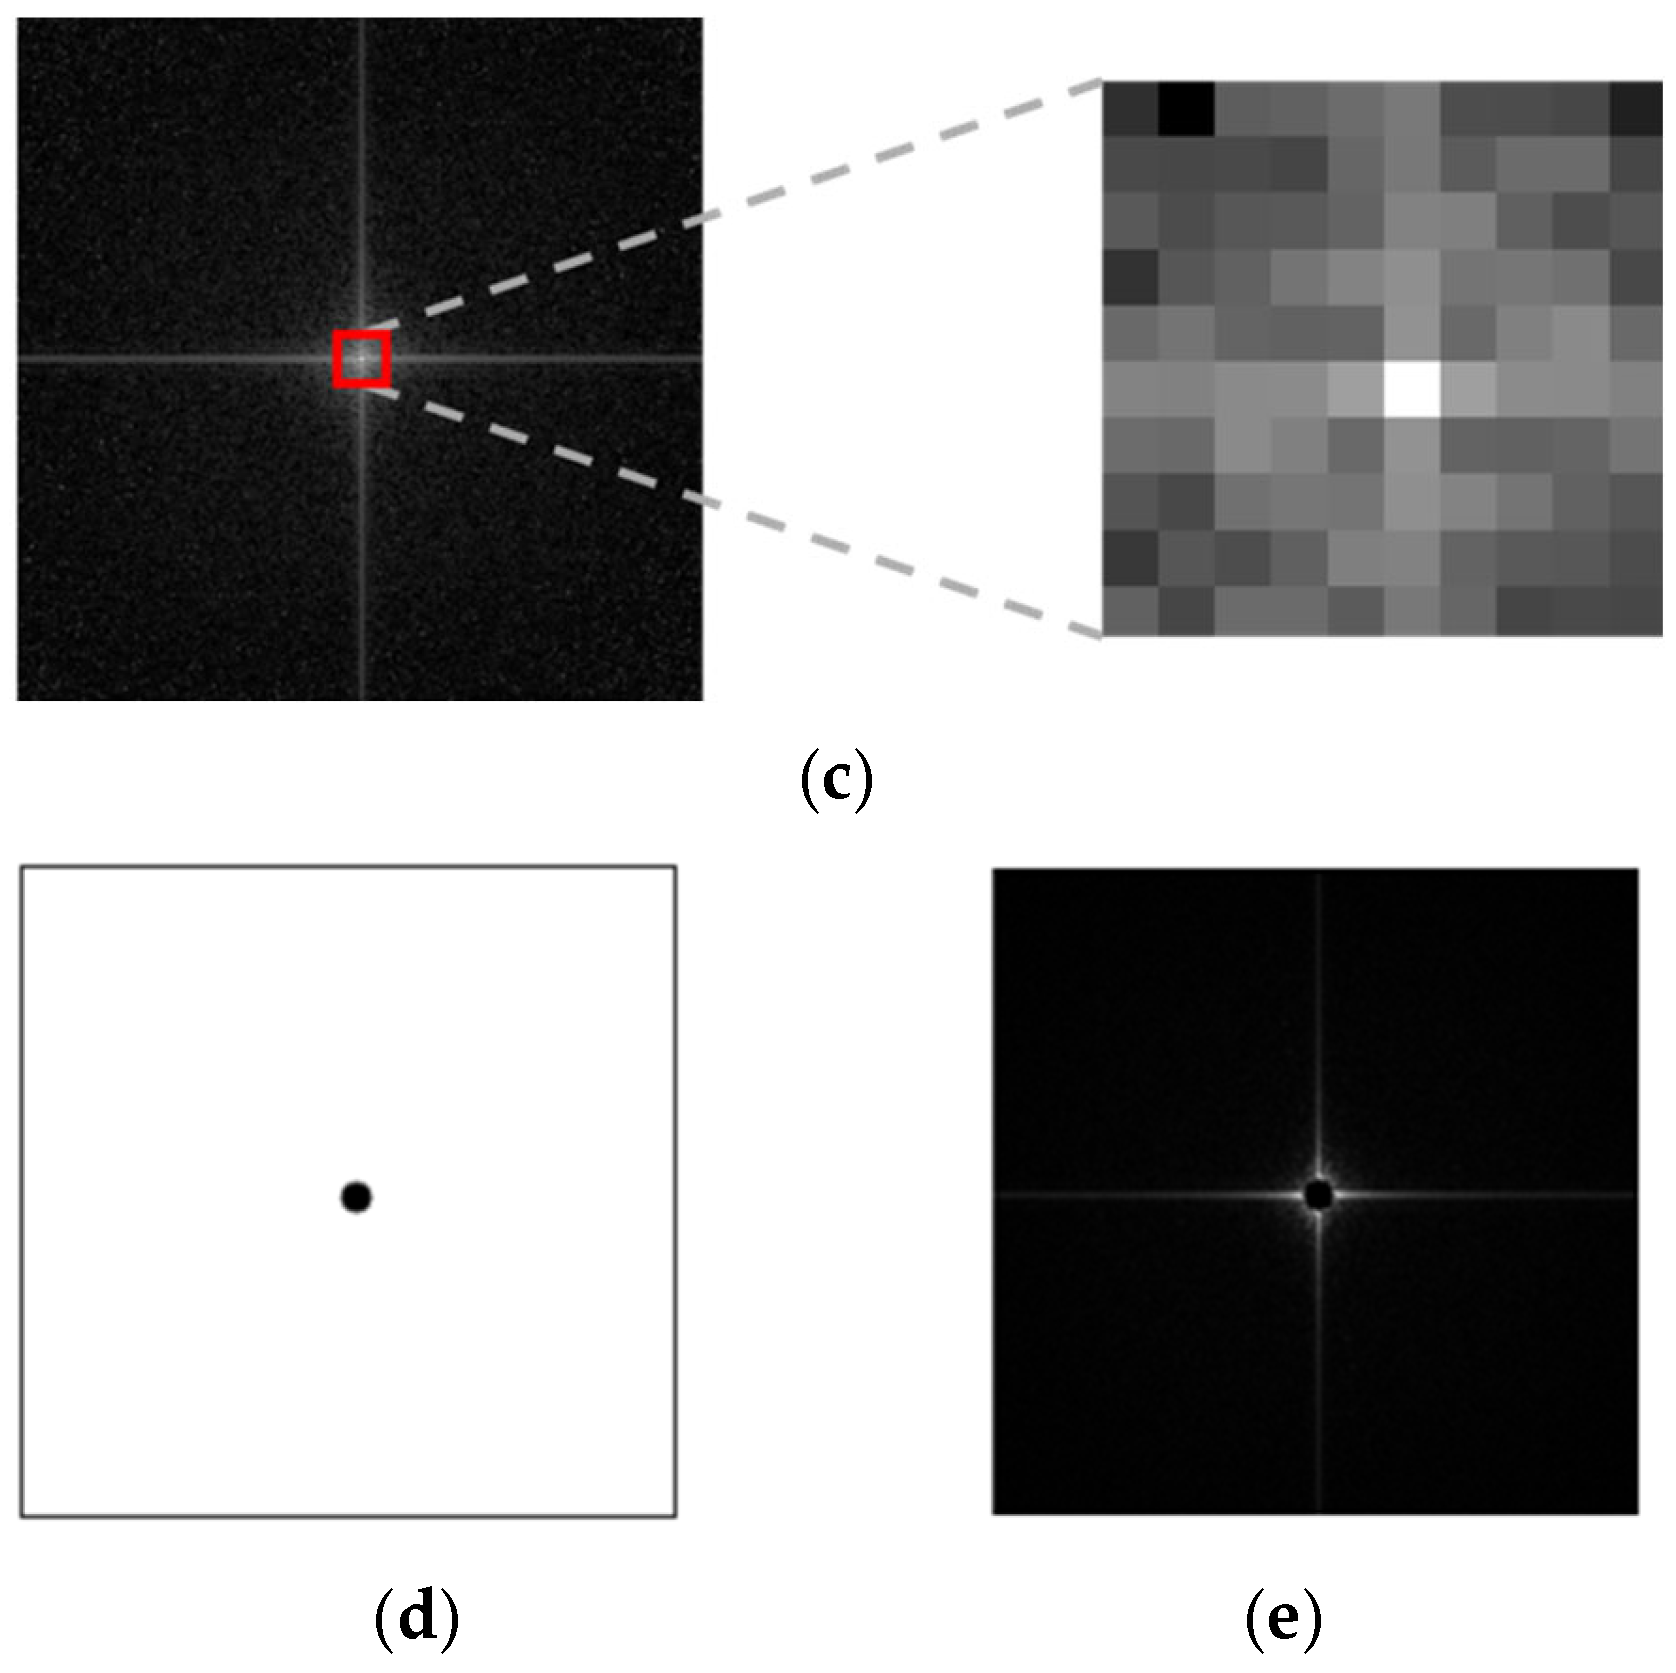
Generated fake palm-vein images typically contain traces of GAN fingerprints in high-frequency components. To extract these feature maps, the proposed FGFNet incorporates a masked fast Fourier transform (FFT) map-based gated feature fusion (MF-GF) block. In this block, feature maps are obtained by applying convolution separately to a masked FFT image with direct current (DC) components removed and an RGB image in the palm-vein region of interest (ROI). Gated fusion is then used to emphasize the high-frequency components of fake images in the final feature map.
-
As mentioned earlier, to simultaneously extract global information from the blurry and low-quality real palm-vein images and local information from fake images, we propose the fast Fourier convolution (FFC) attention with global contrastive loss (FA-GCL) block. In FA-GCL, both global features obtained through FFC and local features obtained through conventional convolution are extracted using contrastive loss-based correlation between the two feature types.
-
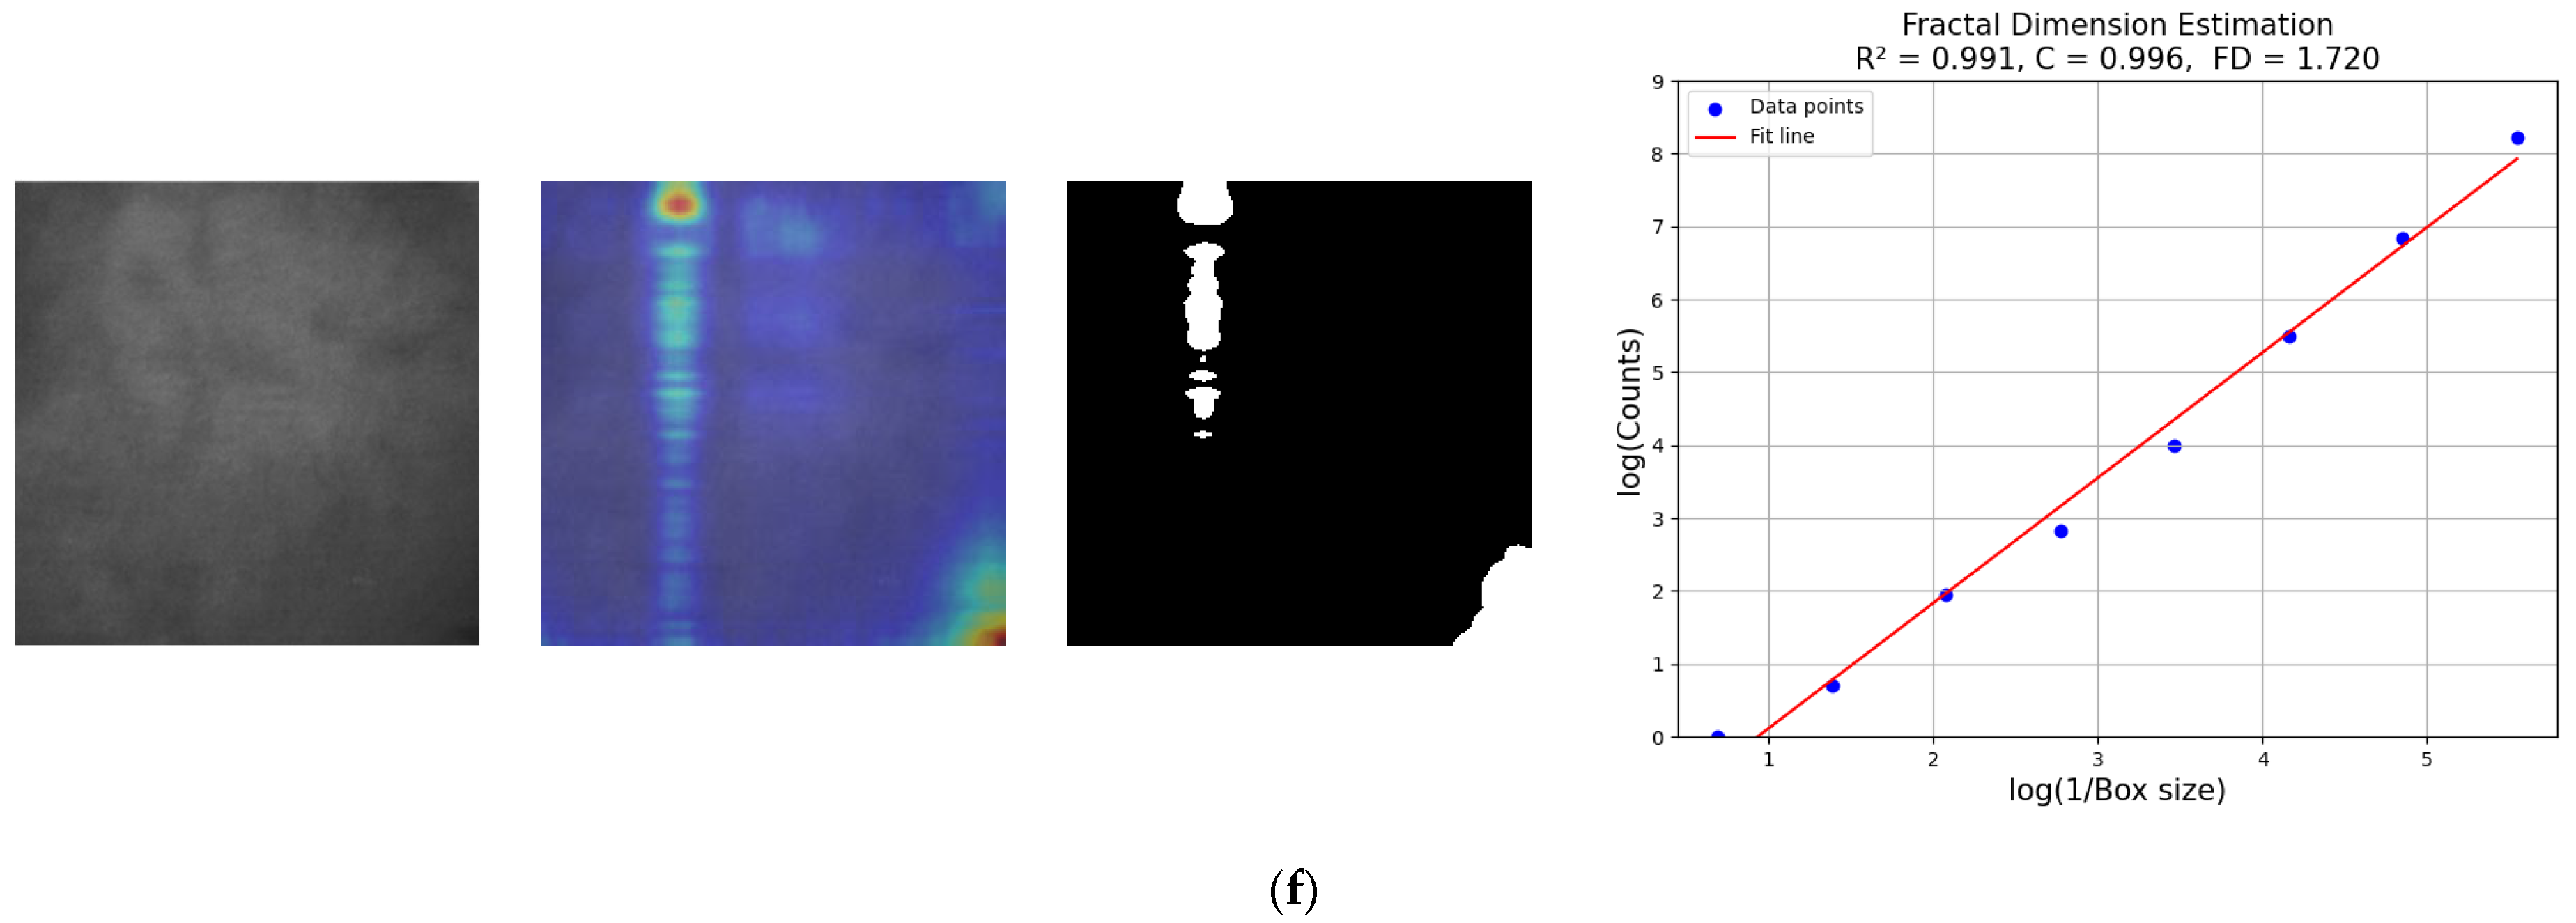
Fractal dimension estimation (FDE) is employed both to assess the structural realism of the generated fake palm-vein images and to quantitatively validate the spoof detection performance of FGFNet, thereby reinforcing the effectiveness of both the generation and detection processes. In addition, the fake palm-vein images generated in this study, along with the proposed model and algorithm codes, are shared via a GitHub repository [7] to facilitate fair performance evaluation by other researchers.
The remainder of this paper is organized as follows. Section 2 reviews previous studies, Section 3 provides a detailed explanation of the proposed method, and Section 4 presents the experimental results along with their analysis. Section 5 discusses key findings, and, finally, Section 6 presents the conclusion of this paper.

2. Related Work

Existing research on spoof detection for vein recognition systems can be broadly classified into two categories: spoof detection robust to fabricated artifacts and spoof detection robust to fake generated images. A detailed explanation of these categories is as follows.

2.1. Spoof Detection Robust to Fake Fabricated Artifacts

Previous studies on spoof attacks using fake fabricated artifacts include attacks using printed vein images (print attacks), attacks utilizing vein images displayed on monitors or screens (digital attacks), and attacks employing vein samples created from special materials such as silicone or rubber (physical attacks). Research on spoof detection against these attacks can be broadly categorized into methods using handcrafted features and machine learning algorithms and methods using deep learning algorithms.

2.1.1. Using Handcrafted Features and Machine Learning Algorithms

In the field of fake finger-vein detection, Nguyen et al. [8] attempted spoof attacks using the ISPR dataset, which comprises fake images generated through print attacks on A4 paper, matte paper, and overhead projector films using a LaserJet printer at 300, 1200, and 2400 dots per inch (dpi), as well as an additional open dataset, Idiap. For spoof detection, they extracted features using Fourier transform (FT), Haar wavelet, and Daubechies wavelet, and employed a support vector machine (SVM) as the spoof detector. In the study by Tirunagari et al. [9], they applied a sliding window to the dynamic mode decomposition (DWD) technique, resulting in a windowed DWD feature extraction method for analyzing vessel changes over time. Kocher et al. [10] extracted features for fake detection using extension binary patterns. Additionally, Bok et al. [11] considered both print attacks using InkJet and LaserJet printers and digital attacks using smartphones to generate counterfeit finger-vein videos. The authors extracted features related to blood flow signals using discrete FT. All of the aforementioned methods performed spoof detection using SVM.
In the field of fake hand dorsal-vein detection, Patil et al. [12] extracted key point features using differences of Gaussian, Harris–Laplace, Hessian–Laplace, and the vision lab features library (VLFeat) [13] and performed fake detection using Euclidean distance. Bhilare et al. [14] transformed images using Laplacian of Gaussian filtering, extracted features using the histogram of oriented gradients, and conducted spoof detection using a linear SVM. Finally, in spoof detection for palm-vein recognition, which is the focus of this study, Tome and Marcel [15] performed spoof detection using PalmveinRecLib [16], an open-source palm-vein recognition library based on local binary pattern methods.
The aforementioned methods have the advantage of being simple to implement and trainable even with relatively small datasets. However, since they rely on handcrafted techniques for feature extraction, they are limited to fixed data patterns and lack flexibility in handling complex patterns or diverse attack scenarios. Due to these limitations, deep learning-based methods, such as those discussed in the next subsection, have been explored.

2.1.2. Using Deep Learning Algorithms

With recent advancements in deep learning, it has become possible to automatically learn meaningful features from high-dimensional data, utilizing high-performance feature extractors such as convolutional neural networks (CNNs). In the field of fake finger-vein detection, Nguyen et al. [1] modified the visual geometry group (VGG) net [17] and AlexNet [18] to use them as feature extractors. The authors reduced the dimensionality of the extracted feature maps using principal component analysis (PCA) and performed fake detection using SVM. In the study by Shaheed et al. [19], the entry flow of Xception [20] was utilized for feature extraction, and SVM was used to distinguish between real and fake finger-vein data.
For fake hand dorsal-vein detection, Singh et al. [21] converted images into depth map representations using U-Net [22] to emphasize differences between real and fake images. The authors fine-tuned a VGG-19 model to perform fake detection. Considering fake palm-vein detection, Nguyen et al. [1] evaluated the detection performance on a fake palm-vein dataset using their proposed CNN with PCA and SVM. Sajjad et al. [23] employed GoogleNet [24] for spoof detection prior to palm-vein recognition. The aforementioned methods offer advantages over handcrafted feature and machine learning algorithm-based approaches, as they can extract high-dimensional and nonlinear feature patterns from input data. Moreover, when trained with large-scale datasets, they achieve high generalization performance. However, all these studies have focused exclusively on detecting fake fabricated artifacts without addressing the detection of fake generated images, which are more sophisticated and difficult to distinguish from real vein images.

2.2. Spoof Detection Robust to Fake Generated Images

In this study, a generated image refers to a fake image created using a deep learning-based generative model, exhibiting high realism and sophistication. In previous studies on fake finger-vein detection, Kim et al. [4] demonstrated that fake finger-vein images generated using cycle-consistent adversarial networks (CycleGANs) [25] can successfully launch spoof attacks against conventional finger-vein recognition systems. To detect these attacks, they fused prediction scores obtained from two models, DenseNet-161 and DenseNet-169 [26], using an SVM. Furthermore, in the study by Kim et al. [5], they proposed the densely updated contrastive learning-based self-attention generative adversarial network (DSC-GAN) to generate fake images that closely resemble real images. These images were used for spoof detection with a ConvNeXt-Small [27] model enhanced with large kernel attention [28].
For fake hand dorsal-vein detection, Vorderleitner et al. [29] generated fake hand dorsal-vein images using CycleGAN [25] and DistanceGAN [30]. By confirming the degradation in detection performance during spoof attacks using these images, they identified the potential risks posed by generated fake images when developing recognition systems.
Finally, for fake palm-vein detection, Li et al. [31] proposed a spoof detection framework called VeinGuard. One of its components, a local transformer-based GAN (LTGAN) trained on the distribution of real palm-vein images, was used to remove adversarial perturbations from fake palm-vein images generated using the fast gradient sign method (FGSM) [32], randomized fast gradient sign method (RAND + FGSM) [33], and projected gradient descent (PGD) [34], thereby enabling spoof detection. Additionally, in the study by Yang et al. [6], a method called feature-wise adversarial palm-vein image generator was proposed. This method separates the visual and class identity information of palm-vein images, preserving the visual information while altering the class identity, thereby generating fake palm-vein images capable of disrupting palm-vein recognition systems.
However, in the case of the aforementioned fake finger-vein detection methods, although various GANs were considered, they did not address other generative models, such as diffusion models, which have been actively studied in recent research. For fake hand dorsal-vein detection methods, while the risks of GAN-generated fake images were identified, no specific countermeasures were investigated. Additionally, in the case of the aforementioned fake palm-vein detection methods, Li et al. [31] focused on adversarial attacks, whereas no research was conducted on spoof detection for general generated images. In Yang et al. [6], a limitation is that they did not consider a spoof attack scenario using fake palm-vein images that retain both the visual and class identity information of real palm-vein images. Taking all these issues into account, this study proposes a novel spoof detection method for fake palm-vein images, utilizing more sophisticated fake palm-vein images that retain both the visual and class identity information of real palm-vein images.

3. Proposed Method

3.1. Overall Procedure of Proposed Method

Figure 1 illustrates the overall procedure of the proposed method. First, to perform spoof attack detection, a real palm-vein image is taken as input to generate fake palm-vein images. Next, pre-processing is applied to extract the ROI. Then, the pre-processed palm-vein images are fed into CycleGAN to generate fake palm-vein images. To remove the high-frequency components, known as “GAN fingerprints,” that remain in the generated images, post-processing is performed using a low-pass filter. Finally, spoof attacks using these generated fake palm-vein images are classified into real or fake palm-vein images using FGFNet, the spoof detection method proposed in this paper.

3.2. Pre-Processing of Palm-Vein Image

This study utilized two publicly available datasets. The first dataset is the Spoofing PalmVein dataset (VERA dataset [15]) from Idiap, while the second dataset comprises palm-vein images from the PLUSVein Contactless dataset (PLUS dataset [35]). Both datasets provide images with extracted ROIs. However, in the case of the VERA dataset, the provided images include portions of the fingers and background; thus, additional pre-processing was performed in this study.
Since palm-vein images capture the palm region where NIR light is reflected in a dark environment, areas outside the ROI (palm-vein region), such as the relatively thin fingers and the background, appear darker than the palm region, as shown in Figure 2a. Based on this information, the study performs pre-processing by summing the pixel values along the x-axis for each y-axis position. Using this sum as a reference, the lower boundary of the palm-vein image (toward the wrist) is determined at the y-axis position where the pixel value reaches 80% of the average pixel value (represented by the red line in Figure 2b), and the upper boundary (toward the fingers) is determined at 60% of the average pixel value (represented by the green line in Figure 2b). The ROI is then cropped accordingly, as illustrated in Figure 2c. Subsequently, to be used as input for the pre-trained CycleGAN and the proposed model, the cropped ROI is resized to 256 × 256 pixels using bilinear interpolation, as shown in Figure 2d. The optimal percentage values for the average pixel value in this study were determined based on fake detection accuracy using training data.

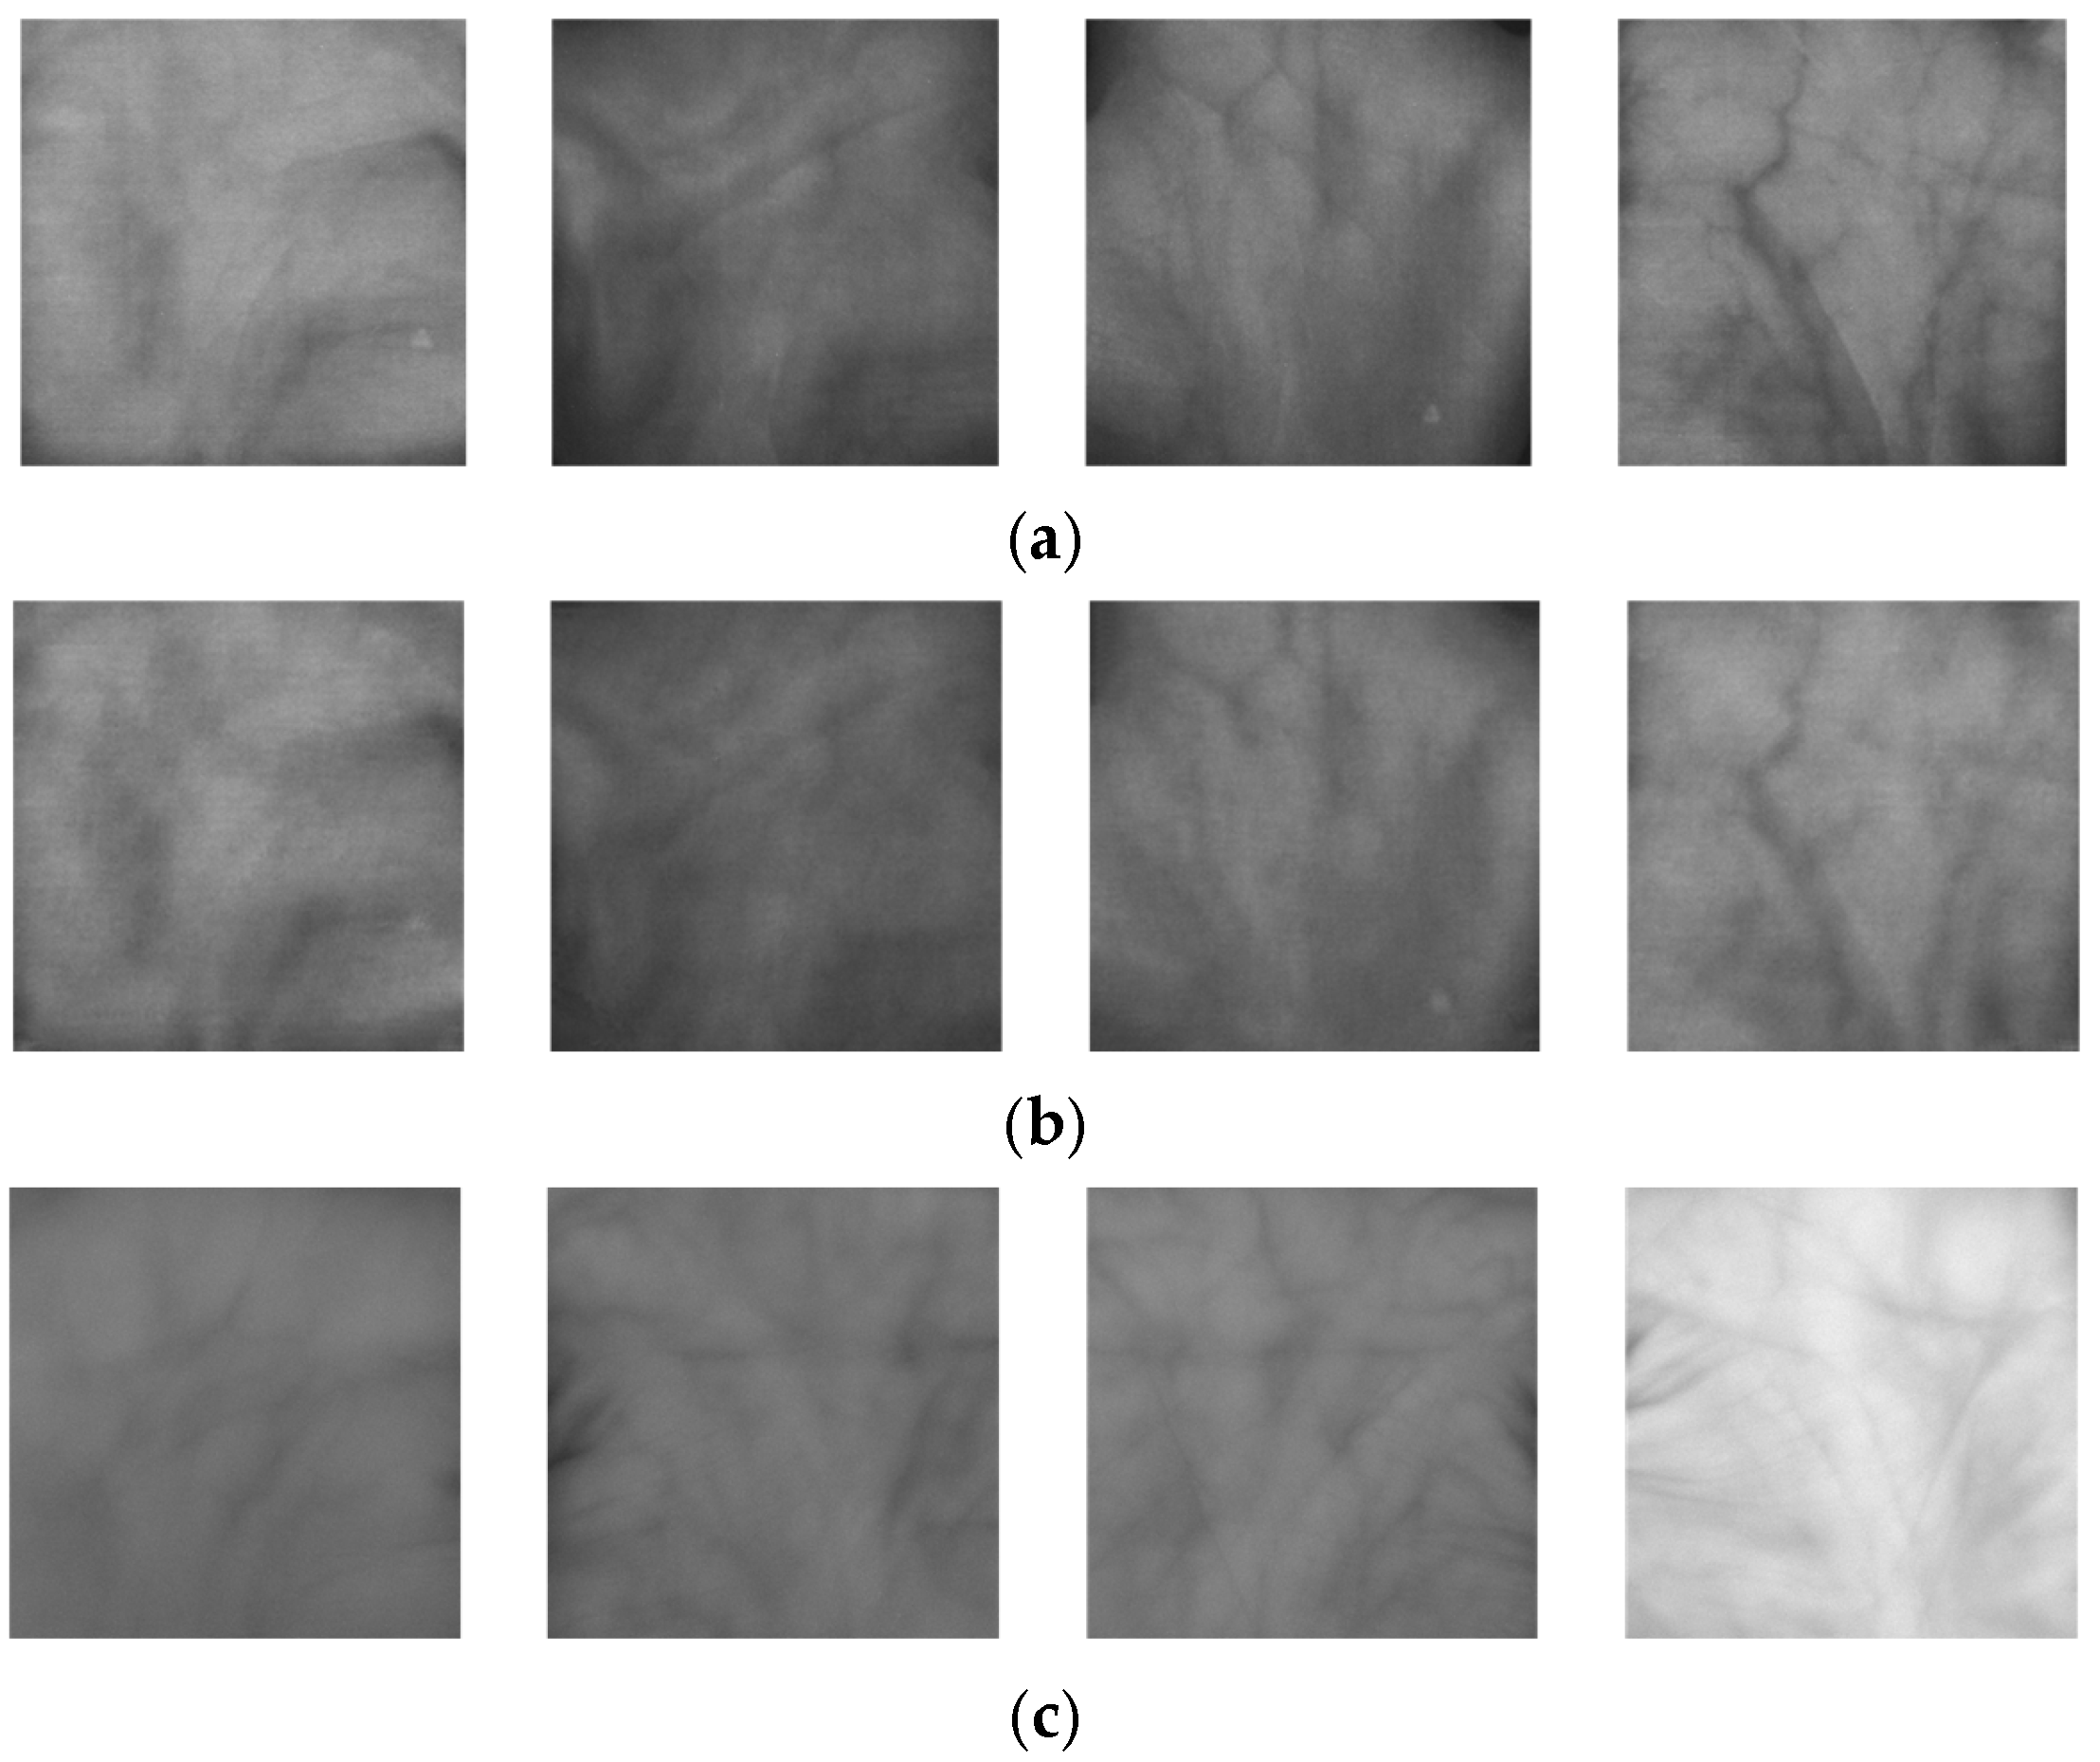
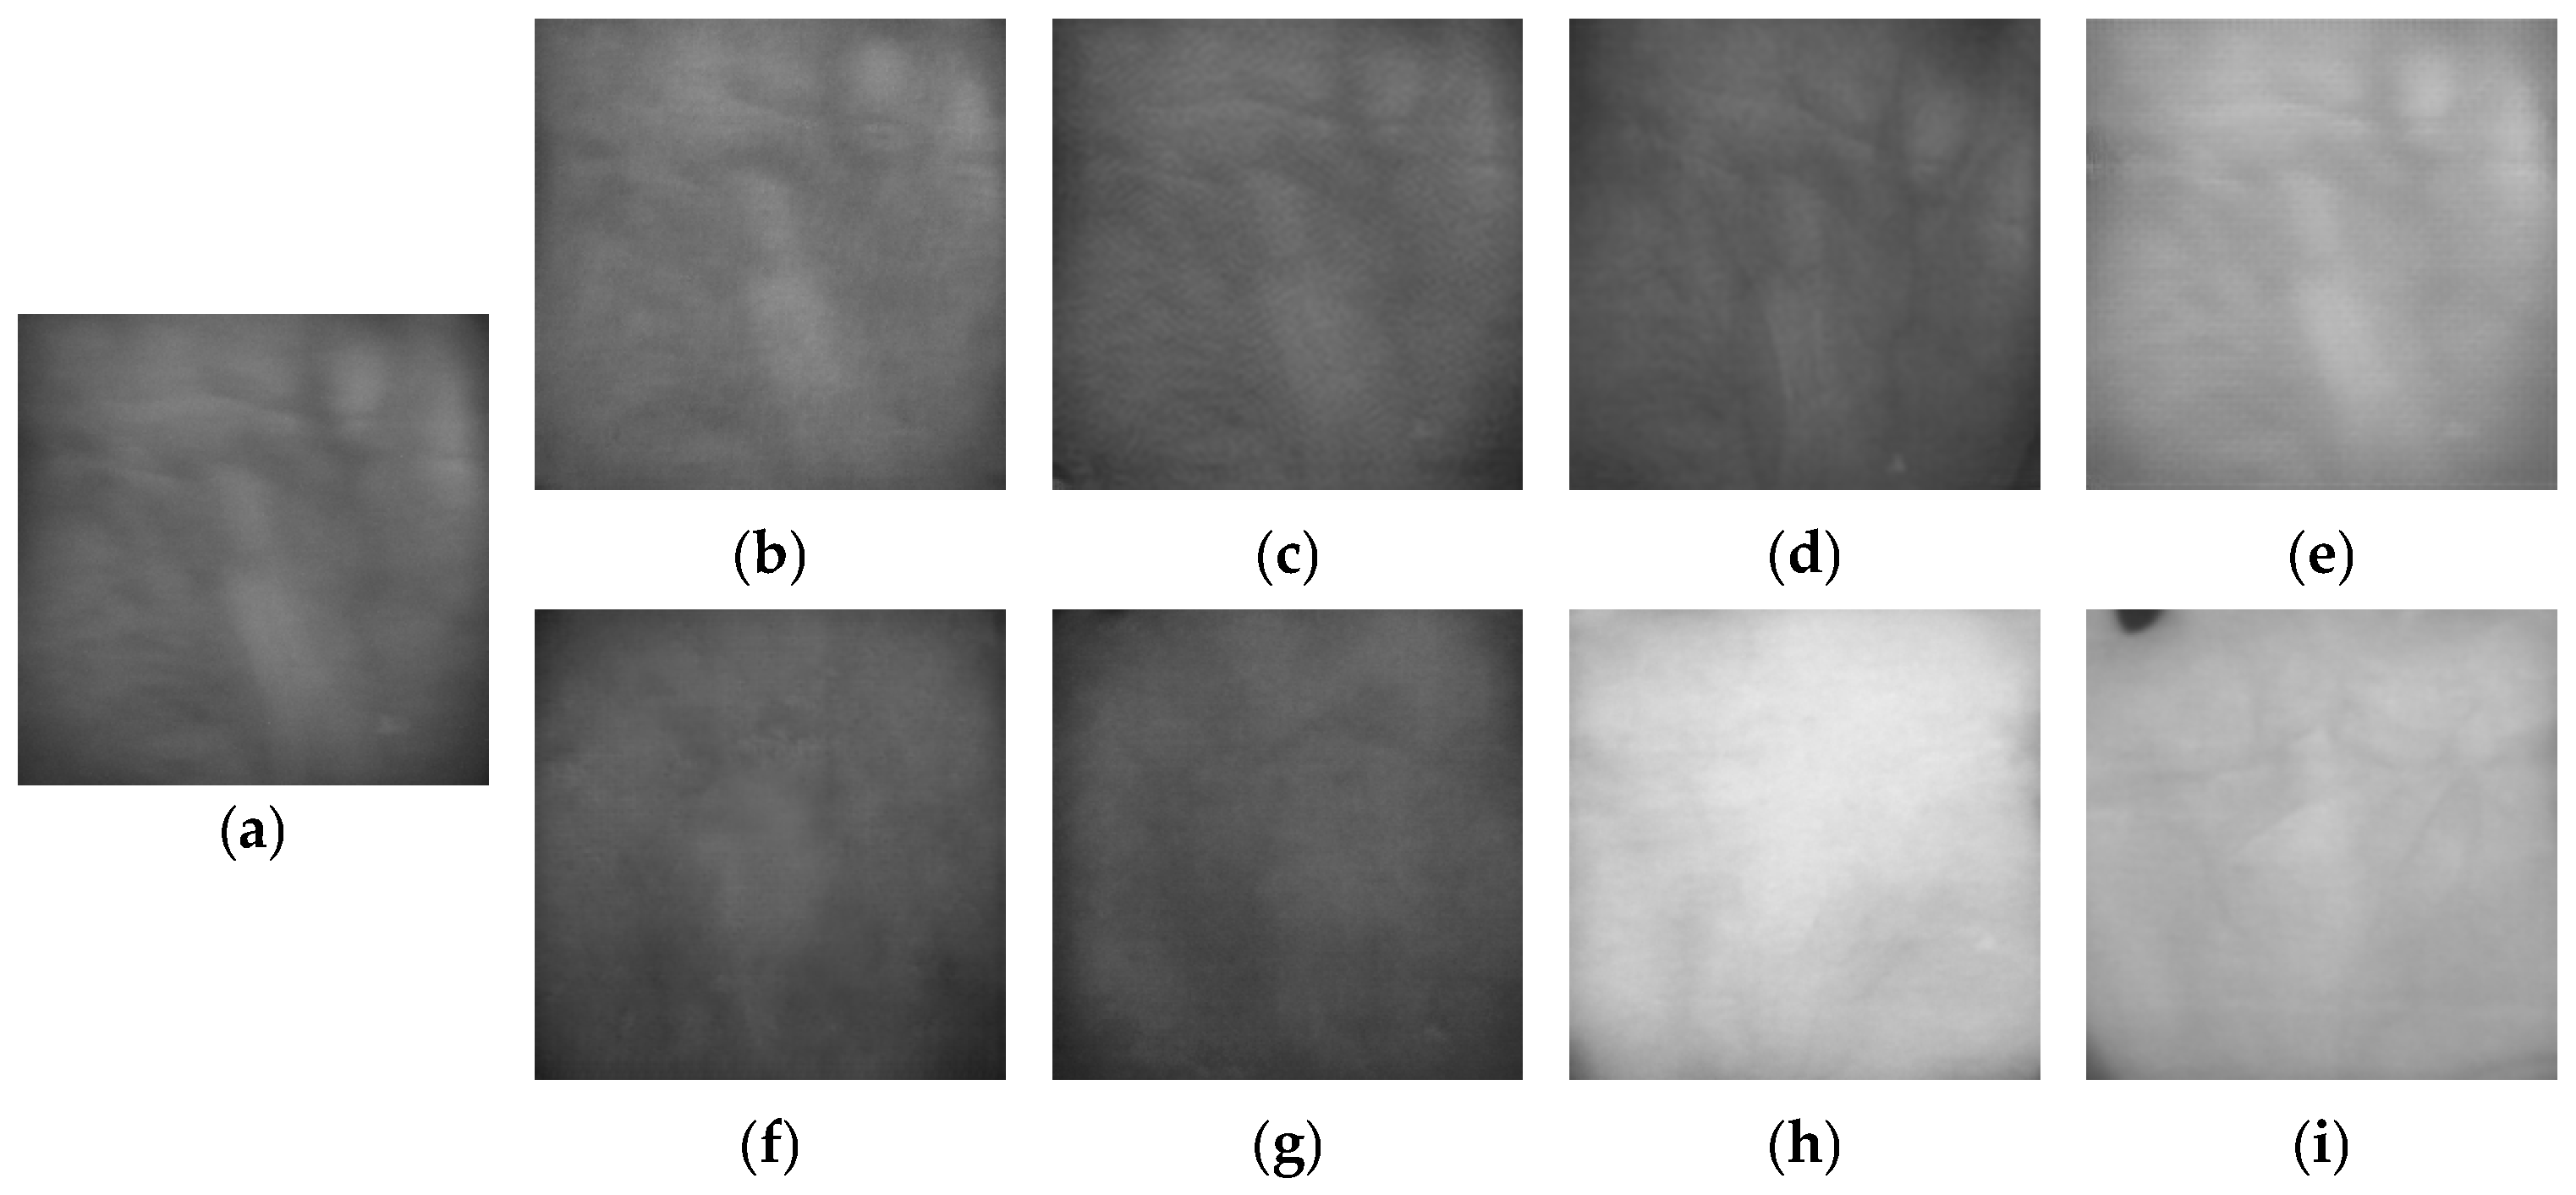
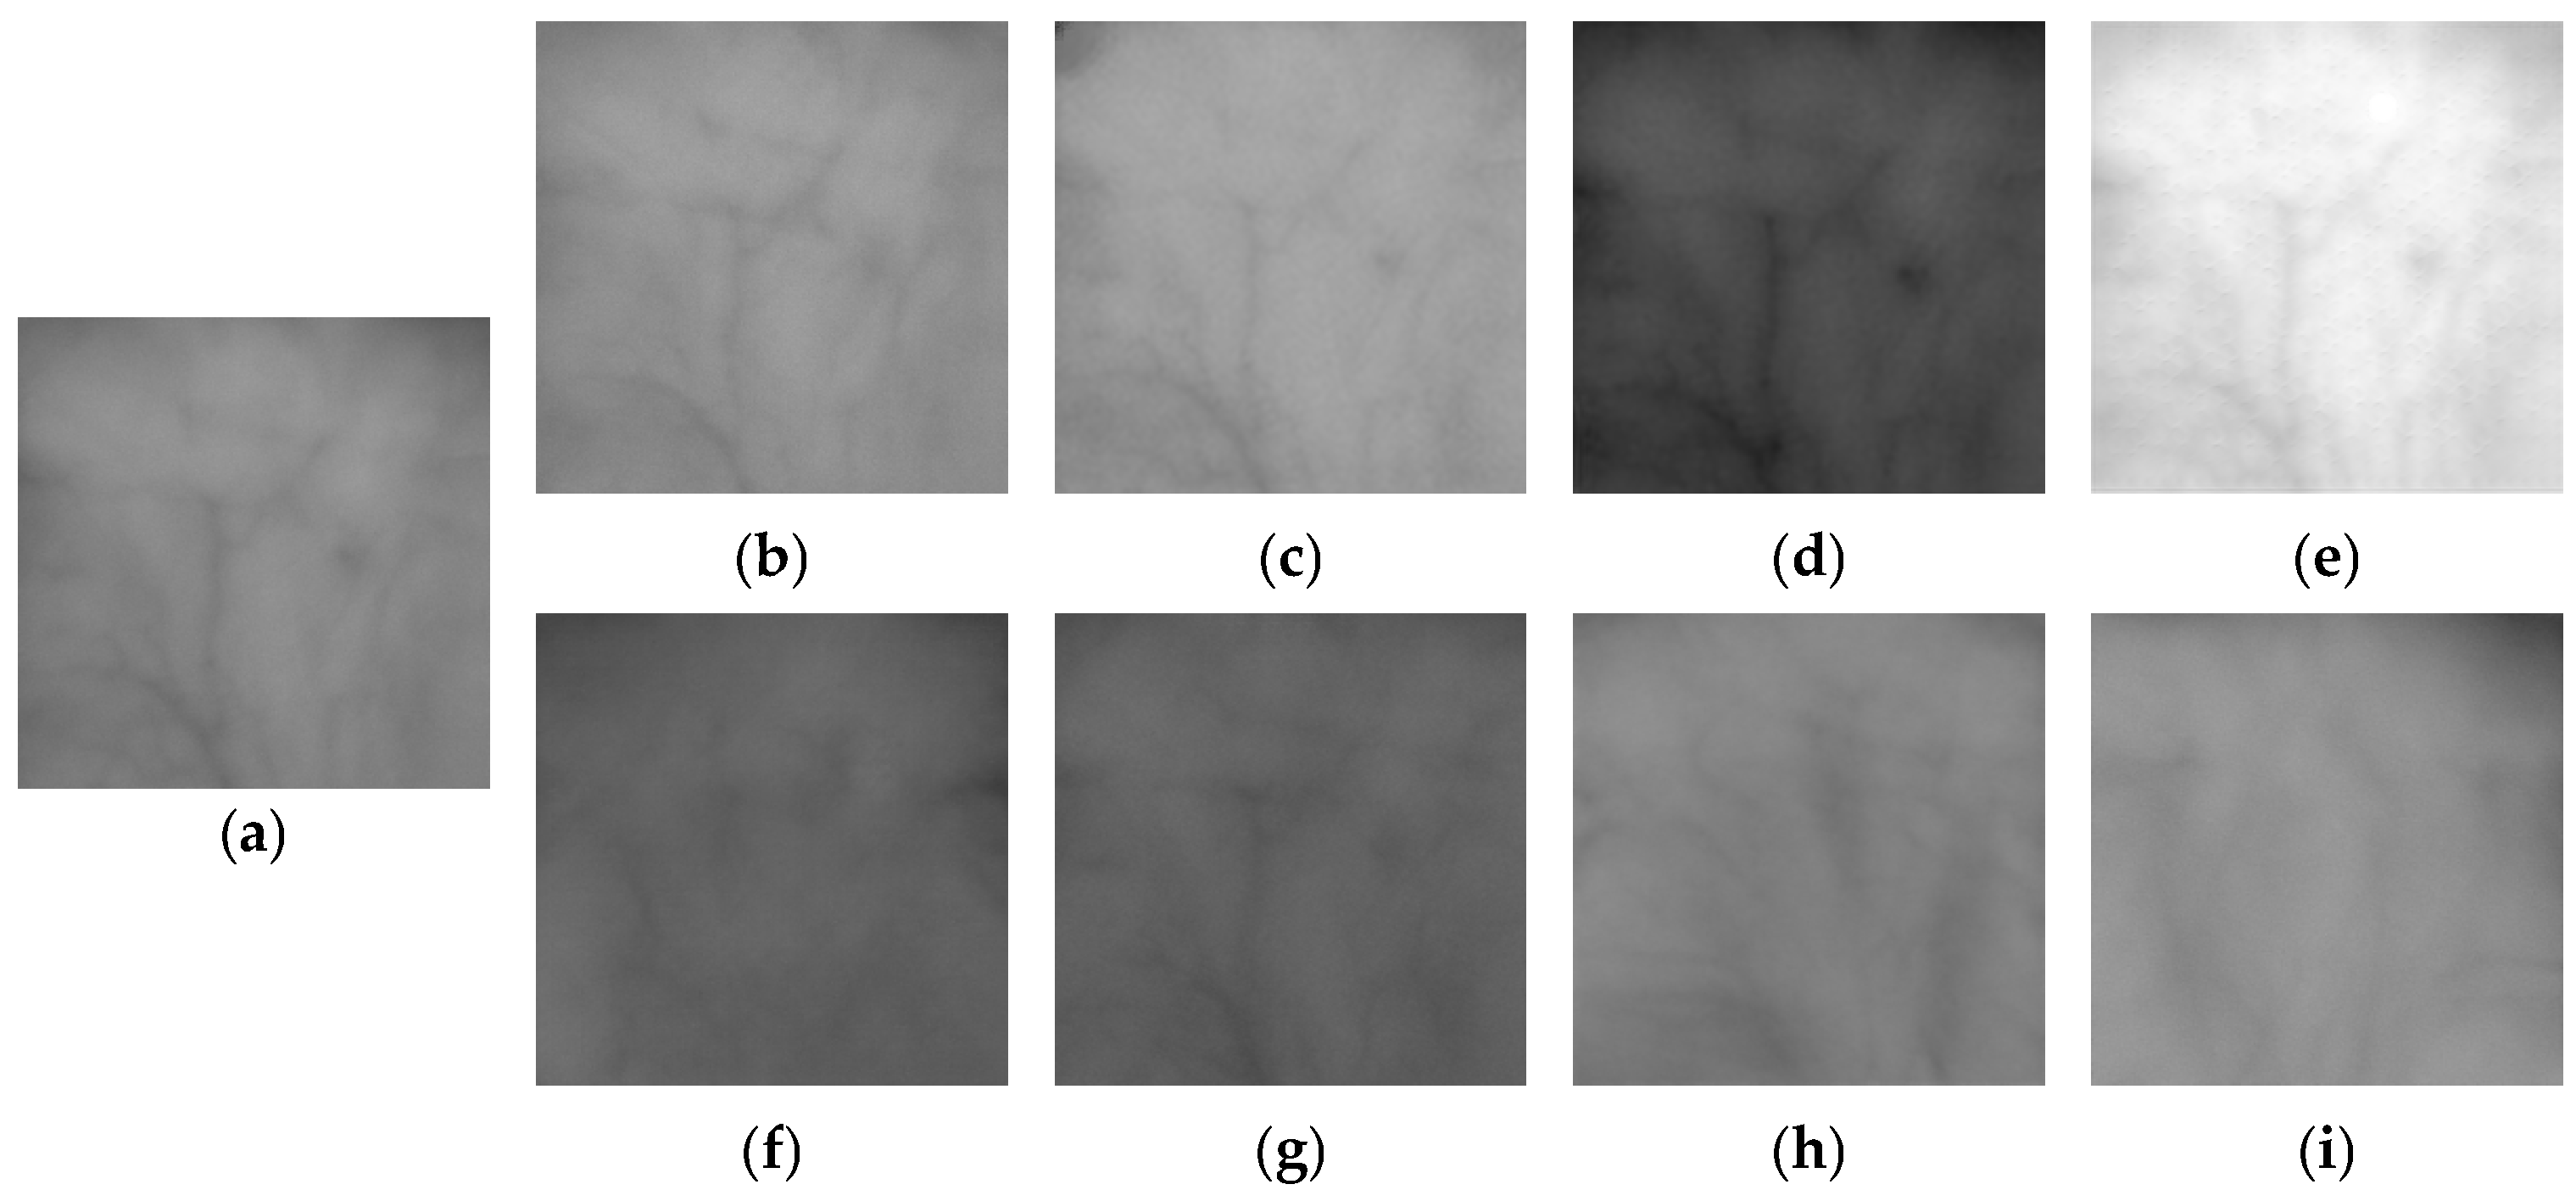
3.3. Generation of Fake Palm-Vein Image for Spoof Attack

In this study, fake palm-vein images were generated using CycleGAN [25]. Figure 3 illustrates the process of generating fake palm-vein images using CycleGAN.
L D = 1 2 [ E x ~ p d a t a D x 1 2 + 1 2 [ E x ~ p d a t a D G A B x 2
L G = 1 2 [ E x ~ p d a t a D G A B x 1 2
L c y c = E x ~ p d a t a G B A G A B x x 1 + E y ~ p d a t a G A B G B A y y 1
L C y c l e G A N = L G + λ   L c y c
Equation (1) represents the LSGAN loss-based discriminator loss applied in CycleGAN for generating fake palm-vein images. The first term trains D x to approach 1 (real) for real image x , while the second term trains the discriminator to make G A B x , which is the image generated by the generator from domain A to domain B, approach 0 (fake). Equation (2) represents the generator loss, where D G A B x is trained to make the discriminator classify the generator’s output as close to 1 (real) as possible. In Equations (3) and (4), x represents an image from domain A, while y represents an image from domain B. Equation (3) defines the cycle consistency loss, which ensures that after data is transformed into another domain and then restored to its original domain, it remains identical to the original input. Equation (4) represents the final loss function used for training CycleGAN in this study. Here, λ was set to 10.
To train a spoof detector that is robust against generated images, it is necessary to create fake palm-vein images that are difficult to distinguish from real ones. In this study, during the training process, the target image was randomly selected from the remaining images within the same intra-class, excluding the input image. This approach ensures that the generated fake image retains both the visual information and class identity of the original image. Figure 4 illustrates the input and target image selection method used in the CycleGAN training process in this study.

3.4. Post-Processing of Fake Palm-Vein Images

This subsection describes the final step in generating fake palm-vein images for spoof attacks, focusing on the post-processing procedure used to remove the unique traces, known as “GAN fingerprints,” that arise in images generated by CycleGAN. GAN fingerprints vary depending on the structure, training process, and dataset of the GAN model, leaving distinctive patterns in the generated images. Yu et al. [36] utilized this characteristic to propose a method that learns GAN fingerprints to trace the origin of images. When GAN fingerprints are present, distinguishing generated fake images using conventional spoof detection methods is relatively straightforward. However, as shown in the study by Neves et al. [37], GAN fingerprints are high-frequency components that can be removed or weakened using Gaussian, average, median low-pass filters, or other methods. This makes it possible to bypass conventional spoof detectors. To address this issue, this study conducted post-processing using various low-pass filters to remove GAN fingerprints, thereby generating the final fake palm-vein images for spoof detection experiments.

3.5. Fractal Dimension Estimation

Fractals are complex structures characterized by self-similarity and deviation from conventional geometric forms [38]. The fractal dimension (FD) serves as a quantitative measure of such complexity, indicating the degree of spatial concentration or dispersion of a shape. In this study, FDE is performed on binary images representing activated regions in palm-vein images—both real and generated. The estimated FD values, typically ranging between 1 and 2, reflect the complexity of the corresponding binary class activation maps (Binary_CAMs), with higher values denoting more intricate structural patterns. FD is computed via the box-counting method [39,40], in which B denotes the number of boxes required to cover the activated region and S represents the scaling factor. The final FD value is derived according to Equation (5).
FD = lim S 0 log B S log 1 / S  
FD lies within the range 1 FD 2 , and, for any scaling factor S > 0, there exists a corresponding box count B ( S ). The pseudocode for estimating the FD of the activated regions in palm-vein images using the box-counting method is detailed in Algorithm 1.
Algorithm 1 Pseudocode for FDE
Input: Binary_CAM: Binary class activation map extracted from CycleGAN’s encoder or
   FGFNet
Output: FD: Fractal dimension
1: Determine the maximum dimension of the box and round it to the nearest power of 2
Max_dimension = max(size(Binary_CAM))
    S  = 2[log2(Max_dimension)]
2: If the image size is smaller than S , apply padding to align it with the dimensions of S .
if size(Binary_CAM) < size( S )
     Padding_width = ((0, S Binary_CAM.shape [0]), (0, S Binary_CAM.shape [1]))
     Padding_Binary_CAM = pad(Binary_CAM, Padding_width, mode = ‘constant’, constant_values = 0)
   else
     Padding_Binary_CAM = Binary_CAM
3: Initialize an array to record the box counts for each dimension scale.
n = zeros(1, S + 1)
4: Determine B S , the number of boxes at scale S that intersect with the positive region
n[ S + 1] = sum(Binary_CAM [:])
5: While S > 1:
    a. Reduce the size of S by a factor of 2.
    b. Update B S with the latest result.
6: Compute log-values of box counts and scales for each S .
7: Perform least squares fitting on [( log 1 / S , log B S ].
8: FD is defined as the slope of the fitted log-log line.
Return FD
In this study, fractal dimension estimation (FDE) is employed as a post-hoc analysis tool in both the image generation and spoof detection stages. In Section 4.4.2, the estimated FD values are used to quantitatively assess the structural complexity of palm-vein images generated by CycleGAN, enabling comparison with real images in terms of spatial irregularity. In Section 5, FDE is further applied to the class activation maps (CAMs) of FGFNet to analyze the structural properties of the discriminative regions activated during spoof detection. These applications provide quantitative evidence for evaluating the visual realism of generated samples and offer additional interpretability regarding the model’s attention behavior, thereby supporting the overall reliability of the proposed framework.

3.6. Spoof Detection by FGFNet

In general, a spoof detector for generated fake images should be positioned between the input section, where the user’s biometric information is received, and the recognition module. Therefore, to ensure user convenience, it must guarantee fast processing time while also maintaining high reliability to effectively detect spoofing. To achieve this, this study combines the local feature learning capability of CNNs with the global feature learning capability of vision transformers (ViTs). As a result, MobileViT [41] was selected as the backbone model, as it maintains high performance even in resource-constrained environments such as edge devices while using a small number of parameters. Figure 5 illustrates the architecture of FGFNet proposed in this study.

3.6.1. MF-GF Block

Recently, fake images generated by deep learning-based generative models have attained a level of sophistication that makes them nearly indistinguishable from real images to the human eye. However, when converted to the frequency domain representation (FFT image), real and fake images tend to exhibit noticeable differences [42]. Leveraging this characteristic, this study proposes the MF-GF block.
The proposed MF-GF block is based on the similarity of pixel values and patterns between real and fake palm-vein images, as well as the fact that GAN fingerprints correspond to high-frequency components. Additionally, it is designed by utilizing the tendency of energy in FFT-transformed images to spread vertically and horizontally from the center. First, FFT is applied to the input palm-vein image (Figure 6a). Next, to remove the influence of brightness components and process only the frequency components, min-max normalization is performed on the FFT image (Figure 6b) within the range of 0 to 1. Next, to compute the strength of the DC and low-frequency components, a 10 × 10 region is extracted from the center, as shown in Figure 6c. The optimal size of this region was determined based on the fake detection accuracy using training data. Since the mean value of the extracted 10 × 10 region represents the DC and low-frequency components, this value is used to determine the radius of circular mask in Figure 6d. Hence, a higher value indicates a greater presence of DC and low-frequency components in the input image. Consequently, the radius of mask in Figure 6d is expanded to allow the extraction of higher-frequency components from the input image. The optimal radius of mask relative to the mean value of the 10 × 10 region was also determined based on the fake detection accuracy using training data. Finally, the computed mask is applied to the FFT image (Figure 6b), selectively suppressing low-frequency components. This enables effective analysis of the high-frequency differences between real and fake images (for example, GAN fingerprints), as shown in Figure 6e. Lastly, a 3 × 3 convolution operation is performed on the masked FFT image to extract a frequency-domain-based feature map.
Additionally, since local information such as edges and textures lost in the masked FFT image can also be critical for spoof detection, the original input image undergoes a separate 3 × 3 convolution operation, as shown in Figure 5, to obtain a spatial domain-based feature map. The two extracted feature maps are then combined through a gated feature fusion process, which dynamically adjusts weights to suppress unnecessary information while emphasizing useful information.
F s p a t i a l = Conv I i n p u t
I f f t = Norm Abs FFT I i n p u t
I f f t m a s k e d = I f f f t     Mask
F f f t m a k s e d = Conv I f f t m a s k e d
G = σ w g a t e F s p a t i a l ,   F f f t m a s k e d
F f u s i o n = G     F s p a t i a l + 1 G   F f f t m a s k e d
F o u t p u t = Dense F f u s i o n
In Equations (6)–(12), I represents the image, F represents the feature map, and w represents the weight. In Equation (7), the FFT transformation is applied to the input image, after which the values are normalized around the DC component, resulting in I f f t , a frequency domain image. In Equation (8), a mask that removes the DC component is applied to I f f t , and element-wise multiplication is performed to extract I f f t m a s k e d . Then, in Equation (9), a convolution operation is applied to obtain F f f t m a k s e d . Equations (10) and (11) pertain to gated fusion, where σ represents the sigmoid function, and G denotes the gate map that controls the importance of the two feature maps. As shown in Equation (11), the gate map is used to assign importance to   F s p a t i a l and F f f t m a s k e d , which are then summed to obtain the dynamically fused F f u s i o n . Finally, as shown in Equation (12), F f u s i o n is processed through a dense layer to obtain F o u t p u t , making it suitable for the next layer.

3.6.2. FA-GCL Block

Blurs and noise, such as edge smearing and pixel distortion caused by generative models, are considered key traces of forgery in forensic systems and can serve as essential features for spoof detection. However, real palm-vein images exhibit global characteristics such as blur and smoothness due to the reflection, rather than transmission, of NIR light. These characteristics make it challenging to distinguish between real and fake palm-vein images.
To address this issue, it is necessary to effectively utilize both local features and non-local (global) feature information. Local features are advantageous for capturing fine structural details such as edges, but they have limitations in effectively distinguishing pixel distortions or noise generated by generative models. In contrast, global features allow for the analysis of low-frequency components across the entire image, making them effective for detecting global distortion patterns such as blur or smoothness.
Accordingly, this study proposes the FA-GCL block, which integrates a local branch and a global branch, as illustrated in Figure 5. This block extends the conventional ViT block by incorporating a local branch utilizing conventional convolution and a global branch based on an FFC-based ViT block, which enables the separation and analysis of low-frequency and high-frequency features in the frequency domain. This allows simultaneous learning of both local and global information. In particular, unlike conventional contrastive loss that relies solely on similarity comparison, this study enhances the training direction of the model by introducing a loss function that reflects the complementary nature of local and global features. Moreover, at the end of each block, the correlation between the two feature maps is learned through contrastive loss while applying attention. This maintains a balance between global and local features, ultimately extracting the final feature map.
sim F 1 , i v , F 2 , i f v = F 1 , i v · F 2 , i f v F 1 , i v 2 · F 2 , i f v 2
L G C = max 0 ,   1 sim F 1 , i v , F 2 , i f v
L T G C = 1 N i = 1 N L G C i
L C E = 1 N i = 1 N j = 1 C y i , j log y ^ i , j
L F G F N e t = L C E + λ   L T G C
Equations (13) and (14) pertain to contrastive loss, where L G C represents the global contrastive loss, F 1 , i v represents the feature map from the conventional MobileViT block, and F 2 , i f v represents the feature map extracted from the FFC MobileViT block. The similarity between these two feature maps is computed to encourage them to become more similar. Here, the local feature map primarily focuses on edges and structural information, whereas the global feature map analyzes overall blur and smoothness patterns in the frequency domain. The interaction between these two feature maps is enhanced using contrastive loss. As shown in Equation (15), the contrastive loss between the two feature maps is computed for each block to obtain L T G C (total global contrastive loss). This loss is then weighted and averaged, and the final loss is updated as in Equation (17). Here, λ was set to 0.1, and its optimal value was determined based on the fake detection accuracy using training data. In Equation (16), L C E represents the cross-entropy loss. y i , j and y ^ i , j correspond to the one-hot encoded ground truth label and the predicted probability of the correct label, respectively. N and C denote the number of samples in a batch and the number of classes, respectively. Finally, Equation (17) enables a higher level of global–local integrated learning compared to conventional contrastive loss.
Table 1 presents a description of the layer-wise structure of FGFNet. FFT Norm refers to FFT normalization, Mask represents the block that creates and applies a mask, as described in Section 3.6.1, Abs represents the absolute value operation, Conv stands for convolution, FFC represents fast Fourier convolution, and Add represents element-wise addition.

4. Experimental Results

4.1. Experimental Datasets and Environments

In this study, two palm-vein open datasets, the VERA Spoofing PalmVein dataset (VERA dataset) and PLUSVein-Contactless dataset (PLUS dataset) were used to generate fake palm-vein images and evaluate the performance of the proposed method. For the VERA dataset, 50 people were divided into two sessions, and 5 trials were performed on the right and left hands, totaling 1000 palm-vein images (50 people × 2 sessions × 2 hands × 5 trials). The VERA dataset was collected using a custom-built palm-vein prototype sensor developed at the Haute Ecole Spécialisée de Suisse Occidentale in Sion, Switzerland. It consists of palm-vein images from 110 participants (70 males and 40 females) aged between 18 and 60 years (mean age ≈ 33) (demographic information such as ethnicity was not disclosed for this dataset).
For the PLUS dataset, the same palm was captured twice with NIR reflected lights of 850 nm and 950 nm wavelengths in a single session from 42 people, and the right and left hands were captured five times each, totaling 840 images (42 people × 2 lights × 2 hands × 2 trials × 5 trials). The PLUS dataset was collected using a custom-built contactless palm-vein acquisition device developed at the Artificial Intelligence and Human Interfaces (AIHI) Laboratory, University of Salzburg, Austria. It contains samples from 39 participants (31 males and 8 females) aged between 27 and 61 years (mean age ≈ 38). Most of the subjects are white Europeans, with a few Persian, Caucasian, and Latin American individuals also included.
Table 2 shows the details of the VERA dataset and PLUS dataset. In this study, 1000 and 840 fake images were generated from the images in the VERA dataset and PLUS dataset, respectively, using the method in Section 3.3 and used in the experiment. Figure 7 shows an example of the real images of each dataset and the fake images generated from them.
The experimental work in this study was performed using a desktop computer with an Intel(R) Core(TM) i7-9700F central processing unit (CPU) operating at 3.0 GHz, 32 GB of RAM, and an NVIDIA GeForce RTX 3060 graphics processing unit (GPU). This graphics card contains 3584 compute unified device architecture (CUDA) cores and 12 GB of dedicated graphics memory [43].

4.2. Training of Proposed Framework

All experiments related to spoof attack (generating fake palm-vein images) and spoof detection proposed in this paper were conducted using the 2-fold cross-validation method. To prevent overfitting each model and achieve optimal results, about 10% of the training data was separated as a validation set.

4.2.1. Training of CycleGAN for the Generation of Fake Palm-Vein Images

As described in Section 3.3, CycleGAN is used in this study to generate fake images for spoof attacks. CycleGAN was trained from scratch, and to achieve smooth training and results, the input image was randomly cropped to 224 × 224 and then resized to 256 × 256 as a data augmentation to give diversity to the training images. In addition, since the palm-vein recognition system cannot input the palm in the vertically opposite flip to the input sensor, we randomly applied only left and right flips to ensure that the correct image is generated according to the actual system that uses the right or left hand. Table 3 shows the hyperparameter settings used for training, and Figure 8 shows the training loss graph and validation loss graph for CycleGAN training. As shown in Figure 8a, with the increase of epochs, the training loss graphs of the generator and discriminator converged, indicating that CycleGAN was sufficiently trained on the training data. Also, as shown in Figure 8b, with the increase of epoch, the validation loss graphs of the generator and discriminator converged, indicating that CycleGAN was not overfitted to the training data.

4.2.2. Training of FGFNet for Spoof Detection

Table 4 provides information about the hyperparameter settings used to train FGFNet. Figure 9 shows the training loss and accuracy graphs and validation loss and accuracy graphs for the FGFNet training process. As shown in Figure 9a, with the increase of epochs, the training loss and accuracy graphs converged, which indicates that FGFNet is well-trained on the training data. Also, as shown in Figure 9b, the validation loss and accuracy graphs converge as the epoch increases, indicating that FGFNet is not overfitted with the training data.

4.3. Evaluation Metrics

4.3.1. Evaluation of the Quality of Fake Palm-Vein Images

In this study, we used Fréchet inception distance (FID) [44], which is calculated by comparing the feature maps extracted through pretrained inceptionV3 between real and fake palm-vein images, and learned perceptual image patch similarity (LPIPS) [45], which is a method of extracting and comparing the feature maps of the middle layer using a pre-trained visual geometry group (VGG) net, respectively, as measures to evaluate the quality of the generated images for spoof attack.
FID = F r F f 2 + T r r + f 2 r f 1 / 2
LPIPS = l w l F r l F f l 2 2
Equation (18) is about FID, where F r and F f are the mean vectors of the extracted feature maps from the real image and the fake image, respectively. We calculate the Euclidean distance F r F f 2 for these two vectors, which measures the difference in covariance between the two image distributions, such as T r r   +   f   2 r f 1 / 2 , reflecting the difference between the distributions of real and fake images. Equation (19) is for LPIPS, where F r l and F f l are the feature maps obtained from a specific layer l . The difference between the two feature maps is obtained by computing F r l F f l 2 2 , L2 distance squared. The difference in visual quality between the two images is then calculated by considering w l (a weight reflecting the importance of each layer). FID and LPIPS measure how similar the generated image is to the real image, and the smaller the value, the more similar the generated image is to the original image. The more difficult it is to distinguish between them with InceptionV3 [24] and VGG Net [17] pre-trained with ImageNet, respectively.

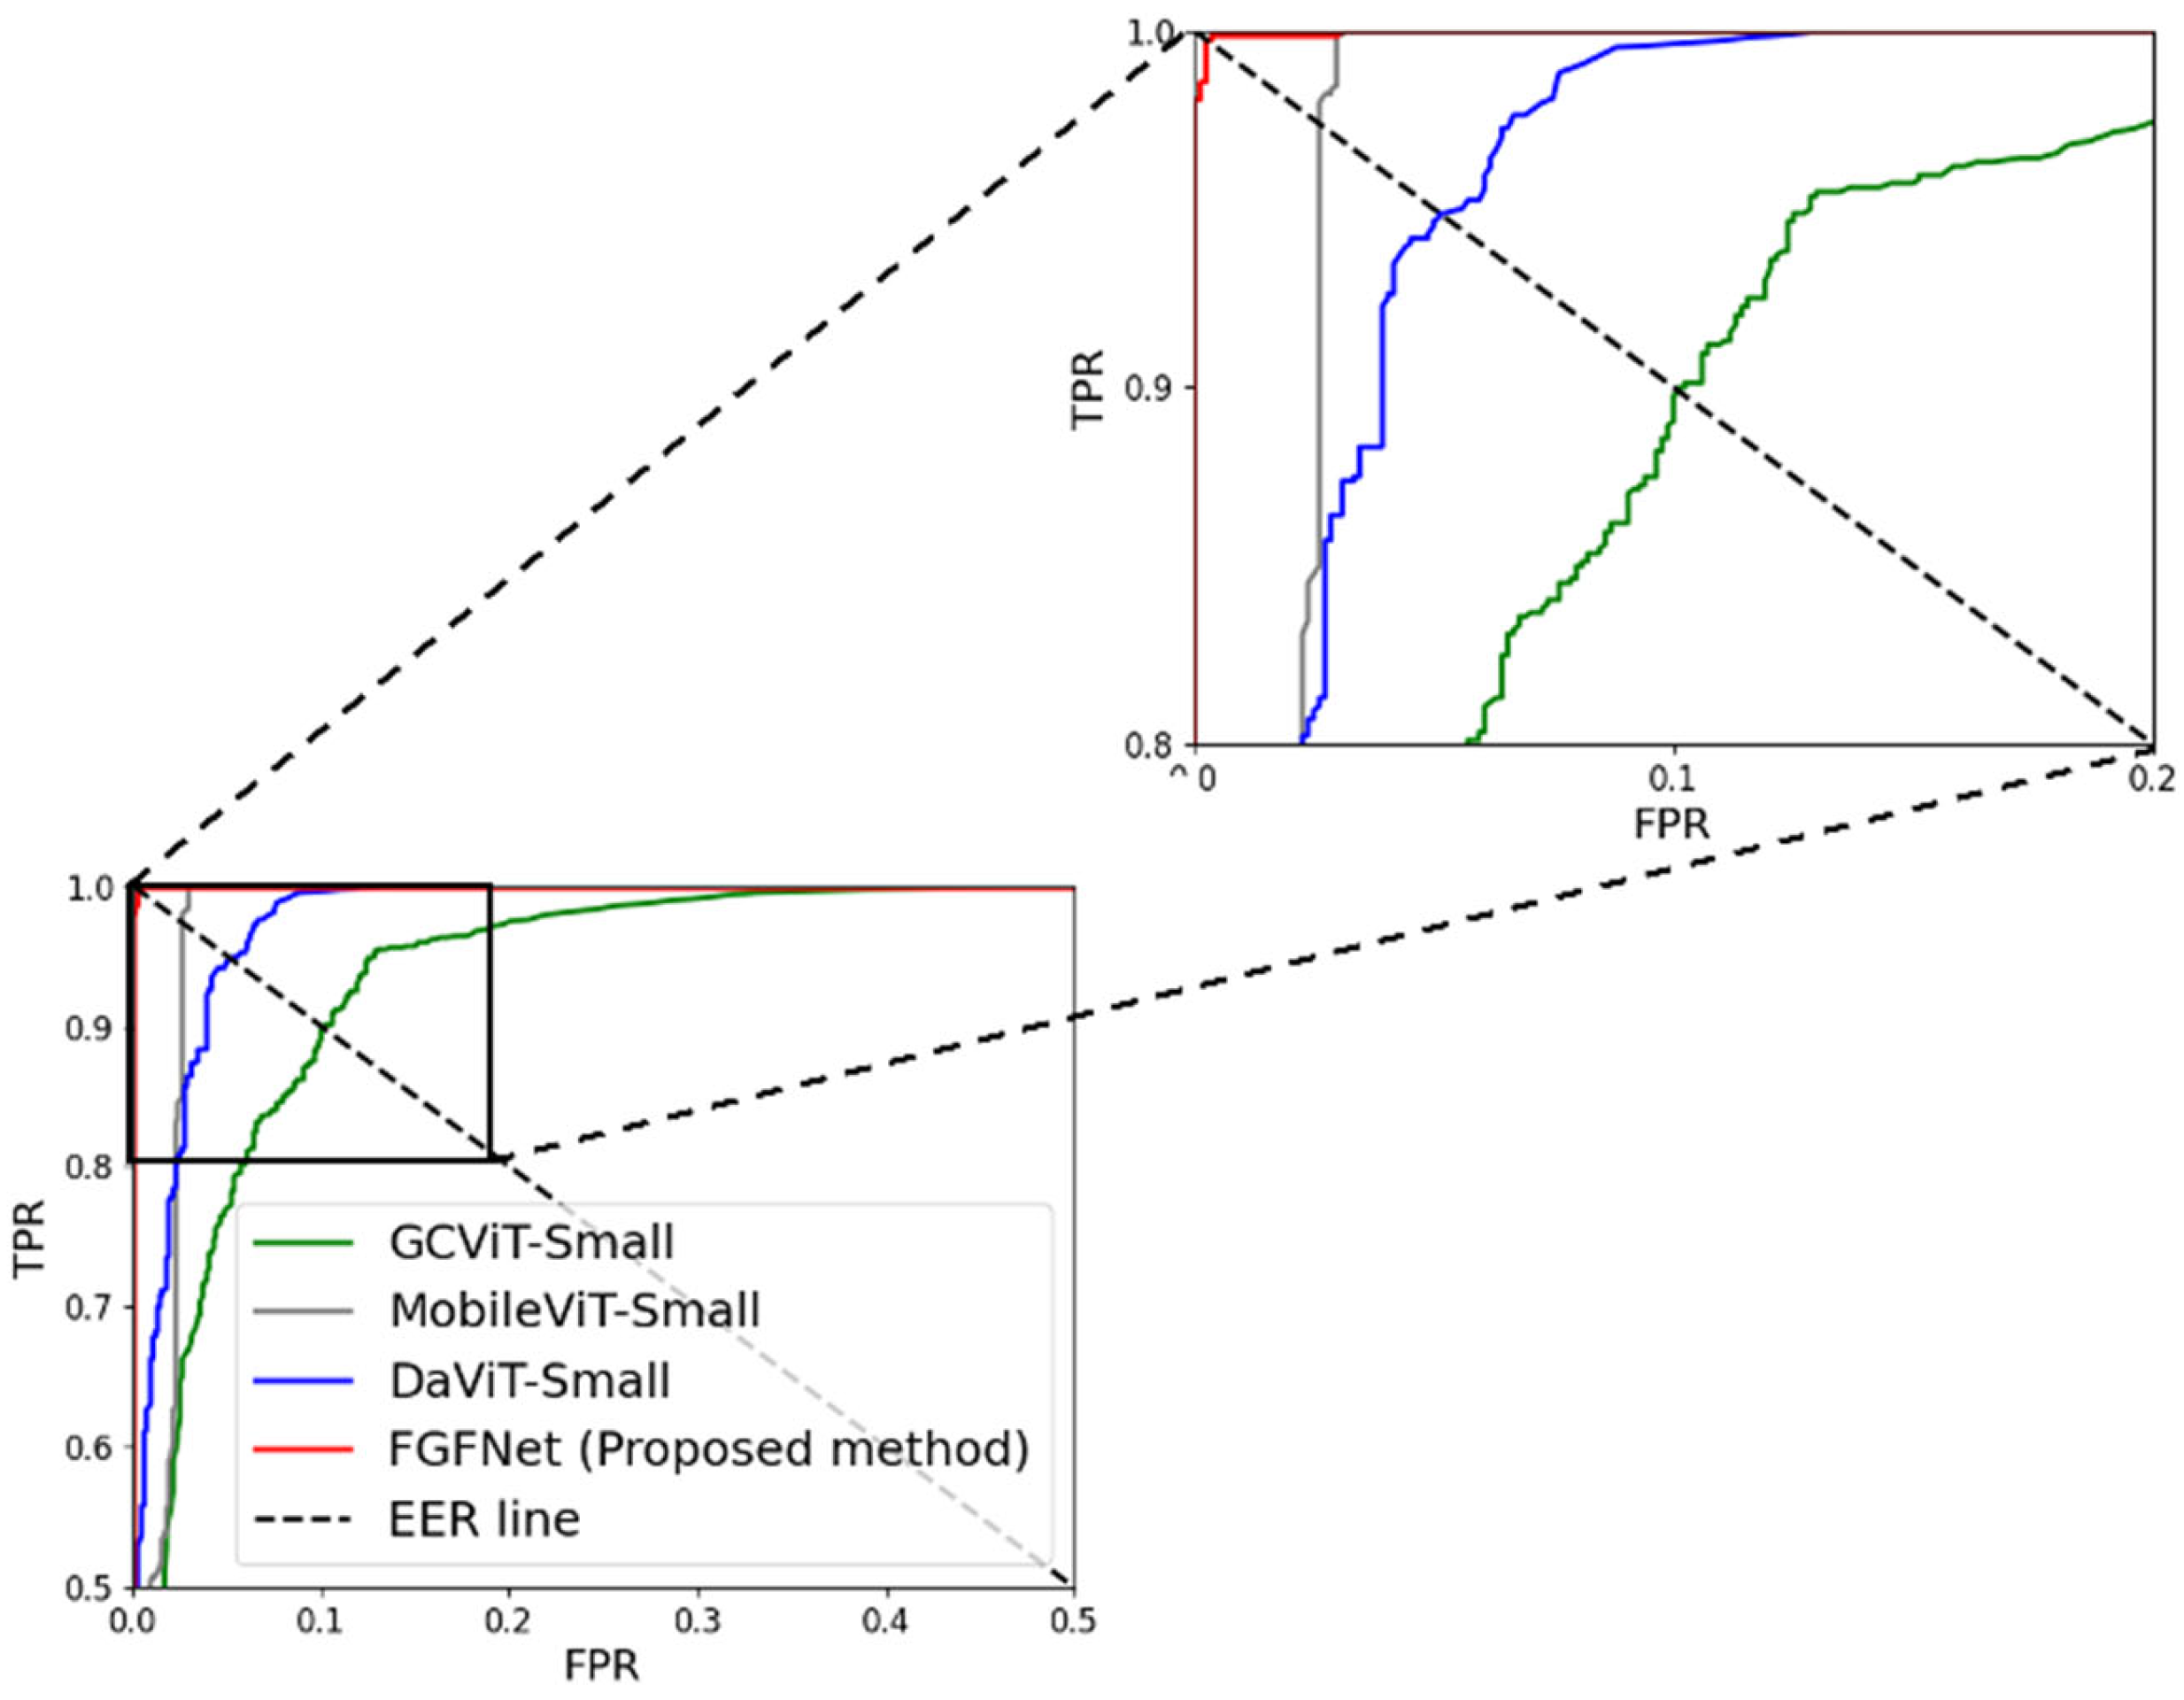
4.3.2. Evaluation of Spoof Detection Accuracy

The performance evaluation of spoof detection follows the ISO/IEC-30107 standard (ISO/IEC JTC1 SC37 Biometrics [46]). In Equations (20) and (21), attack presentation classification error rate (APCER) denotes the error rate at which a fake image is misclassified as a real image, and bona fide presentation classification error rate (BPCER) denotes the error rate at which a real image is misclassified as a fake image. The average classification error rate (ACER) is the average value of APCER and BPCER, as shown in Equation (22), which means the overall error rate. These metrics are used to quantitatively evaluate the accuracy and reliability of a spoof detection system.
APCER = 1 1 I f i = 1 I f p r e d i
BPCER = 1 I r i = 1 I r p r e d i
ACER = ACPER + BPCER   2
I r and I f denote the number of real images and fake images, respectively. p r e d i means the predicted label obtained from the spoof detector, and in Equation (20), i = 0 if a fake image is misclassified as a real predicted label, and i = 1 if it is correctly classified as a fake predicted label. In Equation (21), i = 1 if the real image is misclassified as a fake predict label, and i = 0 if it is correctly classified as a real predict label.

4.4. Testing of Spoof Attack Method

4.4.1. Quality Assessment of Generated Fake Palm-Vein Images by FID and LPIPS

Table 5 shows the quality evaluation results for fake palm-vein images generated by different state-of-the-art (SOTA) methods. The SOTA methods used include GAN-based methods [5,25,47,48,49,50] and diffusion-based methods [51,52].
Both the VERA and PLUS datasets used in this study showed the best performance (lowest FID and LPIPS values) on CycleGAN, which is in line with the direction of this study, which aims to generate fake images similar to real images as a model designed for image-to-image translation tasks, and shows that the generated images can produce high-quality fake images while retaining the identity and visual information of the original image.
On the VERA dataset, DDPM [51] performed relatively poorly on both FID and LPIPS metrics, and on the PLUS dataset, DDPM [51] performed relatively poorly on the FID metric and DCS-GAN [5] performed relatively poorly on the LPIPS metric. Since the diffusion model used by DDPM is a method that gradually adds Gaussian noise to the original image and restores it by removing it, it is difficult to preserve high-frequency components (edges, details) during the denoising process, which may result in a relatively low ability to maintain structural consistency in image-to-image translation. Furthermore, since DCS-GAN [5], CUT [49], and DCL-GAN [50] learn by utilizing contrastive loss to adjust the feature relationship between two samples, it is likely that the PLUS dataset contains a mixture of light and dark images compared to the VERA dataset, resulting in contrast-emphasized images. For this reason, unlike FID, which evaluates global feature distribution, LPIPS, which evaluates local feature patch similarity, is relatively sensitive to brightness differences, resulting in lower performance.
Figure 10 and Figure 11 show examples of the original real palm-vein images from the VERA dataset and PLUS dataset, respectively, and the fake palm-vein images generated by the various methods in Table 5. In the full images in Figure 10 and Figure 11f–i, we can see that the vein patterns are distorted or have different shapes from the original, while in Figure 10 and Figure 11b–e, we can see that the vein patterns in Figure 10 and Figure 11a are generated well in comparison. However, in Figure 10 and Figure 11c, the pattern of the veins is somewhat blurred, which tends to reduce the continuity of the vein structure. Also, in Figure 10 and Figure 11d,e, the texture appears to be over-emphasized in some areas.

4.4.2. Quality Assessment of Generated Fake Palm-Vein Images by FDE

To assess the similarity between real and fake palm-vein images generated by CycleGAN, we conducted FDE, which quantifies image complexity. We employed Eigen-CAM [53], a class-agnostic technique for identifying salient regions in feature maps, to extract class activation maps (CAMs) without relying on class labels. Unlike conventional CAM methods that depend on class-specific activations, Eigen-CAM highlights key regions regardless of label information.
Specifically, CAMs were derived from the final encoder layer of the CycleGAN generator, and subsequently binarized to produce binary class activation maps (BCAMs) used for FDE. The resulting FD values reflect the structural complexity of these activation regions. As illustrated in Figure 12 and Table 6, the FD values for real and fake palm-vein images are closely aligned, indicating that the generated images exhibit similar structural patterns to real ones. This demonstrates that the CycleGAN can produce highly realistic fake images that preserve the intrinsic complexity of genuine samples. Consequently, this capability holds promise for bolstering the robustness of palm-vein recognition systems against spoofing threats.

4.4.3. Comparisons of Spoof Detection Accuracies on the Fake Generated Images by CycleGAN and SOTA Methods

As described in Section 3.4, fake generated images contain noise such as ‘GAN Fingerprint’ [37], which is not visible to the human eye, and this noise facilitates spoof detection of fake images. In this study, we remove noise from fake generated images through post-processing, such as low-pass filtering, to create fake images that are difficult to distinguish from real images. These fake images can be used to train a more robust spoof detector. In this study, based on the spoof detection results of [5], we conducted experiments using a spoof detector based on the ConvNeXt-Small [27] model. The model was trained with real palm-vein images and fake palm-vein images without post-processing generated by each SOTA generative model. In addition, the low-pass filters Gaussian blur filter, Median blur filter, and Average blur filter were applied to remove GAN fingerprints with 3 × 3 and 5 × 5 kernel sizes, respectively, to analyze how much error the spoof detector generates. Table 7 and Table 8 show the results for the VERA dataset and PLUS dataset, respectively.
Since the shape and frequency band characteristics of the GAN fingerprint left behind by different generative models are different, the performance change due to post-processing is also different for each model. In some models, applying post-processing to spoof attack images does not increase the error rate much, but in some models, the error rate increases significantly. Furthermore, applying too much post-processing may make it easier for the spoof detector to distinguish between fake and real. As described in Section 4.4.1, for diffusion-based models, the high-frequency components are lost in the process of gradually adding Gaussian noise and restoring them by removing the noise, so the post-processing may cause too much of the high-frequency components to be lost in the fake image, which increases the spoof detection performance. On the other hand, for the GAN-based models, the error rate of spoof detection increased with post-processing compared to no post-processing. In addition, the results in Table 7 and Table 8 show that for CycleGAN, all post-processing techniques resulted in the same error rate, but the fake palm-vein images with the 5 × 5 average filter as post-processing, which caused a relatively large error rate increase for the other generated models, were utilized in all subsequent spoof detection experiments.

4.5. Testing of Spoof Detection Method

4.5.1. Ablation Studies of FGFNet

An ablation study was conducted to analyze the impact of each component on the performance of the FGFNet method proposed in this paper and confirm that the design of the model is optimized for spoof detection for the palm-vein recognition system. We iteratively removed components step by step under all the same conditions. Table 9 and Table 10 show the results of the ablation study of FGFNet using the VERA dataset and PLUS dataset, respectively. In Table 9 and Table 10, pre-trained weights refer to the use of transfer learning based on ImageNet pre-trained weights, and FFC in backbone refers to the use of MobileViT block or MobileViT FFC block, which are the backbone models used in this paper. FA-GCL and MF-GF refer to the components of FGFNet described in Section 3.6.2 and Section 3.6.1, respectively.
In both VERA and PLUS datasets, although there is a clear dependence on pre-trained weights due to the nature of the ViT model (spoof detection error decreases for transfer learning with pre-trained weights), we found that the error rate decreases with each step of adding each component of FA-GCL and MF-GF, indicating that the method proposed in this paper is effective in detecting fake palm-vein images. Finally, in the experiments with all components, we found that the VERA dataset shows the best result of 0.3% in terms of ACER, and the PLUS dataset shows the lowest error rate of 0.3% in terms of ACER.

4.5.2. Comparisons with SOTA Approaches

The spoof detection accuracy of FGFNet proposed in this paper is compared with the SOTA method. Table 11 shows the comparison of experimental results using the real images of the VERA dataset and the fake images generated based on them, and Table 12 shows the experimental results for the real images of the PLUS dataset and the fake images generated using them.
As shown in Table 11 and Table 12, FGFNet outperforms SOTA spoof detectors on VERA and PLUS datasets. This shows that FGFNet improves spoof detection performance in a different way than existing models that simply rely on local or global features, by learning a balance of both features and utilizing features in the spatial domain along with features that can highlight the ‘GAN Fingerprint’ in the frequency domain. CNN-based models such as [1,4,5,19,27,56] have strengths in learning local features such as edges and textures but have limitations in distinguishing subtle differences in spoofed images that closely resemble real images.
On the other hand, transformer-based models such as [6,38,54,55,57,58] can learn the global context through self-attention mechanisms, but they require more training data than CNNs and have the potential to lose local information. In contrast, the FGFNet proposed in this work can effectively learn local features like CNNs through FA-GCL blocks, while learning global features like transformers. In addition, by introducing global contrastive loss, we maximize the performance of fake image detection by learning local and global features in a balanced manner.
Furthermore, we compared the spoof detection performance of FGFNet and SOTA methods using receiver operating characteristic (ROC) curves, which represent the relationship between false positive rate (FPR) (the percentage of images with negative (fake) labels incorrectly predicted as positive (real) labels) and true positive rate (TPR) (the percentage of images with positive (real) labels correctly predicted as positive labels), which is commonly used in spoof detection performance evaluation for existing biometric systems [59]. In these ROC curves, the closer the curve is to the upper left, the better the performance. Figure 13 shows the ROC curves of the 1st to 4th best models, including the proposed method in Table 11, and Figure 14 shows the ROC curves of the 1st to 4th best models, including the proposed method in Table 12. As shown in Figure 13 and Figure 14, the proposed method outperforms the other methods. This means that FGFNet can minimize false positives and false negatives while maintaining high counterfeit detection accuracy.

4.5.3. Cross-Generator and Cross-Detector Evaluations

To examine the robustness and generalizability of our proposed spoof detection method, we conducted comprehensive cross-generator and cross-detector experiments using the top three image generation models identified in Table 7: CycleGAN (best method), Pix2PixHD (second-best), and CUT (third-best), as well as the top three spoof detection architectures from Table 11: FGFNet (proposed method), MobileViT-Small (second-best), and SwinTransformerV2-Small (third-best).
Across all configurations, the combination of CycleGAN-generated fake images and the proposed FGFNet consistently achieved the highest detection performance, as summarized in Table 13. Notably, FGFNet also demonstrated strong performance when tested against fake images generated by unseen models such as CUT and Pix2PixHD, highlighting its adaptability beyond a single generative source.
These results suggest that while CycleGAN was used as the core generative model, the proposed detection framework does not rely solely on it. Instead, it exhibits robustness across multiple types of generative artifacts. The superior performance of FGFNet across diverse attack types further supports its generalization capability, even under distributional shifts introduced by unseen generators.

4.6. Comparisons of Processing Time and Algorithm Complexity

Since FGFNet is frequently used to determine the presence or absence of forgery for palm-vein images inputted in real-time from client edge devices. It should be able to operate sufficiently in the edge device environment, which is a resource-constrained environment. Therefore, in this study, for FGFNet and SOTA models, we measured the processing time on the Jetson TX2 embedded system (Figure 15) [60] with NVIDIA Pascal™-family GPU consisting of 256 CUDA cores, and also measured the GPU memory usage, number of parameters (param.), and floating point operations (FLOPs), which are shown in Table 13.
Table 14 shows that FGFNet has a relatively small 3.79 million (M) param. and 3.18 gigabytes (GB) of FLOPs, with a processing time of 43.32 ms (approximately 23.08 frames per second (fps)) on the Jetson TX2 embedded system, a limited computing environment. Furthermore, the GPU memory usage is 22.79 megabytes (MB), which confirms that it can operate smoothly enough in edge device environments. In addition, FGFNet is the second-best performer in all metrics in Table 14, but it outperforms SOTA methods in spoof detection performance, which is the target of this study, as shown in Table 11 and Table 12 and Figure 13 and Figure 14.

5. Discussion

Figure 16 presents examples of palm-vein images collected under real-world conditions, where moderate pose variations, such as hand rotation, tilt, and displacement, are commonly observed. These variations highlight the practical difficulty of maintaining consistent palm alignment and background removal during preprocessing. While the proposed pipeline is generally robust to such moderate changes, more pronounced pose deviations can introduce spatial inconsistencies that compromise the generation of realistic fake images or interfere with feature extraction, often leading to incorrect detection cases as discussed below.
Figure 17 shows a correct spoof detection case in the FGFNet experiment utilizing real images from the VERA and PLUS datasets and fake images generated based on them. The results show that FGFNet achieves high classification accuracy on most of the test images, even though the fake images generated are difficult to distinguish with the naked eye. This can be interpreted as a result of FGFNet effectively learning GAN fingerprints in the frequency domain as well as changes such as distorted patterns and blur that occur in the spatial domain. These results suggest that FGFNet’s masked FFT map-based MF-GF can effectively distinguish between fake and real images by considering both domains.
On the other hand, Figure 18 shows an incorrect spoof detection case. In particular, as shown in the red boxed area in Figure 18, during the process of acquiring the palm-vein image, the position and orientation of the hand may change due to changes in the user’s posture. These factors increase the likelihood that the palm area in the image will not be precisely aligned or contain background regions (black areas). The CycleGAN-based fake image generation method used in this study is limited in learning a clear boundary between the background and palm regions. In addition, in images containing background regions, the fake image does not fully reflect the structural features of the palm veins in the real image, and when the palm region is mixed with the background region, frequency characteristics such as GAN fingerprints change, which can confuse the feature extractor of FGFNet. In addition, CycleGAN may generate unnecessary artifacts as it tries to compensate for unbalanced features in the background during training. We believe that these issues prevented FGFNet from learning the correct features.
In this study, we conducted experiments using the gradient-weighted class activation mapping (Grad-CAM) [61] technique to analyze the criteria by which FGFNet, a spoof detector for the proposed palm-vein recognition system, distinguishes between real and fake images. Grad-CAM visualizes important features as judged by the model in red and less critical features in blue. Figure 19 and Figure 20 show the Grad-CAM results for real and fake images on the VERA and PLUS datasets, respectively. In each figure, the first column corresponds to the real image, and the second corresponds to the fake image. In each column, the leftmost column shows the original input image, followed by the Grad-CAM obtained from the MF-GF block, and the third through fifth columns show the Grad-CAM results obtained from the element-wise addition between the three MobileViT blocks and the FFC-MobileViT block within the FA-GCL block (first block of the FG-GCL block, second block of the FG-GCL block, and third block of the FG-GCL block).
Analyzing the Grad-CAM in the MF-GF block, we observe that activation regions are more evenly distributed in real images, whereas fake images exhibit localized activations following a distinct pattern as shown in the second columns of Figure 19 and Figure 20. This is due to the influence of GAN fingerprints, which play a crucial role in distinguishing real and fake images within the frequency domain. Furthermore, the Grad-CAM results from the FA-GCL block (last columns of Figure 19 and Figure 20) reveal notable differences in activation intensity between real and fake images. Specifically, fake images tend to exhibit excessive activation in high frequency areas compared to real images. That is, fake images contain high-frequency components spanning a broader spectral range than real images. As a result, we show that the FGFNet proposed in this work can effectively discriminate between real and fake images by utilizing the difference between them.
To assess the spoof detection performance of FGFNet between real and fake palm-vein images, FDE, as detailed in Section 3.5, was applied to the Grad-CAM images presented in the last columns of Figure 19 and Figure 20, which were extracted from the third block of the FA-GCL block. As shown in Figure 21 and Table 15, the resulting FD scores revealed a substantial difference between real and fake images, demonstrating the effectiveness of the proposed spoof detection approach in identifying fake palm-vein images.
In addition, we conducted statistical tests using Student’s t-test [62] and evaluated effect sizes using Cohen’s d-value [63] to compare ACERs obtained from the proposed and second-best methods, as detailed in Table 11. Cohen’s d-values of approximately 0.2, 0.5, and 0.8 indicate small, medium, and large effect sizes, respectively.
In Figure 22, the p-value comparing the two methods was 0.0407, corresponding to a 95% confidence level, with a Cohen’s d-value of 6.7955, indicating a large effect size. These results demonstrate a statistically significant difference in ACERs between the proposed method and the second-best method.

6. Conclusions

The palm-vein recognition system uses NIR light to capture the structure of the vein, which has low-resolution features, and the images tend to contain noise and blur. In addition, recent advances in deep learning-based generative models are generating spoofed biometric data that are almost indistinguishable from the real thing, further increasing the need for spoof detection research on palm-vein images. In this study, we proposed a new model, FGFNet, as a spoof detector for a palm-vein recognition system. To detect fake palm-vein images generated by various generative AI models, FGFNet is designed to effectively analyze GAN fingerprints by introducing a masked FFT-based MF-GF block and to effectively extract blurred and low-resolution features (global features) and distorted patterns (local features) by utilizing FA-GCL block.
In the experimental results, FGFNet achieved higher spoof detection accuracy than the existing SOTA methods. Compared to the second-best method, this performance was confirmed by t-test and Cohen’s d-value measurements to have a 95% confidence level and a large effect size. It also showed the second-best performance compared to the SOTA methods on the Jetson TX2 embedded system with limited computational resources. FDE is also employed both to assess the structural realism of the generated fake palm-vein images and to quantitatively validate the spoof detection performance of FGFNet, thereby reinforcing the effectiveness of both the generation and detection processes. However, as shown in Figure 18, some misclassified spoof detection cases still occurred. These cases suggest that, despite the strong performance of the proposed model, there remain several challenges to be addressed. To ensure the reliability and generalizability of the proposed method, we explicitly acknowledge the following limitations.
First, although the experiments were conducted using two public palm-vein datasets, PLUSVein Contactless and VERA Palmvein Spoofing, these datasets do not fully reflect the diversity encountered in real-world biometric scenarios, such as varying ethnicities, environmental conditions, and spoofing attack types. Second, while clear train–test separation and cross-validation were applied within each dataset, the use of only two datasets inherently limits the model’s generalizability to unseen data and may pose a risk of overfitting. Third, the threshold values used in the preprocessing steps, such as palm region extraction and background removal, were empirically determined based on the training data, and may not perform well under varying lighting conditions, sensor types, or hand poses.
To overcome these limitations and reduce potential misclassification, our future work will include extensive validation using more diverse palm-vein datasets, the introduction of adaptive preprocessing techniques such as dynamic thresholding and segmentation-based methods, and the application of domain adaptation and cross-dataset learning strategies to improve generalization. In particular, we aim to enhance the model’s robustness to external variations by refining palm region alignment, minimizing background artifacts, and addressing spatial distortions such as hand rotation and displacement, which are difficult to control in real-world scenarios. To this end, we plan to adopt a spatial transformer network (STN) [64] to dynamically correct spatial variations in the input.
As shown in Table 14, the proposed FGFNet has the second-lowest number of parameters and FLOPs among the compared methods. It also achieves an inference speed of approximately 23.08 FPS on the NVIDIA Jetson TX2 board, which translates to real-time processing of about 23 images per second. Furthermore, during actual system deployment, the computationally intensive components, such as the FA-GCL block following the MF-GF block—can be operated in the server via client–server communication, thereby further reducing the computational burden on client edge devices.
Despite these optimizations, real-time biometric applications demand even lower latency and resource usage. Therefore, to further enhance the practicality of our approach, we plan to apply model compression techniques such as knowledge distillation (KD), pruning, and quantization, enabling lightweight and high-speed spoof detection suitable for edge environments.

Author Contributions

Methodology, Writing—original draft preparation, S.G.K.; Data curation, Validation, J.S.K.; Supervision, Writing—review and editing, K.R.P. All authors have read and agreed to the published version of the manuscript.

Funding

This research was supported by the Ministry of Science and ICT (MSIT), Korea, under the Information Technology Research Center (ITRC) support program (IITP-2025-RS-2020-II201789), and the Artificial Intelligence Convergence Innovation Human Resources Development (IITP-2025-RS-2023-00254592) supervised by the Institute of Information & Communications Technology Planning & Evaluation (IITP).

Data Availability Statement

Our model and code are made publicly available on GitHub site (https://github.com/SeungguKim98/Palm-Vein-Spoof-Detection/ (accessed on 2 March 2025)).

Conflicts of Interest

The authors declare no conflicts of interest.

References

  1. Nguyen, D.T.; Park, Y.H.; Shin, K.Y.; Kwon, S.Y.; Lee, H.C.; Park, K.R. Spoof detection for finger-vein recognition system using NIR camera. Sensors 2017, 17, 2261. [Google Scholar] [CrossRef]
  2. Choi, J.; Hong, J.S.; Kim, S.G.; Park, C.; Nam, S.H.; Park, K.R. RMOBF-Net: Network for the restoration of motion and optical blurred finger-vein images for improving recognition accuracy. Mathematics 2022, 10, 3948. [Google Scholar] [CrossRef]
  3. Hong, J.S.; Choi, J.; Kim, S.G.; Owais, M.; Park, K.R. INF-GAN: Generative adversarial network for illumination normalization of finger-vein images. Mathematics 2021, 9, 2613. [Google Scholar] [CrossRef]
  4. Kim, S.G.; Choi, J.; Hong, J.S.; Park, K.R. Spoof detection based on score fusion using ensemble networks robust against adversarial attacks of fake finger-vein images. J. King Saud Univ.-Comput. Inf. Sci. 2022, 34, 9343–9362. [Google Scholar] [CrossRef]
  5. Kim, S.G.; Hong, J.S.; Kim, J.S.; Park, K.R. Estimation of Fractal Dimension and Detection of Fake Finger-Vein Images for Finger-Vein Recognition. Fractal Fract. 2024, 8, 646. [Google Scholar] [CrossRef]
  6. Yang, J.; Wong, W.K.; Fei, L.; Zhao, S.; Wen, J.; Teng, S. Decoupling visual and identity features for adversarial palm-vein image attack. Neural Netw. 2024, 180, 106693–106706. [Google Scholar] [CrossRef] [PubMed]
  7. FGFNet. Available online: https://github.com/SeungguKim98/Palm-Vein-Spoof-Detection/ (accessed on 2 March 2025).
  8. Nguyen, D.T.; Park, Y.H.; Shin, K.Y.; Kwon, S.Y.; Lee, H.C.; Park, K.R. Fake finger-vein image detection based on Fourier and wavelet transforms. Digit. Signal Process. 2013, 23, 1401–1413. [Google Scholar] [CrossRef]
  9. Tirunagari, S.; Poh, N.; Bober, M.; Windridge, D. Windowed DMD as a microtexture descriptor for finger vein counter-spoofing in biometrics. In Proceedings of the IEEE International Workshop on Information Forensics and Security, Rome, Italy, 16–19 November 2015; pp. 1–6. [Google Scholar] [CrossRef]
  10. Kocher, D.; Schwarz, S.; Uhl, A. Empirical evaluation of LBP-extension features for finger vein spoofing detection. In Proceedings of the International Conference of the Biometrics Special Interest Group, Darmstadt, Germany, 21–23 September 2016; pp. 1–5. [Google Scholar] [CrossRef]
  11. Bok, J.Y.; Suh, K.H.; Lee, E.C. Detecting fake finger-vein data using remote photoplethysmography. Electronics 2019, 8, 1016. [Google Scholar] [CrossRef]
  12. Patil, I.; Bhilare, S.; Kanhangad, V. Assessing vulnerability of dorsal hand-vein verification system to spoofing attacks using smartphone camera. In Proceedings of the IEEE International Conference on Identity, Security and Behavior Analysis, Sendai, Japan, 29 February–2 March 2016; pp. 1–6. [Google Scholar] [CrossRef]
  13. Vedaldi, A.; Fulkerson, B. VLFeat: An open and portable library of computer vision algorithms. In Proceedings of the ACM International Conference on Multimedia, Firenze, Italy, 25–29 October 2010; pp. 1469–1472. [Google Scholar] [CrossRef]
  14. Bhilare, S.; Kanhangad, V.; Chaudhari, N. Histogram of oriented gradients based presentation attack detection in dorsal hand-vein biometric system. In Proceedings of the IAPR International Conference on Machine Vision Applications, Nagoya, Japan, 8–12 May 2017; pp. 39–42. [Google Scholar] [CrossRef]
  15. Tome, J.P.; Marcel, S. On the vulnerability of palm vein recognition to spoofing attacks. In Proceedings of the International Conference on Biometrics, Phuket, Thailand, 19–22 May 2015; pp. 319–325. [Google Scholar] [CrossRef]
  16. Zhang, W.; Shan, S.; Gao, W.; Chen, X.; Zhang, H. Local Gabor binary pattern histogram sequence (LGBPHS): A novel non-statistical model for face representation and recognition. In Proceedings of the IEEE International Conference on Computer Vision, Beijing, China, 17–21 October 2005; Volume 1, pp. 786–791. [Google Scholar] [CrossRef]
  17. Simonyan, K.; Zisserman, A. Very deep convolutional networks for large-scale image recognition. arXiv 2014. [Google Scholar] [CrossRef]
  18. Krizhevsky, A.; Sutskever, I.; Hinton, G.E. ImageNet classification with deep convolutional neural networks. In Proceedings of the International Conference on Neural Information Processing Systems, Lake Tahoe, NV, USA, 3–6 December 2012; pp. 84–90. [Google Scholar] [CrossRef]
  19. Shaheed, K.; Mao, A.; Qureshi, I.; Abbas, Q.; Kumar, M.; Zhang, X. Finger-vein presentation attack detection using depthwise separable convolution neural network. Expert Syst. Appl. 2022, 198, 116786. [Google Scholar] [CrossRef]
  20. Chollet, F. Xception: Deep learning with depthwise separable convolutions. In Proceedings of the IEEE Conference on Computer Vision and Pattern Recognition, Honolulu, HI, USA, 21–26 July 2017; pp. 1251–1258. [Google Scholar] [CrossRef]
  21. Singh, A.; Jaswal, G.; Nigam, A. FDSNet: Finger dorsal image spoof detection network using light field camera. In Proceedings of the IEEE International Conference on Identity, Security, and Behavior Analysis, Hyderabad, India, 22–24 January 2019; pp. 1–9. [Google Scholar] [CrossRef]
  22. Ronneberger, O.; Fischer, P.; Brox, T. U-net: Convolutional networks for biomedical image segmentation. In Proceedings of the International Conference Medical Image Computing and Computer-Assisted Intervention, Munich, Germany, 5–9 October 2015; pp. 234–241. [Google Scholar]
  23. Sajjad, M.; Khan, S.; Hussain, T.; Muhammad, K.; Sangaiah, A.K.; Castiglione, A.; Esposito, C.; Baik, S.W. CNN-based anti-spoofing two-tier multi-factor authentication system. Pattern Recognit. Lett. 2019, 126, 123–131. [Google Scholar] [CrossRef]
  24. Szegedy, C.; Liu, W.; Jia, Y.; Sermanet, P.; Reed, S.; Anguelov, D. Going deeper with convolutions. In Proceedings of the IEEE Conference on Computer Vision and Pattern Recognition, Boston, MA, USA, 7–12 June 2015; pp. 1–9. [Google Scholar] [CrossRef]
  25. Zhu, J.-Y.; Park, T.; Isola, P.; Efros, A.A. Unpaired image-to-image translation using cycle-consistent adversarial networks. In Proceedings of the IEEE International Conference on Computer Vision, Venice, Italy, 22–29 October 2017; pp. 2242–2251. [Google Scholar] [CrossRef]
  26. Huang, G.; Liu, Z.; Van Der Maaten, L.; Weinberger, K.Q. Densely connected convolutional networks. In Proceedings of the IEEE Conference on Computer Vision and Pattern Recognition, Honolulu, HI, USA, 21–26 July 2017; pp. 2261–2269. [Google Scholar] [CrossRef]
  27. Liu, Z.; Mao, H.; Wu, C.-Y.; Feichtenhofer, C.; Darrell, T.; Xie, S. A convnet for the 2020s. In Proceedings of the IEEE Conference on Computer Vision and Pattern Recognition, New Orleans, LA, USA, 18–24 June 2022; pp. 11976–11986. [Google Scholar] [CrossRef]
  28. Guo, M.-H.; Lu, C.-Z.; Liu, Z.-N.; Cheng, M.-M.; Hu, S.-M. Visual attention network. Comput. Vis. Media 2023, 9, 733–752. [Google Scholar] [CrossRef]
  29. Vorderleitner, A.; Hämmerle-Uhl, J.; Uhl, A. Hand vein spoof GANs: Pitfalls in the assessment of synthetic presentation attack artefacts. In Proceedings of the ACM Workshop on Information Hiding and Multimedia Security, Chicago, IL, USA, 28–30 June 2023; pp. 133–138. [Google Scholar] [CrossRef]
  30. Benaim, S.; Wolf, L. One-sided unsupervised domain mapping. In Proceedings of the International Conference on Neural Information Processing Systems, Long Beach, CA, USA, 4–9 December 2017; Volume 30, pp. 752–762. [Google Scholar]
  31. Li, Y.; Ruan, S.; Qin, H.; Deng, S.; El-Yacoubi, M.A. Transformer based defense GAN against palm-vein adversarial attacks. IEEE Trans. Inf. Forensics Secur. 2023, 18, 1509–1523. [Google Scholar] [CrossRef]
  32. Goodfellow, I.J.; Shlens, J.; Szegedy, C. Explaining and harnessing adversarial examples. arXiv 2014, arXiv:1412.6572. [Google Scholar] [CrossRef]
  33. Wong, E.; Rice, L.; Kolter, J.Z. Fast is better than free: Revisiting adversarial training. arXiv 2020. [Google Scholar] [CrossRef]
  34. Madry, A. Towards deep learning models resistant to adversarial attacks. arXiv 2017, arXiv:1706.06083. [Google Scholar] [CrossRef]
  35. Kauba, C.; Prommegger, B.; Uhl, A. Combined fully contactless finger and hand vein capturing device with a corresponding dataset. Sensors 2019, 19, 5014. [Google Scholar] [CrossRef] [PubMed]
  36. Yu, N.; Davis, L.S.; Fritz, M. Attributing fake images to GANs: Learning and analyzing GAN fingerprints. In Proceedings of the IEEE/CVF International Conference on Computer Vision, Seoul, Republic of Korea, 27 October–2 November 2019; pp. 7556–7566. [Google Scholar] [CrossRef]
  37. Neves, J.C.; Tolosana, R.; Vera-Rodriguez, R.; Lopes, V.; Proença, H.; Fierrez, J. GANprintR: Improved fakes and evaluation of the state of the art in face manipulation detection. IEEE J. Sel. Top. Signal Process. 2020, 14, 1038–1048. [Google Scholar] [CrossRef]
  38. Brouty, X.; Garcin, M. Fractal properties; information theory, and market efficiency. Chaos Solitons Fractals 2024, 180, 114543. [Google Scholar] [CrossRef]
  39. Yin, J. Dynamical fractal: Theory and case study. Chaos Solitons Fractals 2023, 176, 114190. [Google Scholar] [CrossRef]
  40. Crownover, R.M. Introduction to Fractals and Chaos, 1st ed.; Jones & Bartlett Publisher: Burlington, MA, USA, 1995. [Google Scholar]
  41. Mehta, S.; Rastegari, M. MobileViT: Light-weight, general-purpose, and mobile-friendly vision transformer. arXiv 2021, arXiv:2110.02178. [Google Scholar] [CrossRef]
  42. Wang, S.-Y.; Wang, O.; Zhang, R.; Owens, A.; Efros, A.A. CNN-generated images are surprisingly easy to spot... for now. In Proceedings of the IEEE/CVF Conference on Computer Vision and Pattern Recognition, Seattle, WA, USA, 13–19 June 2020; pp. 8695–8704. [Google Scholar]
  43. NVIDIA GeForce RTX 3060. Available online: https://www.nvidia.com/en-us/geforce/graphics-cards/30-series/rtx-3060-3060ti/ (accessed on 25 June 2024).
  44. Heusel, M.; Ramsauer, H.; Unterthiner, T.; Nessler, B.; Hochreiter, S. Gans trained by a two time-scale update rule converge to a local Nash equilibrium. In Proceedings of the International Conference on Neural Information Processing Systems, Long Beach, CA, USA, 4–9 December 2017; pp. 6629–6640. [Google Scholar]
  45. Zhang, R.; Isola, P.; Efros, A.A.; Shechtman, E.; Wang, O. The unreasonable effectiveness of deep features as a perceptual metric. In Proceedings of the IEEE Conference on Computer Vision and Pattern Recognition, Salt Lake City, UT, USA, 18–23 June 2018; pp. 586–595. [Google Scholar]
  46. ISO/IEC JTC1 SC37 Biometrics. ISO/IEC WD 30107–3: Information Technology—Presentation Attack Detection-Part 3: Testing and Reporting and Classification of Attacks; International Organization for Standardization: Geneva, Switzerland, 2014. [Google Scholar]
  47. Isola, P.; Zhu, J.-Y.; Zhou, T.; Efros, A.A. Image-to-image translation with conditional adversarial networks. In Proceedings of the IEEE Conference on Computer Vision and Pattern Recognition, Honolulu, HI, USA, 21–26 July 2017; pp. 5967–5976. [Google Scholar] [CrossRef]
  48. Wang, T.-C.; Liu, M.-Y.; Zhu, J.-Y.; Tao, A.; Kautz, J.; Catanzaro, B. High-resolution image synthesis and semantic manipulation with conditional GANs. In Proceedings of the IEEE Conference on Computer Vision and Pattern Recognition, Salt Lake City, UT, USA, 18–23 June 2018; pp. 8798–8807. [Google Scholar]
  49. Park, T.; Efros, A.A.; Zhang, R.; Zhu, J.-Y. Contrastive learning for unpaired image-to-image translation. In Proceedings of the European Conference on Computer Vision, Glasgow, UK, 23–28 August 2020; pp. 319–345. [Google Scholar]
  50. Han, J.; Shoeiby, M.; Petersson, L.; Armin, M.A. Dual contrastive learning for unsupervised image-to-image translation. In Proceedings of the IEEE/CVF Conference on Computer Vision and Pattern Recognition, Nashville, TN, USA, 20–25 June 2021; pp. 746–755. [Google Scholar]
  51. Ho, J.; Jain, A.; Abbeel, P. Denoising diffusion probabilistic models. In Proceedings of the International Conference on Neural Information Processing Systems, Vancouver, BC, Canada, 6–12 December 2020; pp. 6840–6851. [Google Scholar]
  52. Song, J.; Meng, C.; Ermon, S. Denoising diffusion implicit models. arXiv 2020, arXiv:2010.02502. [Google Scholar] [CrossRef]
  53. Muhammad, M.B.; Yeasin, M. Eigen-cam: Class activation map using principal components. In Proceedings of the International Joint Conference on Neural Networks, Glasgow, UK, 19–24 July 2020; pp. 1–7. [Google Scholar] [CrossRef]
  54. Ding, M.; Xiao, B.; Codella, N.; Luo, P.; Wang, J.; Yuan, L. Davit: Dual attention vision transformers. In Proceedings of the European Conference on Computer Vision, Tel Aviv, Israel, 23–27 October 2022; pp. 74–92. [Google Scholar] [CrossRef]
  55. Hatamizadeh, A.; Yin, H.; Heinrich, G.; Kautz, J.; Molchanov, P. Global context vision transformers. In Proceedings of the International Conference on Machine Learning, Honolulu, HI, USA, 23–29 July 2023; pp. 12633–12646. [Google Scholar]
  56. Yu, W.; Zhou, P.; Yan, S.; Wang, X. Inceptionnext: When inception meets convnext. In Proceedings of the IEEE/CVF conference on Computer Vision and Pattern Recognition, Seattle, WA, USA, 17–21 June 2024; pp. 5672–5683. [Google Scholar]
  57. Tu, Z.; Talebi, H.; Zhang, H.; Yang, F.; Milanfar, P.; Bovik, A.; Li, Y. Maxvit: Multi-axis vision transformer. In Proceedings of the European Conference on Computer Vision, Tel Aviv, Israel, 23–27 October 2022; pp. 459–479. [Google Scholar] [CrossRef]
  58. Liu, Z.; Hu, H.; Lin, Y.; Yao, Z.; Xie, Z.; Wei, Y.; Ning, J.; Cao, Y.; Zhang, Z.; Dong, L.; et al. Swin transformer v2: Scaling up capacity and resolution. In Proceedings of the IEEE/CVF conference on Computer Vision and Pattern Recognition, New Orleans, LA, USA, 21–24 June 2022; pp. 12009–12019. [Google Scholar]
  59. Face Anti-Spoofing Challenge. Available online: https://sites.google.com/view/face-anti-spoofing-challenge/ (accessed on 26 February 2024).
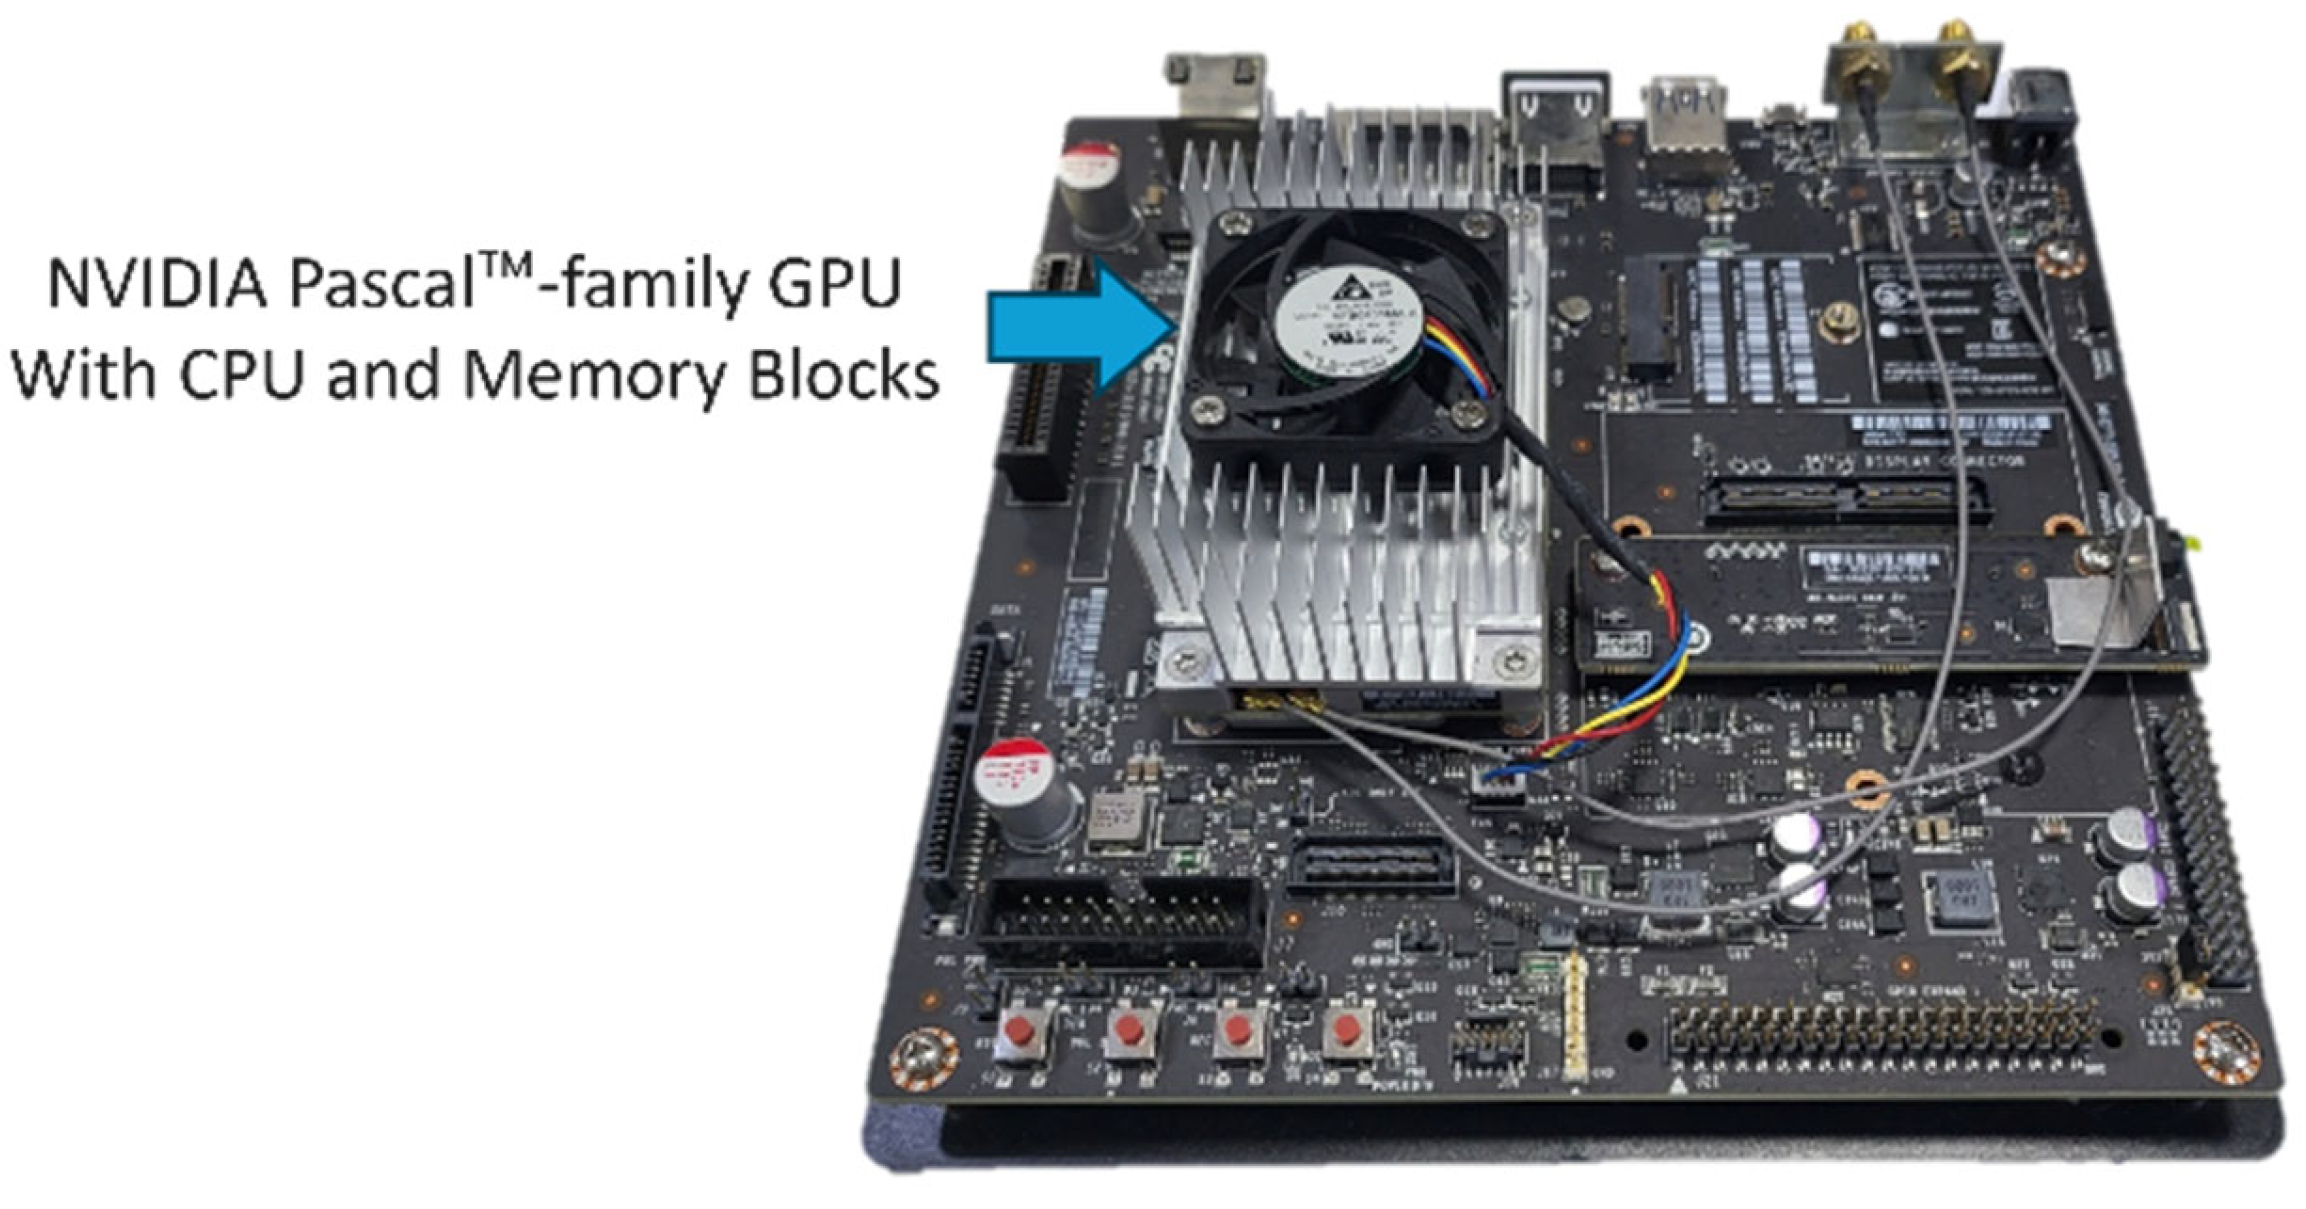
  60. Jetson TX2 Module. Available online: https://developer.nvidia.com/embedded/jetson-tx2 (accessed on 23 July 2024).
  61. Selvaraju, R.R.; Cogswell, M.; Das, A.; Vedantam, R.; Parikh, D.; Batra, D. Grad-CAM: Visual explanations from deep networks via gradient-based localization. In Proceedings of the IEEE International Conference on Computer Vision, Venice, Italy, 22–29 October 2017; pp. 618–626. [Google Scholar] [CrossRef]
  62. Student’s T-Test. Available online: https://en.wikipedia.org/wiki/Student%27s_t-test (accessed on 27 February 2024).
  63. Cohen, J. A power primer. Psychol. Bull. 1992, 112, 155–159. [Google Scholar] [CrossRef]
  64. Jaderberg, M.; Simonyan, K.; Zisserman, A. Spatial transformer networks. In Proceedings of the Advanced in Neural Information Processing Systems, Montreal, QC, Canada, 7–12 December 2015; Volume 28, pp. 2017–2025. [Google Scholar]
Figure 1. Overall procedure of the proposed method.
Fractalfract 09 00478 g001
Figure 2. Pre-processing procedure: (a) original image, (b) original image with detected upper (green line) and lower (red line) ROI boundaries, (c) cropped ROI image, (d) resized image.
Fractalfract 09 00478 g002
Figure 3. Generation of fake palm-vein images using CycleGAN.
Fractalfract 09 00478 g003
Figure 4. Input and target image selection method in the CycleGAN training process for fake palm-vein image generation. * denotes the random selection of the target image among the intra-class images of the input image.
Fractalfract 09 00478 g004
Figure 5. FGFNet architecture.
Fractalfract 09 00478 g005
Figure 6. Example of MF-GF block operation: (a) original image, (b) FFT image, (c) 10 × 10 extracted region from FFT image (normalized value of 0–1 are presented as 0–255 for visibility), (d) mask, and (e) masked FFT image.
Fractalfract 09 00478 g006aFractalfract 09 00478 g006b
Figure 7. Example of a palm vein image: (a) real image and (b) fake image example from the VERA dataset, (c) real image, and (d) fake image example from the PLUS dataset.
Fractalfract 09 00478 g007aFractalfract 09 00478 g007b
Figure 8. Training and validation loss graphs for CycleGAN: (a) Training loss, (b) validation loss.
Fractalfract 09 00478 g008
Figure 9. Training and validation loss and accuracy graphs for FGFNet: (a) training loss and accuracy, (b) validation loss and accuracy.
Fractalfract 09 00478 g009
Figure 10. Examples of original real palm-vein images and fake palm-vein images generated by different generation models on the VERA dataset: (a) original real palm-vein image and fake palm-vein images by (b) CycleGAN, (c) CUT, (d) DCL-GAN, (e) DSC-GAN, (f) Pix2Pix, (g) Pix2PixHD, (h) DDPM, and (i) DDIM.
Fractalfract 09 00478 g010
Figure 11. Examples of original real palm-vein images and fake palm-vein images generated by different generation models on the PLUS dataset: (a) original real palm-vein image and fake palm-vein images by (b) CycleGAN, (c) CUT, (d) DCL-GAN, (e) DSC-GAN, (f) Pix2Pix, (g) Pix2PixHD, (h) DDPM, and (i) DDIM.
Fractalfract 09 00478 g011
Figure 12. FDE analysis for real and fake palm-vein images: In (af), the first to third columns from the left represent the palm-vein image, the corresponding CAM, BCAM, and the FD graph, respectively. The CAM uses a jet colormap where warmer colors (e.g., red/yellow) indicate regions with higher model attention. Each pair of consecutive rows consists of a real palm-vein image followed by its corresponding fake image generated by CycleGAN. This layout facilitates a direct visual and quantitative comparison of structural complexity between real and fake images.
Fractalfract 09 00478 g012aFractalfract 09 00478 g012bFractalfract 09 00478 g012c
Figure 13. ROC curves of the 1st to 4th best methods of Table 11.
Fractalfract 09 00478 g013
Figure 14. ROC curves of the 1st to 4th best methods of Table 12.
Fractalfract 09 00478 g014
Figure 15. Jetson TX2 embedded system.
Fractalfract 09 00478 g015
Figure 16. Examples of palm-vein images exhibiting moderate pose variations in real-world acquisition scenarios in PLUS dataset.
Fractalfract 09 00478 g016
Figure 17. Correct spoof detection cases by FGFNet: The top row is from the VERA dataset and the bottom row is from the PLUS dataset. (a,c) are the cases of real images and (b,d) are those of corresponding fake images.
Fractalfract 09 00478 g017
Figure 18. Incorrect spoof detection cases by FGFNet: The top row shows examples from the VERA dataset, while the bottom row is from the PLUS dataset. In (a,c), real images are misclassified as fake, while in (b,d), fake images are misclassified as real. The regions of red boxes are affected by misalignment or background artifacts, which have contributed to misclassification.
Fractalfract 09 00478 g018
Figure 19. Grad-CAM images for real image and fake image in VERA dataset: the top row is for real image, the bottom row is for fake image, and in each column, the leftmost is input image, and the rest are Grad-CAM images obtained from MF-GF block, the first, the second, and the third blocks of FA-GCL block from left to right, respectively. The Grad-CAM uses a jet colormap where warmer colors (e.g., red/yellow) indicate regions with higher model attention.
Fractalfract 09 00478 g019
Figure 20. Grad-CAM images for real image and fake image in PLUS dataset: the top row is for real image, the bottom row is for fake image, and in each column, the leftmost is input image, and the rest are Grad-CAM images obtained from MF-GF block, the first, the second, and the third blocks of FA-GCL block from left to right, respectively. The Grad-CAM uses a jet colormap where warmer colors (e.g., red/yellow) indicate regions with higher model attention.
Fractalfract 09 00478 g020
Figure 21. FDE analysis for real and fake palm-vein images: In (ad), BCAM and the corresponding FD graph are presented. Each pair of consecutive rows consists of a real palm-vein image followed by its corresponding fake image detected by proposed FGFNet, enabling direct visual and quantitative comparison of structural complexity between real and fake images. The BCAMs for (a,b) are derived from the last column images in Figure 19, while those for (c,d) are derived from the last column images in Figure 20.
Fractalfract 09 00478 g021aFractalfract 09 00478 g021b
Figure 22. Graph of Student’s t-test and p-value: ACERs based on the performance shown in Table 11.
Fractalfract 09 00478 g022
Table 1. Descriptions of the layer-wise structure of FGFNet.
LayerNumber of TransformersNumber of FiltersFilter SizeStrideFeature Map Size
MF-GF blockInput----256 × 256 × 3
-FFT----256 × 256 × 3
-FFT Norm----256 × 256 × 3
-Abs----256 × 256 × 3
-Mask----256 × 256 × 3
ConvConv-163 × 32128 × 128 × 16
Gated fusionDense-16--128 × 128 × 16
Dense-16--128 × 128 × 16
1st MobileNet V2 block (Add)Conv-641 × 11128 × 128 × 64
Depth-wise Conv-643 × 31128 × 128 × 64
Conv-321 × 11128 × 128 × 32
2nd MobileNet V2 block (Down)-64*264 × 64 × 64
3rd MobileNet V2 block (Add)-64*164 × 64 × 64
4th MobileNet V2 block (Add)-64*164 × 64 × 64
5th MobileNet V2 block (Down)-96*232 × 32 × 96
FA-GCL block1st MobileViT blockConv1st MobileViT FFC blockFFC-963 × 3132 × 32 × 96
ConvFFC-1141 × 1132 × 32 × 96
TransformerTransformer2----
ConvFFC-961 × 1132 × 32 × 96
ConcatConcat----32 × 32 × 192
ConvFFC-963 × 3132 × 32 × 96
Add----32 × 32 × 96
6th MobileNet V2 block (Down)-128*216 × 16 × 128
2nd MobileViT block2nd MobileViT FFC block4128**116 × 16 × 128
Add----16 × 16 × 128
7th MobileNet V2 block (Down)-160*28 × 8 × 160
3rd MobileViT block3rd MobileViT FFC block3160**18 × 8 × 160
Add-----8 × 8 × 160
Conv-6403 × 318 × 8 × 640
Global Average Pooling----640
Dense
(output)
-2--2
* denotes the filter size of the 1st MobileNet V2 Block. ** denotes the filter size of the 1st MobileViT Block and the 1st MobileViT FFC Block.
Table 2. Detailed description of the VERA and PLUS datasets. # means ‘number of’.
Dataset# Lights# Session# People# Hands# Trials# Images
VERA1250251000
PLUS214225840
Table 3. Hyperparameter settings utilized for training of CycleGAN.
ParametersValue
Batch size1
Epochs200
Learning rate0.0002
OptimizerAdam
Beta 10.6
SchedulerLinear decay
Epoch decay100
LossLSGAN
Table 4. Hyperparameter settings utilized for training of FGFNet.
ParametersValue
Batch size4
Epochs30
Learning rate0.00001
OptimizerAdam
Loss1Cross entropy
Loss2Global contrastive
Table 5. Comparisons of generated image quality of CycleGAN with those of SOTA methods (unit: %).
DatasetMethodFIDLPIPS
1-Fold2-FoldAvg.1-Fold2-FoldAvg.
VERAPix2Pix [47]43.5237.1140.3246.4145.2245.82
Pix2PixHD [48]32.5432.8932.7245.7144.7645.24
CycleGAN [25]13.0417.9715.5139.2142.6440.93
CUT [50]22.2613.0017.6348.6251.9750.3
DCL-GAN [50]16.5923.3219.9656.6556.3256.49
DCS-GAN [5]13.4328.2920.8648.7550.9349.84
DDPM [51]33.5247.4240.4753.8558.1556
DDIM [52]28.6240.4834.5551.4450.6451.04
PLUSPix2Pix [47]31.0633.6232.3452.5252.5152.52
Pix2PixHD [48]19.1512.851650.8750.5850.73
CycleGAN [25]10.798.369.5847.9950.0549.02
CUT [50]20.7817.3419.0665.2264.9165.07
DCL-GAN [50]30.7732.3731.5766.4367.5967.01
DCS-GAN [5]26.3324.7425.5474.9776.3875.68
DDPM [51]71.8444.4258.1358.4459.2958.87
DDIM [52]30.7160.5545.6352.4357.3154.87
Table 6. R2, C, and FD values from Figure 12.
ResultsCase 1Case 2Case 3
Real
Figure 12a
Fake
Figure 12b
Real
Figure 12c
Fake
Figure 12d
Real
Figure 12e
Fake
Figure 12f
R20.9650.9690.970.9620.9840.991
C0.9820.9850.9850.9810.9920.996
FD1.5891.641.5311.5621.7641.72
Table 7. Comparisons of spoof detection accuracies on the fake generated images by CycleGAN and SOTA methods with VERA dataset (unit: %).
ModelPost-
Processing
APCER/BPCER/ACER
1-Fold2-FoldAvg.
Pix2Pix [47]without0/0/00/0/00/0/0
3 × 3 Gaussian0/0/00/0/00/0/0
5 × 5 Gaussian0/0/00/0/00/0/0
3 × 3 median0/0/00/0/00/0/0
5 × 5 median0/0/00/0/00/0/0
3 × 3 average0/0/00/0/00/0/0
5 × 5 average0/0/00/0/00/0/0
Pix2PixHD [48]without0.2/1.8/17/1/43.6/1.4/2.5
3 × 3 Gaussian0.8/1.8/1.35.8/1/3.43.3/1.4/2.4
5 × 5 Gaussian7.6/1.8/4.716/1/8.511.8/1.4/6.6
3 × 3 median2/1.8/1.96.2/1/3.64.1/1.4/2.8
5 × 5 median74/1.8/37.974.4/1/37.774.2/1.4/37.8
3 × 3 average2.8/1.8/2.38.6/1/4.85.7/1.4/3.6
5 × 5 average81/1.8/41.488/1/44.584.5/1.4/43
CycleGAN [25]without41/21.2/31.183.8/4.4/44.162.4/12.8/37.6
3 × 3 Gaussian100/21.2/60.6100/4.4/52.2100/12.8/56.4
5 × 5 Gaussian100/21.2/60.6100/4.4/52.2100/12.8/56.4
3 × 3 median100/21.2/60.6100/4.4/52.2100/12.8/56.4
5 × 5 median100/21.2/60.6100/4.4/52.2100/12.8/56.4
3 × 3 average100/21.2/60.6100/4.4/52.2100/12.8/56.4
5 × 5 average100/21.2/60.6100/4.4/52.2100/12.8/56.4
CUT [49]without0/0/00/0/00/0/0
3 × 3 Gaussian9/0/4.51/0/0.55/0/2.5
5 × 5 Gaussian76/0/382.4/0/1.239.2/0/19.6
3 × 3 median11.4/0/5.71/0/0.56.2/0/3.1
5 × 5 median100/0/5045.8/0/22.972.9/0/36.5
3 × 3 average32.8/0/16.41.6/0/0.817.2/0/8.6
5 × 5 average100/0/5074.6/0/37.387.3/0/43.7
DCL-GAN [50]without0/0/00/0/00/0/0
3 × 3 Gaussian0/0/00/0/00/0/0
5 × 5 Gaussian1.6/0/0.80.4/0/0.21/0/0.5
3 × 3 median0/0/00/0/00/0/0
5 × 5 median70.4/0/35.242.4/0/21.256.4/0/28.2
3 × 3 average0/0/00/0/00/0/0
5 × 5 average87/0/43.578.4/0/39.282.7/0/21.4
DCS-GAN [5]without2.6/0.2/1.40.8/0/0.41.7/0.1/0.9
3 × 3 Gaussian0.8/0.2/0.54.4/0/2.22.6/0.1/1.4
5 × 5 Gaussian0.2/0.2/0.230.2/0/15.115.2/0.1/7.7
3 × 3 median2.4/0.2/1.37/0/3.54.7/0.1/2.4
5 × 5 median3/0.2/1.677.2/0/38.640.1/0.1/20.1
3 × 3 average0.4/0.2/0.310/0/55.2/0.1/2.7
5 × 5 average0.2/0.2/0.263.4/0/31.731.8/0.1/16
DDPM [51]without5.8/6.2/63.2/0.4/1.84.5/3.3/3.9
3 × 3 Gaussian0/5.6/2.80/0.2/0.10/2.9/1.5
5 × 5 Gaussian0/5.6/2.80/0.2/0.10/2.9/1.5
3 × 3 median0/5.6/2.80/0.2/0.10/2.9/1.5
5 × 5 median0/5.6/2.80/0.2/0.10/2.9/1.5
3 × 3 average0/5.6/2.80/0.2/0.10/2.9/1.5
5 × 5 average0/5.6/2.80/0.2/0.10/2.9/1.5
DDIM [52]without7.6/3.4/5.52.2/1.4/1.84.9/2.4/3.7
3 × 3 Gaussian0.8/3.6/2.21.6/1.4/1.51.2/2.5/1.9
5 × 5 Gaussian0.8/3.6/2.24.6/1.4/32.7/2.5/2.6
3 × 3 median0.8/3.6/2.22/1.4/1.71.4/2.5/2
5 × 5 median1.4/3.6/2.517.2/1.4/9.39.3/2.5/5.9
3 × 3 average0.8/3.6/2.22.6/1.4/21.7/2.5/2.1
5 × 5 average0.4/3.6/249.2/1.4/25.324.8/2.5/13.7
Table 8. Comparisons of spoof detection accuracies on the fake generated images by CycleGAN and SOTA methods with PLUS dataset (unit: %).
ModelPost-
Processing
APCER/BPCER/ACER
1-Fold2-FoldAvg.
Pix2Pix [47]without0.71/0/0.360.71/0/0.360.71/0/0.36
3 × 3 Gaussian0/0/00/0/00/0/0
5 × 5 Gaussian0.48/0/0.2430.71/0/15.3615.6/0/7.8
3 × 3 median0/0/00/0/00/0/0
5 × 5 median12.86/0/6.439.29/0/4.6411.08/0/5.54
3 × 3 average0/0/00/0/00/0/0
5 × 5 average60.71/0/30.3630.71/0/15.3645.71/0/22.86
Pix2PixHD [48]without1.19/0/0.60/0/00.6/0/0.3
3 × 3 Gaussian1.43/0/0.710/0/00.72/0/0.36
5 × 5 Gaussian1.43/0/0.710.24/0/0.120.84/0/0.42
3 × 3 median1.9/0/0.950/0/00.95/0/0.48
5 × 5 median72.62/0/36.319.04/0/4.5240.83/0/20.42
3 × 3 average2.14/0/1.070.71/0/0.361.43/0/0.72
5 × 5 average99.52/0/49.7629.05/0/14.5264.29/0/32.14
CycleGAN [25]without11.43/1.9/6.6715/0.71/7.8613.22/1.31/7.27
3 × 3 Gaussian100/1.9/50.95100/0.71/50.36100/1.31/50.66
5 × 5 Gaussian100/1.9/50.95100/0.71/50.36100/1.31/50.66
3 × 3 median100/1.9/50.95100/0.71/50.36100/1.31/50.66
5 × 5 median100/1.9/50.95100/0.71/50.36100/1.31/50.66
3 × 3 average100/1.9/50.95100/0.71/50.36100/1.31/50.66
5 × 5 average100/1.9/50.95100/0.71/50.36100/1.31/50.66
CUT [49]without0/0/00/0/00/0/0
3 × 3 Gaussian0.48/0/0.240/0/00.24/0/0.12
5 × 5 Gaussian0.48/0/0.240/0/00.24/0/0.12
3 × 3 median0.71/0/0.360/0/00.36/0/0.18
5 × 5 median95.95/0/47.984.05/0/2.0350/0/25.01
3 × 3 average3.57/0/1.790/0/01.79/0/0.9
5 × 5 average99.76/0/49.8854.29/0/27.1477.03/0/38.51
DCL-GAN [50]without0/0/00/0/00/0/0
3 × 3 Gaussian0.24/0/0.120/0/00.12/0/0.06
5 × 5 Gaussian0.24/0/0.120/0/00.12/0/0.06
3 × 3 median0.24/0/0.120/0/00.12/0/0.06
5 × 5 median11.19/0/5.6016.43/0/8.2113.81/0/6.91
3 × 3 average0.48/0/0.240.24/0/0.120.36/0/0.18
5 × 5 average85.24/0/42.6298.10/0/49.0591.67/0/45.84
DCS-GAN [5]without0/0/00/0/00/0/0
3 × 3 Gaussian0.24/0/0.121.19/0/0.60.72/0/0.36
5 × 5 Gaussian0.24/0/0.121.19/0/0.60.72/0/0.36
3 × 3 median0.24/0/0.121.19/0/0.60.72/0/0.36
5 × 5 median0.71/0/0.3631.67/0/15.8316.19/0/8.1
3 × 3 average0.24/0/0.121.19/0/0.60.72/0/0.36
5 × 5 average2.14/0/1.0731.67/0/15.8316.91/0/8.45
DDPM [51]without0.48/0/0.244.76/3.10/3.932.62/1.55/2.09
3 × 3 Gaussian0/0/00.24/3.10/1.670.12/1.55/0.84
5 × 5 Gaussian0.24/0/0.120.24/3.10/1.670.24/1.55/0.9
3 × 3 median0.24/0/0.120.24/3.10/1.670.24/1.55/0.9
5 × 5 median0.24/0/0.120.48/3.10/1.790.36/1.55/0.96
3 × 3 average0.24/0/0.120.24/3.10/1.670.24/1.55/0.9
5 × 5 average0.24/0/0.120.24/3.10/1.670.24/1.55/0.9
DDIM [52]without50.48/6.9/28.6957.38/5.95/31.6753.93/6.43/30.18
3 × 3 Gaussian1.9/6.9/4.434.76/5.95/20.3618.33/6.43/12.38
5 × 5 Gaussian1.67/6.9/4.2932.62/5.95/19.2917.15/6.43/11.79
3 × 3 median5.0/6.9/5.9536.19/5.95/21.0720.6/6.43/13.51
5 × 5 median2.86/6.9/4.8837.38/5.95/21.6720.12/6.43/13.28
3 × 3 average3.81/6.9/5.3634.76/5.95/20.3619.29/6.43/12.86
5 × 5 average2.14/6.9/4.5235/5.95/20.4818.57/6.43/12.5
Table 9. Ablation studies of FGFNet with VERA dataset (unit: %). A checkmark (√) indicates the inclusion of the corresponding module in the configuration.
Pretrained WeightsFFC in BackboneFA-GCLMF-GFAPCER/BPCER/ACER
FAGCL1-Fold2-FoldAvg.
4/1.4/2.710.6/0.2/5.47.3/0.8/4.1
3/0.4/1.70.8/5/2.91.9/2.7/2.3
4.4/0.4/2.44.8/0.4/2.64.6/0.4/2.5
2.8/0.2/1.54.6/0.4/2.53.7/0.3/2
1.8/0/0.94.8/0.6/2.73.3/0.3/1.8
0.4/0.4/0.40/0.4/0.20.2/0.4/0.3
Table 10. Ablation studies of FGFNet with PLUS dataset (unit: %). A checkmark (√) indicates the inclusion of the corresponding module in the configuration.
Pretrained WeightsFFC in BackboneFA-GCLMF-GFAPCER/BPCER/ACER
FAGCL1-Fold2-FoldAvg.
3.33/2.38/2.863.81/2.86/3.333.57/2.62/3.1
0/2.38/1.190/4.76/2.380/3.57/1.79
1.43/0.24/0.834.05/0.95/2.52.74/0.6/1.67
1.43/0/0.711.9/0/0.951.67/0/0.83
0.24/0.24/0.241.19/0.24/0.710.72/0.24/0.48
0/0.24/0.120.48/0.48/0.480.24/0.36/0.3
Table 11. Comparisons with SOTA approaches with VERA dataset (unit: %).
ModelAPCER/BPCER/ACER
1-Fold2-FoldAvg.
ConvNeXt-Small [27]100/20.8/60.4100/4.4/52.2100/12.6/56.3
DaViT-Small [54]71.8/2.6/37.263.2/0.2/31.767.5/1.4/34.5
GCViT-Small [55]10.2/3.2/6.723.8/1.2/12.517/2.2/9.6
InceptionNeXt-Small [56]100/5/52.599.6/1.8/50.799.8/3.4/51.6
MaxViT-Small [57]96.8/0/48.4100/0.2/50.198.4/0.1/49.3
MobileViT-Small [6,38]3/0.4/1.70.8/5/2.91.9/2.7/2.3
SwinTrasnformerV2-Small [58]0.8/3.8/2.32.6/3.2/2.91.7/3.5/2.6
VGG + PCA + SVM [1]47.8/4.4/26.169.2/0.4/34.858.5/2.4/30.5
Enhanced ConvNeXt-Small [5]100/0.8/50.46.8/0/3.453.4/0.4/26.9
Xception + SVM [19]100/9.8/54.989.8/11.4/50.694.9/10.6/52.8
Ensemble DenseNet + SVM [4]100/3.8/51.9100/0.8/50.4100/2.3/51.2
FGFNet (proposed method)0.4/0.4/0.40/0.4/0.20.2/0.4/0.3
Table 12. Comparisons with SOTA approaches with PLUS dataset (unit: %).
ModelAPCER/BPCER/ACER
1-Fold2-FoldAvg.
ConvNeXt-Small [27]100/1.9/50.95100/0.71/50.36100/1.31/50.66
DaViT-Small [54]35.71/1.19/18.458.81/2.86/5.8322.26/2.03/12.14
GCViT-Small [55]21.19/6.9/14.056.67/10.48/8.5713.93/8.69/11.31
InceptionNeXt-Small [56]100/6.43/53.2170.48/1.19/35.8385.24/3.81/44.52
MaxViT-Small [57]92.38/1.43/46.999.76/0.24/5096.07/0.84/48.45
MobileViT-Small [6,38]0/2.38/1.190/4.76/2.380/3.57/1.79
SwinTrasnformerV2-Small [58]38.57/0/19.2944.05/0/22.0241.31/0/20.66
VGG + PCA + SVM [1]26.9/17.15/22.0236.9/3.1/2031.9/10.13/21.01
Enhanced ConvNeXt-Small [5]75.48/0.71/38.11.43/10.95/6.1938.46/5.83/22.15
Xception + SVM [19]100/7.14/53.57100/15.24/57.62100/11.19/55.6
Ensemble DenseNet + SVM [4]26.19/0.71/13.4578.1/0/39.0552.15/0.36/26.25
FGFNet (proposed method)0/0.24/0.120.48/0.48/0.480.24/0.36/0.3
Table 13. Comparison of spoof detection methods under generator–detector cross-combinations on VERA dataset (unit: %).
Image Generation ModelSpoof Detection ModelAPCER/BPCER/ACER
1-Fold2-FoldAvg.
Pix2PixHD [48]SwinTrasnformerV2-Small [58]0/2.2/1.11.4/1.4/1.40.7/1.8/1.3
MobileViT-Small [6,38]1.2/0/0.60/3.8/1.90.6/1.9/1.3
FGFNet (Proposed method)1.6/0/0.81.6/0.2/0.91.6/0.1/0.9
CUT [49]SwinTrasnformerV2-Small [58]0/0/00.2/0.4/0.30.1/0.2/0.2
MobileViT-Small [6,38]0/0.2/0.10.4/0/0.20.2/0.1/0.2
FGFNet (Proposed method)0/0/00/0.4/0.20/0.2/0.1
CycleGAN [25]SwinTrasnformerV2-Small [58]0.8/3.8/2.32.6/3.2/2.91.7/3.5/2.6
MobileViT-Small [6,38]3/0.4/1.70.8/5/2.91.9/2.7/2.3
FGFNet (Proposed method)0.4/0.4/0.40/0.4/0.20.2/0.4/0.3
Table 14. Comparisons of processing time and algorithm complexity.
ModelProcessing Time
(Unit: ms (fps))
GPU Memory Usage
(Unit: MB)
Number of Param.
(Unit: M)
FLOPs
(Unit: GB)
ConvNeXt-Small [27]75.29 (13.28)201.8749.4617.49
DaViT-Small [54]126.17 (7.93)214.4648.9817.68
GCViT-Small [55]163.16 (6.13)220.150.3217.29
InceptionNeXt-Small [56]90.1 (11.1)180.7747.116.8
MaxViT-Small [57]218.06 (4.59)314.9868.2322.32
MobileViT-Small [6,38]45.7 (21.88)204.954.08
SwinTrasnformerV2-Small [58]148.29 (6.74)210.1248.9623.3
VGG + PCA + SVM [1]61.7 (16.2)538.8514.7130.95
Enhanced ConvNeXt-Small [5]97.22 (10.29)219.1651.2917.17
Xception + SVM [19]27.87 (35.88)96.581.43.03
Ensemble DenseNet + SVM [4]113.30 (8.83)190.6639.3422.27
FGFNet (Proposed method)43.32 (23.08)22.793.793.18
Table 15. R2, C, and FD values from Figure 21.
ResultsCase 1Case 2
Real
Figure 21a
Fake
Figure 21b
Real
Figure 21c
Fake
Figure 21d
R20.9680.9980.9980.978
C0.9840.9990.9990.989
FD1.4161.6731.7051.491
Disclaimer/Publisher’s Note: The statements, opinions and data contained in all publications are solely those of the individual author(s) and contributor(s) and not of MDPI and/or the editor(s). MDPI and/or the editor(s) disclaim responsibility for any injury to people or property resulting from any ideas, methods, instructions or products referred to in the content.

