Article

The Pore Structure and Fractal Characteristics of Upper Paleozoic Coal-Bearing Shale Reservoirs in the Yangquan Block, Qinshui Basin

1
Institute of Geology and Geophysics, Chinese Academy of Sciences, Beijing 100029, China
2
State Key Laboratory for Fine Exploration and Intelligent Development of Coal Resources, China University of Mining and Technology (Beijing), Beijing 100083, China
3
College of Geoscience and Surveying Engineering, China University of Mining and Technology (Beijing), Beijing 100083, China
4
School of Emergency Management and Safety Engineering, North China University of Science and Technology, Tangshan 063210, China
5
College of Urban, Rural Planning and Architectural Engineering, Shangluo University, Shangluo 726000, China
6
Suzhou Zhongke Dixing Innovation Technology Institute, Suzhou 215163, China
*
Authors to whom correspondence should be addressed.
Fractal Fract. 2025, 9(7), 467; https://doi.org/10.3390/fractalfract9070467
Submission received: 25 May 2025 / Revised: 1 July 2025 / Accepted: 9 July 2025 / Published: 18 July 2025

Abstract

The investigation of the pore structure and fractal characteristics of coal-bearing shale is critical for unraveling reservoir heterogeneity, storage-seepage capacity, and gas occurrence mechanisms. In this study, 12 representative Upper Paleozoic coal-bearing shale samples from the Yangquan Block of the Qinshui Basin were systematically analyzed through field emission scanning electron microscopy (FE-SEM), high-pressure mercury intrusion, and gas adsorption experiments to characterize pore structures and calculate multi-scale fractal dimensions (D1D5). Key findings reveal that reservoir pores are predominantly composed of macropores generated by brittle fracturing and interlayer pores within clay minerals, with residual organic pores exhibiting low proportions. Macropores dominate the total pore volume, while mesopores primarily contribute to the specific surface area. Fractal dimension D1 shows a significant positive correlation with clay mineral content, highlighting the role of diagenetic modification in enhancing the complexity of interlayer pores. D2 is strongly correlated with the quartz content, indicating that brittle fracturing serves as a key driver of macropore network complexity. Fractal dimensions D3D5 further unveil the synergistic control of tectonic activity and dissolution on the spatial distribution of pore-fracture systems. Notably, during the overmature stage, the collapse of organic pores suppresses mesopore complexity, whereas inorganic diagenetic processes (e.g., quartz cementation and tectonic fracturing) significantly amplify the heterogeneity of macropores and fractures. These findings provide multi-scale fractal theoretical insights for evaluating coal-bearing shale gas reservoirs and offer actionable recommendations for optimizing the exploration and development of Upper Paleozoic coal-bearing shale gas resources in the Yangquan Block of the Qinshui Basin.

1. Introduction

Shale gas, as a critical unconventional natural gas resource, plays a pivotal role in mitigating energy supply–demand imbalances and optimizing energy structures through its large-scale development [1,2]. Globally, countries such as the United States, China, and Argentina have achieved commercial shale gas production [3,4]. In 2024, U.S. shale gas output reached 1.02~1.08 × 10¹² m3, while China ranked second with 2.60~2.80 × 10¹⁰ m3 [5,6,7]. However, over 90% of China’s production is concentrated in the Longmaxi Formation of the Sichuan Basin, highlighting an urgent need to explore new stratigraphic intervals to ensure sustainable resource development and diversification [8,9,10].
In recent years, China’s shale gas exploration has expanded into continental, transitional facies and highly mature strata [11,12]. Breakthroughs in non-marine shales such as the Lianggaoshan Formation in the Sichuan Basin demonstrate significant potential for new stratigraphic targets [13,14,15]. The Qinshui Basin, a critical coal-bearing basin in North China [16,17], hosts multiple Upper Paleozoic marine–continental transitional coal-bearing shale intervals (e.g., Shanxi and Taiyuan Formations), characterized by substantial thickness (>30 m per layer), a high total organic carbon content (TOC) (average TOC = 3.82%), and moderate thermal maturity, positioning them as promising targets for shale gas resource expansion [18,19,20].
The complexity and heterogeneity of pore structures in shale reservoirs directly govern gas storage and seepage capacity [21,22], while fractal dimensions serve as critical quantitative parameters to characterize pore geometry, offering essential guidance for reservoir evaluation and development optimization [23,24,25]. Fractal geometry, pioneered by French mathematician Mandelbrot in the 1970s, transcends the limitations of traditional Euclidean geometry in describing regular morphologies and provides a mathematical framework for analyzing natural complex and irregular structures, such as mountain contours and coastline configurations [26]. The fractal dimension, a core parameter in fractal theory, overcomes the integer constraints of conventional topological dimensions by employing non-integer values to quantify the self-similarity and spatial filling capacity of porous systems. For instance, a higher fractal dimension signifies greater pore structure complexity and stronger heterogeneity. The application of fractal theory to pore structure studies is particularly imperative for coal-bearing shale reservoirs. These reservoirs exhibit pronounced multi-scale pore systems and high heterogeneity, which challenge traditional Euclidean geometry in quantifying intricate topological relationships. Fractal dimensions, by measuring pore surface roughness and structural irregularity, reveal the spatial distribution patterns of pore networks, thereby establishing a theoretical foundation for evaluating seepage capacity, adsorption–desorption behavior, and reservoir performance. This approach bridges the gap between complex natural pore systems and quantitative characterization, enabling robust assessments of coal-bearing shale gas reservoirs under varying geological and diagenetic conditions [25,26].
Current methodologies, including Micro-nano Computed Tomography (Micro-nano CT), scanning electron microscopy (SEM), nuclear magnetic resonance (NMR), and fluid intrusion techniques [27,28,29], have been widely applied for the multi-scale characterization of macropores (>50 nm), mesopores (2–50 nm), and micropores (<2 nm) in shale, elucidating the intrinsic relationships among mineral composition, organic matter evolution, and pore fractal features [30,31,32]. Fractal theory provides a robust framework to describe the geometric properties and structural functionality of solid surfaces, enabling the hierarchical classification and evaluation of shale reservoir heterogeneity [24,25,26]. The fractal dimension D, a parameter quantifying surface roughness or structural irregularity, serves as a critical tool for characterizing reservoir complexity and assessing shale heterogeneity. Traditional methods for calculating fractal dimensions include box-counting, mercury intrusion porosimetry (MIP), and the Frenkel–Halsey–Hill (FHH) model [22,25,26,27,28]. Specifically, the FHH fractal model, based on nitrogen adsorption isotherms, derives surface fractal dimensions from adsorption data [33,34]. The Menger sponge model, applied to high-pressure mercury intrusion curves, calculates pore volume fractal dimensions, while box-counting methods, utilizing SEM or micro-CT images, directly quantify two- or three-dimensional fractal characteristics of pore structures [35]. Studies demonstrate significant correlations between fractal dimensions and shale reservoir properties such as specific surface area, porosity, and permeability, offering key parameters for reservoir quality classification and “sweet spot” prediction [36,37,38]. Building on this foundation, this study focuses on core samples from the Upper Paleozoic coal-bearing shale in the Yangquan Block of the Qinshui Basin. By integrating FE-SEM, high-pressure mercury intrusion, and low-pressure nitrogen adsorption experiments, we quantitatively analyze the controlling factors of fractal dimensions and clarify the coupled effects of mineral composition (quartz, clay) and organic matter characteristics (TOC, Ro) on pore structure. These insights aim to provide theoretical support for sweet spot prediction and the efficient development of overmature coal-bearing shale gas reservoirs [39,40,41,42].

2. Materials and Methods
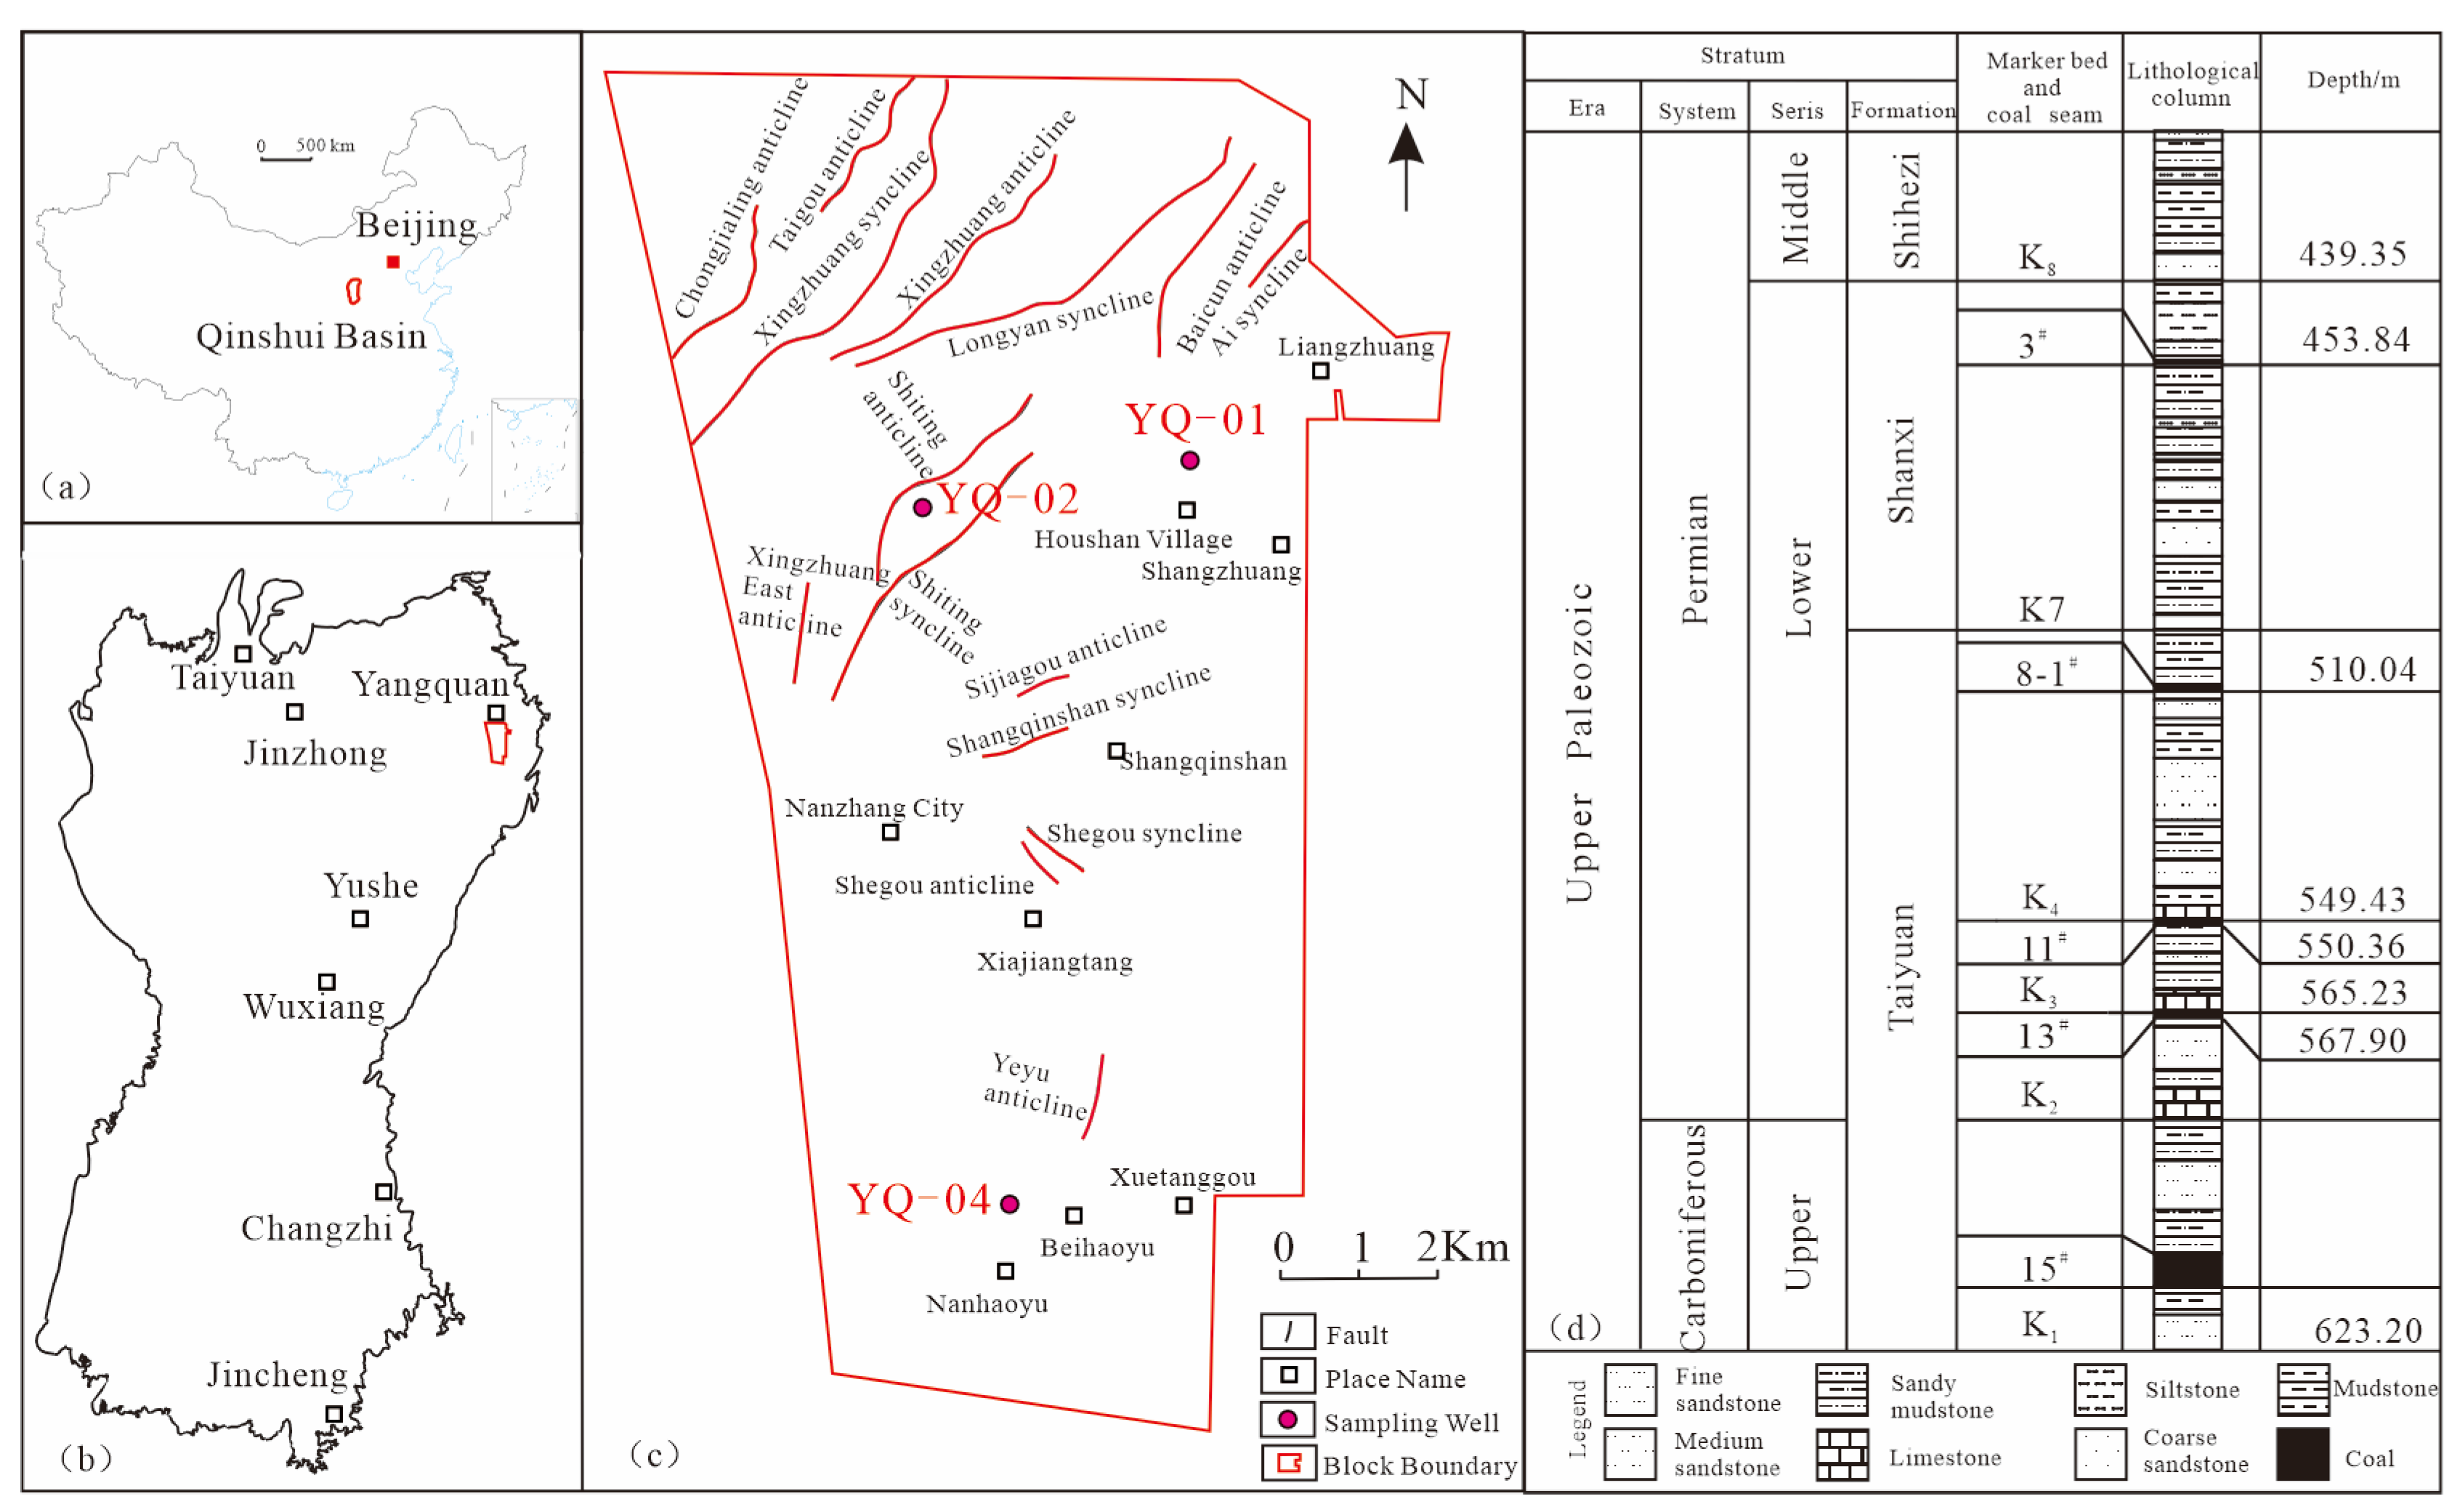
2.1. Materials

The Qinshui Basin, located in southeastern Shanxi Province, exhibits a NNE-SSW-trending composite syncline structure [43]. This large-scale, nearly N-S-oriented composite synclinal basin, developed on a Paleozoic basement and was formed during the Late Mesozoic. It underwent multi-phase tectonic events, including the Indosinian, Yanshanian, and Himalayan orogenies. The basin features relatively simple internal structures dominated by secondary folds, with sparsely developed faults, indicating tectonic stability. Large-scale faults are primarily concentrated along the basin margins, where tectonic activity intensifies [43]. The Yangquan Block is situated in the northern part of the Qinshui Basin (Figure 1).
This study analyzed 12 core samples collected from three wells (YQ-01, YQ-02, and YQ-04) in the Yangquan Block. The samples originate from coal-bearing shale intervals of the Shanxi Formation and Taiyuan Formation, comprising grayish black to black carbonaceous mudstone and grayish black to black silty mudstone, with sampling depths ranging from 308.2 to 557.2 m.

2.2. Organic Geochemistry Experiments

2.2.1. Total Organic Carbon (TOC) Analysis

The TOC content of shale samples was determined using a CS230HC carbon sulfur analyzer (Wuxi Yinzhuo Analytical Instrument Co., Wuxi, China) following the Chinese National Standard GB/T 19145-2003 [44]. Testing was conducted at the China University of Petroleum (Beijing) under controlled laboratory conditions (temperature: 24 °C; relative humidity: 48%). Experimental parameters included a carrier gas pressure of 0.27 MPa, oxygen purity of 99.5%, a combustion gas flow rate of 2 L/min, and an analytical gas flow rate of 0.5 L/min.

2.2.2. Rock-Eval Pyrolysis

Rock-Eval pyrolysis was performed in accordance with GB/T 18602-2012 [45] using an OGE-II Hydrocarbon Analyzer (Jiangsu Huaan Scientific Equipment, Nantong, China) at the China University of Petroleum (Beijing). Prior to analysis, approximately 100 mg of each sample was ground to <200 mesh. Key parameters, including S1 (free hydrocarbons), S2 (hydrocarbons from kerogen cracking), S1 + S2 (total hydrocarbon potential), and Tmax (temperature at maximum pyrolysis yield), were obtained to evaluate source rock quality and organic matter maturity.

2.2.3. Vitrinite Reflectance Measurement

Vitrinite reflectance analysis adhered to SY/T 5124-2012 [46] and was conducted using a Leica DM 4500P (Wetzlar, Germany) microspectrophotometer at the China University of Petroleum (Beijing). Samples were crushed to 20~40 mesh, embedded in epoxy resin, and polished into thin sections. Reflectance measurements were performed under 50× oil immersion objectives to ensure accuracy.

2.3. X-Ray Diffraction Analysis

X-ray diffraction experiments were conducted at the China University of Mining and Technology (Beijing) using a Rigaku Dmax/2000-PC X-ray diffractometer (Rigaku Corporation, Akishima, Japan) in accordance with the industry standard SY/T 5163-2018 [47] to determine the whole-rock mineral composition of coal-bearing shale samples. Key testing parameters included a tube voltage of 40 kV, tube current of 100 mA, scanning range of 2.5–70°, scanning speed of 4°/min, and step size of 0.02°. Samples were ground to 200 mesh, loaded into grooved glass slides, and analyzed to obtain mineral diffraction patterns. Quantitative analysis of minerals was performed using MDI Jade6.5 software by comparing results with standard mineral diffraction databases.

2.4. Reservoir Pore Characterization Experiments

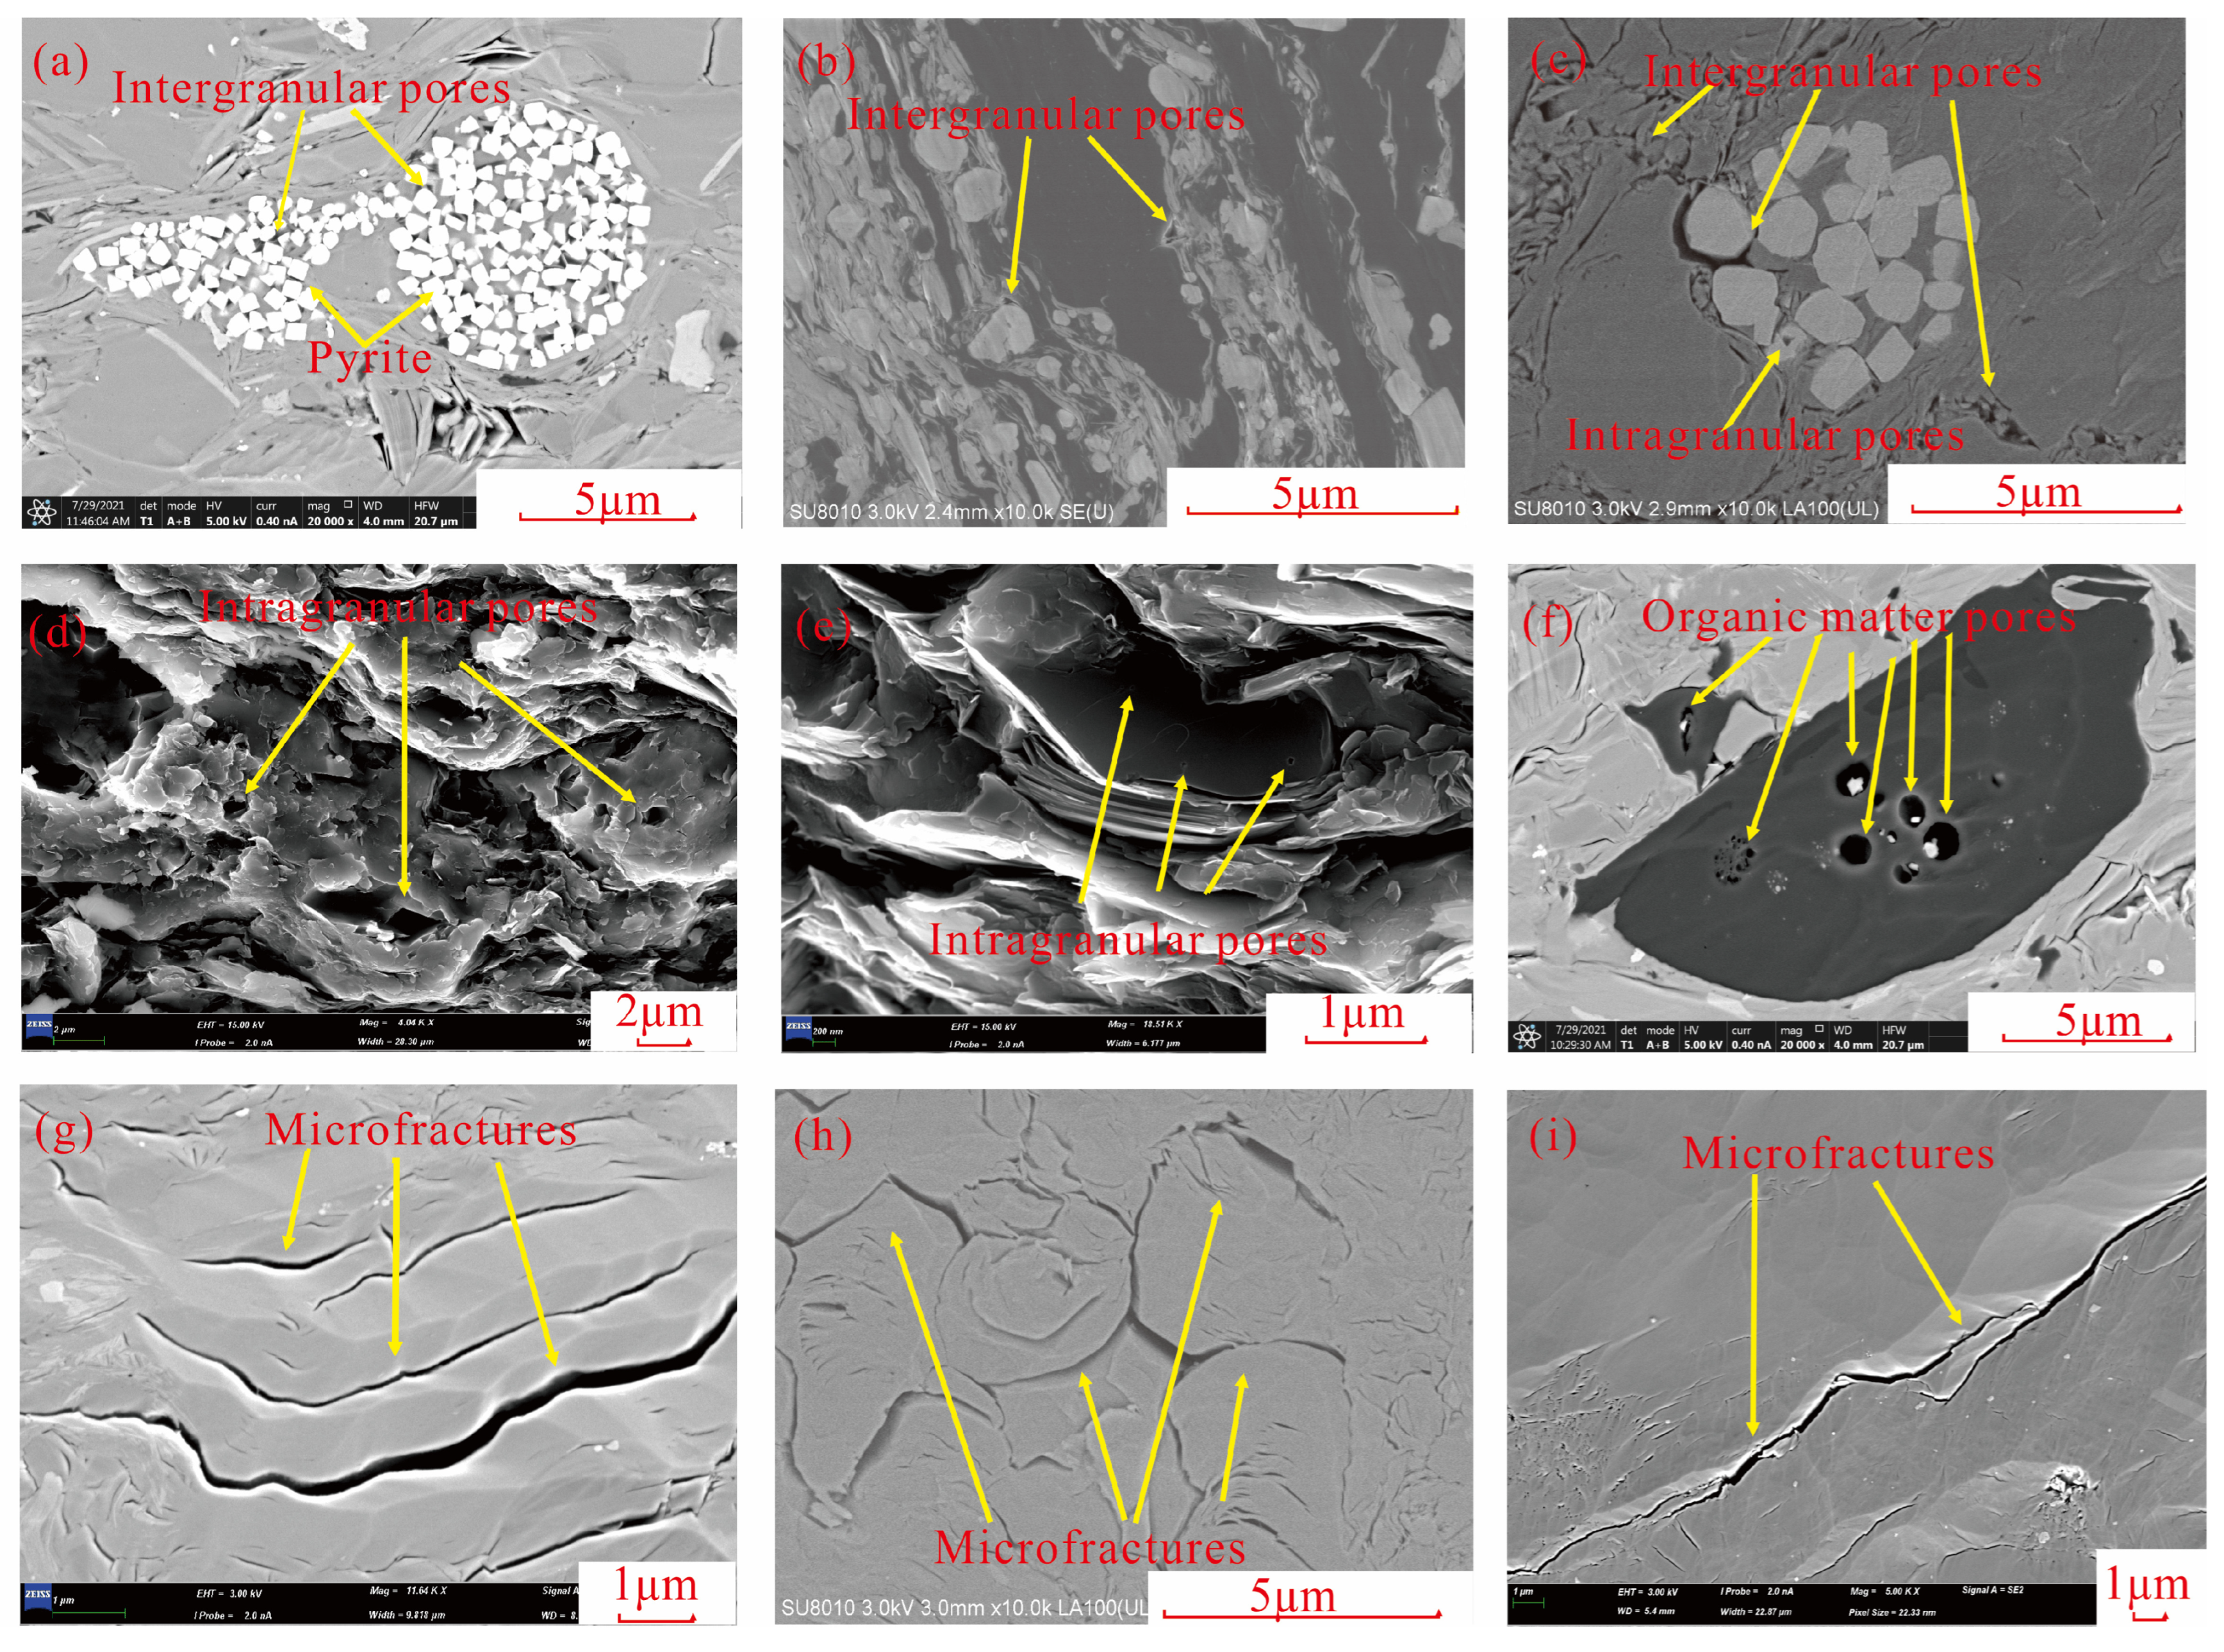
2.4.1. Scanning Electron Microscopy

Microstructural characterization of pore development in shale samples was performed using the following instruments: a conventional ZEISS Merlin scanning electron microscope (Oberkochen, Germany, Carl Zeiss AG), a Hitachi SU8010 field emission scanning electron microscope (FE-SEM) (Tokyo, Japan, Hitachi High-Tech), and a Thermo Fisher Apreo FE-SEM equipped with Ar-ion cross-section polishing (Waltham, MA, USA, Thermo Fisher Scientific), with all analyses conducted in strict compliance with the Chinese petroleum industry standard SY/T 5162-2014 [48]. For SEM analysis, samples (~6 mm in diameter, ~0.5 mm thick) with freshly fractured surfaces obtained by natural spalling were selected to observe the overall pore distribution. For FE-SEM analysis, to precisely characterize pore morphology and size, samples underwent argon ion polishing followed by gold coating of polished surfaces. Sample preparation criteria matched SEM requirements.

2.4.2. Low-Pressure Gas Adsorption

Low-pressure CO2 adsorption and low-temperature N2 adsorption–desorption experiments were conducted at the Beijing Physical and Chemical Testing Center using Micromeritics ASAP 2020 Physisorption Analyzer (Micromeritics Instrument Corp., Norcross, GA, USA) following the Chinese National Standard GB/T 19587-2017 [49]. Sample preparation was carried out as follows: samples were ground to 60 mesh and pretreated at 120 °C under a vacuum for 5 h. For CO2 adsorption, micropore (<2 nm) parameters were derived from adsorption isotherms (relative pressure: 0.0001~0.032) using the density functional theory (DFT) model. For N2 adsorption, mesopore (2–50 nm) parameters were calculated via the Brunauer–Emmett–Teller (BET) and Barrett–Joyner–Halenda (BJH) models (relative pressure: 0.011~0.995).

2.4.3. High-Pressure Mercury Intrusion

HPMI experiments were performed at the Beijing Physical and Chemical Testing Center using Micromeritics AutoPore IV 9500 Mercury Intrusion Porosimeter (Micromeritics Instrument Corp., Norcross, GA, USA) under GB/T 21650.1-2008/ISO 15901-1:2005 [50,51]. Sample preparation was carried out as follows: cylindrical specimens (diameter ≤ 1 cm, height ≤ 3 cm) were dried at 110 °C for 4 h. Regarding experimental conditions, pore structure parameters were measured up to 30,000 psia. Notably, excessive intrusion pressure may induce artificial fractures or damage original pore networks, leading to anomalous results.

2.5. Fractal Theory

The pore structure characteristics of shale are critical parameters for evaluating reservoir quality, encompassing storage capacity and fracturability. The storage capacity of shale reservoirs depends on pore heterogeneity, which is closely linked to permeability and fracture initiation potential. Pore heterogeneity refers to the complexity of pore size, abundance, distribution, morphology (including pore type and connectivity), and spatial arrangement. Given the multifractal nature of shale, this study employs experimental data on low-temperature N2 adsorption and high-pressure mercury intrusion (HPMI) to calculate fractal dimensions [52,53].
The nitrogen adsorption method is widely used to characterize the heterogeneity of irregular pore structures in solids [54,55]. The Frenkel–Halsey–Hill (FHH) equation, extensively applied to porous materials including shale [54,55], offers two computational models: one based on van der Waals forces and the other on capillary condensation mechanisms. The latter is more suitable for studying the heterogeneity of porous media [56,57]. The fractal dimension D derived from the FHH model is expressed as the slope of the linear relationship between ln(V) and ln(ln(P/P0)):
ln V = C + D     3 ln ln P / P 0
where V is the gas adsorption volume (cm3/g), P is the equilibrium pressure (MPa), P0 is the gas saturation vapor pressure (MPa), and D is the dimensionless fractal dimension.
For high-pressure mercury intrusion, the fractal dimension is calculated using the relationship between capillary pressure (Pc) and the non-wetting phase volume fraction (SHg) [22,23,27]:
lg 1     S Hg = D     3 lg P c     D     3 P min
where SHg is the mercury saturation (%), Pc is the capillary pressure (MPa), and Pmin corresponds to the capillary pressure at the maximum pore throat radius. The fractal dimension D is derived from the slope k of the trend line as D = k + 3.

3. Results

3.1. Organic Matter Characteristics

The total organic carbon (TOC) content is a critical indicator for evaluating the gas generation potential of mud shale [15]. The Upper Paleozoic coal-bearing shale in the Yangquan Block, Qinshui Basin, exhibits high organic matter abundance, with an average TOC of 3.82 wt% (Table 1). The Shanxi Formation shale shows higher TOC values (average: 6.16 wt%), influenced by adjacent coal seams, while the Taiyuan Formation shale has a lower TOC (average: 2.65 wt%). The hydrocarbon generation potential (S1 + S2) ranges from 0.12 to 3.49 mg/g (mean: 1.06 mg/g) in the Shanxi Formation and from 0.07 to 0.56 mg/g (mean: 0.27 mg/g) in the Taiyuan Formation, indicating that there is superior gas generation capacity in the Shanxi Formation.
Vitrinite reflectance (Ro) and pyrolysis peak temperature (Tmax) were used to assess thermal maturity. The Ro values of the studied shale range from 2.13 to 2.56% (mean: 2.29%), with Tmax values ranging between 541 and 574 °C (mean: 553 °C) (Table 1). Maceral composition analysis revealed that the vitrinite content is the highest, followed by inertinite and liptinite, classifying the organic matter as Type III kerogen. These results confirm that the shale is in the overmature stage, favorable for dry gas generation.

3.2. Mineral Composition

Coal-bearing shale exhibits complex mineral compositions, where variations in the mineral content critically influence pore structure, gas adsorption, and storage capacity. Clay minerals, with strong gas adsorption affinity, dominate the mineral assemblage and significantly affect the shale gas adsorption potential [58,59]. X-ray diffraction (XRD) analysis revealed that Upper Paleozoic coal-bearing shale in the Yangquan Block are dominated by clay minerals (23.9–97.8 wt%, average: 58.9 wt%), followed by quartz (2.0–60.0 wt%, average: 33.2 wt%). Other minerals include potassium feldspar (average: 2.4 wt%), plagioclase (1.8 wt%), calcite (1.4 wt%), siderite (3.8 wt%), and pyrite (2.4 wt%) (Table 2).
The brittle mineral content (e.g., quartz and feldspar) is a key factor for successful hydraulic fracturing in shale reservoirs [60,61,62,63]. Compared to the Barnett Shale (USA) [63], Yangquan Block shales exhibit a higher clay mineral content and a lower brittle mineral content, suggesting reduced fracability. However, the high clay mineral content enhances gas adsorption capacity, potentially compensating for challenges in reservoir stimulation during shale gas development [37,64].

3.3. Pore Type Characteristics

As a tight reservoir, mud shale exhibits complex pore systems. Porosity, a key parameter for evaluating storage-seepage capacity and free gas content, positively correlates with the total gas content in shale reservoirs [27]. The pore volume (PV) and specific surface area (SSA) are critical structural parameters influencing gas occurrence and resource estimation [27,64]. The Upper Paleozoic coal-bearing shale in the Yangquan Block, Qinshui Basin, displays low porosity (1.1~4.9%, avg. 3.1%) and ultra-low permeability (0.0008~0.1910 × 10⁻³ μm2, avg. 0.0274 × 10⁻³ μm2), yet these values are slightly higher than those of the Shanxi Formation shale in the Huainan Coalfield [35,37,38].
Scanning electron microscopy (SEM) provides a direct visualization of pore occurrence states in shale. Following the classification by R. G. Loucks et al. [58], pores are categorized into interparticle pores, intraparticle pores, OM-hosted pores (organic matter, OM), and microfractures. The diversity in pore types and morphologies is influenced by mineral composition, compaction, and dissolution processes [27]. SEM observations of Upper Paleozoic coal-bearing shales in the Yangquan Block confirm the presence of interparticle pores, intraparticle pores, and microfractures (Figure 2a–i). Interparticle and intraparticle pores predominantly develop within the mineral matrix and are controlled by diagenetic processes such as compaction, dissolution, and mineral phase transformation [41,58].
Influenced by mineral composition and compaction–dissolution effects, interparticle pores exhibit flaky, triangular, or irregular morphologies (Figure 2a–c). These pores display favorable connectivity, facilitating shale gas migration. Intraparticle pores are moderately developed between clay mineral layers (Figure 2c–e). These pores are relatively small in size and susceptible to tectonic and diagenetic stresses. However, the layered and flaky structure of clay minerals provide mechanical support, preserving some pores during evolution. OM-hosted pores, characterized by elliptical, circular, or honeycomb shapes, are critical adsorption spaces unique to shale reservoirs. However, they are sparsely observed in the study area (Figure 2f). Their limited development compared to the Barnett Shale (North America) [63] and Shanxi Formation shales in the Huainan Coalfield [35,37,38] likely results from pore collapse and closure due to overmaturity (Ro > 2.0%) [27,64]. Microfractures (Figure 2g–i), primarily tectonic fractures formed along clay mineral laminae, serve as essential pathways for gas storage, seepage, and production [27,64]. In summary, the micron- to nano-scale pores in the Upper Paleozoic coal-bearing shale of the Yangquan Block provide critical storage space for shale gas despite the dominance of low-connectivity pores and limited OM-hosted porosity.

3.4. Full-Scale Pore Size Distribution in Shale

The structural characteristics of shale pores critically influence reservoir storage performance [65,66,67]. Based on the International Union of Pure and Applied Chemistry (IUPAC) classification, nanopores are categorized into three types by diameter (d): macropores (d > 50 nm), mesopores (2 < d < 50 nm), and micropores (d < 2 nm) [68,69]. To comprehensively characterize the pore structure and size distribution of shale, this study employs high-pressure mercury intrusion (HPMI), low-temperature N2 adsorption, and low-pressure CO2 adsorption to investigate the structural features of macropores, mesopores, and micropores, respectively.

3.4.1. High-Pressure Mercury Intrusion (HPMI)

The mercury intrusion curves of the Shanxi Formation coal-bearing shale show a gradual increase in the mercury injection volume with rising pressure (0–200 MPa), indicating progressive pore filling. The low-pressure stage (<50 MPa) corresponds to macropore (>1000 nm) filling, the medium-pressure stage (50–150 MPa) to mesopores (2–50 nm), and the high-pressure stage (>150 MPa) to micropores (<2 nm). The incomplete overlap between mercury intrusion and extrusion curves suggests the presence of “ink-bottle” pores (narrow throats with wider interiors), highlighting poor connectivity, particularly in mesopores (Figure 3a). In contrast, the Taiyuan Formation exhibits higher total mercury intrusion volumes, with a notable increase in micropore filling at high pressures (>150 MPa), reflecting greater microporosity development. The pronounced hysteresis in the extrusion curve indicates complex pore structures and poorer connectivity in micropores and mesopores, likely due to the closure of clay mineral (e.g., illite) interlayer fractures (Figure 3b).
Pore volume distributions in the Shanxi Formation display a bimodal pattern, peaking at 10–100 nm (mesopores) and 1–10 μm (macropores), with mesopores dominating (Figure 3c). The high macropore volume (>1000 nm) is attributed to tectonic fractures or dissolution vugs. In the Taiyuan Formation, the pore volume is concentrated at <10 nm (micropores) and 50–100 nm (mesopores), reflecting residual clay mineral interlayer pores after organic pore collapse at high maturity. The macropore volume is lower than that in the Shanxi Formation, likely due to compaction inhibiting fracture development (Figure 3d).
The specific surface area in the Shanxi Formation is predominantly composed of micropores (<10 nm, >70%) and mesopores (2–50 nm, ~20%), with macropores (>1000 nm) having a negligible impact due to their smooth surfaces (Figure 3e). The Taiyuan Formation shows extreme microporosity dominance (<2 nm, >85% contribution), driven by the high specific surface area of clay mineral (e.g., illite) interlayer fractures, while mesopores contribute minimally (<10%) due to organic pore closure (Figure 3f).

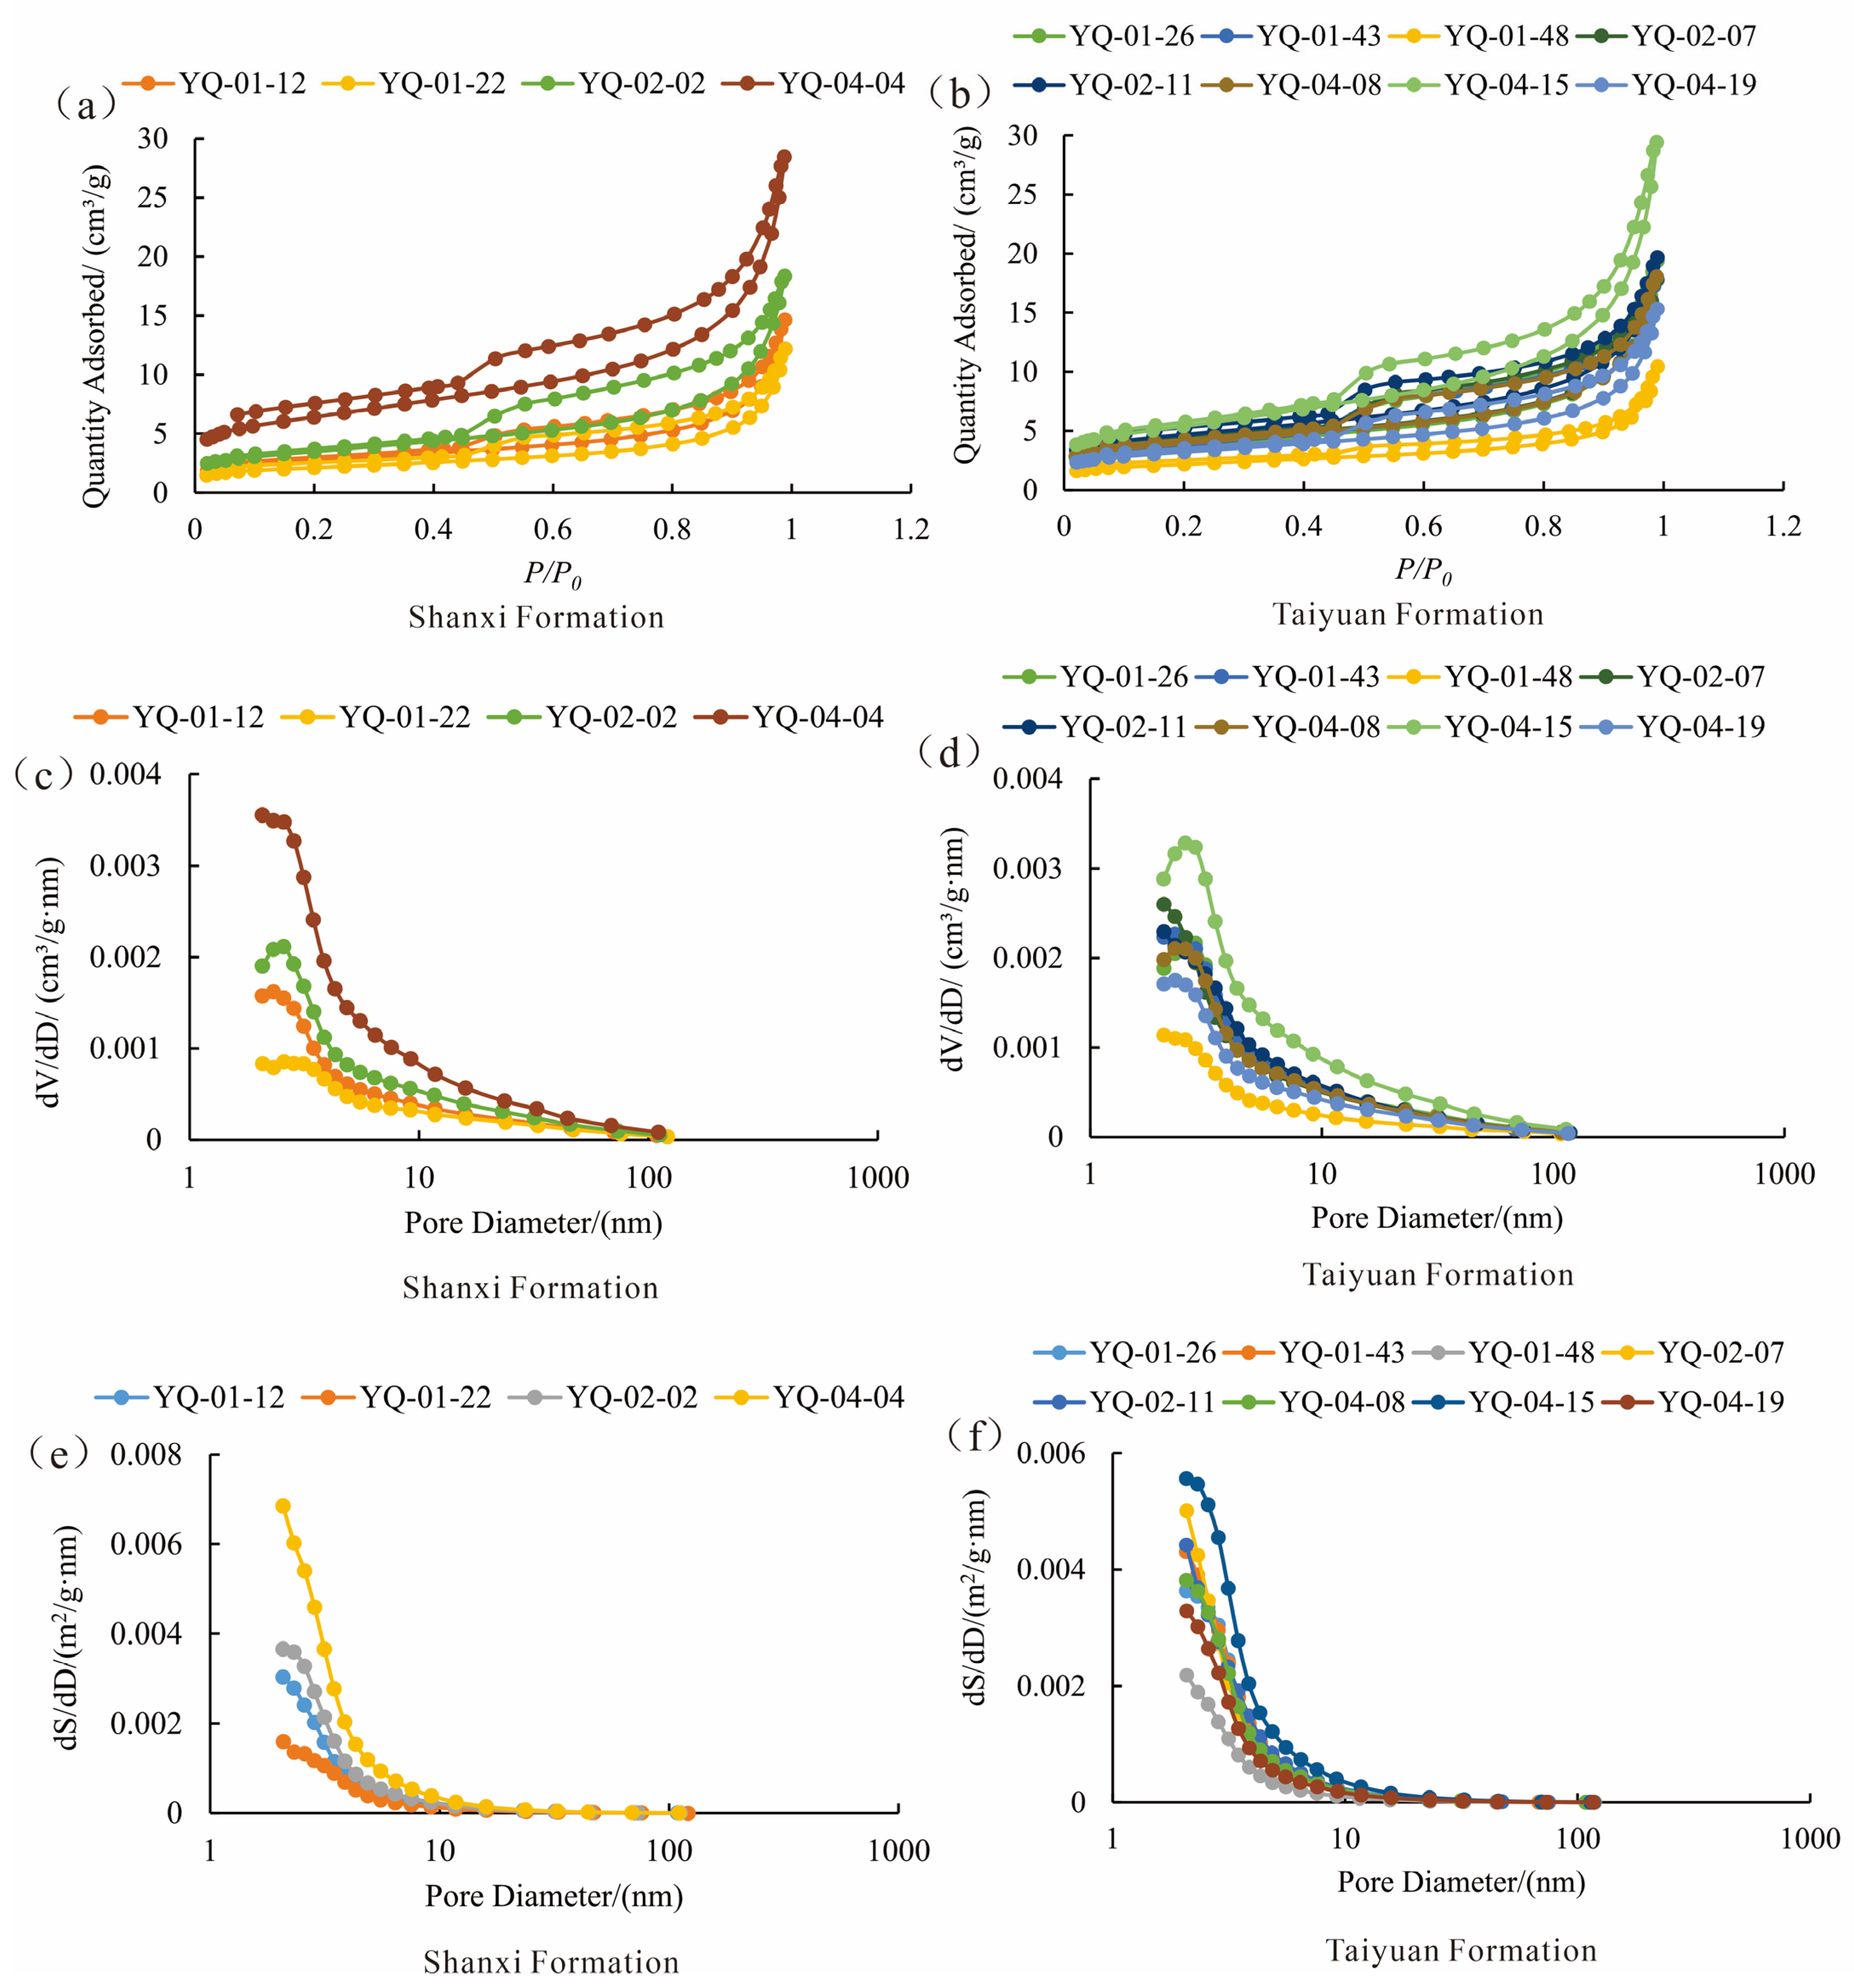
3.4.2. Low-Temperature N2 Adsorption

The N2 adsorption–desorption isotherms of the Shanxi Formation coal-bearing shale exhibit type IV curves with H3 hysteresis loops, indicative of slit-shaped mesopores (2–50 nm) associated with clay mineral interlayer fractures (Figure 4a). A sharp adsorption increase at high relative pressures (P/P0 > 0.9) suggests the presence of limited macropores (>50 nm) or fractures. Samples YQ-01-12 and YQ-04-04 show elevated adsorption capacities in the high-pressure range, likely due to tectonic fractures or dissolution vugs, while YQ-01-22 and YQ-02-02 exhibit reduced adsorption, attributed to compaction-induced pore closure. In contrast, the Taiyuan Formation coal-bearing shale also displays Type IV isotherms but with narrower hysteresis loops, reflecting poorer pore connectivity dominated by clay mineral interlayer micropores (Figure 4b). Enhanced adsorption at low relative pressures (P/P0 < 0.1) highlights well-developed micropores (<2 nm), consistent with residual clay mineral microporosity after organic pore collapse at high maturity. Samples YQ-01-48 and YQ-04-19 demonstrate significantly higher adsorption capacities, likely due to an elevated illite content and denser microporosity.
Shanxi Formation: A bimodal distribution peaks at 10–50 nm (mesopores, ~60% contribution) and 1–10 μm (macropores). The macropore volume (>1000 nm) in samples like YQ-04-04 is linked to tectonic fractures or dissolution vugs. Micropores (<2 nm) account for <10% of the total pore volume, emphasizing a meso-macropore-dominated system optimized for seepage (Figure 4c). Taiyuan Formation: The core volume concentrates in <2 nm (micropores, >40%) and 2–10 nm (small mesopores), reflecting clay mineral-dominated microporosity post-organic pore closure. The mesopore volume (10–50 nm) is significantly lower than that in the Shanxi Formation due to compaction, while macropores (>1000 nm) are nearly absent, indicating poor connectivity reliant on microporous adsorption (Figure 4d).
Shanxi Formation: Micropores (<2 nm) contribute >70% of the total specific surface area, despite their low volumetric share, due to their high surface roughness. Mesopores (2–50 nm) account for ~20%, primarily from clay interlayer fractures and residual organic pores (Figure 4e). Taiyuan Formation: Micropores (<2 nm) dominate with >85% contribution, driven by the nanoscale roughness of clay mineral (e.g., illite) interlayer fractures. Mesopores (2–50 nm) contribute <10%, underscoring limited development post-organic pore closure (Figure 4f).

3.4.3. Low-Pressure CO2 Adsorption

The CO2 adsorption isotherms of the Shanxi Formation coal-bearing shale exhibit Type I behavior, indicating microporosity dominance (<2 nm), with rapid adsorption saturation at low relative pressures (P/P0 < 0.1), reflecting the high adsorption capacity of micropores. The absence of hysteresis loops suggests poor connectivity and closed pore structures, likely due to organic pore collapse at high maturity or closure of clay mineral interlayer fractures (Figure 5a). Sample YQ-04-04 shows significantly higher adsorption capacity, attributed to its elevated clay mineral (e.g., illite) content and enhanced microporosity development. In the Taiyuan Formation coal-bearing shale, CO2 adsorption at low pressures (P/P0 < 0.1) exceeds that of the Shanxi Formation, indicating denser micropores associated with nanoscale interlayer pores in mixed-layer clay minerals (e.g., smectite-illite). Samples YQ-01-48 and YQ-04-19 exhibit exceptional adsorption capacities, reflecting uniform micropore distribution and higher surface roughness (Figure 5b).
Shanxi Formation: A bimodal distribution peaks at 2–10 nm (small mesopores) and 10–50 nm (mesopores), with mesopores accounting for ~60% of the total volume. Macropores (>50 nm) contribute minimally, though sample YQ-01-12 shows an elevated macropore volume, likely linked to localized dissolution vugs or tectonic fractures (Figure 5c). Taiyuan Formation: Micropores (<2 nm) dominate, exceeding 50% of the total pore volume, reflecting clay mineral-controlled microporosity post-organic pore closure. The mesopore volume (10–50 nm) is significantly lower than that in the Shanxi Formation due to compaction, highlighting limited connectivity and reliance on microporous adsorption (Figure 5d).
Shanxi Formation: Micropores (<2 nm) contribute >80% of the total specific surface area, driven by their high surface roughness, while mesopores (2–50 nm) account for <20%, primarily from clay interlayer fractures and residual organic pores (Figure 5e). Taiyuan Formation: Micropores (<2 nm) dominate with >90% contribution, consistent with the nanoscale roughness of clay mineral (e.g., illite) interlayer pores. Mesopores (2–50 nm) contribute < 5%, underscoring restricted development following organic pore closure (Figure 5f).
By integrating high-pressure mercury intrusion (HPMI), low-pressure N2 adsorption, and low-temperature CO2 adsorption analyses, this study comprehensively characterized the full-scale pore size distribution of 12 core samples from the Upper Paleozoic coal-bearing shale in the Qinshui Basin. The total pore volume (PV) of the shale ranges from 0.0255 to 0.8171 cm3/g. Specifically, micropores (PV: 0.0013–0.0072 cm3/g) contribute 0.31–14.75% (mean 5.18%) to the total PV, mesopores (PV: 0.0102–0.0326 cm3/g) account for 3.99–76.19% (mean 36.92%), and macropores (PV: 0.0040–0.7820 cm3/g) dominate with 15.66–95.71% (mean 57.90%) of the total PV. These results demonstrate that the pore volume system in the Upper Paleozoic coal-bearing shale of the Qinshui Basin is predominantly attributed to macropores, highlighting their critical role in controlling the overall pore structure characteristics (Figure 6a, Table 3).
By integrating the analytical results of the specific surface area (SSA), the Upper Paleozoic coal-bearing shale in the Qinshui Basin exhibits an SSA range of 9.601–40.981 m2/g. Specifically, micropores (SSA: 4.535–24.060 m2/g) contribute 32.71–58.71% (mean 45.38%) to the total SSA, mesopores (SSA: 4.598–15.225 m2/g) account for 34.18–58.65% (mean 48.57%), and macropores (SSA: 0.002–2.672 m2/g) show minimal contributions of 0.9–15.09% (mean 6.05%). These findings indicate that mesopores predominantly govern the SSA characteristics of the Upper Paleozoic coal-bearing shale in the Qinshui Basin, followed by micropores (Figure 6b, Table 3).
In the Upper Paleozoic coal-bearing shale samples from the Yangquan Block, a distinct relationship exists between the pore volume and specific surface area (Figure 7). Micropores and mesopores exhibit a strong positive correlation between the pore volume and specific surface area, reflecting their significant contribution to adsorption capacity through high surface roughness and nano-scale complexity. In contrast, macropores show a weak correlation as their larger pore sizes contribute minimally to the surface area despite occupying substantial pore volume. Overall, the total pore volume and specific surface area display a moderate positive correlation, driven predominantly by the dominance of micropores and mesopores in shaping surface properties. This behavior underscores the critical role of nano- to micro-scale pores in enhancing adsorption potential, while macropores primarily influence seepage efficiency without markedly affecting surface interactions. These findings align with the dual “adsorption-seepage” mechanisms in heterogeneous shale reservoirs, where pore-scale heterogeneity governs both gas storage and flow dynamics (Figure 7).

3.5. Fractal Characteristics of Shale

Through low-temperature N2 adsorption experiments, the dual logarithmic relationship between adsorption volume and relative pressure (P/P0) is established using Equation (1). The fractal dimension D is derived from the slope of this curve’s linear regression. For coal-bearing shales exhibiting multi-scale pore systems, segmented fractal dimensions quantify heterogeneity across distinct pore size ranges: D1 (surface fractal dimension) is defined at low relative pressure (P/P0 < 0.45), where multilayer adsorption dominates as gas molecules progressively cover pore surfaces. This regime quantifies surface roughness, with D1 values approaching 3 indicating highly irregular surfaces (e.g., clay mineral interlayer pores and organic pores) and D1 ≈ 2 reflecting smoother surfaces (e.g., quartz intergranular pores). D2 (pore volume fractal dimension) characterizes the P/P0 > 0.45 range, where capillary condensation occurs in mesopores (2–50 nm). D2 captures pore network complexity and spatial filling capacity, where values near 3 signify intricate structures (e.g., intertwined nanopores/microfractures), while lower values (closer to 2) indicate enhanced connectivity (e.g., homogeneous mesopore networks). Fractal dimension fitting curves from the FHH model are shown in Figure 8, with the results summarized in Table 4. This integrated approach provides a quantitative framework to assess pore structure complexity and connectivity, offering critical insights into multi-scale heterogeneity and its implications for gas storage/transport mechanisms in coal-bearing shale reservoirs.
Based on the International Union of Pure and Applied Chemistry (IUPAC) pore classification standard and the unique characteristics of coal-bearing shale reservoirs [67,69], pore size ranges correspond to distinct types, formation mechanisms, and associated fractal dimensions derived from high-pressure mercury intrusion (HPMI) experiments: D3 (macro-mesopore transition), defined for pores of 50–1000 nm, reflects pores primarily controlled by diagenesis (cementation and dissolution) and mechanical compaction, such as intergranular mineral pores and minor microfractures, with its fractal dimension quantifying pore surface roughness and connectivity (D3→3 indicates complex structures; D3→2 suggests uniform permeability); D4 (macropore-fracture transition), covering 1000–10,000 nm, is dominated by tectonic fracturing and dissolution processes, including natural microfractures and dissolution vugs, with its fractal dimension capturing the geometric complexity of intertwined pores and fractures (D4→3 signifies intricate networks; D4→2 indicates simplified systems); and D5 (macro-fracture segment), applying to pores > 10,000 nm, corresponds to macroscopic fractures, oversized vugs, or tectonic fractures formed by intense tectonic activity (e.g., faulting), with its fractal dimension reflecting fracture surface roughness and network heterogeneity (D5→3 denotes rough, branched fractures; D5→2 represents straight fractures). This geologically justified segmentation, based on coupled diagenetic–tectonic mechanisms specific to coal-bearing shales, employed a multi-scale HPMI analysis strategy where experimental data were substituted into Equation (2); the linear regression of lg(1 − SHg) versus lg(Pc) yielded slopes to calculate D3, D4, and D5 (the results are shown in Table 4, and fitting curves are shown in Figure 9), establishing a framework that bridges pore structure complexity with reservoir performance to predict gas storage heterogeneity, flow dynamics, and hydraulic fracturing efficacy.
D1 (FHH) and D3 (HPMI) exhibit a weak positive correlation with the clay content, while D2 (FHH) and D4 (HPMI) are suppressed in quartz-rich areas due to more homogeneous pore structures. Key differences arise from their operational scales: FHH focuses on the nano-scale (D1D2), whereas HPMI covers the macro-to-fracture scale (D3D5). Consequently, D2 (mesopore volume complexity) and D3 (macropore surface roughness) show no direct link, as D2 is suppressed by organic pore collapse at high maturity, while D3 is enhanced by dissolution. Technical limitations also contribute to differences: HPMI at high pressures can induce artificial fractures, potentially overestimating D4D5 values, while FHH ignores contributions from macropores.
Significant differences exist between the Shanxi and Taiyuan Formations. The Shanxi Formation is dominated by mesopores, exhibits lower D2 values indicating more homogeneous mesopores, and has a higher proportion of macropores linked to dissolution and fractures. This results in higher D4 and D5 values, suggesting good flow potential. In contrast, the Taiyuan Formation is micropore-dominated, shows higher D2 values reflecting complex micro-mesopore interweaving, and has lower macropore abundance primarily from clay interlayer pores. Consequently, it exhibits higher D1/D2 values favoring gas adsorption but lower D5 values, indicating a greater need for effective stimulation.

4. Discussion

4.1. Relationship Between Organic Matter Characteristics and Fractal Dimensions

Organic matter characteristics (e.g., abundance, type, and maturity) act as primary controls on the evolution of shale pore fractal dimensions by regulating the development and spatial arrangement of organic pores and dissolution pores [27,64]. This study analyzed the relationship between total organic carbon (TOC) and fractal dimensions, revealing a slight increase in D1 with higher TOC, albeit with a weak correlation, while TOC showed negligible associations with D2, D3, D4, and D5. In the Upper Paleozoic coal-bearing shale of the Yangquan Block (Qinshui Basin), which is in a high-maturity stage (Ro > 2%), organic pores collapse under compaction, diminishing TOC’s contribution to pore complexity. Instead, interlayer fractures in clay minerals (e.g., illite) and quartz intergranular pores dominate the pore structure, diluting TOC’s influence.
The average vitrinite reflectance (Ro) of 2.29% and Tmax of 553 °C confirm the shale’s overmature dry gas stage, indicating advanced organic matter evolution, likely involving graphitization transformation. The high Ro and Tmax values suggest complete hydrocarbon generation and thermal degradation, with organic pores largely being collapsed. Notably, Ro exhibits a weak negative correlation with D4 and D5 but a positive correlation with D3. This divergence arises because high maturity (1) promotes the development of interlayer fractures in clay minerals (enhancing microporosity roughness, D3), (2) suppresses macropore complexity (D4, D5) via compaction, and (3) enhances microporosity heterogeneity through organic matter shrinkage. At Ro > 2.0%, organic pore closure is prevalent, though tectonic fractures (D5) may become more complex due to stress release.
As shown in Figure 10c, Tmax displays a significant negative correlation with D2 but no clear relationship with D1 or D3. An elevated Tmax value (>550 °C) corresponds to overmaturity, leading to organic pore closure (D2 decline) but potentially enhancing mineral dissolution pores (weak positive correlation with D3). At Tmax > 560 °C, thermal cracking may generate secondary microfractures (D4, D5).
Hydrocarbon potential (S1 + S2) inversely correlates with fractal dimensions: higher S1 + S2 values correspond to reduced D3 and D5, suggesting that early hydrocarbon generation may degrade pore connectivity (D3), while late-stage tectonic fractures (D5) improve permeability but reduce adsorption capacity. The weak associations between TOC, S1 + S2, and fractal dimensions stem from organic pore collapse at high maturity and mineral interference.
In summary, Ro and Tmax suppress macropore complexity through compaction but may enhance microporosity heterogeneity. Overmaturity (Ro > 2.0%, Tmax > 550 °C) results in organic pore closure, weakening correlations between D1D2 and TOC/Ro. Tectonic fractures (D4D5), governed by stress rather than thermal maturity, may exhibit increased complexity due to post-diagenetic uplift, highlighting the interplay of organic evolution, diagenesis, and tectonic activity in shaping fractal pore networks.

4.2. Relationship Between Mineral Composition and Fractal Dimensions

The type, particle size, and assemblage of minerals significantly influence shale pore morphology and size, thereby shaping fractal characteristics [67]. This study investigated correlations between fractal dimensions and quartz/clay mineral contents. The results show that the quartz content exhibits negligible associations with fractal dimensions D1D4, with only a weak positive correlation to D5. This limited influence may arise from the simple structure and smooth surfaces of quartz intergranular pores, which suppress fractal complexity, coupled with masking effects from clay minerals or organic pores. Additionally, the narrow quartz content range (0–60%) in the samples likely hindered the development of significant trends.
In the Upper Paleozoic coal-bearing shale of the Yangquan Block, high-quartz zones feature simplified pore structures (low fractal dimensions), favoring superior permeability but weak adsorption. High-clay zones exhibit abundant micropores (elevated D1, D2) but poor macropore connectivity (low D4, D5), necessitating fractures to enhance seepage. Clay mineral transformations (e.g., smectite-to-illite conversion) may remodel pore structures, amplifying microporosity complexity (D1, D2). Tectonic fractures (D5) emerge as critical factors for improving permeability, particularly in clay-rich intervals. These findings underscore the dual role of mineralogy in balancing adsorption and flow dynamics, with fracture networks serving as key enablers for gas mobility in heterogeneous coal-bearing shale systems (Figure 11a).
In contrast, the clay mineral content demonstrates a weak positive correlation with D1 and D2, no significant link to D3D4, and a moderate negative correlation with D5. Clay minerals (e.g., illite) likely dominate microporosity complexity through interlayer fractures, contributing to rough surfaces (higher D1 and D2) and enhanced adsorption capacity. However, high-clay-content regions exhibit poor macropore connectivity (lower D4 and D5) due to strong plastic deformation, which inhibits tectonic fracture development (D5 reduction) (Figure 11b).

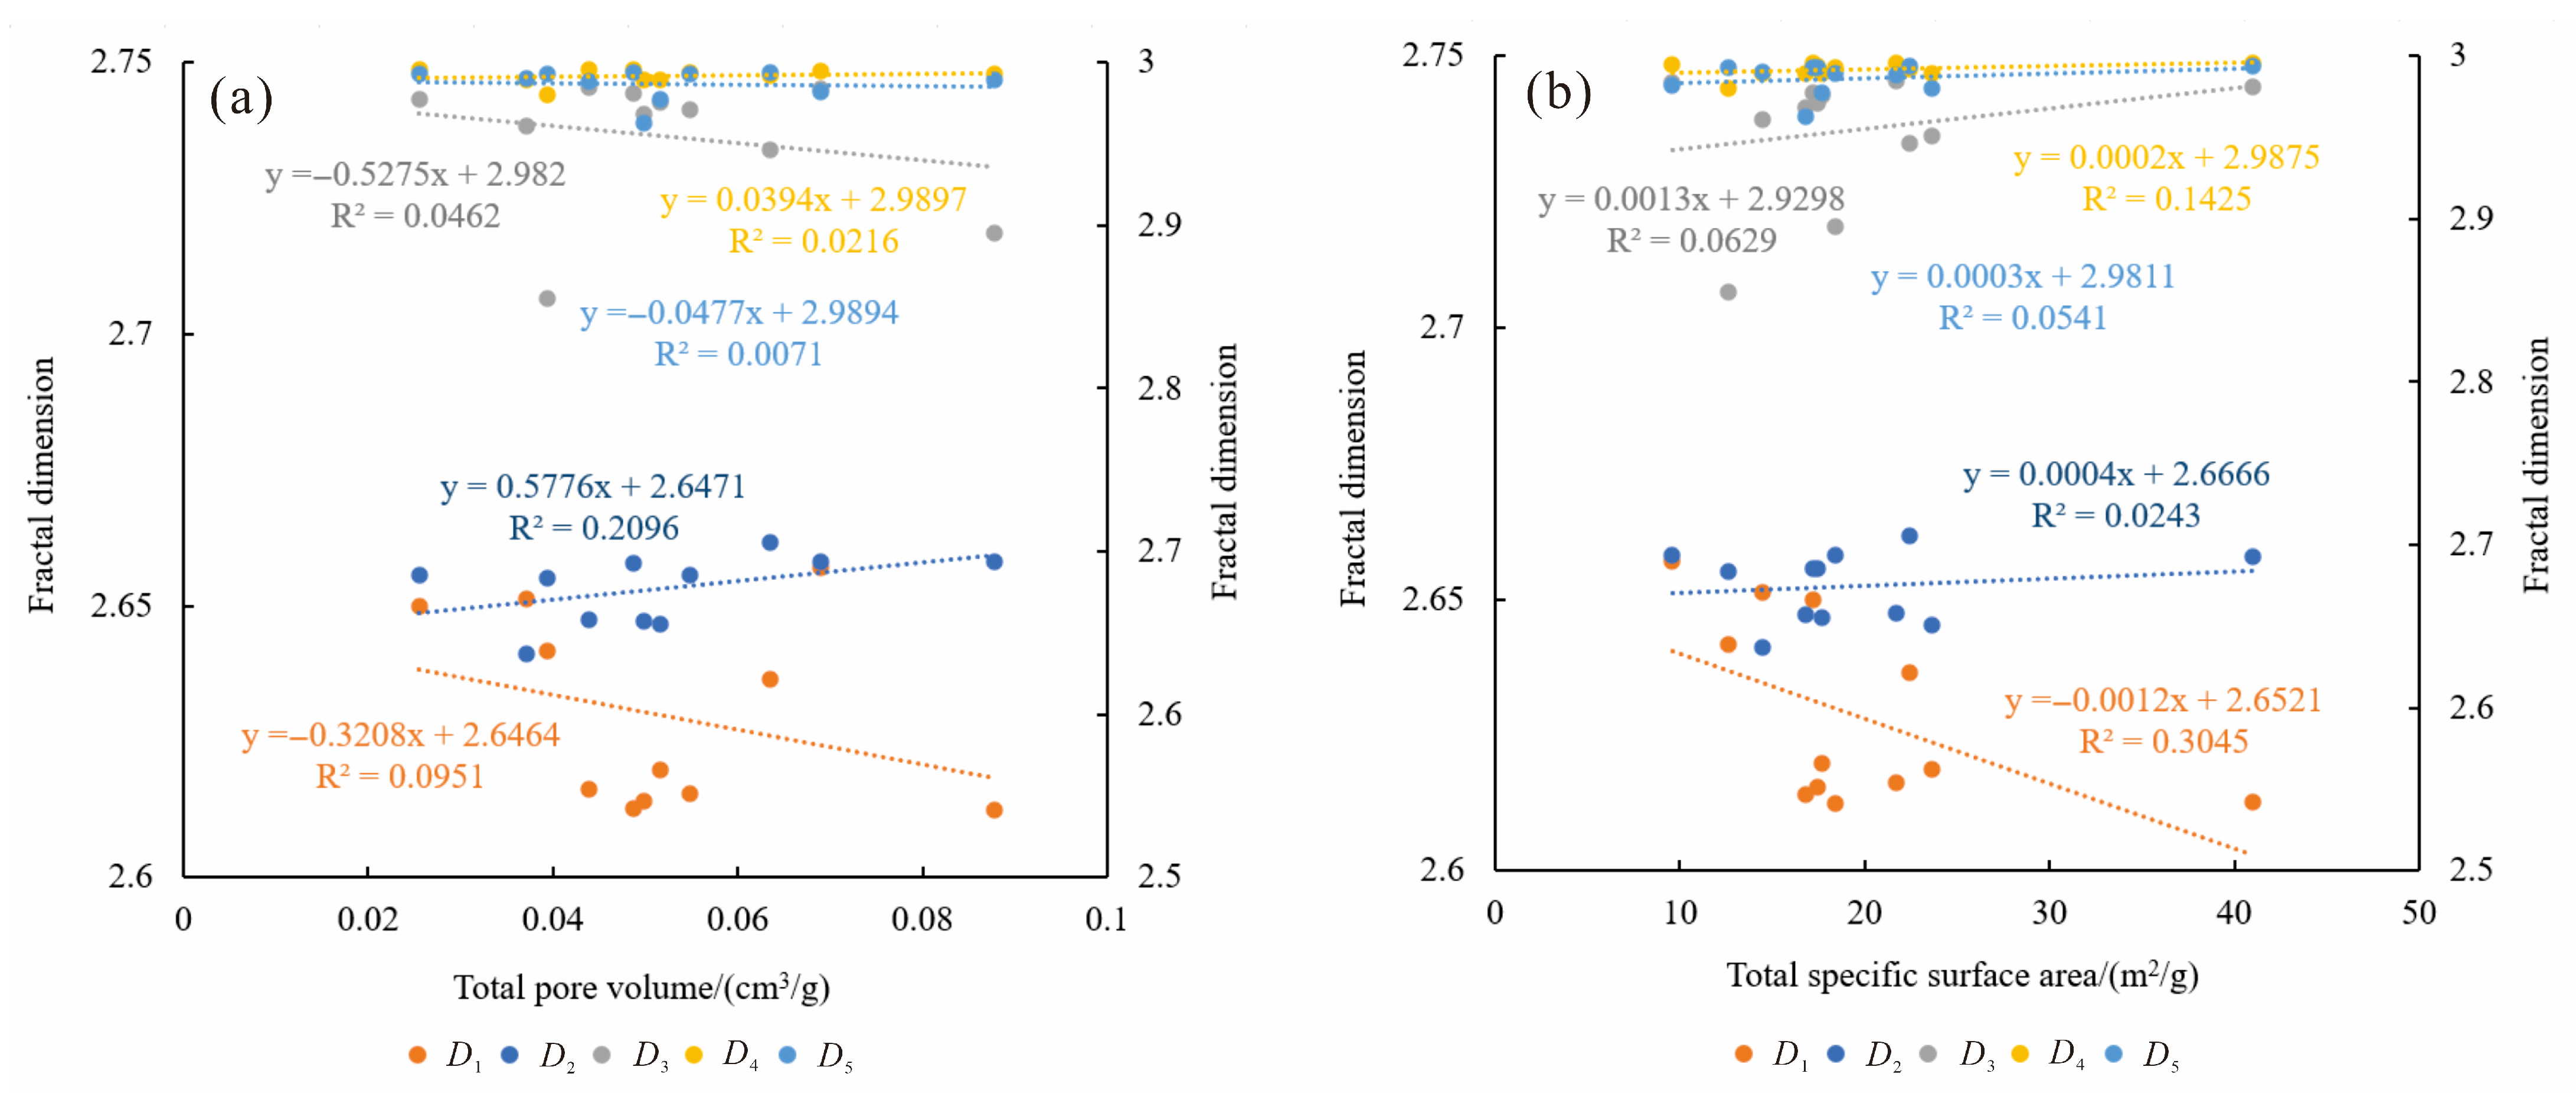
4.3. Relationship Between Pore Structure and Fractal Dimensions

Pore structure parameters in shale are critical factors influencing fractal dimensions [27]. The relationship between pore volume and fractal dimensions is complex: macropore development generally simplifies pore structures (reducing fractal dimensions), whereas mesopore and micropore proliferation enhances pore network complexity (increasing fractal dimensions).
When the total pore volume increases, the fractal dimension D1 slightly decreases, albeit with an extremely weak correlation, while D4 exhibits a weak positive correlation, suggesting that macropore volume growth may marginally amplify pore complexity. No significant associations are observed between the total pore volume and D2, D3, or D5. This weak correlation arises because the total pore volume comprises contributions from micropores, mesopores, and macropores, whose opposing impacts on fractal dimensions may offset one another. For D4 (macropore range: 1000–10,000 nm), volume increases could stem from isolated dissolution pores (simple structures) or fracture networks (complex structures), leading to contradictory fractal responses. In high-maturity shale, organic pore compaction may reduce the micropore volume, but tectonic fractures (macropores) may partially compensate for total porosity.
As shown in Figure 12b, the total specific surface area (SSA) displays a moderate negative correlation with D5, a weak positive correlation with D2, and no significant links to D1, D3, or D4. An elevated SSA is typically attributed to micropores (<50 nm); however, the negative correlation with D5 (macrofractures > 10,000 nm) suggests that reduced fracture roughness (D5) may coexist with high SSA from microporosity sources such as organic pores (high D1) or clay mineral interlayer fractures (high D2). This spatial decoupling implies that macrofractures (D5) and microporosity-dominated SSA are inversely related. In overmature shales, organic pore closure reduces the SSA, but tectonic fractures (high D5) may dominate as primary flow pathways, necessitating a balance between adsorption capacity and seepage efficiency. These findings highlight the intricate trade-offs between pore-scale heterogeneity and reservoir-scale performance in coal-bearing shale systems.

4.4. Implications for Shale Gas Exploration in the Upper Paleozoic Coal-Bearing Shale of the Yangquan Block, Qinshui Basin

Previous studies have revealed that the fractal dimension of pores in coal-bearing shale significantly governs the enrichment of shale gas. Specifically, the gas adsorption capacity of coal-bearing shale exhibits a positive correlation with the fractal dimension; therefore, a higher fractal dimension corresponds to greater adsorbed gas content in coal-bearing shale [68,69]. Simultaneously, the fractal dimension also regulates the gas migration efficiency. A higher fractal dimension reflects more complex pore structures and increased tortuosity within the coal-bearing shale reservoir, leading to shale gas having reduced seepage capacity. Diminished flow dynamics enhances gas retention, thereby favoring the preservation of shale gas accumulations in coal-bearing shale [27].
The Qinshui Basin, a significant shale gas enrichment zone in China, exhibits substantial resource potential in the Upper Paleozoic coal-bearing shale of the Yangquan Block, characterized by the following traits: high organic matter abundance, where the total organic carbon (TOC) content ranges from 1 to 5%, with localized peaks of up to 6%, indicating robust hydrocarbon source rock potential; moderate thermal maturity, where vitrinite reflectance (Ro) values predominantly fall between 1.0 and 2.5%, spanning the mature to overmature stages, suitable for shale gas generation and preservation; and multi-scale pore development, involving the coexistence of micropores (<50 nm) and tectonic fractures (>10,000 nm), with fractal dimensions (D1D5) revealing heterogeneity that underscores dual adsorption and seepage capabilities.
A quantitative analysis of fractal dimensions (D1D5), integrating low-temperature N2 adsorption (D1, D2) and high-pressure mercury intrusion (D3D5) experiments, elucidates the heterogeneity of multi-scale pore systems in coal-bearing shale, offering novel metrics for reservoir classification. Overmaturity (Ro > 2.0%) induces organic pore collapse but enhances seepage capacity through tectonic fracture development (D5), resolving the dynamic balance between “adsorption-seepage” trade-offs. A “sweet spot” model—high D1 (micropore adsorption) + low D4 (macropore seepage) + high D5 (fracture complexity)—is proposed based on correlations between fractal dimensions, mineral composition (quartz and clay), and total specific surface area, refining exploration targeting.

5. Conclusions

(1)
The Upper Paleozoic coal-bearing shale in the Yangquan Block of the Qinshui Basin exhibits high organic matter abundance (TOC: avg. 3.82%) and has reached an overmature thermal maturity stage (Ro: avg. 2.29%). Mineralogically, it is characterized by a high clay mineral content (avg. 58.9% by mass) and a low brittle mineral content.
(2)
The Upper Paleozoic coal-bearing shale in the Yangquan Block of the Qinshui Basin exhibits low porosity and low permeability characteristics. Porosity ranges from 1.1 to 4.9% (average 3.1%), while permeability varies between 0.0008 × 10⁻³ and 0.1910 × 10⁻³ μm2 (average 0.0274 × 10⁻³ μm2). Pore types are dominated by interparticle pores, intraparticle pores, and microfractures, which collectively provide essential storage space for shale gas accumulation.
(3)
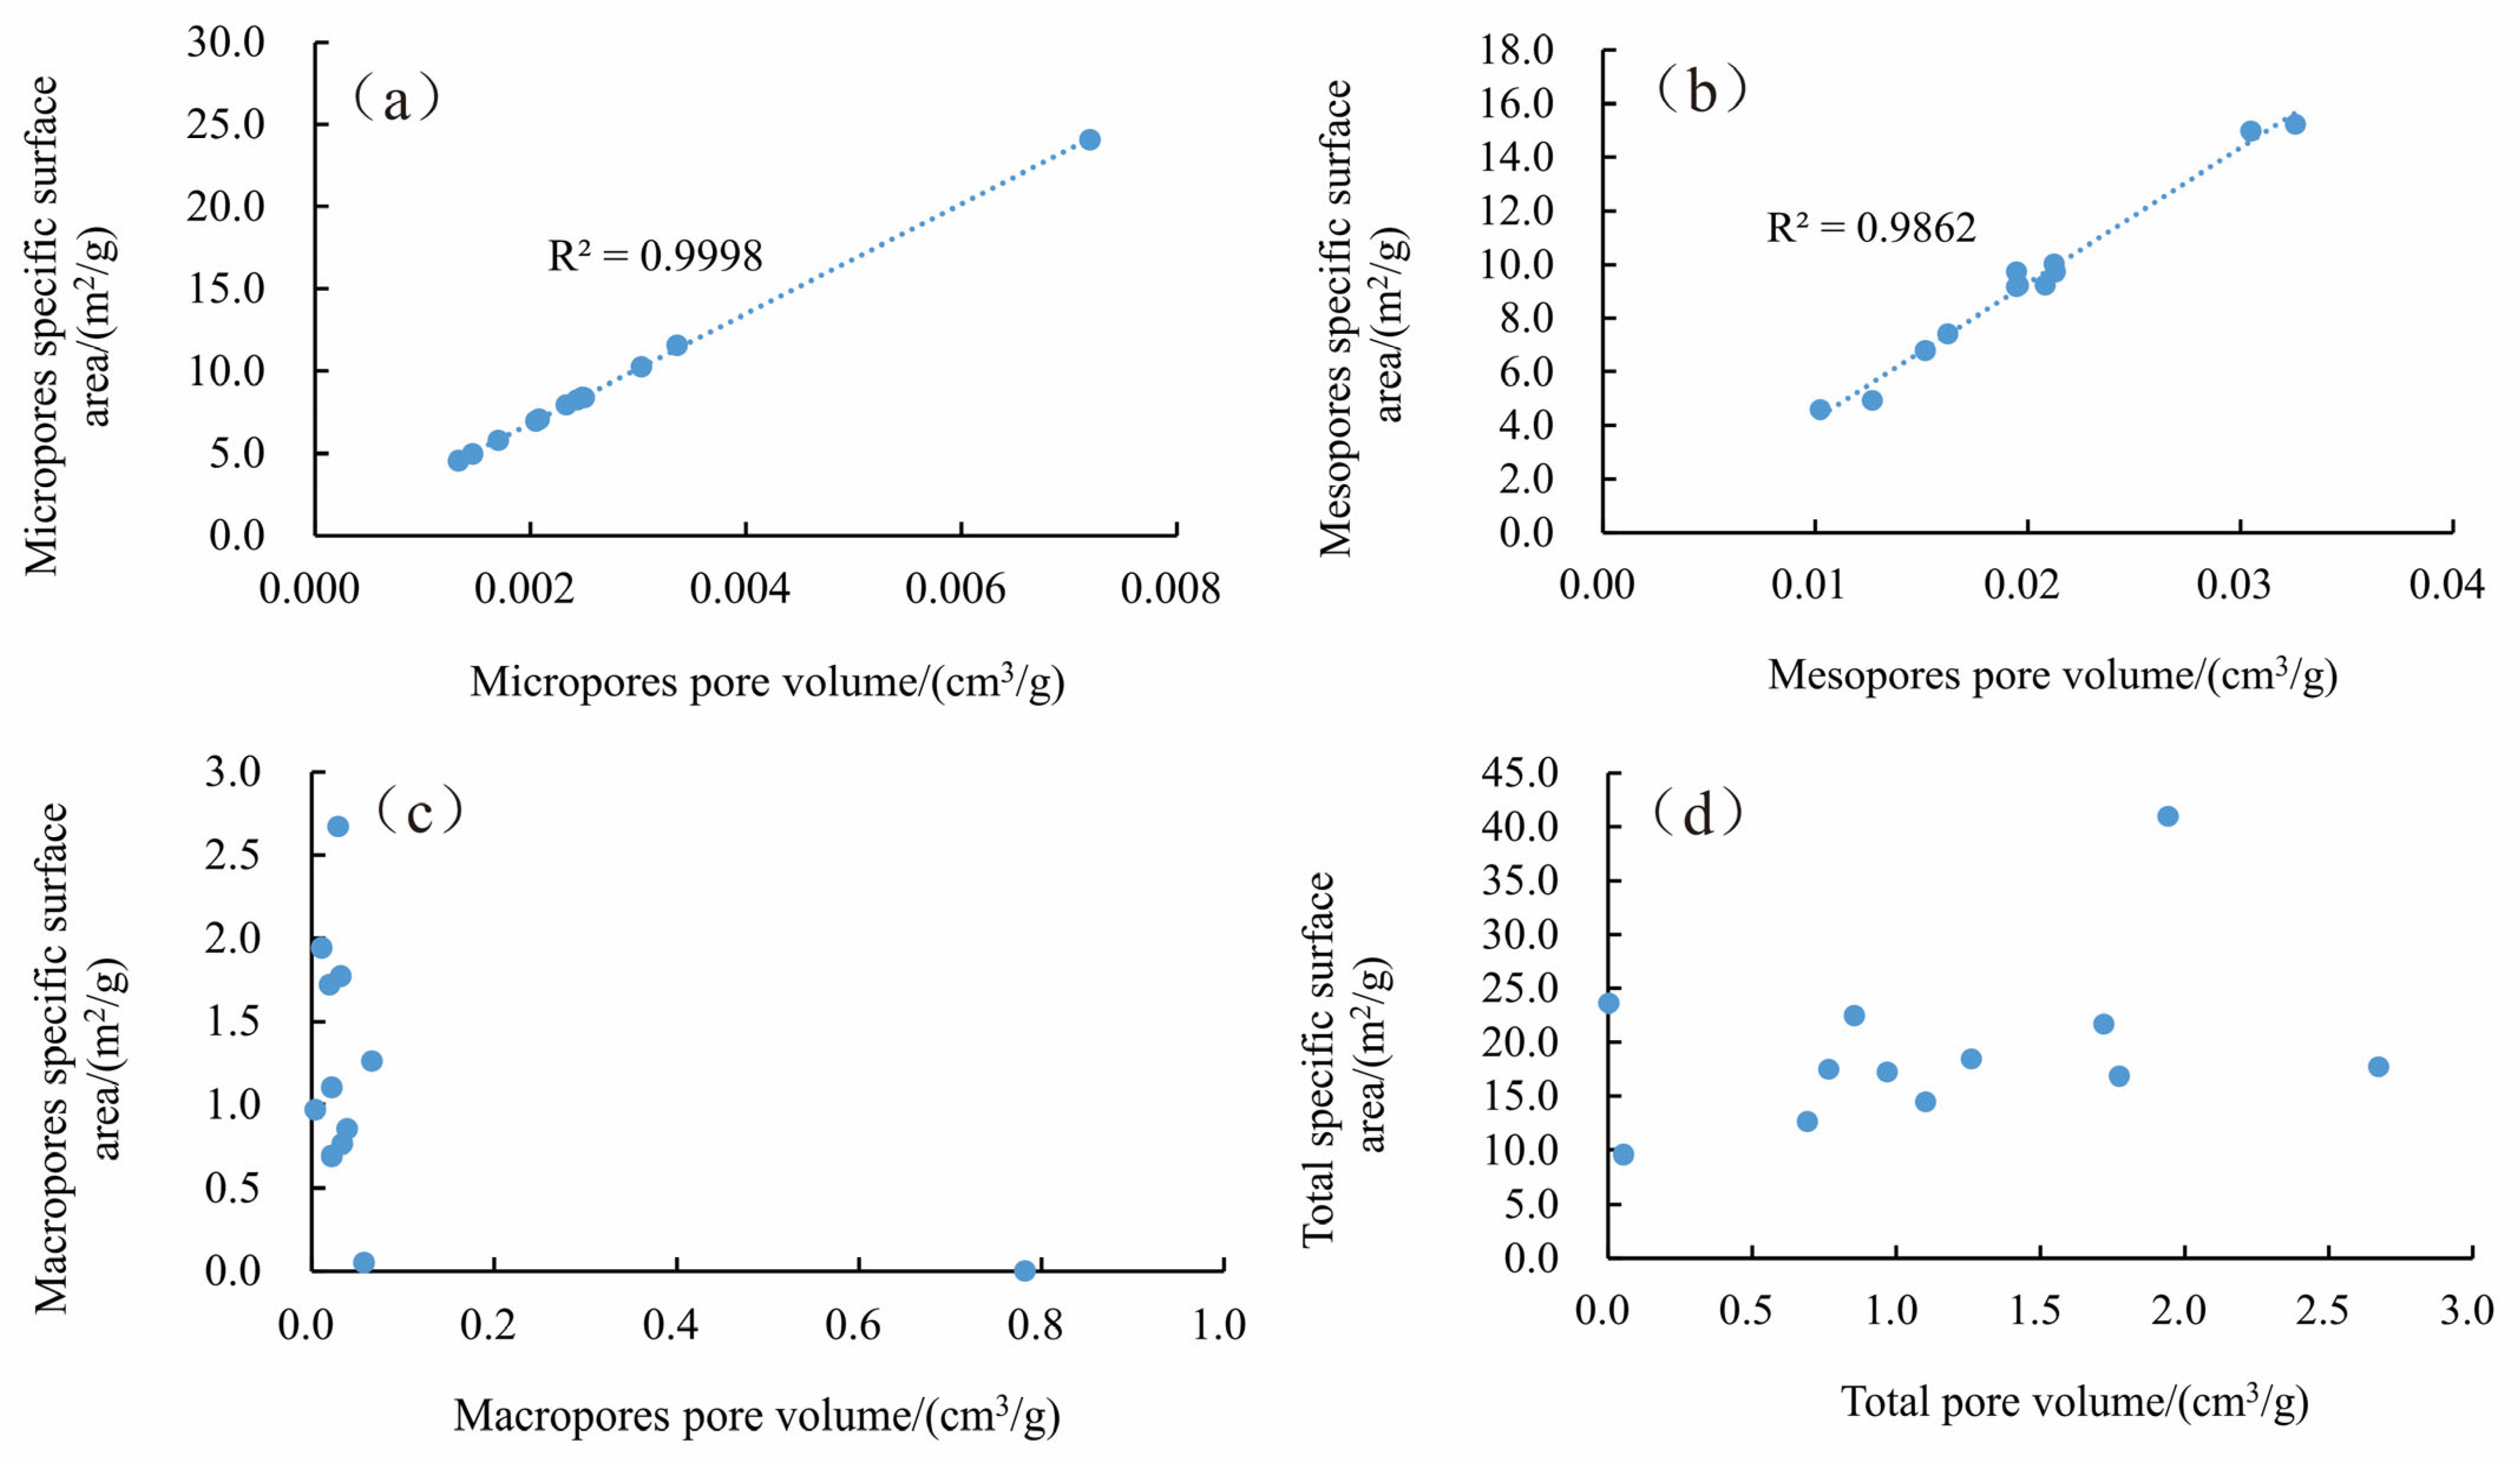
The Upper Paleozoic coal-bearing shale in the Yangquan Block of the Qinshui Basin exhibits a total pore volume ranging from 0.0255 to 0.8171 cm3/g (mean: 0.1157 cm3/g) and a total specific surface area (SSA) of 9.60–40.98 m2/g (mean: 19.43 m2/g). Micropores and mesopores demonstrate a strong positive correlation between their pore volumes and SSA, indicating that these pore types serve as the primary storage carriers for shale gas in the Yangquan Block. This micro-mesopore dominance suggests favorable shale gas storage potential. However, the limited fracability of the shale reservoir, likely due to the high clay mineral content and low brittle mineral proportions, poses significant challenges for gas extraction, potentially hindering commercial development.
(4)
The surface fractal dimension (D1) and volumetric fractal dimension (D2) quantify pore surface roughness and the filling capacity of nano-scale pore networks, respectively. A D1 value approaching 3 (e.g., 2.8–2.9) indicates well-developed organic pores or clay mineral interlayer fractures, signifying strong adsorption potential. D2→3 reflects complex structures formed by intertwined micropores and mesopores. D3 (50–1000 nm) characterizes the connectivity of mineral intergranular pores and microfractures, while D4 (1000–10,000 nm) delineates the spatial distribution of dissolution vugs and fracture networks. D5 (>10,000 nm) captures the roughness and seepage efficiency of macroscopic fractures. The segmented variations in fractal dimensions (e.g., D3 = 2.6 vs. D5 = 2.9) underscore the inherent heterogeneity of the “adsorption-seepage” contradiction in reservoirs, highlighting the dual challenges of balancing gas storage and flow capacity in coal-bearing shale systems.
(5)
The weak correlation (R2 < 0.2) between total organic carbon (TOC) and micropore fractal dimensions (D1 and D2) suggests that high thermal maturity (Ro > 2.0%) induces organic pore compaction, diminishing TOC’s contribution to pore complexity. Increasing Ro suppresses macropore fractal dimensions (D4 and D5 reduction) but may indirectly enhance micropore roughness (D3 weak positive correlation) through clay mineral transformations (e.g., illitization). High-quartz zones (>50%) exhibit uniform pore structures (D3 ≈ 2), favoring superior permeability but weak adsorption capacity. In contrast, high-clay zones (>60%) elevate micropore fractal dimensions (D1 and D2) while suppressing macropore connectivity (D4 and D5 decline). Optimal reservoirs require the synergistic combination of high D1 (>2.8) + low D4 (<2.6) + high D5 (>2.7), ensuring strong micropore adsorption, efficient macropore seepage, and complex fracture networks. This model balances adsorption–seepage trade-offs, offering a targeted framework for identifying high-potential intervals in heterogeneous, overmature coal-bearing shale systems.

Author Contributions

Conceptualization, X.L. and J.Z.; methodology, X.L.; software, J.Z.; validation, X.L., J.Z. and X.Z. (Xueqing Zhang); formal analysis, J.Z.; investigation, X.Z. (Xueqing Zhang); resources, X.L. and S.K.; data curation, X.Z. (Xiaoyan Zou); writing—original draft preparation, J.Z.; writing—review and editing, X.Z. (Xiaoyan Zou), J.Z., and Y.Y.; visualization, J.Z.; supervision, X.L.; project administration, X.L.; funding acquisition, X.L. and S.K. All authors have read and agreed to the published version of the manuscript.

Funding

This research was supported by the Natural Science Foundation Project of China (U1810201) and the Influence and Contribution of Inorganic Fluids on Natural Gas Generation under Deep-Seated Conditions (CSJ-2023-08).

Data Availability Statement

The data that support the findings of this study are available from the corresponding author upon reasonable request. All the data can be found in the paper.

Conflicts of Interest

The authors declare that they have no conflicts of interest.

References

  1. Dai, J.; Dong, D.; Ni, Y.; Gong, D.; Huang, S.; Hong, F.; Zhang, Y.; Liu, Q.; Wu, X.; Feng, Z. Distribution Patterns of Tight Sandstone Gas and Shale Gas. Pet. Explor. Dev. 2024, 51, 767–779. [Google Scholar] [CrossRef]
  2. Guo, X.; Wang, R.; Shen, B.; Wang, G.; Wan, C.; Wang, Q. Geological Characteristics, Resource Potential, and Development Direction of Shale Gas in China. Pet. Explor. Dev. 2025, 52, 17–32. [Google Scholar] [CrossRef]
  3. Li, S.; Zhou, Z.; Nie, H.; Zhang, L.; Song, T.; Liu, W.; Li, H.; Xu, Q.; Wei, S.; Tao, S. Distribution Characteristics, Exploration & Development, Geological Theories Research Progress and Exploration Directions of Shale Gas in China. China Geol. 2022, 5, 110–135. [Google Scholar] [CrossRef]
  4. Mcmahon, T.P.; Larson, T.E.; Zhang, T.; Shuster, M. Geologic Characteristics, Exploration and Production Progress of Shale Oil and Gas in the United States: An Overview. Pet. Explor. Dev. 2024, 51, 925–948. [Google Scholar] [CrossRef]
  5. Nie, H.; Dang, W.; Zhang, Q.; Zhang, J.; Li, P.; Zhang, S.; Ding, J.; Chen, Q.; Feng, Y.; Zhang, X. Evaluation of Gas Content in Organic-Rich Shale: A Review of the History, Current Status, and Future Directions. Geosci. Front. 2024, 15, 101921. [Google Scholar] [CrossRef]
  6. Zhai, G.; Wang, Y.; Zhou, Z.; Yu, S.; Chen, X.; Zhang, Y. Exploration and Research Progress of Shale Gas in China. China Geol. 2018, 1, 257–272. [Google Scholar] [CrossRef]
  7. Zhang, J.; Li, Z.; Wang, D.; Xu, L.; Li, Z.; Niu, J.; Chen, L.; Sun, Y.; Li, Q.; Yang, Z.; et al. Shale Gas Accumulation Patterns in China. Nat. Gas Ind. B 2023, 10, 14–31. [Google Scholar] [CrossRef]
  8. Zou, X.; Li, X.; Zhang, J.; Li, H.; Guo, M.; Zhao, P. Characteristics of Pore Structure and Gas Content of the Lower Paleozoic Shale from the Upper Yangtze Plate, South China. Energies 2021, 14, 7603. [Google Scholar] [CrossRef]
  9. Zou, C.; Dong, D.; Wang, Y.; Li, X.; Huang, J.; Wang, S.; Guan, Q.; Zhang, C.; Wang, H.; Liu, H.; et al. Shale Gas in China: Characteristics, Challenges and Prospects (II). Pet. Explor. Dev. 2016, 43, 182–196. [Google Scholar] [CrossRef]
  10. Miao, H.; Jiang, Z.X.; Gong, X.; Li, C.M.; Wang, D.D.; Wu, Q.Z. The shale gas migration capacity of the Qiongzhusi Formation: Implications for its enrichment model. Phys. Fluids 2025, 37, 056603. [Google Scholar] [CrossRef]
  11. He, X.; Chen, G.; Wu, J.; Liu, Y.; Wu, S.; Zhang, J.; Zhang, X. Deep Shale Gas Exploration and Development in the Southern Sichuan Basin: New Progress and Challenges. Nat. Gas Ind. B 2023, 10, 32–43. [Google Scholar] [CrossRef]
  12. Zhang, J.; Xiao, X.; Wang, J.; Lin, W.; Han, D.; Wang, C.; Li, Y.; Xiong, Y.; Zhang, X. Pore Structure and Fractal Characteristics of Coal-Bearing Cretaceous Nenjiang Shales from Songliao Basin, Northeast China. J. Nat. Gas Geosci. 2024, 9, 197–208. [Google Scholar] [CrossRef]
  13. Yun, L. Accumulation and Exploration Enlightenment of Shallow Normal-Pressure Shale Gas in Southeastern Sichuan Basin, SW China. Pet. Explor. Dev. 2023, 50, 1308–1319. [Google Scholar] [CrossRef]
  14. Yong, R.; Yang, H.; Wu, W.; Yang, X.; Yang, Y.; Huang, H. Controlling Factors and Exploration Potential of Shale Gas Enrichment and High Yield in Permian Dalong Formation, Northern Sichuan Basin, SW China. Pet. Explor. Dev. 2025, 52, 285–300. [Google Scholar] [CrossRef]
  15. Zhang, L.; He, X.; Li, X.; Li, K.; He, J.; Zhang, Z.; Guo, J.; Chen, Y.; Liu, W. Shale Gas Exploration and Development in the Sichuan Basin: Progress, Challenge and Countermeasures. Nat. Gas Ind. B 2022, 9, 176–186. [Google Scholar] [CrossRef]
  16. Zhao, Q.; Zhou, T.; Wang, H.; Jin, Y.; Zhou, S.; Duan, X. Determination of Adsorption Parameters in Shale Gas Resource/Reserve Calculation: Case Study of Wufeng Formation–Longmaxi Formation in the Sichuan Basin. Nat. Gas Ind. B 2023, 10, 304–311. [Google Scholar] [CrossRef]
  17. Lu, C.; Xiao, X.; Gai, H.; Feng, Y.; Li, G.; Meng, G.; Gao, P. Nanopore Structure Characteristics and Evolution of Type III Kerogen in Marine-Continental Transitional Shales from the Qinshui Basin, Northern China. Geoenergy Sci. Eng. 2023, 221, 211413. [Google Scholar] [CrossRef]
  18. Sun, J.; Xiao, X.; Cheng, P. Methane Absorption of Coal-Measure Shales with and without Pore Water from the Qinshui Basin, North China: Based on High-Pressure Methane Absorption Experiments. Int. J. Coal Geol. 2022, 263, 104116. [Google Scholar] [CrossRef]
  19. Yang, X.; Tang, S.; Xi, Z.; Zhang, S.; Zhang, Q.; Zhang, K.; Lin, D.; Wang, J. Dynamic Evolution and Differential Enrichment of Deep Coalbed Methane: A Case Study in Qinshui Basin. Int. J. Coal Geol. 2025, 299, 104696. [Google Scholar] [CrossRef]
  20. Zhang, X.; Li, X.; Yang, J.; Zhang, B.; Sun, J.; Yu, Z. Characterization of the Full-Sized Pore Structure and Controlling Factors of the Coal-Bearing Shale in the Wuxiang Block, South-Central Qinshui Basin, China. Front. Earth Sci. 2022, 9, 813925. [Google Scholar] [CrossRef]
  21. He, H.; Liu, P.; Xu, L.; Hao, S.; Qiu, X.; Shan, C.; Zhou, Y. Pore Structure Representations Based on Nitrogen Adsorption Experiments and an FHH Fractal Model: Case Study of the Block Z Shales in the Ordos Basin, China. J. Pet. Sci. Eng. 2021, 203, 108661. [Google Scholar] [CrossRef]
  22. He, T.; Zhou, Y.; Chen, Z.; Zhang, Z.; Xie, H.; Shang, Y.; Cui, G. Fractal Characterization of the Pore-Throat Structure in Tight Sandstone Based on Low-Temperature Nitrogen Gas Adsorption and High-Pressure Mercury Injection. Fractal Fract. 2024, 8, 356. [Google Scholar] [CrossRef]
  23. Ma, X.; Guo, S.; Shi, D.; Zhou, Z.; Liu, G. Investigation of Pore Structure and Fractal Characteristics of Marine-Continental Transitional Shales from Longtan Formation Using MICP, Gas Adsorption, and NMR (Guizhou, China). Mar. Pet. Geol. 2019, 107, 555–571. [Google Scholar] [CrossRef]
  24. Ning, S.; Xia, P.; Hao, F.; Tian, J.; Fu, Y.; Wang, K. Pore Fractal Characteristics between Marine and Marine–Continental Transitional Black Shales: A Case Study of Niutitang Formation and Longtan Formation. Fractal Fract. 2024, 8, 288. [Google Scholar] [CrossRef]
  25. Wang, Y.; Han, D.; Lin, W.; Jia, Y.; Zhang, J.; Wang, C.; Ma, B. Factors Controlling Differences in Morphology and Fractal Characteristics of Organic Pores of Longmaxi Shale in Southern Sichuan Basin, China. Fractal Fract. 2024, 8, 555. [Google Scholar] [CrossRef]
  26. Mandelbrot, B.B. Les Objets Fractals: Forme, Hazard et Dimension; Flammarion: Paris, France, 1975. [Google Scholar]
  27. Zhang, J.; Li, X.; Wei, Q.; Sun, K.; Zhang, G.; Wang, F. Characterization of Full-Sized Pore Structure and Fractal Characteristics of Marine–Continental Transitional Longtan Formation Shale of Sichuan Basin, South China. Energy Fuels 2017, 31, 10490–10504. [Google Scholar] [CrossRef]
  28. Feng, Y.; Xiao, X.-M.; Wang, E.-Z.; Gao, P.; Lu, C.-G.; Li, G. Gas Storage in Shale Pore System: A Review of the Mechanism, Control and Assessment. Pet. Sci. 2023, 20, 2605–2636. [Google Scholar] [CrossRef]
  29. Li, X.; Li, Y.; Li, J.; Zou, X.; Guo, M.; Wang, Z.; Zhang, X.; Wang, F. Characteristics of Pore Structures from the Lower Paleozoic Shale Gas Reservoirs in Northern Guizhou, South China. J. Nat. Gas Geosci. 2020, 5, 241–253. [Google Scholar] [CrossRef]
  30. Liu, Z.; Zhao, S.; Hu, Z.; Shen, B.; Feng, D.; Zhang, J.; Ye, J.; Ma, C.; Dong, Z. Characteristics and Controlling Factors of Coal-Measure Unconventional Reservoirs—A Case Study of the Carboniferous-Permian in the Ordos Basin. Unconv. Resour. 2025, 6, 100153. [Google Scholar] [CrossRef]
  31. Nie, H.; Jin, Z.; Li, P.; Jay Katz, B.; Dang, W.; Liu, Q.; Ding, J.; Jiang, S.; Li, D. Deep Shale Gas in the Ordovician-Silurian Wufeng–Longmaxi Formations of the Sichuan Basin, SW China: Insights from Reservoir Characteristics, Preservation Conditions and Development Strategies. J. Asian Earth Sci. 2023, 244, 105521. [Google Scholar] [CrossRef]
  32. Zhang, M.; Fu, X. Influence of Reservoir Properties on the Adsorption Capacity and Fractal Features of Shales from Qinshui Coalfield. J. Pet. Sci. Eng. 2019, 177, 650–662. [Google Scholar] [CrossRef]
  33. Wang, Q.; Lu, H.; Wang, T.; Liu, D.; Peng, P.; Zhan, X.; Li, X. Pore Characterization of Lower Silurian Shale Gas Reservoirs in the Middle Yangtze Region, Central China. Mar. Pet. Geol. 2018, 89, 14–26. [Google Scholar] [CrossRef]
  34. Liang, J.; Huang, W.; Wang, H.; Blum, M.J.; Chen, J.; Wei, X.; Yang, G. Organic Geochemical and Petrophysical Characteristics of Transitional Coal-Measure Shale Gas Reservoirs and Their Relationships with Sedimentary Environments: A Case Study from the Carboniferous-Permian Qinshui Basin, China. J. Pet. Sci. Eng. 2020, 184, 106510. [Google Scholar] [CrossRef]
  35. Xiang, J.; Li, J.; Li, X.; Ma, X.; Sun, J.; Zou, Z.; Qin, Y. Isotopic and Hydrochemical Evidence for the Origins of Unconventional Gases in the Middle and Lower Jurassic Coal Measures in the Fukang Area of Junggar Basin, NW China. Int. J. Coal Geol. 2025, 302, 104726. [Google Scholar] [CrossRef]
  36. Meng, Z.; Zhang, J.; Wang, R. In-Situ Stress, Pore Pressure and Stress-Dependent Permeability in the Southern Qinshui Basin. Int. J. Rock Mech. Min. Sci. 2011, 48, 122–131. [Google Scholar] [CrossRef]
  37. Li, J.; Tang, S.; Zhang, S.; Li, L.; Wei, J.; Xi, Z.; Sun, K. Characterization of Unconventional Reservoirs and Continuous Accumulations of Natural Gas in the Carboniferous-Permian Strata, Mid-Eastern Qinshui Basin, China. J. Nat. Gas Sci. Eng. 2018, 49, 298–316. [Google Scholar] [CrossRef]
  38. Zhang, M.; Fu, X.; Zhang, Q.; Cheng, W. Research on the Organic Geochemical and Mineral Composition Properties and Its Influence on Pore Structure of Coal-Measure Shales in Yushe-Wuxiang Block, South Central Qinshui Basin, China. J. Pet. Sci. Eng. 2019, 173, 1065–1079. [Google Scholar] [CrossRef]
  39. Peng, C.; Zou, C.; Yang, Y.; Zhang, G.; Wang, W. Fractal Analysis of High Rank Coal from Southeast Qinshui Basin by Using Gas Adsorption and Mercury Porosimetry. J. Pet. Sci. Eng. 2017, 156, 235–249. [Google Scholar] [CrossRef]
  40. Zhang, J.; Li, X.; Xiaoyan, Z.; Zhao, G.; Zhou, B.; Li, J.; Xie, Z.; Wang, F. Characterization of the Full-Sized Pore Structure of Coal-Bearing Shales and Its Effect on Shale Gas Content. Energy Fuels 2019, 33, 1969–1982. [Google Scholar] [CrossRef]
  41. Ge, T.; Pan, J.; Wang, K.; Liu, W.; Mou, P.; Wang, X. Heterogeneity of Pore Structure of Late Paleozoic Transitional Facies Coal-Bearing Shale in the Southern North China and Its Main Controlling Factors. Mar. Pet. Geol. 2020, 122, 104710. [Google Scholar] [CrossRef]
  42. Zhang, Q.; Jin, Z.; Deng, E.; Xu, Z.; Zhu, R.; Liu, Q.; Yan, Z.; Hu, K.; Zheng, T.; Hu, Z. Accumulation and Maturation of Organic Matter in Shales: The Coal-Bearing Permian Longtan Formation at Tucheng Syncline, Southwestern Guizhou, China. Appl. Geochem. 2025, 180, 106257. [Google Scholar] [CrossRef]
  43. Shao, L.-Y.; Yang, Z.-Y.; Shang, X.-X.; Xiao, Z.-H.; Wang, S.; Zhang, W.-L.; Zheng, M.-Q.; Lu, J. Lithofacies Palaeogeography of the Carboniferous and Permian in the Qinshui Basin, Shanxi Province, China. J. Palaeogeogr. 2015, 4, 384–412. [Google Scholar] [CrossRef]
  44. GB/T 19145-2003; Determination of Total Organic Carbon in Sedimentary Rock. Standardization Administration of China (SAC): Beijing, China, 2003.
  45. GB/T 18602-2012; Rock Pyrolysis Analysis. Standardization Administration of China (SAC): Beijing, China, 2012.
  46. SY/T 5124-2012; Microscopy Identification Method of Macerals in Sedimentary Rocks. National Energy Administration (NEA) of China: Beijing, China, 2012.
  47. SY/T 5163-2018; Analytical Method of Rock Samples by Scanning Electron Microscopy. National Energy Administration (NEA) of China: Beijing, China, 2018.
  48. SY/T 5162-2014; Analysis Method for Clay Minerals and Common Non-Clay Minerals in Sedimentary Rocks by X-Ray Diffraction. National Energy Administration (NEA) of China: Beijing, China, 2014.
  49. GB/T 19587-2017; Determination of the Specific Surface Area of Solids by Gas Adsorption Using the BET Method. Standardization Administration of China (SAC): Beijing, China, 2017.
  50. GB/T 21650.1-2008; Pore Size Distribution and Porosity of Solid Materials by Mercury Porosimetry and Gas Adsorption—Part 1: Mercury Porosimetry. Standardization Administration of China (SAC): Beijing, China, 2008.
  51. ISO 15901-1:2005; Pore Size Distribution and Porosity of Solid Materials by Mercury Porosimetry and Gas Adsorption—Part 1: Mercury Porosimetry. International Organization for Standardization (ISO): Geneva, Switzerland, 2005.
  52. Mahamud, M.M.; Novo, M.F. The Use of Fractal Analysis in the Textural Characterization of Coals. Fuel 2008, 87, 222–231. [Google Scholar] [CrossRef]
  53. Peter, P.; Avnir, D. Chemistry in noninteger dimensions between two and three. J. Chem. Phys. 1983, 79, 3558–3565. [Google Scholar] [CrossRef] [PubMed]
  54. Avnir, D.; Jaroniec, M. An Isotherm Equation for Adsorption on Fractal Surfaces of Heterogeneous Porous Materials. Langmuir 1989, 5, 1431–1433. [Google Scholar] [CrossRef]
  55. Pfeifer, P. Fractal dimension as working tool for surface-roughness problems. Appl. Surf. Sci. 1984, 18, 146–164. [Google Scholar] [CrossRef]
  56. Tatlıer, M.; Erdem-Şenatalar, A. Method to evaluate the fractal dimensions of solid adsorbents. J. Phys. Chem. 1999, 103, 4360–4365. [Google Scholar] [CrossRef]
  57. Yao, Y.; Liu, D.; Tang, D.; Tang, S.; Huang, W. Fractal characterization of adsorption-Pores of coals from North China: An investigation on CH4 adsorption capacity of coals. Int. J. Coal Geol. 2008, 73, 27–42. [Google Scholar] [CrossRef]
  58. Loucks, R.G.; Reed, R.M.; Ruppel, S.C.; Hammes, U. Spectrum of pore types and networks in mudrocks and a descriptive classification for matrix-related mudrock pores. AAPG Bull. 2012, 96, 1071–1098. [Google Scholar] [CrossRef]
  59. Reed, R.M.; Loucks, R.L. Imaging nanoscale pores in the Mississippian Barnett Shale of the northern Fort Worth Basin. AAPG Annu. Conv. Abstr. 2007, 16, 115. [Google Scholar]
  60. Bustin, R.M.; Bustin, A.; Cui, A.; Ross, D.; Pathi, V.M. Impact of Shale Properties on Pore Structure and Storage Characteristics. Presented at the SPE Shale Gas Production Conference, Fort Worth, TX, USA, 16–18 November 2008. [Google Scholar] [CrossRef]
  61. Montgomery, S.L.; Jarvie, D.M.; Bowker, K.A.; Pollastro, R.M. Mississippian Barnett Shale, Fort Worth basin, north-central Texas: Gas-shale play with multi–trillion cubic foot potential. AAPG Bull. 2005, 89, 155–175. [Google Scholar] [CrossRef]
  62. Jarvie, D.M.; Hill, R.J.; Ruble, T.E.; Pollastro, R.M. Unconventional shale-gas systems: The Mississippian Barnett Shale of north-central Texas as one model for thermogenic shale-gas assessment. AAPG Bull. 2007, 91, 475–499. [Google Scholar] [CrossRef]
  63. Bowker, K.A. Barnett Shale gas production, Fort Worth Basin: Issues and discussion. AAPG Bull. 2007, 91, 523–533. [Google Scholar] [CrossRef]
  64. Zhang, J.; Li, X.; Wei, Q.; Gao, W.; Liang, W.; Wang, Z.; Wang, F. Quantitative Characterization of Pore-Fracture System of Organic-Rich Marine-Continental Shale Reservoirs: A Case Study of the Upper Permian Longtan Formation, Southern Sichuan Basin, China. Fuel 2017, 200, 272–281. [Google Scholar] [CrossRef]
  65. Rowe, H.D.; Loucks, R.G.; Ruppel, S.C.; Rimmer, S.M. Mississippian Barnett Formation, Fort Worth Basin, Texas: Bulk Geochemical Inferences and Mo–TOC Constraints on the Severity of Hydrographic Restriction. Chem. Geol. 2008, 257, 16–25. [Google Scholar] [CrossRef]
  66. Hu, J.; Tang, S.; Zhang, S. Investigation of Pore Structure and Fractal Characteristics of the Lower Silurian Longmaxi Shales in Western Hunan and Hubei Provinces in China. J. Nat. Gas Sci. Eng. 2016, 28, 522–535. [Google Scholar] [CrossRef]
  67. IUPAC. Reporting physisorption data for gas/solid systems with special reference to the determination of surface area and porosity. Pure Appl. Chem. 1982, 54, 2201–2218. [Google Scholar] [CrossRef]
  68. Broekhoff, J.C.P.; Boer, J.H. Studies on pore systems in catalysts XIII: Pore distributions from the desorption branch of a nitrogen sorption isotherm in the case of cylindrical pores: B applications. J. Catal. 1968, 10, 377–390. [Google Scholar] [CrossRef]
  69. Rouquerol, J.; Avnir, D.; Fairbridge, C.W.; Everett, D.H.; Haynes, J.M.; Pernicone, N.; Ramsay, J.D.F.; Sing, K.S.W.; Unger, K.K. Recommendations for the characterization of porous solids (Technical Report). Pure Appl. Chem. 1994, 66, 1739–1758. [Google Scholar] [CrossRef]
Figure 1. Location map of the sampling wells and composite stratigraphic column of the Upper Paleozoic coal-bearing shale in the Yangquan Block, Qinshui Basin, China. (a) Location map of the Qinshui Basin, (b) Location map of the Yangquan Block, (c) Location map of sampling wells, (d) Comprehensive stratigraphic column of the Upper Paleozoic.
Fractalfract 09 00467 g001
Figure 2. Field emission scanning electron microscopy (FE-SEM) images of Upper Paleozoic coal-bearing shale samples from the Yangquan Block, Qinshui Basin. (a) Intergranular pores, (b) Intergranular pores, (c) Intergranular pores, (d) Intragranular pores, (e) Intragranular pores, (f) Organic matter pores, (g) Microfractures, (h) Microfractures, (i) Microfractures.
Fractalfract 09 00467 g002
Figure 3. Mercury intrusion–extrusion curves, pore volume distribution, and specific surface area distribution of Upper Paleozoic coal-bearing shale based on mercury intrusion porosimetry (MIP) in Yangquan Block, Qinshui Basin. (a) Mercury intrusion and extrusion curves of the Shanxi Formation, (b) Mercury intrusion and extrusion curves of the Taiyuan Formation, (c) Pore volume distribution of shale in the Shanxi Formation interpreted by mercury intrusion porosimetry (MIP), (d) Pore volume distribution of shale in the Taiyuan Formation interpreted by MIP, (e) Specific surface area distribution of shale in the Shanxi Formation interpreted by MIP, (f) Specific surface area distribution of shale in the Taiyuan Formation interpreted by MIP.
Fractalfract 09 00467 g003
Figure 4. N2 adsorption–desorption isotherms, pore volume distribution, and specific surface area distribution of Upper Paleozoic coal-bearing shale based on N2 adsorption analysis in Yangquan Block, Qinshui Basin. (a) N2 adsorption-desorption isotherms of the Shanxi Formation, (b) N2; adsorption-desorption isotherms of the Taiyuan Formation, (c) Pore volume distribution of shale in the Shanxi Formation interpreted by N2 adsorption, (d) Pore volume distribution of shale in the Taiyuan Formation interpreted by N2 adsorption, (e) Specific surface area distribution of shale in the Shanxi Formation interpreted by N2 adsorption, (f) Specific surface area distribution of shale in the Taiyuan Formation interpreted by N2 adsorption.
Fractalfract 09 00467 g004
Figure 5. CO2 adsorption–desorption isotherms, pore volume distribution, and specific surface area distribution of Upper Paleozoic coal-bearing shale based on CO2 adsorption analysis in Yangquan Block, Qinshui Basin. (a) CO2 adsorption isotherms of the Shanxi Formation, (b) CO2 adsorption isotherms of the Taiyuan Formation, (c) Pore volume distribution of shale in the Shanxi Formation interpreted by CO2 adsorption, (d) Pore volume distribution of shale in the Taiyuan Formation interpreted by CO2 adsorption, (e) Specific surface area distribution of shale in the Shanxi Formation interpreted by CO2 adsorption, (f) Specific surface area distribution of shale in the Taiyuan Formation interpreted by CO2 adsorption.
Fractalfract 09 00467 g005
Figure 6. Pore volume and specific surface area characteristics of Upper Paleozoic coal-bearing shale samples from Yangquan Block, Qinshui Basin. (a) Shale pore volume characteristics, (b) Shale specific surface area characteristics.
Fractalfract 09 00467 g006
Figure 7. Relationship between pore volume and specific surface area of Upper Paleozoic coal-bearing shale samples from Yangquan Block, Qinshui Basin. (a) Relationship between micropore volume and micropore specific surface area, (b) Relationship between mesopore volume and mesopore specific surface area, (c) Relationship between macropore volume and macropore specific surface area, (d) Relationship between total pore volume and total specific surface area.
Fractalfract 09 00467 g007
Figure 8. Fitting results of low-temperature N2 adsorption experimental data for Upper Paleozoic coal-bearing shale samples from Yangquan Block, Qinshui Basin. (a) Fractal dimensions of YQ-01-12 Shale based on the FHH model, (b) Fractal dimensions of YQ-01-22 Shale based on the FHH model, (c) Fractal dimensions of YQ-01-26 Shale based on the FHH model, (d) Fractal dimensions of YQ-01-43 Shale based on the FHH model, (e) Fractal dimensions of YQ-01-48 Shale based on the FHH model, (f) Fractal dimensions of YQ-02-02 Shale based on the FHH model, (g) Fractal dimensions of YQ-02-07 Shale based on the FHH model, (h) Fractal dimensions of YQ-02-11 Shale based on the FHH model, (i) Fractal dimensions of YQ-04-04 Shale based on the FHH model, (j) Fractal dimensions of YQ-04-08 Shale based on the FHH model, (k) Fractal dimensions of YQ-04-15 Shale based on the FHH model, (l) Fractal dimensions of YQ-04-19 Shale based on the FHH model.
Fractalfract 09 00467 g008
Figure 9. Fitting results of high-pressure mercury intrusion experimental data for Upper Paleozoic coal-bearing shale samples from Yangquan Block, Qinshui Basin. (a) Fractal dimensions of YQ-01-12 Shale based on high-pressure mercury intrusion, (b) Fractal dimensions of YQ-01-22 Shale based on high-pressure mercury intrusion, (c) Fractal dimensions of YQ-01-26 Shale based on high-pressure mercury intrusion, (d) Fractal dimensions of YQ-01-43 Shale based on high-pressure mercury intrusion, (e) Fractal dimensions of YQ-01-48 Shale based on high-pressure mercury intrusion, (f) Fractal dimensions of YQ-02-02 Shale based on high-pressure mercury intrusion, (g) Fractal dimensions of YQ-02-07 Shale based on high-pressure mercury intrusion, (h) Fractal dimensions of YQ-02-11 Shale based on high-pressure mercury intrusion, (i) Fractal dimensions of YQ-04-04 Shale based on high-pressure mercury intrusion, (j) Fractal dimensions of YQ-04-08 Shale based on high-pressure mercury intrusion, (k) Fractal dimensions of YQ-04-15 Shale based on high-pressure mercury intrusion, (l) Fractal dimensions of YQ-04-19 Shale based on high-pressure mercury intrusion.
Fractalfract 09 00467 g009
Figure 10. Relationships between fractal dimensions of pores and organic matter characteristics (TOC, Ro) in Upper Paleozoic coal-bearing shale samples from Yangquan Block, Qinshui Basin. (a) Relationship between TOC and fractal dimension, (b) Relationship between Ro (vitrinite reflectance) and fractal dimension, (c) Relationship between Tmax and fractal dimension, (d) Relationship between S1 + S2 (hydrocarbon generation potential) and fractal dimension.
Fractalfract 09 00467 g010
Figure 11. Relationships between fractal dimensions of pores and mineral composition (quartz and clay) in Upper Paleozoic coal-bearing shale samples from Yangquan Block, Qinshui Basin. (a) Relationship between quartz content and fractal dimension, (b) Relationship between clay mineral content and fractal dimension.
Fractalfract 09 00467 g011
Figure 12. Relationships between fractal dimensions of pores, pore volume, and specific surface area in Upper Paleozoic coal-bearing shale samples from Yangquan Block, Qinshui Basin. (a) Relationship between total pore volume and fractal dimension, (b) Relationship between total specific surface area and fractal dimension.
Fractalfract 09 00467 g012
Table 1. Basic physical properties of Upper Paleozoic coal-bearing shale samples from Yangquan Block, Qinshui Basin (relative error ≤ 2%).
SampleDepth (m)FormationLithologyTOC (%)Ro (%)Tmax (°C)S1 + S2 (mg/g)
YQ-01-12308.2Shanxi Grayish black mudstone3.292.165500.42
YQ-01-22350.7Shanxi Black mudstone4.632.135450.12
YQ-01-26379.6TaiyuanGrayish black mudstone5.112.245490.48
YQ-01-43461.4TaiyuanBlack mudstone2.47-5580.07
YQ-01-48477.3TaiyuanBlack mudstone1.75-5460.18
YQ-02-02383.7Shanxi Black mudstone1.972.225430.22
YQ-02-07409.6TaiyuanBlack mudstone2.672.295640.21
YQ-02-11466.5TaiyuanBlack mudstone3.632.565410.16
YQ-04-04452.6Shanxi Carbonaceous mudstone14.732.285513.49
YQ-04-08485.5TaiyuanBlack mudstone2.11-5540.29
YQ-04-15517.3TaiyuanCarbonaceous mudstone2.482.45640.56
YQ-04-19557.2TaiyuanBlack silty mudstone0.98-5740.19
Table 2. The mineral composition of Upper Paleozoic coal-bearing shale samples from the Yangquan Block, Qinshui Basin.
SampleMineral Composition (%)
QuartzPotassium FeldsparPlagioclaseCalciteDolomiteSideritePyriteAnkeriteClay Minerals
YQ-01-1226.2000002.4071.4
YQ-01-2220.901.3002.90074.9
YQ-01-263101.3001.10066.6
YQ-01-432.2000000097.8
YQ-01-4841.812.10081.3045.8
YQ-02-0238.600005.33.2052.9
YQ-02-0726.601.40001.1070.9
YQ-02-1131.501.30001.5065.7
YQ-04-0433.53.901.4000061.2
YQ-04-0860.0 03.61.3006.3028.8
YQ-04-1550.1001.7001.9046.3
YQ-04-1936.42.401.0 191.61.813.923.9
Table 3. Full-scale pore distribution characteristics of Upper Paleozoic coal-bearing shale samples from the Yangquan Block, Qinshui Basin.
SamplePore Volume/(cm3/g)Specific Surface Area/(m2/g)
MicroporesMesoporesMacroporesTotal Pore VolumeMicroporesMesoporesMacroporesTotal Specific Surface Area
YQ-01-120.0024 0.0152 0.0322 0.0498 8.261 6.800 1.773 16.834
YQ-01-220.0025 0.0127 0.0220 0.0371 8.417 4.943 1.102 14.462
YQ-01-260.0030 0.0213 0.0196 0.0439 10.259 9.728 1.719 21.706
YQ-01-430.0021 0.0195 0.0333 0.0548 6.955 9.729 0.764 17.448
YQ-01-480.0015 0.0102 0.0573 0.0690 4.950 4.598 0.053 9.601
YQ-02-020.0017 0.0208 0.0291 0.0516 5.792 9.241 2.672 17.705
YQ-02-070.0023 0.0195 0.0660 0.0879 7.948 9.227 1.260 18.435
YQ-02-110.0034 0.0212 0.0390 0.0636 11.578 10.026 0.854 22.458
YQ-04-040.0072 0.0305 0.0111 0.0488 24.060 14.978 1.943 40.981
YQ-04-080.0021 0.0195 0.0040 0.0255 7.082 9.175 0.967 17.224
YQ-04-150.0025 0.0326 0.7820 0.8171 8.402 15.225 0.002 23.629
YQ-04-190.0013 0.0162 0.0219 0.0395 4.535 7.413 0.691 12.639
Table 4. Fractal dimensions of pores in Upper Paleozoic coal-bearing shale samples from Yangquan Block, Qinshui Basin.
SampleD1R2D2R2D3R2D4R2D5R2
YQ-01-122.61410.99962.65700.99872.96820.98142.98910.95562.96290.8977
YQ-01-222.65120.99652.63710.99782.96120.94772.98970.92632.99010.9655
YQ-01-262.61630.99952.65830.99832.98520.98882.99560.97482.98850.9408
YQ-01-432.61540.99912.68520.99672.97070.96382.9940.96572.99320.9754
YQ-01-482.65690.99802.69340.99892.98340.98022.99440.95562.98160.9024
YQ-02-022.61980.99982.65580.99832.97600.98802.98910.95432.97740.9659
YQ-02-072.61230.99872.69380.99892.89550.69792.99280.99162.98970.9600
YQ-02-112.63650.99082.70540.99822.94650.81042.99230.97062.99420.9962
YQ-04-042.61270.99432.69240.99892.98120.79152.99580.96282.99350.9260
YQ-04-082.64980.99892.68580.99892.97770.97012.99610.78842.99260.9481
YQ-04-152.61860.99982.65110.99792.95080.99272.98930.75042.98050.9650
YQ-04-192.64160.99922.68380.99882.85550.91712.98060.65032.99280.9688
Disclaimer/Publisher’s Note: The statements, opinions and data contained in all publications are solely those of the individual author(s) and contributor(s) and not of MDPI and/or the editor(s). MDPI and/or the editor(s) disclaim responsibility for any injury to people or property resulting from any ideas, methods, instructions or products referred to in the content.

