1. Introduction
Tight sandstone reservoirs constitute a crucial component of unconventional energy resources and represent a key area of research within China’s petroleum sector. These reservoirs are characterized by narrow pore–throats and strong heterogeneity, with pore structure and connectivity playing pivotal roles in their development potential. Understanding and quantifying the effects of reservoir space types and heterogeneity on storage capacity and connectivity are essential for identifying favorable development zones for tight sandstone reservoirs [
1,
2,
3,
4]. To address these challenges, fractal theory—an effective tool for analyzing complex and irregular pore structures—can be combined with pore–throat testing to comprehensively investigate the pore–throat structure and heterogeneity of tight sandstone reservoirs [
5]. In recent years, fractal theory has been widely applied to characterize the complex pore structures present in porous media. The fractal dimension serves as a quantitative descriptor that links microscopic pore morphology with macroscopic physical forms. Numerous studies have successfully employed fractal methods to analyze sandstone pore structures; generally, increased pore heterogeneity results in a larger fractal dimension, whereas more regular pores correspond to a smaller fractal dimension [
6,
7,
8,
9,
10].
Various methods have been developed to study the pore–throat structures of tight sandstone reservoirs. Image-based analysis methods, such as those involving pore-casted thin sections and scanning electron microscopy (SEM), provide clear and intuitive observations of pore–throat size and morphology [
11,
12,
13,
14,
15,
16]. However, due to limited sampling ranges, image-based analysis methods cannot comprehensively reflect the pore–throat distribution characteristics across entire rock samples and have limited capability for quantitative pore–throat size and distribution analysis. The advent of fractal theory addresses these limitations. Fractal dimensions, which describe the complexity of self-similar irregular shapes, have been widely applied across disciplines since their introduction in 1975 [
17]. Katz and Thompson demonstrated that the pore spaces of porous media exhibit fractal characteristics. Recently, petroleum geologists have employed various experimental methods, such as nitrogen adsorption, mercury intrusion porosimetry, and nuclear magnetic resonance (NMR), to determine fractal dimensions, characterizing the complexity of pore structures. Liu et al. discussed the significance of fractal dimensions in reservoir evaluation, pointing out that rougher and more heterogeneous porous media surfaces have larger fractal dimensions. Xia et al., based on results from pore-casted thin sections and mercury intrusion porosimetry, determined that reservoir pore structures exhibit fractal characteristics at certain scales, with derived fractal dimensions showing good correlations with pore–throat structural parameters [
18,
19]. Zhang et al. used NMR data to show that effective storage and fluid-movable spaces in ultra-low-permeability reservoirs exhibit fractal properties, with fractal dimensions effectively representing pore–throat connectivity. Mahdaviara et al. predicted pore flow capabilities using Gaussian process regression algorithms. Jiang et al. utilized NMR and exponential functions to quantitatively analyze the microscopic distribution of movable fluids. Liu et al. applied neural networks to predict capillary pressure and relative permeability curves in porous media. Li et al. established a permeability model based on fractal dimensions and mercury intrusion curves [
20,
21,
22,
23]. Combining mathematical tools with traditional methods provides new dimensions for characterizing pore structure features. Previous research has focused on correlations between fractal dimensions and microscopic pore–throat structural parameters but lacked classifications for self-similar pore–throat systems and investigations into the impact of multi-scale pore–throat systems on reservoir quality. Additionally, although multiple testing methods can jointly characterize reservoir pore–throat features, the relationships between fractal dimensions obtained through different analysis methods have rarely been addressed in prior studies. Katz and Thompson observed via SEM that microporous structures of sandstones adhere to fractal scaling laws across five orders of magnitude, from 1 nm to 100 μm. Cui et al. proposed a unified fractal dimension model for fully self-similar and statistically self-similar fractal porous media. Zhang et al. were the first to apply fractal theory to analyze the fractal characteristics of digital rock cores in porous media. Numerous studies have applied fractal theory to investigate sandstone pore structures. Liang et al. highlighted the significance of fractal characteristics in studying the seepage properties of tight sandstone reservoirs [
24,
25,
26]. Li et al. identified a positive correlation between fractal dimensions and matrix porosity. Han et al. used fractal theory to analyze 3D-printed sandstones. Wu et al. characterized the pore structures of carbonate caprock samples from the Tahe Oilfield using SEM. Xie et al. evaluated the permeability of 12 digital rock cores of sandstone reservoirs based on fractal dimensions and adsorption capacity. Liu et al. combined CT imaging, binary CT methods, and fractal theory to compare the fractal dimensions and porosity of samples with predictions from Yu and Li’s unified model, establishing fractal criteria for pores [
27,
28,
29,
30,
31,
32].
Previous studies on tight sandstone pore structures have obtained parameters such as pore radii, pore-size distributions, and sorting coefficients. However, the effects of pore geometry on fluid flow and connectivity remain uncertain, and traditional geometric methods struggle to effectively characterize pore structures. Fractal theory has been widely used to describe complex pore structures in porous media. The fractal dimension quantifies fractal characteristics and bridges microscopic pore geometry with macroscopic physical shapes, serving as an important indicator of pore structure. Tight sandstones are characterized by narrow pore–throats and strong heterogeneity, which significantly influence reservoir development characteristics. Understanding the complex and irregular pore structures in these rocks is essential for evaluating their storage and flow potential. Traditional experimental methods have provided parameters such as pore radius, pore–throat quantity, and sorting coefficients, which reflect pore structure characteristics [
33,
34,
35,
36]. However, these approaches often treat pores as having a single morphology, overlooking their spatial variability and diverse forms. Additionally, the contributions of different pore types to reservoir properties remain largely unquantified. Addressing these limitations requires the integration of experimental techniques with theoretical methods to gain deeper insights into the microscopic pore structures of tight sandstones [
37,
38,
39,
40,
41,
42]. Fractal theory, a nonlinear mathematical framework, provides a robust tool for describing the irregular and complex systems found in rocks. The fractal dimension, a quantitative descriptor of fractal characteristics, effectively captures the irregularity, heterogeneity, and complexity of pore structures. By combining fractal theory with pore–throat testing, researchers can analyze the heterogeneity and diverse morphologies of tight sandstone pores, enabling the identification and evaluation of different pore types and their contributions to reservoir properties [
43,
44,
45]. Constant-rate mercury intrusion experiments yield the intrusion pressure and total saturation for pore–throat systems in tight sandstone reservoirs, allowing pore and throats to be distinguished. By fitting straight lines, we can obtain the fractal dimensions of pores and throats. We then apply the fractal theory to calculate the fractal dimensions of NMR T
2 spectra, clarifying differences in pore–throat structural complexity among samples. Using constant-rate mercury intrusion and NMR, we characterize effective pore–throat distributions and, on that basis, apply fractal geometry theory to define pore–throat fractal features and establish relationships between fractal pore structure, flow characteristics, and structural parameters, thereby providing a geological basis for exploration and development of tight reservoirs.
The objective of this work is to quantitatively assess the full-scale fractal characteristics of the pore–throat system in the tight sandstones of the Wuqi Area in the Ordos Basin, China, by integrating pore-casted thin sections, SEM and constant-rate mercury intrusion with fractal theory, and to evaluate how hierarchical pore–throat levels control reservoir porosity, permeability, and fluid mobility. The study investigates the size and morphology of pores and throats in sandstones using pore-casted thin sections, SEM, and constant-rate mercury intrusion. Mercury intrusion curves obtained through constant-rate testing are used to assess the fractal characteristics of the pores and throats. The NMR-derived T
2 spectra can quantify relationships between pore–throat parameters and fractal dimensions. Fractal theory is then applied to classify pore–throat systems into hierarchical levels based on relative size, enabling an evaluation of how different pore–throat levels influence fluid mobility and flow capacity in the reservoir space [
46,
47,
48,
49,
50]. The analysis identifies two types of pore–throats—small scale and large scale—based on turning points in the fractal curves. Fractal dimensions for both types are calculated, and differences in fractal dimensions across scales, along with their formation mechanisms, are examined. These findings provide valuable support for optimizing reservoir evaluation parameters and predicting favorable zones in tight reservoirs. Additionally, the results offer significant insights into the microscopic pore–throat structures and heterogeneity of tight sandstones [
51,
52,
53].
2. Geological Setting and Experimental Methods
2.1. Geological Setting
The Ordos Basin, located within a cratonic basin, covers an area of approximately 370,000 km
2. Tectonically, it is asymmetrically aligned along a north–south axis, featuring a steep and narrow western flank and a broader, gentler eastern flank. The periphery of the basin is delineated by faulting and folding, while its interior exhibits relatively simple tectonic configurations with strata typically inclined at less than 1°. The basin is compartmentalized into six major tectonic units: the Weibei Uplift, Yimeng Uplift, Shanbei Slope, Jinxi Flexure Belt, Tianhuan Depression, and Western Margin Thrust Belt [
54,
55,
56].
The Ansai Oilfield is situated in the mid-eastern region of the Yishan Slope within the Ordos Basin. This area is characterized by minimal tectonic activity, with gently dipping strata at an average angle of approximately 0.5°, and a gradient of 8–10 m/km. Located in Yan’an City, Shaanxi Province, the oilfield spans Ansai County, Zhidan County, Zichang County, and Baota District. Its boundaries extend from Lijiacha in Zichang to Yongning-Huaishuzhuang in Yan’an to the south, Lijiacha-Haojiaping-Hezhuangping to the east, and Shuanghe-Yongning to the west. Covering a total area of 6323 km2, the region’s elevation ranges from 1100 to 1500 m, with a relative elevation difference of 150–250 m. The surface is blanketed by Quaternary loess deposits, varying in thickness from 100 to 200 m.
2.2. Sample Preparation and Analytical Techniques
Core samples of tight sandstones for this study were sourced from the sixth member of the Triassic Yanchang Formation (hereinafter referred to as Chang-6 Member) within the Wuqi-Ansai Area of the Ordos Basin. Eight cylindrical samples, each with a diameter of 2.5 cm, were extracted parallel to the bedding planes of the formation. After oil extraction and drying processes, porosity and permeability metrics were quantified. A comprehensive suite of analytical techniques was employed to assess the samples, including the preparation of pore-casted thin sections, SEM, high-pressure mercury intrusion, constant-rate mercury intrusion, and NMR testing. These techniques were utilized to explore the pore micro-morphology and fractal characteristics of the tight sandstone. More detailed core sample parameters are listed in
Table 1.
2.3. Experimental Principles and Sample Preparation
2.3.1. Pore-Casted Thin Sections
Core samples were impregnated with red epoxy resin to elucidate petrological characteristics and pore features. High-resolution micrographs of the rock were acquired using a Leica DLC-420 microscope imaging system, which enabled detailed analysis of the microscopic textural features within the samples.
2.3.2. Scanning Electron Microscopy (SEM)
To examine the microstructural details of the pore spaces, we employed the FEI Quanta 400 FEG field emission scanning electron microscope. The freshly fractured sample surfaces were sputter-coated with gold to enhance conductivity and enable detailed imaging. This setup allowed for mineral identification via secondary electron (SE) imaging, backscattered electron (BSE) imaging, and energy-dispersive X-ray spectroscopy (EDS). The operational settings included an acceleration voltage of 30 kV and a resolution of 1.2 nm.
2.3.3. High-Pressure Mercury Intrusion
High-pressure mercury intrusion was employed to measure the size and volume of pores in porous media. When mercury is injected into the porous sample, capillary pressure resists its entry into the pore spaces, requiring sufficient injection pressure to overcome this resistance. Each injection pressure corresponds to the capillary pressure of pores with a specific size. The volume of injected mercury represents the volume of connected pores. Testing was conducted using an Autopore 9420 mercury porosimeter, with a maximum injection pressure of 200 MPa. After reaching the maximum pressure, the displacement pressure was gradually reduced, causing mercury to withdraw from the pores. The intrusion and extrusion curves were generated based on the pressure and corresponding mercury saturation. Since pore size and connectivity influence capillary pressure, the capillary pressure curves provide valuable insights into the pore structure.
2.3.4. Constant-Rate Mercury Intrusion
The constant-rate mercury intrusion experiments were conducted using a Coretest Systems ASPE-730 mercury porosimeter. Samples were first vacuumed and immersed in mercury. Experiments were performed at room temperature with a constant mercury injection rate of 5 × 10⁻⁵ mL/min. Before testing, standard samples were analyzed to calibrate the instrument, ensuring accurate data. The contact angle and surface tension were maintained at constant values of 140° and 480 mN/m, respectively, throughout the process. Due to the pressure limitations of the instrument, the minimum detectable throat radius was 0.12 μm.
2.4. Application of Fractal Theory to Pore Throat Analysis
The fractal dimensions of the pore throats in tight sandstone were calculated from the data obtained through constant-rate mercury intrusion. According to fractal theory, if the pore throat distribution in tight sandstone adheres to a fractal structure, it can be represented as:
where
r denotes the radius of a pore throat (in micrometers),
D is the fractal dimension, and
N(
r) is the number of pore throats with a radius exceeding
r.
Integrating the capillary model, the number of throats, N(r), is formulated as:
where
l represents the length of the capillaries (in micrometers), and
VHg is the cumulative volume of mercury intruded at a specific capillary pressure (in cubic micrometers). The relationship between capillary pressure
Pc and the radius is defined by:
where
is the surface tension (dyne/cm), and
is the contact angle (degrees). From this, a dependency is derived:
Plotting the capillary force (
Pc) and mercury saturation (
VHg) on a logarithmic scale yields a linear relationship, establishing that the slope (
S) of the line correlates with the fractal dimension (
D) through:
2.5. NMR and Fractal Theory
NMR experiments on water-saturated tight sandstone samples provide the spectra of the transverse relaxation time (T2), offering insights into the interactions between pore fluids and particle surfaces. Post-centrifugation NMR tests yield parameters related to bound water, enabling the determination of movable fluid saturation and full-scale pore-throat distribution in different samples. Larger T2 values indicate larger pore–throat sizes. The NMR measurements were conducted using a RecCore2500 NMR core analyzer. Samples were dried in an oven for at least 8 h, after which their diameter, length, and weight were measured. They were then vacuumed for 12 h, saturated with formation water for another 12 h, and weighed. The sample surfaces were wiped to remove excess water, wrapped in plastic film, and analyzed with the NMR analyzer to obtain the T2 distribution for the water-saturated state. Subsequently, the samples were centrifuged at 9100 r/min, weighed again, and reanalyzed with NMR to obtain the T2 distribution for the bound water state.
Numerous studies have demonstrated that the microscopic pore structure of sandstones exhibits pronounced fractal characteristics, with the fractal dimension quantitatively representing the complexity of the pore structure. A higher fractal dimension indicates a more intricate and heterogeneous pore structure.
The complexity of pore–throat structures in different samples can be inferred from fractal analysis of the NMR T
2 spectra, with greater structural complexity corresponding to larger fractal dimensions. The calculation of NMR fractal dimensions is primarily based on the formula. In a uniform magnetic field, T
2 can be approximated as:
where
is the surface relaxivity;
T2s is the surface relaxation time, m/ms;
S is the surface area, m
2; and
V is the volume, m
3. For an ideal spherical pore model,
S/
V = 3/r, and for a cylindrical bundle model,
S/
V = 2/r. From this, we derive:
According to the fractal theory, the number of pores with radii greater than
r is related to the pore–throat radius as follows:
Here,
N(>
r) represents the number of pore throats larger than radius
r,
D is the fractal dimension,
rmax is the maximum pore–throat radius, μm, and
S(
r) is the distribution density function of the pore–throat radius. The cumulative fraction of pore volume for pores smaller than
r is:
Considering rmin rmax, Sv simplifies to:
Combining Equations (7) and (10), we get:
Taking logarithms on both sides:
If the data exhibit fractal characteristics, Equation (6) will show a linear relationship. By calculating the slope λ, the fractal dimension can be determined:
In general, NMR offers certain advantages over high-pressure mercury intrusion and constant-rate mercury intrusion techniques, particularly in characterizing the full range of pore–throat size distributions. Moreover, centrifuge experiments facilitated by NMR can differentiate between movable and bound fluids within the pore structure. Due to the maturity and widespread application of fractal theory in evaluating the irregularity and self-similarity of porous media, incorporating fractal theory based on NMR experimental data allows for a more accurate and comprehensive characterization of the complexity of pore–throat structures.
3. Results
3.1. Petrological Characteristics
Pore-casted thin sections, SEM, and X-ray diffraction analyses of clay minerals indicate that the Chang-6 reservoir rocks in the Wuqi-Ansai Area predominantly consist of fine to medium-grained, light grey, grey, and greyish-brown feldspathic sandstones. Additional compositions include minor medium-grained feldspathic sandstones and fine-grained lithic feldspathic sandstone fragments. The grain size primarily ranges from 0.1 to 0.25 mm, with a peak at 0.75 mm. Feldspar, quartz, and lithic fragments represent average mass fractions of 52.08%, 20.78%, and 10.34%, respectively. The reservoir has experienced multiple diagenetic processes such as compaction, pressure solution, cementation, alteration, dissolution, and fracturing, which significantly influence the porosity and other petrophysical properties. Dissolution mainly affects detrital minerals, matrix, and both cementing and authigenic minerals, with feldspar and quartz showing common yet relatively minor dissolution effects.
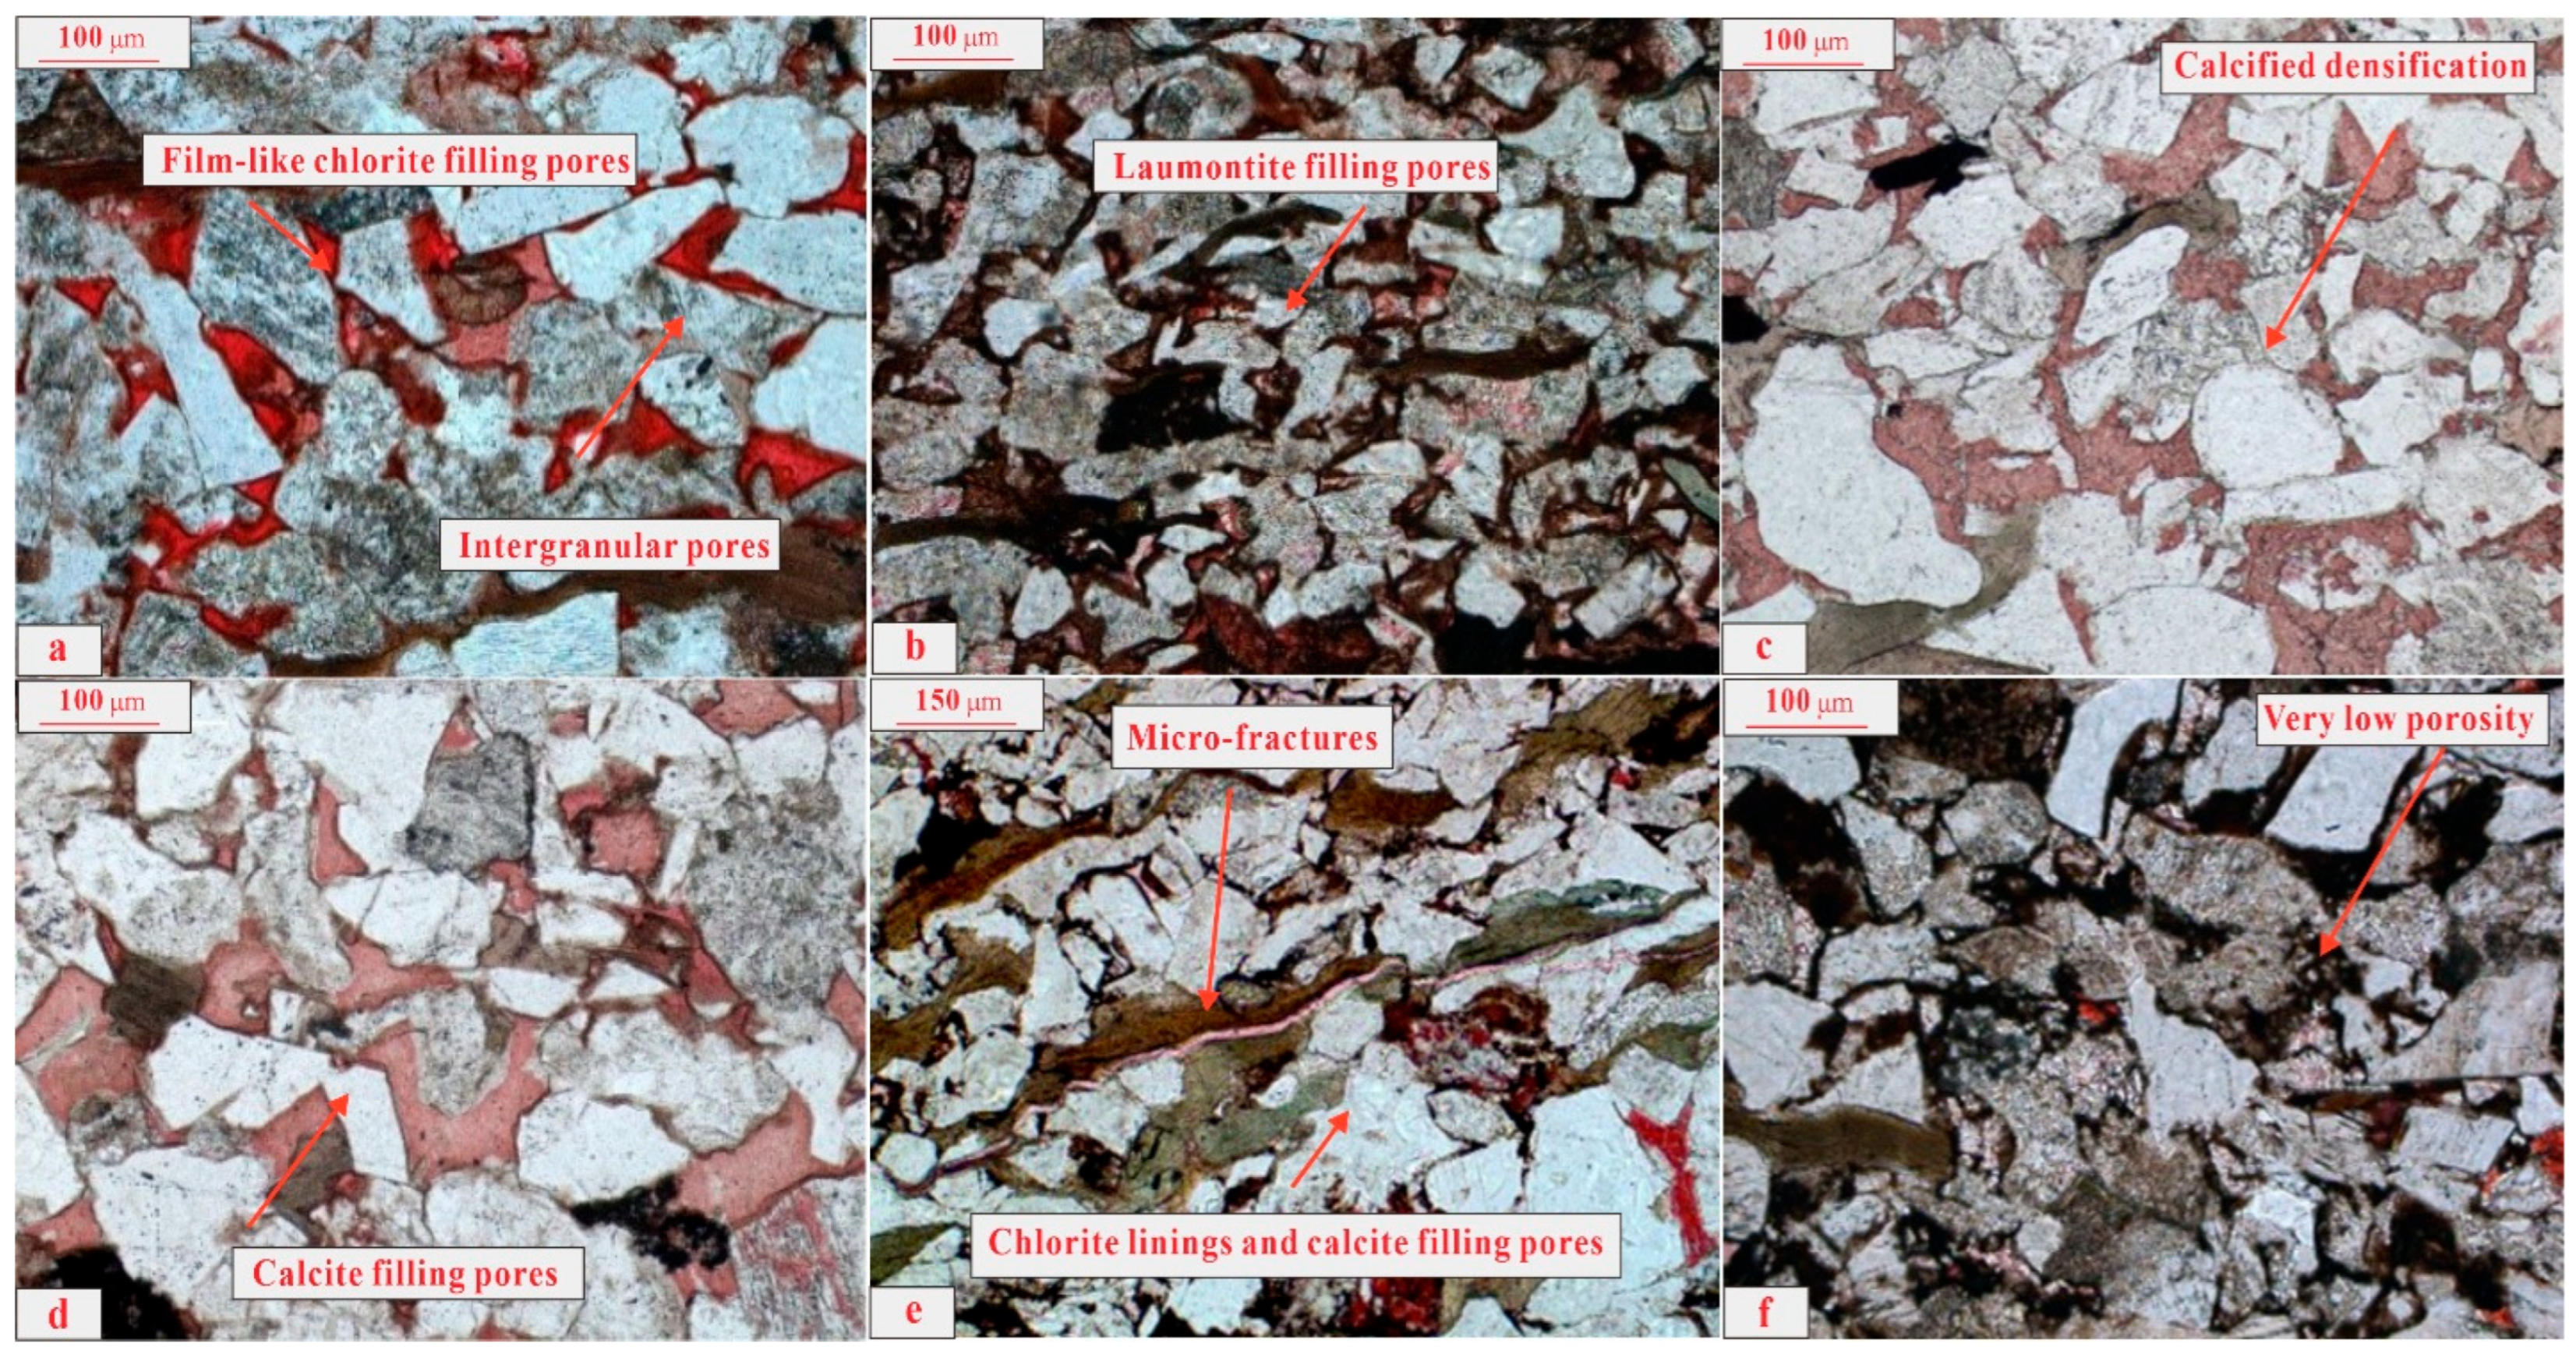
The primary pore types observed include residual intergranular pores, dissolution pores, and intercrystalline pores. Residual intergranular pores, originally intergranular, are modified by compaction and cementation, often exhibiting straight edges and regular shapes like triangles. In the study area, pronounced compaction and extensive cementation significantly diminish intergranular porosity, thereby reducing the prevalence of residual intergranular pores. However, some well-preserved original intergranular pores remain alongside a significant amount of secondary dissolution pores within secondary cement materials, especially laumontite. The predominant pore types are residual intergranular pores, supplemented by minor laumontite and carbonate dissolution pores. Secondary dissolution of laumontite is notable, often creating irregular edges and forming intragranular pores. In some cases, complete dissolution of laumontite results in moldic pores. Laumontite is not abundant, and the diagenetic processes are marked by early–mid-stage compaction, pressure solution, and cementation. Diagenetic minerals primarily include filmy chlorite and enlarged quartz, supplemented by siliceous and carbonate fillings. The clay mineral assemblage is dominated by chlorite, with illite occurring in lesser amounts; clay minerals predominantly occur as pore fillings. Illite and illite/montmorillonite mixed layers occur in curved, filamentous forms between the grains. On the one hand, this occurrence further reduces residual primary intergranular pores and secondary dissolution pores; on the other hand, the net-like, bridging distribution of these clay minerals subdivides many pores and throats into fine, bound pores, thereby reducing pore–throat sizes and lowering reservoir permeability (
Figure 1).
In tight sandstones, the presence of illite, chlorite, and other clay minerals leads to the development of intercrystalline pores, which are generally small and sparse. The primary throat types are constricted and curved lamellar throats, influenced by compaction and cementation. Constricted throats, formed by the aggregation of multiple detrital particles, have smaller radii compared to curved lamellar throats, which form narrow channels between particles and generally possess larger radii. Small pores in this environment primarily include residual intergranular pores due to compaction and intercrystalline pores within authigenic clay minerals, while large pores are mainly dissolution and composite pores. Laumontite within the reservoir manifests in three forms: as cementing and matrix components, and as pseudomorphs replacing plagioclase. The cementing and matrix forms of laumontite are typically irregular, colorless, and transparent in thin sections and exhibit two cleavage sets. While laumontite predominantly obstructs porosity by filling pores, it can also support the structural framework, mitigating excessive compaction and promoting the development of secondary dissolution pores (
Figure 2).
3.2. Pore- and Throat-Distribution Characteristics
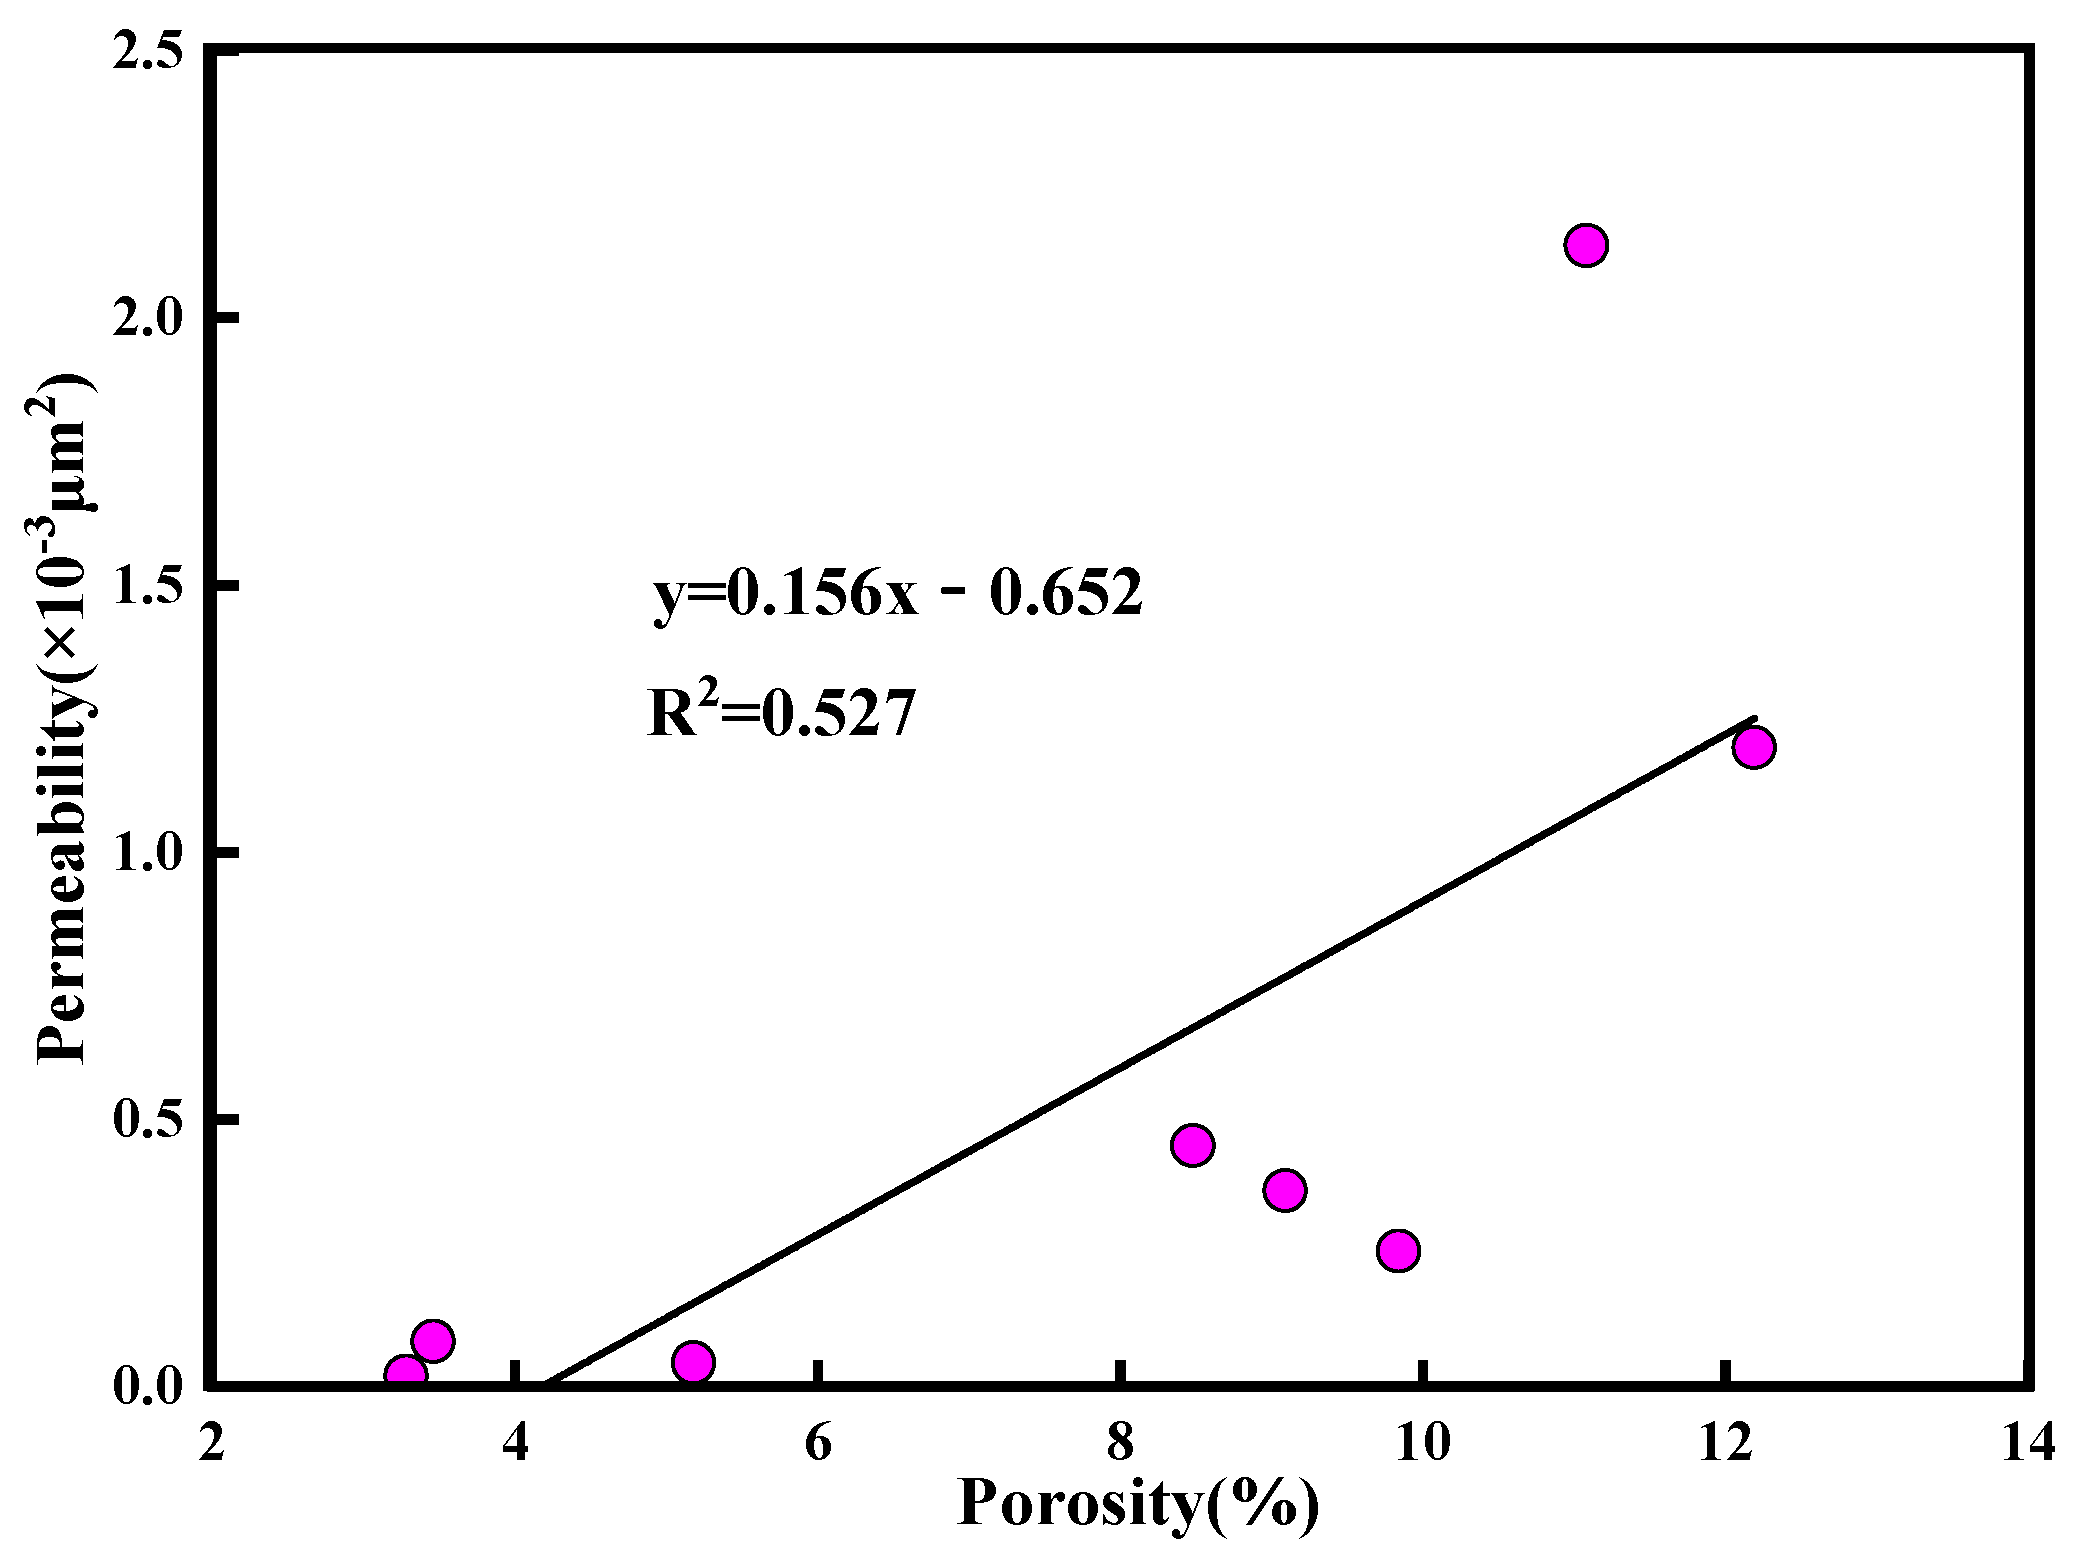
Porosity in the samples varies from 3.28% to 12.19%, averaging 7.83%, while permeability ranges from 0.02 to 2.135 × 10
−3 μm
2, with an average of 0.57 × 10
−3 μm
2. These values are characteristic of typical tight sandstone. The correlation between porosity and permeability is moderate, with a correlation coefficient (R
2) of 0.527 (
Figure 3), suggesting that different pore radii have varying impacts on permeability. This indicates that the fluid flow within the samples may be primarily facilitated by either micro-fractures or highly interconnected pores.
High-pressure mercury intrusion has proven effective for analyzing the pore-size distribution in tight sandstone, translating mercury intrusion curves into a distribution of pore–throat radii that typically range from 3.6 to 600 nm. The distribution shows significant heterogeneity, highlighting the complex pore structure of the tight sandstone matrix (
Figure 4).
High-pressure mercury intrusion tests on tight sandstone core samples reveal distinct variations in pore–throat characteristics across different sample types. Type I core samples have a displacement pressure of 0.188 MPa, a median pressure of 9.33 MPa, and a median radius of 0.08 μm. Their sorting coefficient is 2.62, with a coefficient variation of 0.22. The maximum mercury intrusion saturation is 71.57%, and the mercury extrusion efficiency is 24.2%. Type II core samples show intermediate properties, with a displacement pressure of 0.321 MPa, a median pressure of 3.524 MPa, and a median radius of 0.254 μm. They exhibit a sorting coefficient of 2.353 and a coefficient of variation of 0.207, achieving a maximum mercury intrusion saturation of 82.85% and a mercury extrusion efficiency of 30.52%. These results indicate that although Type II samples have higher displacement pressures and smaller pore throat radii compared to Type I, their improved sorting and connectivity contribute to better intrusion and extrusion efficiencies. Type III core samples display a displacement pressure of 0.532 MPa, a median pressure of 3.473 MPa, and a median radius of 0.277 μm. Their sorting coefficient is 2.102, with a coefficient variation of 0.185. They achieve the highest maximum mercury intrusion saturation at 89.31%, but their mercury extrusion efficiency is slightly lower at 29.39%. This suggests that while Type III samples have larger pore–throat radii and lower displacement pressures, their extrusion efficiency is less favorable compared to Type II.
Comparative analysis reveals that Type I samples exhibit higher displacement pressures and smaller median and average throat radii, along with less effective throat sorting compared to Types II and III. The mercury intrusion capillary pressure curves for Type III samples display a distinct plateau, indicating a more concentrated and uniform distribution of pore throats. In contrast, Types I and II samples show shorter plateau segments, highlighting poorer sorting and greater variability in pore–throat distribution (
Figure 4).
The pore and throat radius distribution curves of tight sandstone in the Wuqi-Ansai Area display a unimodal pattern. Pore radii are primarily concentrated between 90 and 260 μm, with an average radius of 135.21 μm, indicating a relatively uniform distribution overall (
Figure 5a). In contrast, throat radii exhibit a broader range, predominantly spanning from 0.29 to 2.49 μm, with an average radius of 0.95 μm (
Figure 5b). While the pore radius distribution demonstrates weak heterogeneity, the throat radius distribution is significantly more heterogeneous.
3.3. Fractal Characteristics of Pore and Throat Structures
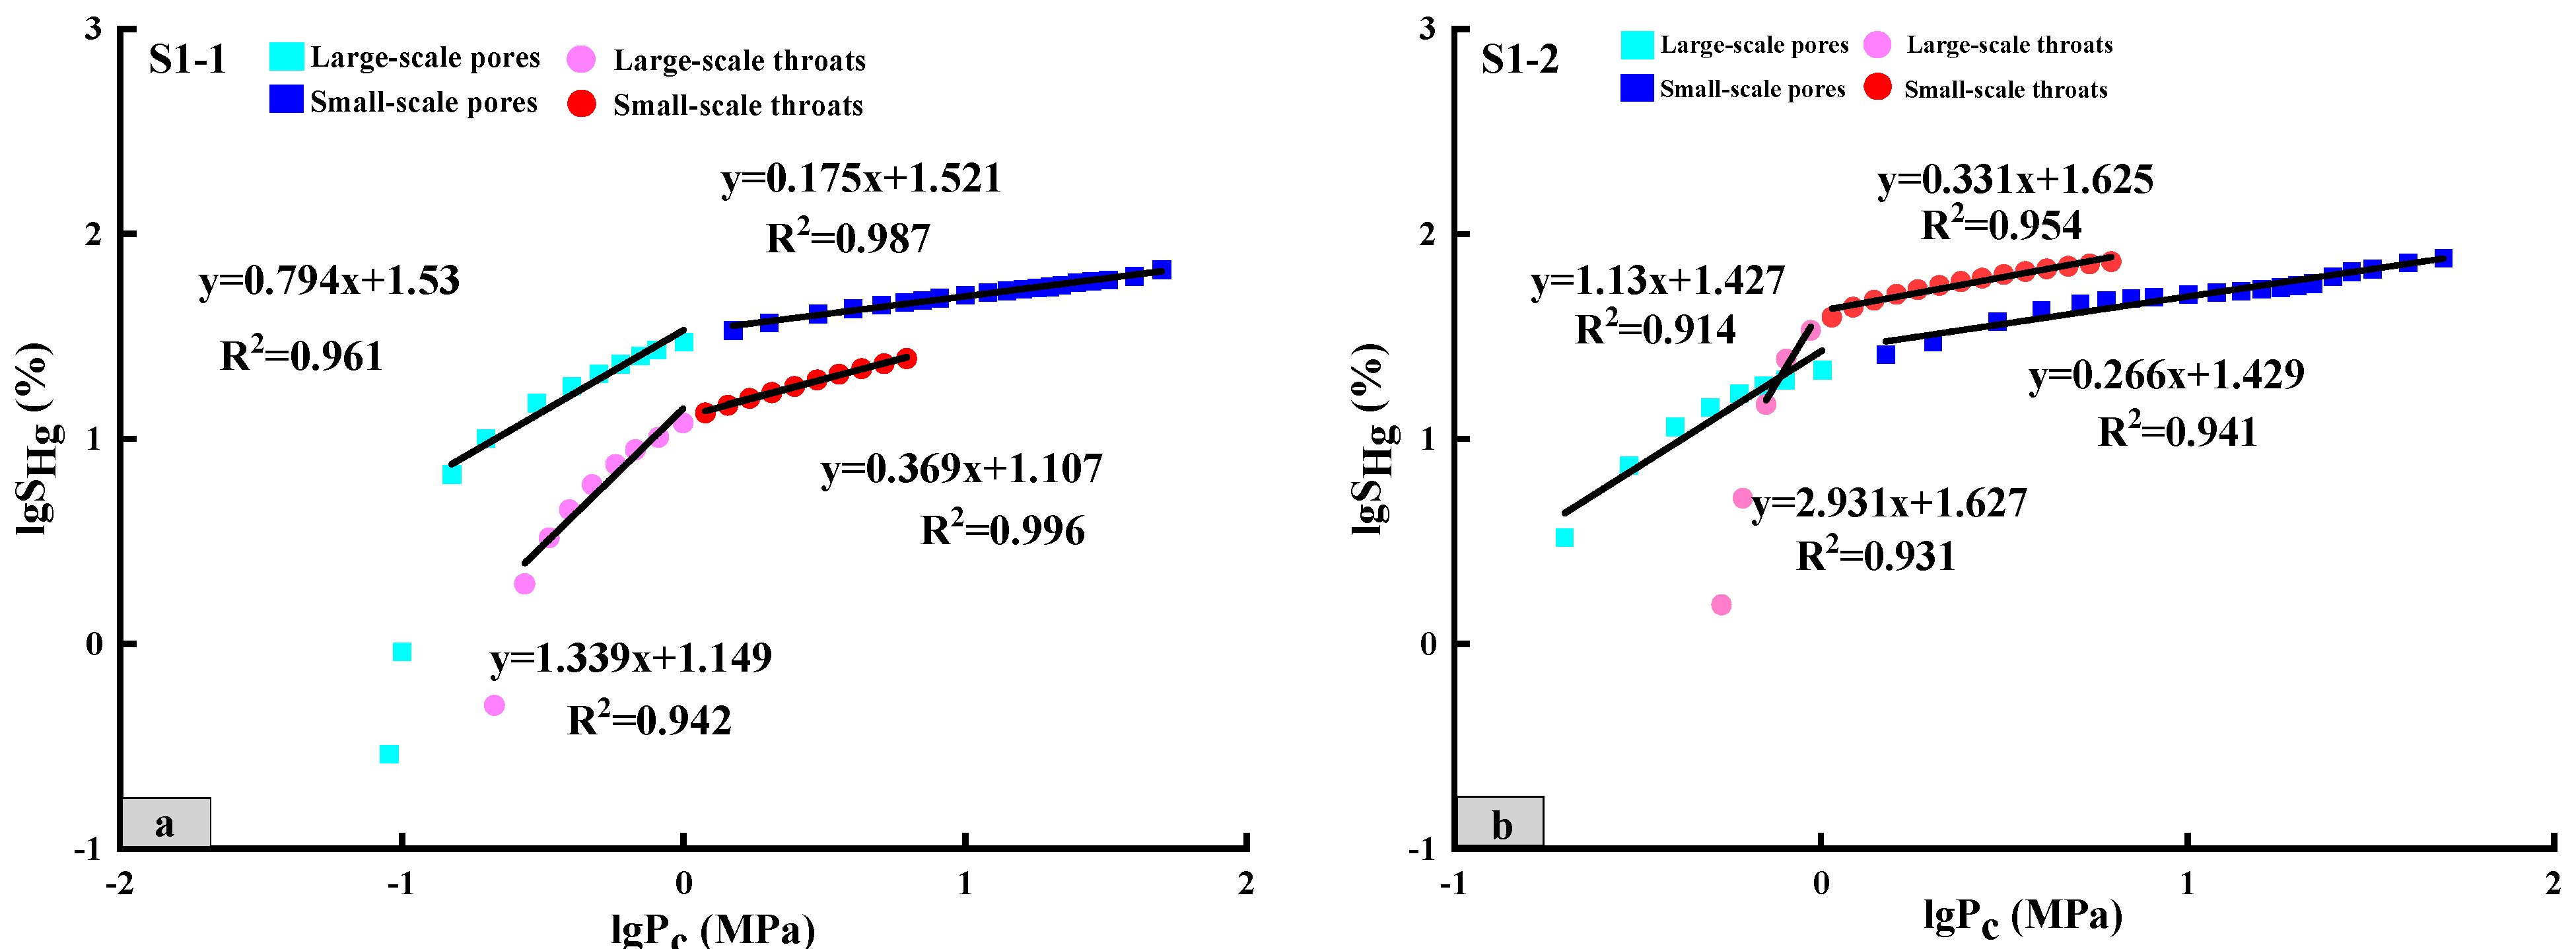
The fractal dimension effectively represents the heterogeneity of pores and throats, with larger values indicating greater spatial complexity and stronger heterogeneity. Fractal curves (lg
SHg − lg
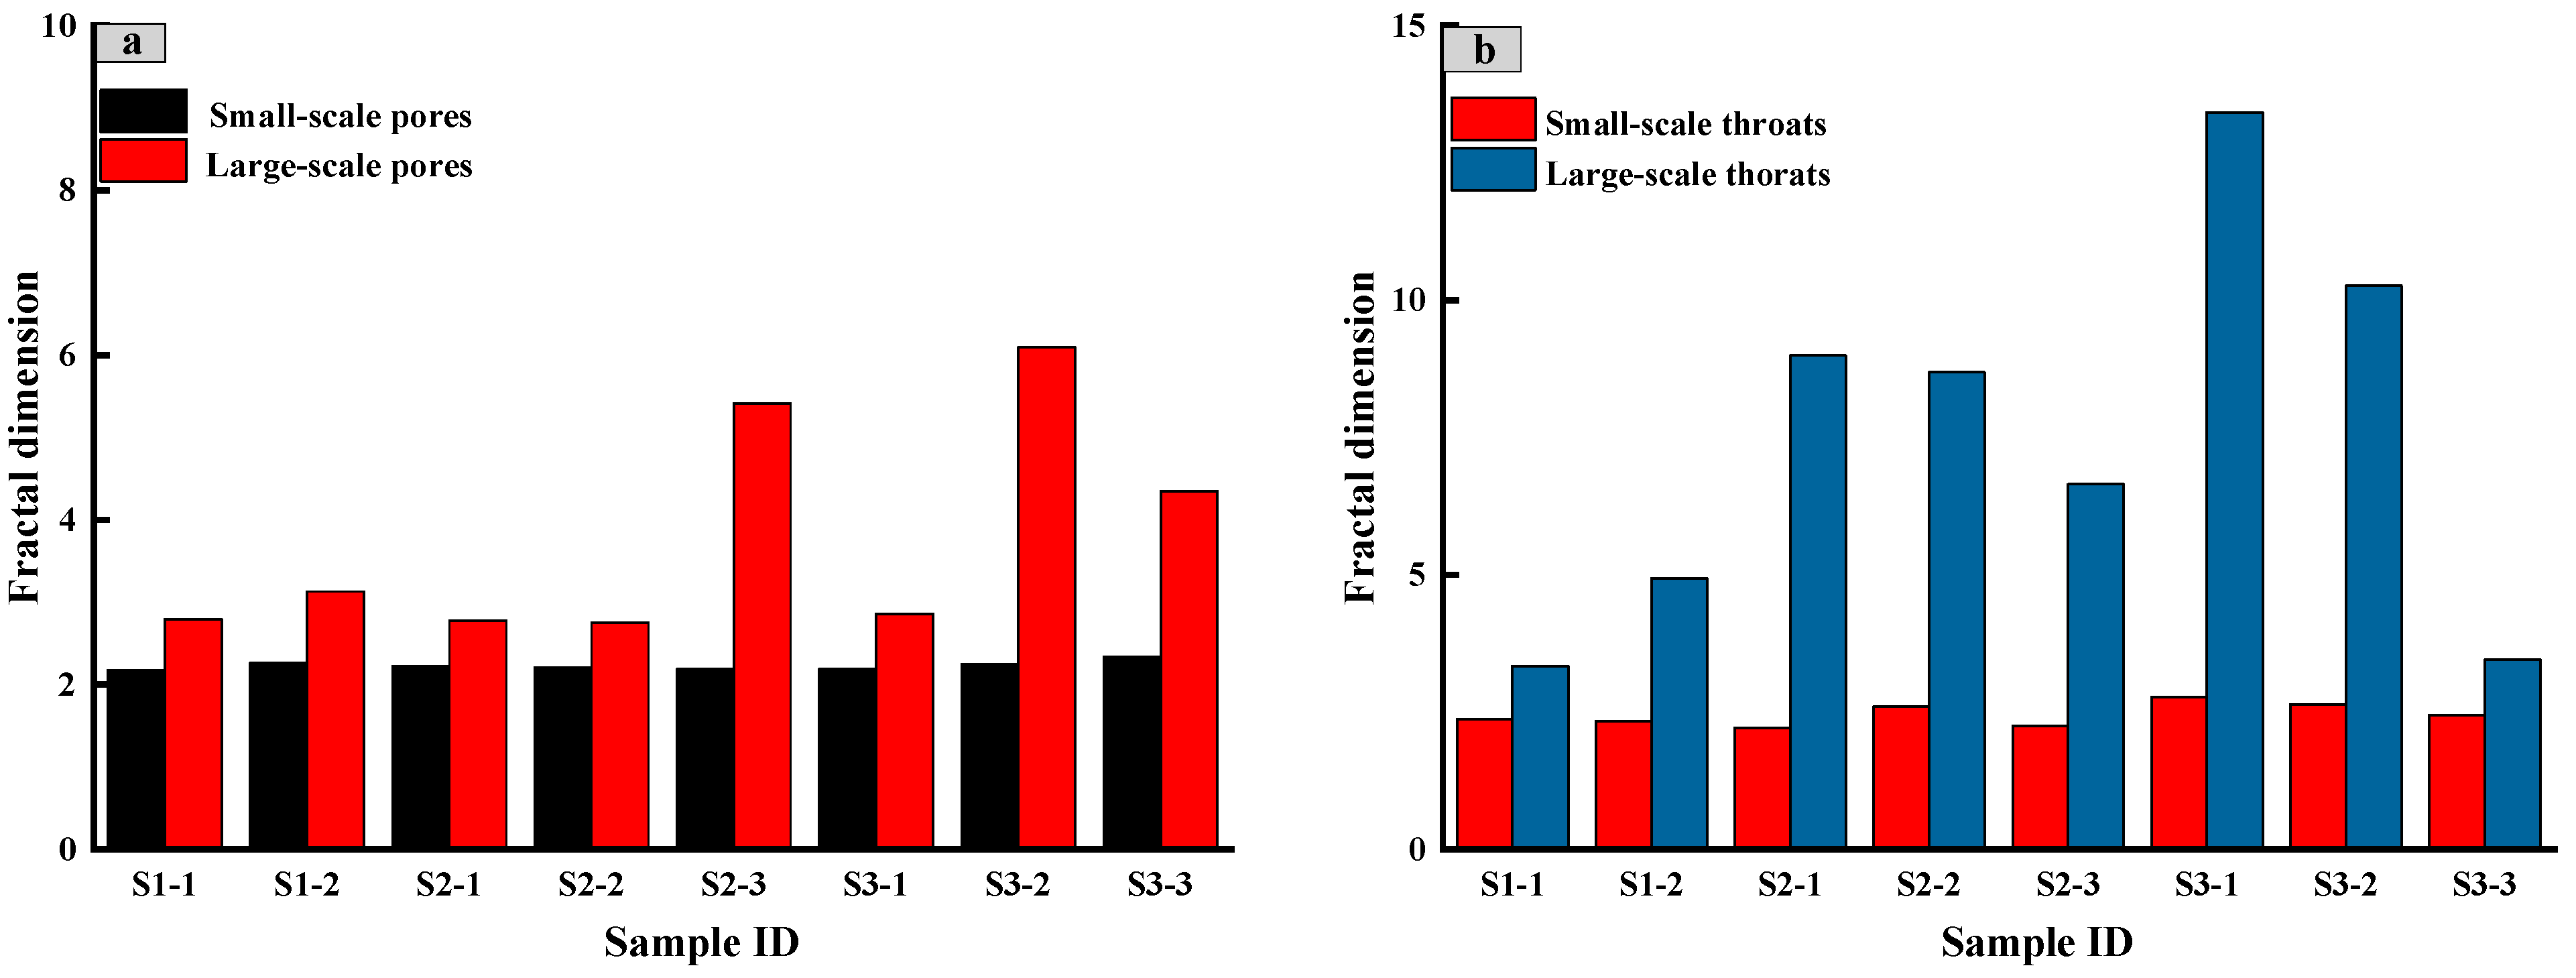
Pc) were derived from constant-rate mercury intrusion tests, and the slopes of their linear fits were used to quantify the fractal dimensions of pores and throats in the tested range. These fractal curves exhibit clear inflection points, marking a transition from large-scale pores and throats, characterized by stronger permeability, to small-scale ones with weaker permeability. The pronounced differences in curve slopes before and after the inflection points, coupled with strong linearity, indicate distinct variations in fractal dimensions across different scales. Mercury intrusion pressures below the inflection point correspond to large-scale pores and throats, while pressures above it represent small-scale structures. The fractal dimensions of small-scale pores range from 2.175 to 2.34, with an average of 2.23, whereas those of large-scale pores range from 2.752 to 6.094, averaging 3.77. Small-scale throats exhibit fractal dimensions between 2.214 and 2.771, with an average of 2.452, while large-scale throats range from 3.339 to 13.418, with an average of 7.467 (
Table 2). The fractal dimensions of large-scale pores and throats are significantly higher than those of small-scale ones, highlighting their greater heterogeneity and more complex structural characteristics (
Figure 6).
Thus, the fractal dimension is an important marker for pore structure characterization and serves as an essential bridge connecting microscopic pore features with macroscopic performance. Consequently, research on the pore structure and fractal characteristics of ultra-low permeability reservoirs—and their intrinsic relationships—holds significant implications for reservoir quality evaluation and enhanced oil recovery.
The fractal curves for pores and throats are generated by fitting scatter plots of lg
SHg − lg
Pc, derived from mercury intrusion curves. As a result, the shapes of the fractal curves closely resemble those of the original mercury intrusion curves (
Figure 7). A steeper slope in the mercury intrusion curve corresponds to a higher slope in the linear fit of the fractal curve, leading to a larger fractal dimension. This relationship reflects the influence of pore and throat storage capacity. Pores and throats with greater effective storage allow non-wetting mercury to penetrate more extensively under the same displacement pressure, resulting in higher mercury saturation. This enhanced saturation produces a steeper mercury intrusion curve and a larger fractal dimension, indicating greater complexity and heterogeneity in the pore–throat structure. Small-scale pores and throats, with lower storage capacity, display gentler slopes in their fractal curve fits, resulting in smaller fractal dimensions. In contrast, large-scale pores and throats, with significantly higher spatial storage capacity, exhibit steeper slopes in their fractal curve fits, derived from mercury intrusion curves, and thus yield larger fractal dimensions. This highlights the direct relationship between storage capacity and fractal dimensions: larger storage spaces correspond to higher fractal dimensions, reflecting the increased complexity and heterogeneity of large-scale pores and throats.
3.4. NMR Testing Results
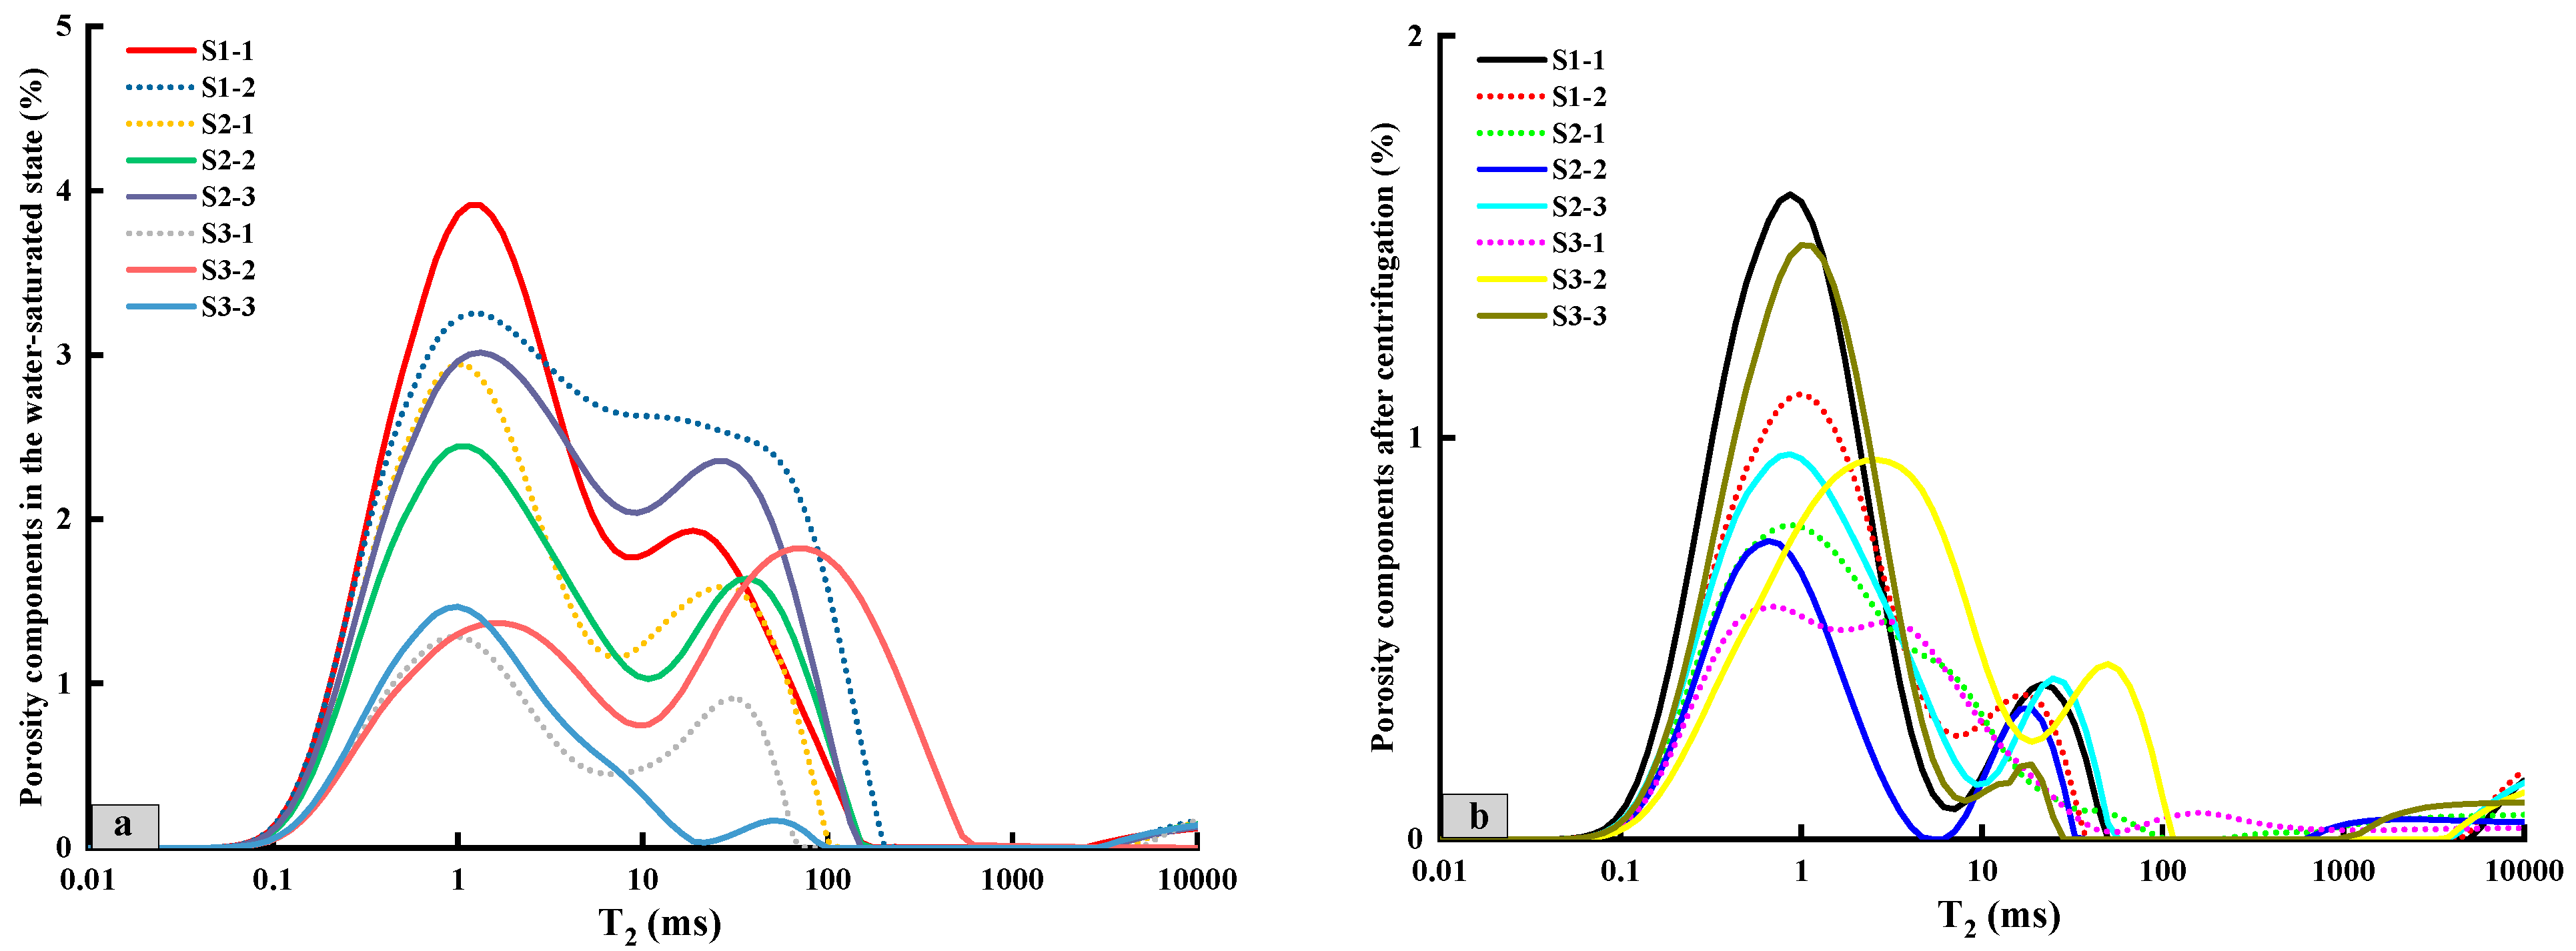
The T
2 distribution of water-saturated samples consistently exhibits a bimodal pattern, with the left peak representing smaller pore–throat regions and the right peak corresponding to larger pore–throat regions (
Figure 8a). Higher permeability samples show a more developed right peak compared to the left. For the S3-2 sample, the right peak amplitude in the water-saturated state is significantly higher than the left peak, indicating well-developed large pore–throats and correspondingly higher permeability. In contrast, the S3-3 sample exhibits only a weak right peak, with most fluids confined to smaller pore–throats, suggesting that the sample is dominated by small pores and has very low permeability (
Figure 8b).
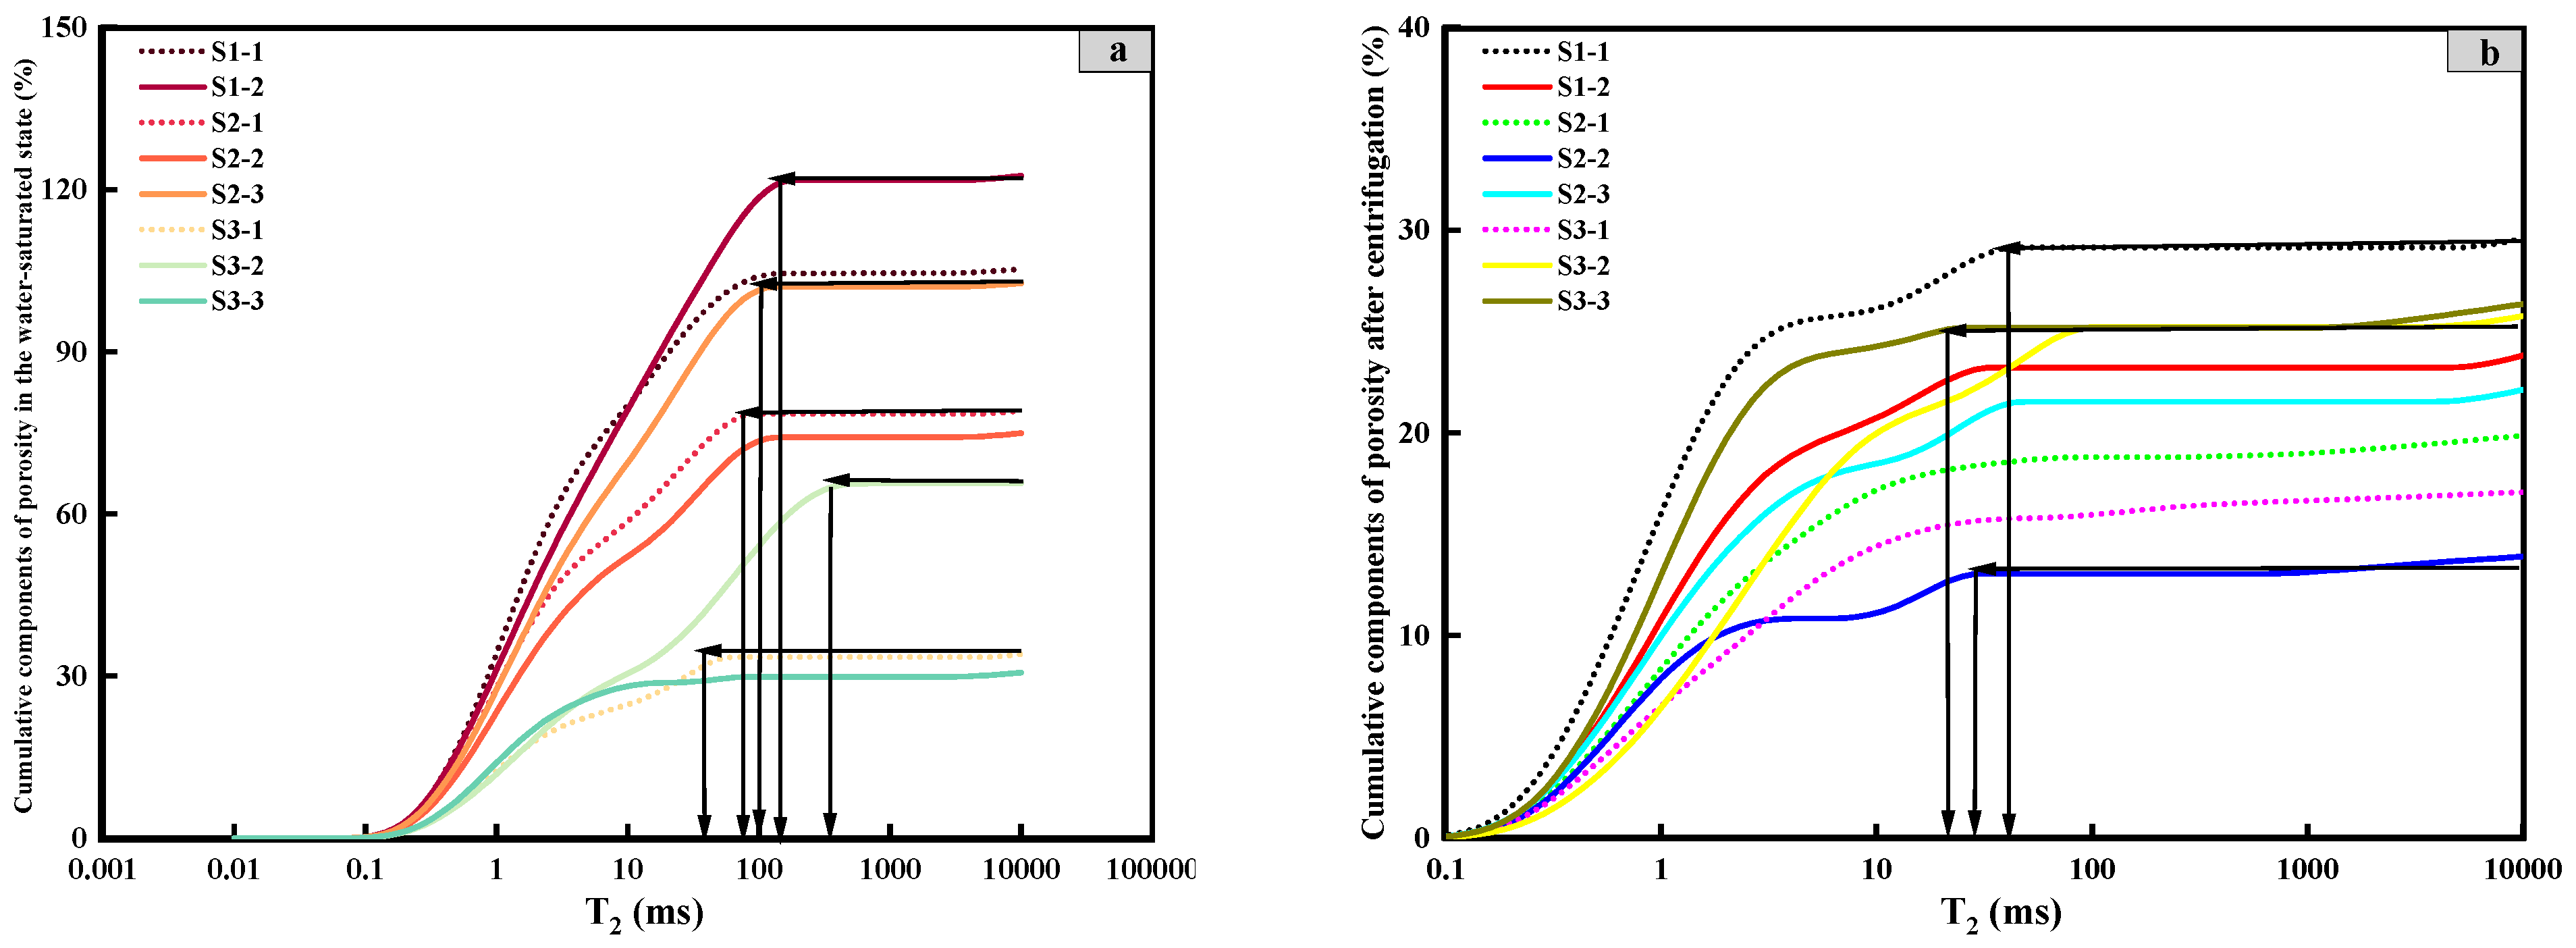
Figure 9 presents the T
2 distribution of the samples after centrifugation, highlighting changes in fluid distribution. During centrifugation, fluids from larger pores and throats are expelled, leaving bound fluids predominantly within smaller pores and throats. The difference in peak areas of the T
2 spectra before and after centrifugation is indicative of movable fluid saturation, with larger differences corresponding to higher movable fluid saturation. Across the eight samples, movable fluid saturation ranges from 21.35% to 76.1%, with movable fluid porosity varying between 0.833% and 8.531%. The storage characteristics of movable fluids are strongly influenced by the pore–throat structure. Pore–throat systems that are more homogeneous and better connected exhibit higher movable fluid saturation, whereas systems with poor connectivity and heterogeneity are associated with increased bound fluid saturation (
Figure 9).
3.5. NMR Fractal Analysis
The slope of the NMR-derived fractal curve is used to calculate the fractal dimensions of tight sandstone samples, revealing a distinct two-segment fractal characteristic. To analyze the influence of pore and throat structures on movable fluids, the T
2 cutoff time is applied as a boundary to separate the curve into two segments. This T
2 cutoff time effectively distinguishes between pores associated with movable fluids and those associated with bound fluids. For each sample, the curve segments to the left and right of the T
2 cutoff are independently fitted to determine the fractal dimensions for bound fluid throats (
Dmin) and movable fluid throats (
Dmax), respectively. Both segments exhibit high linear fitting coefficients, underscoring the reliability of fractal analysis based on NMR data. These results validate the applicability of this method for examining pore and throat structures in relation to fluid behavior (
Figure 10,
Table 3). Higher fractal dimensions correspond to more complex structures in three-dimensional space, whereas lower fractal dimensions indicate simpler pore structures.
When mercury intrusion pressure is below the inflection point, it corresponds to large-scale pores and throats; when pressure exceeds that point, it corresponds to small-scale pores and throats. The fractal dimensions of large-scale features are significantly higher than those of small-scale ones, indicating stronger heterogeneity. NMR-derived pore–throat fractal dimensions exhibit a two-stage distribution: fine pores and throats are relatively homogeneous, while larger structures are more heterogeneous.
High-pressure mercury intrusion fractal curves show clear inflection points that correspond to the microscopic transition from well-connected larger pore throats to poorly connected smaller pore throats. The smaller pore throat regime has a relatively low fractal dimension—reflecting uniform geometry and limited heterogeneity—whereas the larger-throat regime displays a higher fractal dimension, indicative of irregular structure and pronounced heterogeneity. NMR T2 spectra in these tight sandstones fall into two patterns: unimodal, reflecting a relatively uniform fine-pore network, and bimodal, where fine and medium-to-large pores coexist and impart distinct fractal signatures.
5. Conclusions
(1) Each method has its advantages and limitations, making it challenging to characterize the entire scale of the pore structure by a single technique. Therefore, it is common to combine multiple approaches, such as high-pressure mercury intrusion, NMR with mercury intrusion, or NMR with SEM, to comprehensively characterize the pore structure of tight reservoirs. The mercury intrusion method is limited by the intrusion pressure, rendering it insufficient for a complete characterization of the pore space and pore size distribution. NMR, by contrast, categorizes reservoirs based on T2 spectrum distribution and relaxation time; it can provide a more comprehensive depiction of pore distribution, though it does not directly measure flow capacity. Moreover, the T2 spectrum reflects the sample’s relaxation time, and further conversion is needed to obtain the pore size distribution.
(2) Tight sandstone reservoirs exhibit strong heterogeneity in pore–throat characteristics, notably influenced by the diverse shapes and connectivity of pore–throats. When mercury initially enters the sample, the intrusion curve slope is steep, and saturation rises rapidly. After the intrusion pressure exceeds the inflection point, the slope of the saturation curve becomes gentler with increasing pressure, indicating smaller incremental intrusion in the pore–throat system. Smaller-scale pore–throats, which undergo substantial compaction and cementation, display reduced fractal dimensions, reflecting a more uniform and less complex structure. Conversely, larger-scale pore–throats, significantly altered by dissolution, exhibit increased fractal dimensions due to severe deformation, indicating greater structural complexity and heterogeneity. It shows negative correlations between pore–throat fractal dimension and both small and large pore–throats. The increased throat complexity degrades reservoir petrophysical properties, and permeability is more sensitive to the increased complexity than porosity in other tight oil reservoirs, such as the Daqing Oilfield.
(3) The fractal analysis of pore–throat structures reveals distinct inflection points in the curves, marking a transition from large-scale pore–throats, characterized by stronger permeability, to small-scale ones with weaker permeability. Small-scale pores primarily consist of residual intergranular and intercrystalline pores, whereas large-scale pores typically include dissolution pores and composite pores. Pores and throats with smaller radii, which experience minimal influence from diagenetic activities, exhibit lower heterogeneity and smaller fractal dimensions. In contrast, small-scale throats generally manifest as constricted throats, while large-scale throats are characterized as curved lamellar throats, which are significantly transformed by diagenetic processes due to their larger radii. The impact of diagenesis is a key factor in the fractal characteristics of pore–throats, introducing pronounced heterogeneity and clear distinctions in fractal dimensions between different scales of pore–throats.
(4) NMR pore–throat fractal dimensions exhibit a two-segment distribution characteristic, indicating that the complexity of the pore–throat structure and the size of the throats critically determine permeability. Movable fluids are primarily distributed in large pore–throats, where the complexity of these large pore–throat structures dictates the mobility of the sample fluids. Additionally, the proportion of brittle mineral content significantly impacts the heterogeneity of the pore–throat structure. Fractal analysis of the T2 curves yields two characteristic dimensions: D ranges from 2.333 to 2.588 (mean 2.479), representing the markedly complex larger pore–throat network. This clear dual-fractal behavior highlights that larger pore–throats exhibit much more complex pore structures than smaller ones. By quantifying these contrasting regimes, NMR offers a powerful tool for evaluating pore structure complexity and reservoir quality in tight oil reservoirs. By quantifying these contrasting regimes, NMR offers a powerful tool for evaluating pore structure complexity and reservoir quality in tight oil reservoirs.


