Article

Fractal Characterization and NMR Analysis of Curing-Dependent Pore Structures in Cemented Tailings Waste RockBackfill

School of Resources and Safety Engineering, Central South University, Changsha 410083, China
*
Author to whom correspondence should be addressed.
Fractal Fract. 2025, 9(6), 367; https://doi.org/10.3390/fractalfract9060367
Submission received: 13 May 2025 / Revised: 23 May 2025 / Accepted: 29 May 2025 / Published: 4 June 2025

Abstract

This study investigates the coupled effects of waste rock-to-tailings ratio (WTR) and curing temperature on the pore structure and mechanical performance of cemented tailings waste rock backfill (CTRB). Four WTRs (6:4, 7:3, 8:2, 9:1) and curing temperatures (20–50 °C) were tested. Low-field nuclear magnetic resonance (NMR) was used to characterize pore size distributions and derive fractal dimensions ( D a , D b , D c ) at micropore, mesopore, and macropore scales. Uniaxial compressive strength (UCS) and elastic modulus (E) were also measured. The results reveal that (1) the micropore structure complexity was found to be a key indicator of structural refinement, while excessive temperature led to pore coarsening and strength reduction. D a = 2.01 reaches its peak at WTR = 7:3 and curing temperature = 40 °C; (2) at this condition, the UCS and E achieved 20.5 MPa and 1260 MPa, increasing by 45% and 38% over the baseline (WTR = 6:4, 20 °C); (3) when the temperature exceeded 40 °C, D a dropped significantly (e.g., to 1.51 at 50 °C for WTR = 7:3), indicating thermal over-curing and micropore coarsening; (4) correlation analysis showed strong negative relationships between total pore volume and mechanical strength ( R = −0.87 for δ a v s . U C S ) , and a positive correlation between D a and UCS (R = 0.43). (5) multivariate regression models incorporating pore volume fractions, T 2 relaxation times, and fractal dimensions predicted U C S and E with R2 > 0.98; (6) the hierarchical sensitivity of fractal dimensions follows the order micro-, meso-, macropores. This study provides new insights into the microstructure–mechanical performance relationship in CTRB and offers a theoretical and practical basis for the design of high-performance backfill materials in deep mining environments.

1. Introduction

The sustainable management and reutilization of mining wastes, such as tailings and waste rock, have become critical issues due to environmental concerns and resource conservation requirements [1,2,3]. Cemented tailings waste rock backfill (CTRB) technology addresses these challenges by integrating solid waste utilization with underground mining stability, effectively serving dual roles: promoting waste reuse and controlling ground pressure [4,5,6]. As mining operations progress into deeper underground environments, they increasingly face harsh conditions characterized by high temperature, high pressure, intense stress, and significant disturbances [7,8]. These conditions frequently trigger dynamic hazards, making it imperative to implement effective ground pressure control strategies. Backfilling mined-out areas with cemented materials significantly mitigates these hazards by providing structural stability and supporting the underground excavations.
Compared to conventional cemented paste backfill (CPB), the inclusion of waste rock in CTRB enhances the stiffness and deformation resistance of the fill material [9,10,11]. This increased stiffness significantly improves support performance in underground openings, further reducing deformation risks and enhancing mine stability. However, the heterogeneous nature resulting from the mixture of coarse waste rock and fine tailings leads to complex microstructural developments, posing challenges in accurately predicting material performance and maintaining consistent quality control.
Pore structure is fundamentally significant for the physical and mechanical properties of cemented backfills, determining their strength, permeability, durability, and long-term stability [12]. During the hydration process of cementitious binders, pore evolution is strongly influenced by particle size distribution, binder content, hydration kinetics, and curing conditions [13]. Accurate and comprehensive characterization of pore structures is, therefore, essential to reveal the underlying mechanisms connecting microstructural evolution and macroscopic performance. Traditional pore analysis methods, such as mercury intrusion porosimetry (MIP), have limitations related to sample destruction and difficulties in capturing the full spectrum of pore size distributions [14]. Recently, low-field nuclear magnetic resonance (LF-NMR) has emerged as a promising non-destructive technique, enabling detailed, quantitative assessments of pore distributions and providing reliable insights into pore connectivity and complexity [15,16,17].
Temperature variations significantly affect the hydration reactions and subsequent microstructural development in cementitious materials [18,19,20]. Practical mining environments frequently encounter non-ideal curing conditions, characterized by either low temperatures in high-altitude or cold regions or elevated temperatures in deep underground operations [21,22]. Such temperature fluctuations directly modify hydration kinetics, phase formation, and microstructural properties, thereby influencing the evolution of pore networks and mechanical performance [23]. While previous studies have primarily examined hydration and strength development under standard laboratory conditions, there is limited research systematically exploring the coupled effects of curing age and temperature on pore structure evolution and overall backfill performance.
Additionally, given the inherent heterogeneity and complexity of pore structures within CTRB, conventional metrics like average pore diameter and total porosity are insufficient to capture the detailed microstructural features. Fractal theory provides a powerful analytical tool for characterizing pore network complexity and spatial heterogeneity across different scales [24,25,26]. The fractal dimension, derived from pore size distributions obtained via LF-NMR, can effectively quantify structural complexity and connectivity, offering a single-valued, scale-independent descriptor of pore geometry [27]. Incorporating fractal analysis not only enhances understanding of the structural development of backfill materials but also improves the predictive accuracy of their mechanical and hydraulic behaviors.
Therefore, this study aims to systematically investigate the effects of curing temperature and age on the pore structure evolution, fractal characteristics, and mechanical properties of cemented waste rock–tailings backfill. By integrating LF-NMR measurements, and fractal theory analysis, the research seeks to elucidate the interrelationships among curing conditions, pore structure complexity, and macroscopic performance, ultimately providing valuable insights for material design and practical engineering applications.
Microstructural characteristics of backfill materials significantly influence their load-bearing capacity and long-term stability. However, there is still a lack of systematic research on the multiscale evolution of pore structures under varying aggregate gradations and curing temperatures, as well as their coupled effects on the mechanical behavior of cemented tailings backfill. To address this gap, this study investigates the coupling mechanism between pore structure and mechanical performance in CTRB, using NMR combined with fractal geometry theory, under different waste rock-to-tailings ratio (WTR) and curing temperatures.
The main objectives of this study are as follows: (1) to reveal the effects of waste rock content and curing temperature on the pore structure of CTRB; (2) to explore the coupling relationship between microscopic pore characteristics (such as pore size distribution, volume fraction, and fractal dimension) and macroscopic mechanical properties, i.e., uniaxial compressive strength (UCS) and elastic modulus (E); (3) to establish a quantitative prediction model to evaluate the strength and stability of CTRB under various environmental conditions; and (4) finally to provide theoretical guidance and design parameters for microstructural optimization in deep mine backfilling applications.
To achieve these goals, the study includes the following research components: NMR testing is used to characterize the T 2 spectrum and classify pore types (micro-, meso-, and macropores); fractal dimensions are extracted based on fractal geometry to quantify structural complexity at different scales; Pearson correlation analysis is conducted to investigate the internal relationships between pore structure parameters (e.g., volume fraction, T 2 values, fractal dimensions) and mechanical properties (UCS and E ); and multivariate linear regression models are developed to map microstructural indicators to mechanical performance, enabling both prediction and mechanistic verification.

2. Materials and Methods
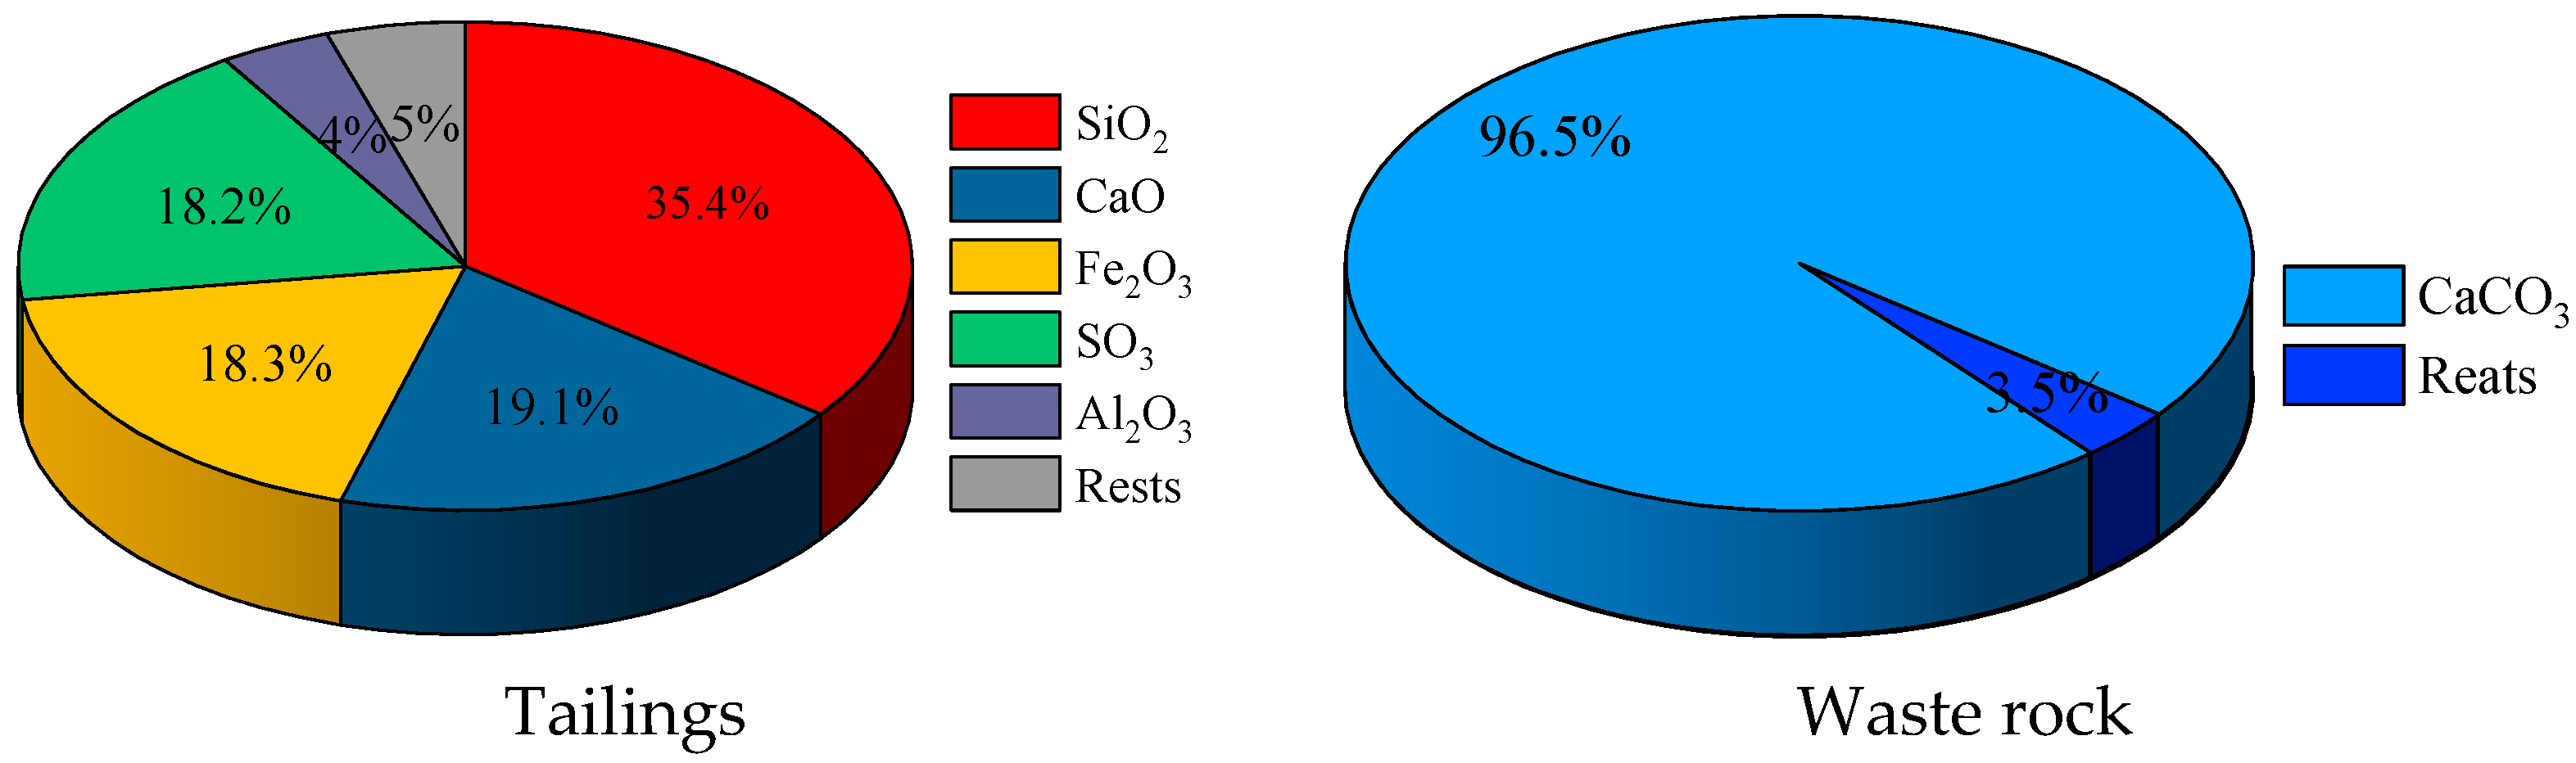
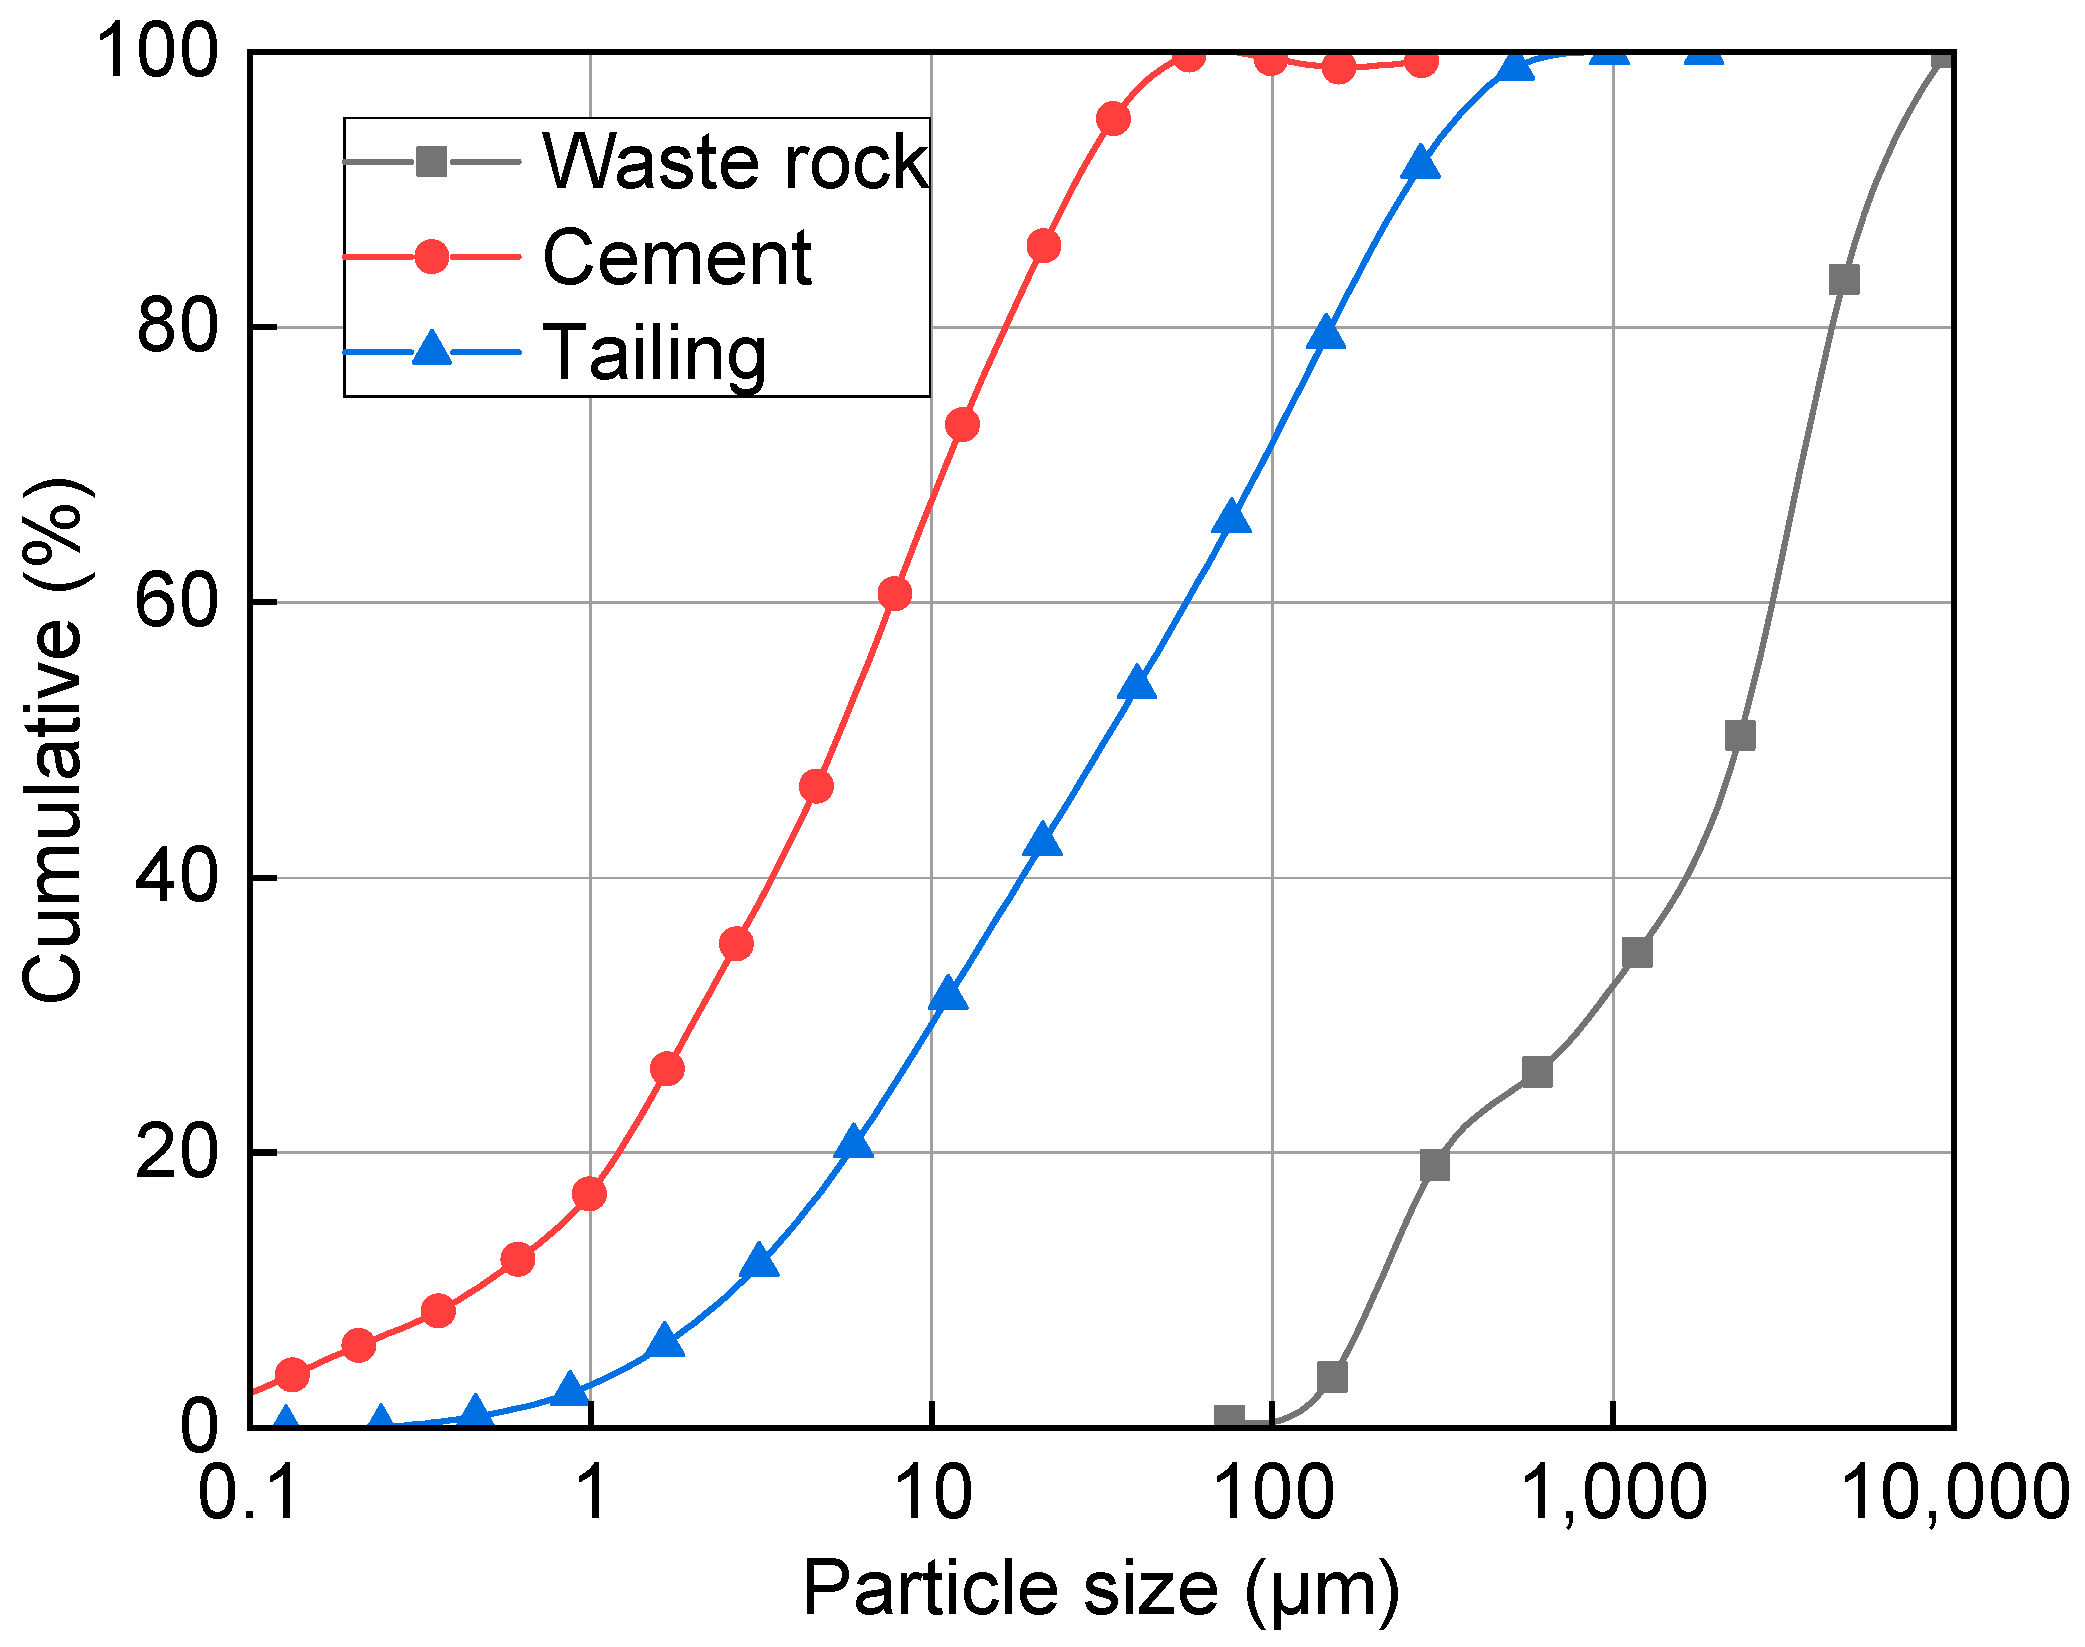
2.1. Raw Materials

The materials used in this study include tailings sourced from the Bari processing plant of Guangxi Gaofeng Mining Co., Ltd. (Gaofeng Mining, Hechi, China), waste rock obtained from the on-site crushing station, and standard 32.5 ordinary Portland cement collected from the company’s backfill station. The tailings are a by-product of the tin flotation beneficiation process. After flotation, the tailings slurry is processed through a cyclone–thickener–filter press system to produce a tailings filter cake, in accordance with the dry-stacking tailings disposal method adopted by the mine. The resulting filter cake were further oven-dried to 0% moisture content in the lab prior to use.
The physical and chemical properties of raw materials were tested in accordance with the Standard for Soil Test Methods GB/T 50123-2019 [28] as suggested in the technical Standard for backfill engineering [29]. All experiments in this study were conducted using tailings, cement, and fine waste rock.
During mixing, chemical reactions may occur between the aggregate and the cementitious material, influencing the physical and mechanical properties of the backfill. Thus, it is essential to understand the chemical composition of the aggregates. X-ray fluorescence spectroscopy (XRF) was employed to analyze the major chemical components of the tailings and waste rock. As shown in Figure 1, the primary constituents of the tailings include S i O 2 , C a O , F e 2 O 3 , S O 3 , and A l 2 O 3 ; the cement mainly comprises C a O , S i O 2 , A l 2 O 3 , F e 2 O 3 , and S O 3 , while the waste rock is predominantly composed of C a C O 3 . To improve backfill performance by minimizing interparticle voids, the waste rock was ground to a finer size.
The laser particle sizing instrument (Malvern Mastersizer 2000, Malvern Instruments Limited, Malvern, UK) was used to analyze the particle size distribution of tailings and cement. The sieve analysis was conducted for the waste rock as its size larger than 74 μ m . The particle size distribution curves of the three materials are presented in Figure 2. The particle size of the waste rock was measured to be less than 10 mm. The specific gravity of the raw materials was measured in accordance with GB/T 50123-2019. For particles smaller than 5 mm, the pycnometer method was adopted. The test results indicate that the specific gravities of tailings, waste rock powder, and cement are 2.74, 2.68, and 3.12, respectively.

2.2. Mix Design and Specimen Preparation

Aggregate gradation refers to the particle size distribution of fine, medium, and coarse particles, which directly affects the durability and stability of backfill materials [30]. Well-graded aggregates reduce porosity by enabling fine particles to fill the voids between coarse particles [14]. Fuller curve is used to optimize the aggregate gradation [31].
P d = 100 × d D n
where P ( d ) denotes the percentage of particles of particle size d passing in the aggregate, %; n denotes the gradation index, D denotes the largest particle size in the aggregate, mm. This study uses the 0.45 power gradation chart method to analyze and evaluate the grading of the CTRB [32]. It is accepted that the mix with n in the range of 0.35 to 0.45 has good compactness [33,34].
The CTRB is composed of coarse aggregates, e.g., waste rock and fine aggregates, e.g., tailings. The cumulative percentage of aggregates in CTRB is shown in Figure 3a when the waste rock to tailing ratio increases from 1:9 to 9:1. Figure 3b gives the corresponding gradation index n derived according to Equation (1). It is found that when the WTR is 6:4, 7:3, 8:2, and 9:1, the particle size distribution curves are closer to the optimized density curve ( n = 0.45 ). The gradation indexes are 0.288, 0.351, 0.352, and 0.370, nearly falling inside 0.35 and 0.45. In order to study the effect of ambient temperature and achieve good compactness, the mixes with the four WTR were casted for following tests. According to the studies [35,36], the slurry mass concentration is designed as 84%, which is a mass of solid/mass of total mixture. The solid is composed of cement and aggregates (including tailings and waste rock). The cement to aggregates ratio is designed as 1:4. For each combination of mix proportion and curing temperature, three replicate specimens were prepared and tested.
The backfill slurry was prepared in accordance with the test protocol and cast into standard cylindrical molds with a diameter of 50 mm and a height of 100 mm. After 24 h, the specimens were demolded and subsequently placed in a curing chamber for further curing (Figure 4). Based on the real temperature in underground deep mine, the curing temperature was set as 20 °C, 30 °C, 40 °C, and 50 °C. The relative humidity was set as 95%. The uniaxial compressive strength (UCS) and pore structure properties were tested when the specimen was cured 28 days.

2.3. Experimental Method and Equipment

After the backfill reached the curing age (28 days), NMR and compressive strength tests were conducted for mechanical properties and pore structure under different curing temperatures. The whole test procedure is illustrated in Figure 4.

2.3.1. Low-Field Nuclear Magnetic Resonance (NMR)

NMR is a nondestructive technique that detects signals based on the distribution of water within the pore spaces of rocks. An AniMR-150 NMR device (Suzhou Niumag Analytical Instrument Co., Ltd., Suzhou, China) was employed to characterize the pore structure of the backfill specimens, as shown in Figure 4. The analysis was conducted using the MacroME12-150H-I-60 mm rock NMR system. During testing, the magnet temperature was maintained at a constant 32 °C. By conducting CPMG (Carr–Purcell–Meiboom–Gill) pulse sequence tests on water-saturated samples, the decay signal amplitudes of spin-echo trains were measured. These amplitudes reflect the relaxation behavior of hydrogen (1H) nuclei in pore water and collectively form the T2 distribution curve, which provides detailed insight into the internal pore structure.
Therefore, as part of the moisture saturation treatment, prior to NMR testing, each specimen was saturated with water for 48 h using a vacuum saturation device at a pressure of 0.1 MPa. After the first 36 h of vacuum saturation, the specimen was removed, surface-dried, and weighed. It was then returned to the vacuum chamber for an additional 12 h of saturation. After the second cycle, the specimen was again weighed. If the difference between the two measurements was less than 0.1 g, the specimen was considered fully saturated (100%).
NMR measurements were carried out on fully saturated specimens using the Ain-iMR-150 device. The CPMG pulse sequence was applied with the following settings: echo time (TE) of 0.256 ms, 4096 echoes (NECH), waiting time (TW) of 6000 ms, and 32 signal accumulations. The resulting data were used to determine both the porosity and the transverse relaxation time ( T 2 ) distribution under saturated conditions.
When the NMR system operates under a uniform magnetic field with a negligible magnetic field gradient, the nuclear magnetic resonance relaxation mechanism of the pore fluid can be approximated as being governed solely by surface relaxation. Under such conditions, the transverse relaxation time T 2 can be expressed as follows:
1 T 2 = ρ 2 S V = F s ρ 2 1 r
where r represents the radius of pore in micrometers, and where Fs is the geometric shape factor (spherical pores of 3 and columnar pipe pores of 2). Thus, T 2 is directly proportional to the pore size. The NMR T 2   spectrum effectively reflects the evolution of pore structures within the backfill material. NMR tests were carried out on the backfill with different curing temperatures, and waste rock tailings ratios.

2.3.2. Uniaxial Compression Strength Test

When the NMR test finished, the specimen was subjected to uniaxial compressive test to obtain the UCS and elastic modulus ( E ) using a computer-controlled universal pressure mechanical device—WDW-2000 rigid hydraulic pressure servo machine (Ruite, Guilin, China). The displacement rate of loading was 0.5 mm·min−1 until failure according to the test standard of BS EN 12390-3 for concrete [37].

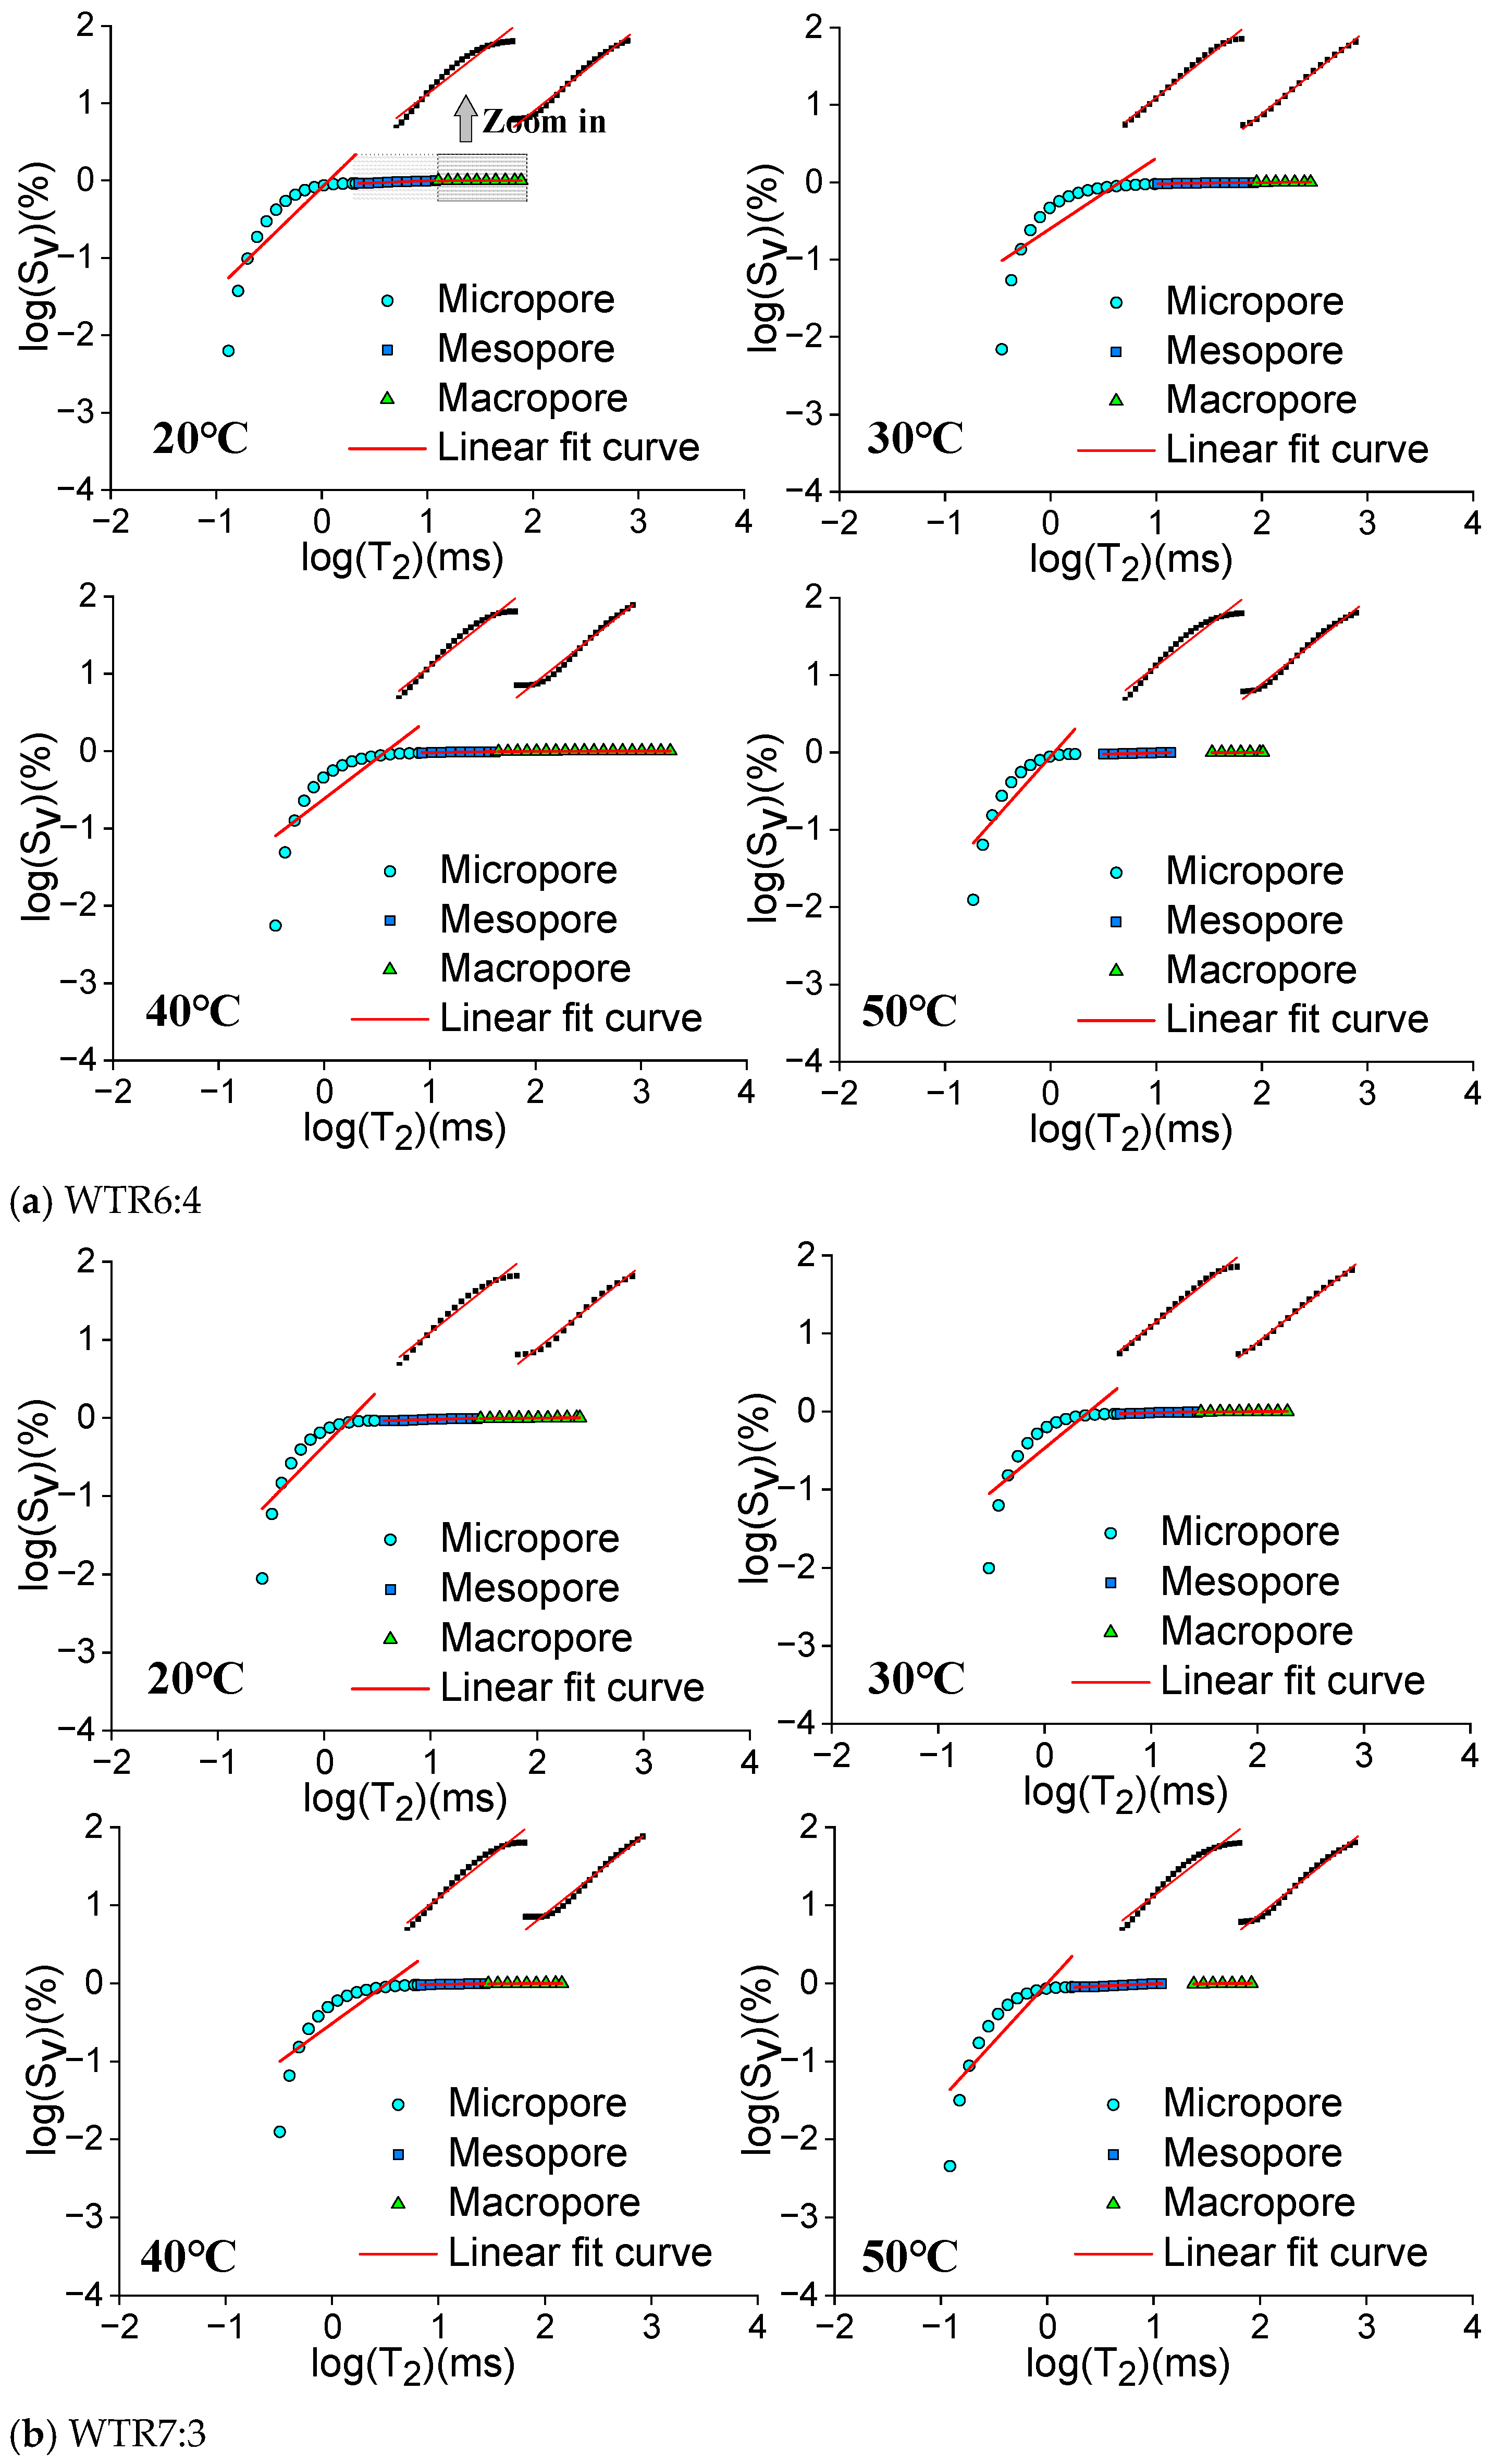
2.3.3. Fractal Theory and Dimension

According to the fractal geometric principle [14,38], for cemented tailing backfill the number of pores N   ( > r ) larger than pore diameter r satisfies the following power function:
N > r = r r m a x P r d r = a r D
where r m a x is the maximum pore radius; P ( r ) is pore size distribution density; a is a proportional constant; D is pore fractal dimension. By deriving r from Equation (2), the pore size distribution density function can be obtained as
P r = d N > r d r = a r D 1
where a = D a is a proportional constant. The cumulative volume of pores with size less than r can be expressed as
V < r = r m i n r P r a r 3 d r
where a is a constant involved in pore shape, e.g., a = 1 or a = 4π/3 for a cubic or spherical specimen); r m i n is the minimum pore radius. Substituting Equations (3) and (4) yields:
V < r = a ( r 3 D r 3 D m i n )
Therefore, the total pore volume is written as
V s = V r m i n = a ( r 3 D m a x r 3 D m i n )
The expression for cumulative pore volume S v with a pore size radius smaller than r is as follows
S v = V < r V s = r 3 D r m i n 3 D r m a x 3 D r 3 D
Due to r m i n r m a x , simplify Equation (7) as
S v = r 3 D r m a x 3 D
which is the fractal geometric expression of pore size distribution. In the NMR experiment, the relaxation time, T 2 , increased linearly with increasing pore size as indicated in Equation (1), i.e., T 2 indicating pore radius. Combined with Equation (1), S v becomes
S v = T 2 m a x T 2 D 3
where S v is the ratio of cumulative pore volume with a transverse relaxation time less than T 2 to the total pore volume. At this stage, an approximate fractal geometry-based formula for the NMR T 2 distribution can be derived. Taking the logarithm of the two sides yields
lg S v = 3 D lg T 2 + ( D 3 ) l g ( T 2 m a x )
which indicates that if the pore structure of specimen exhibits fractal characteristics, a linear correlation should exist between lg ( S v ) and lg ( T 2 ) in the NMR spectrum. This relationship can be verified using graphical methods or regression analysis. If such a linear correlation is confirmed, the fractal dimension and the maximum relaxation time of the pore structure can be determined from the coefficients of the regression equation. Furthermore, the correlation coefficient obtained from the regression analysis reflects the degree to which the pore structure conforms to a fractal model. The NMR-derived fractal dimension can be used to characterize the complexity of the pore structure [39,40,41].

3. Results

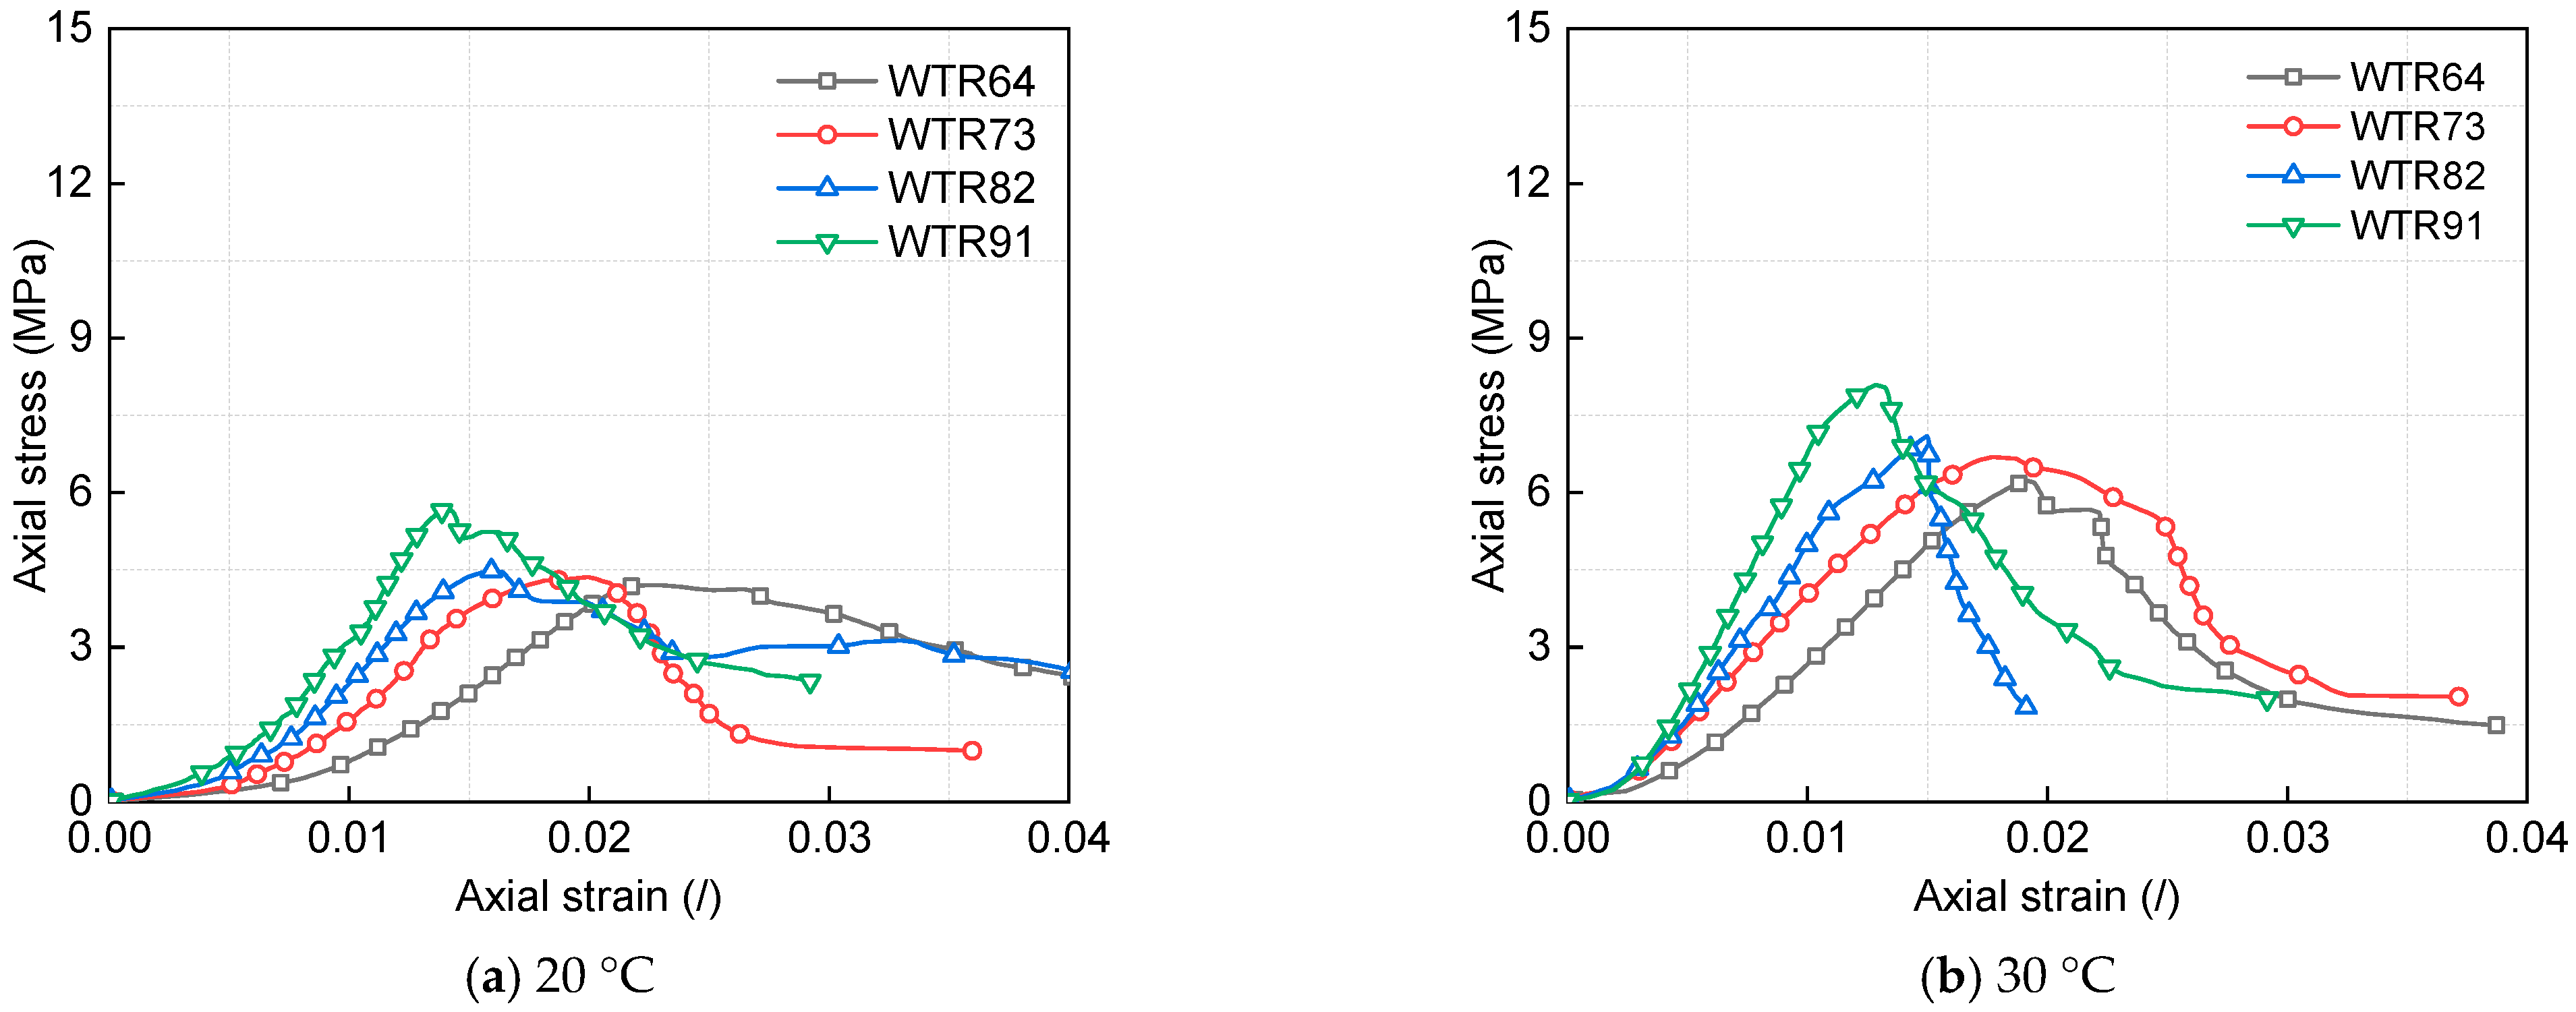
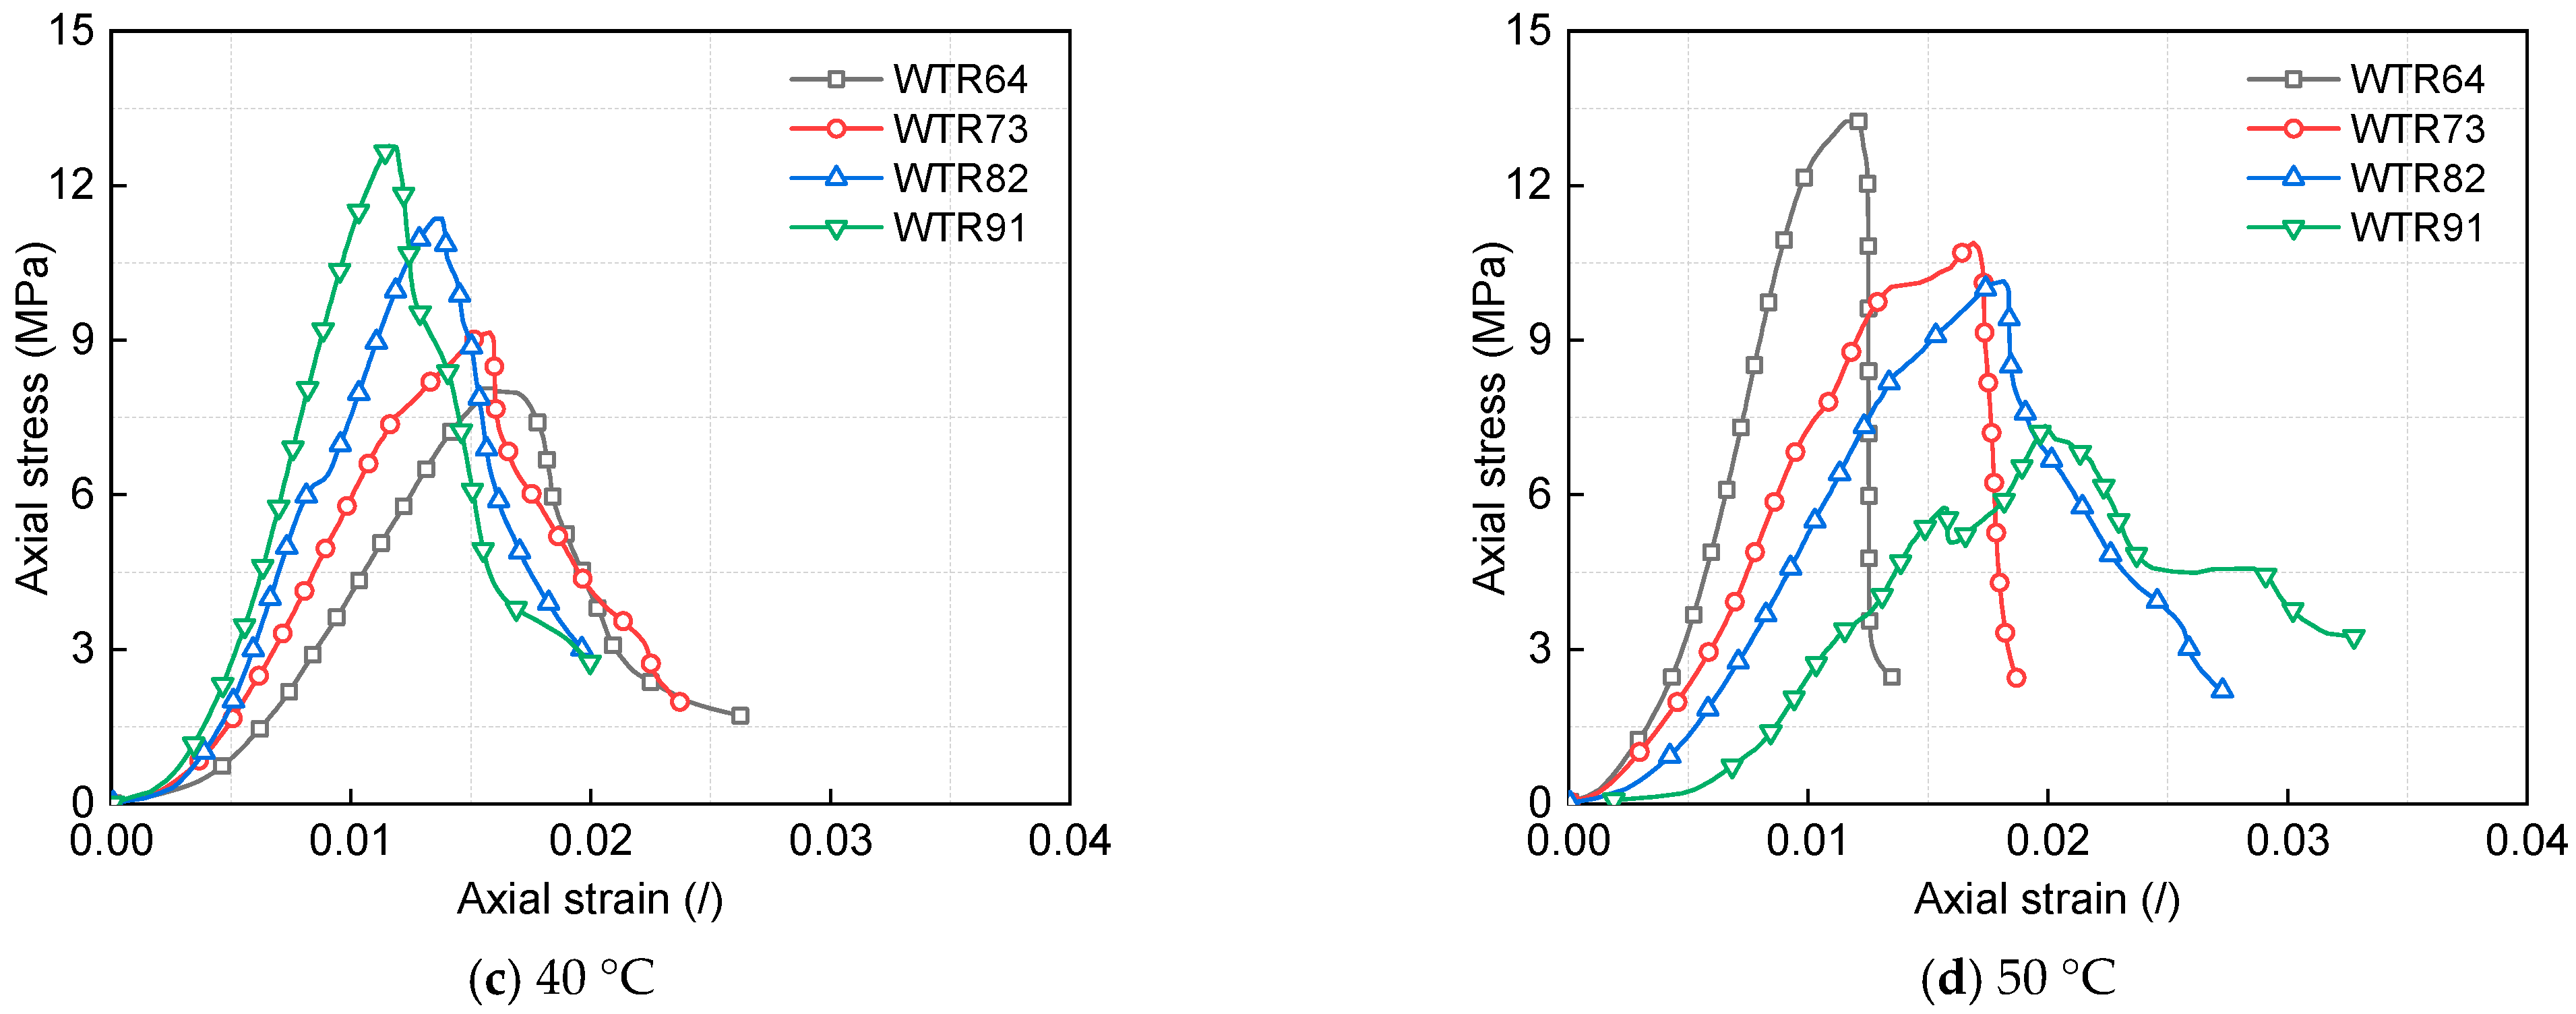
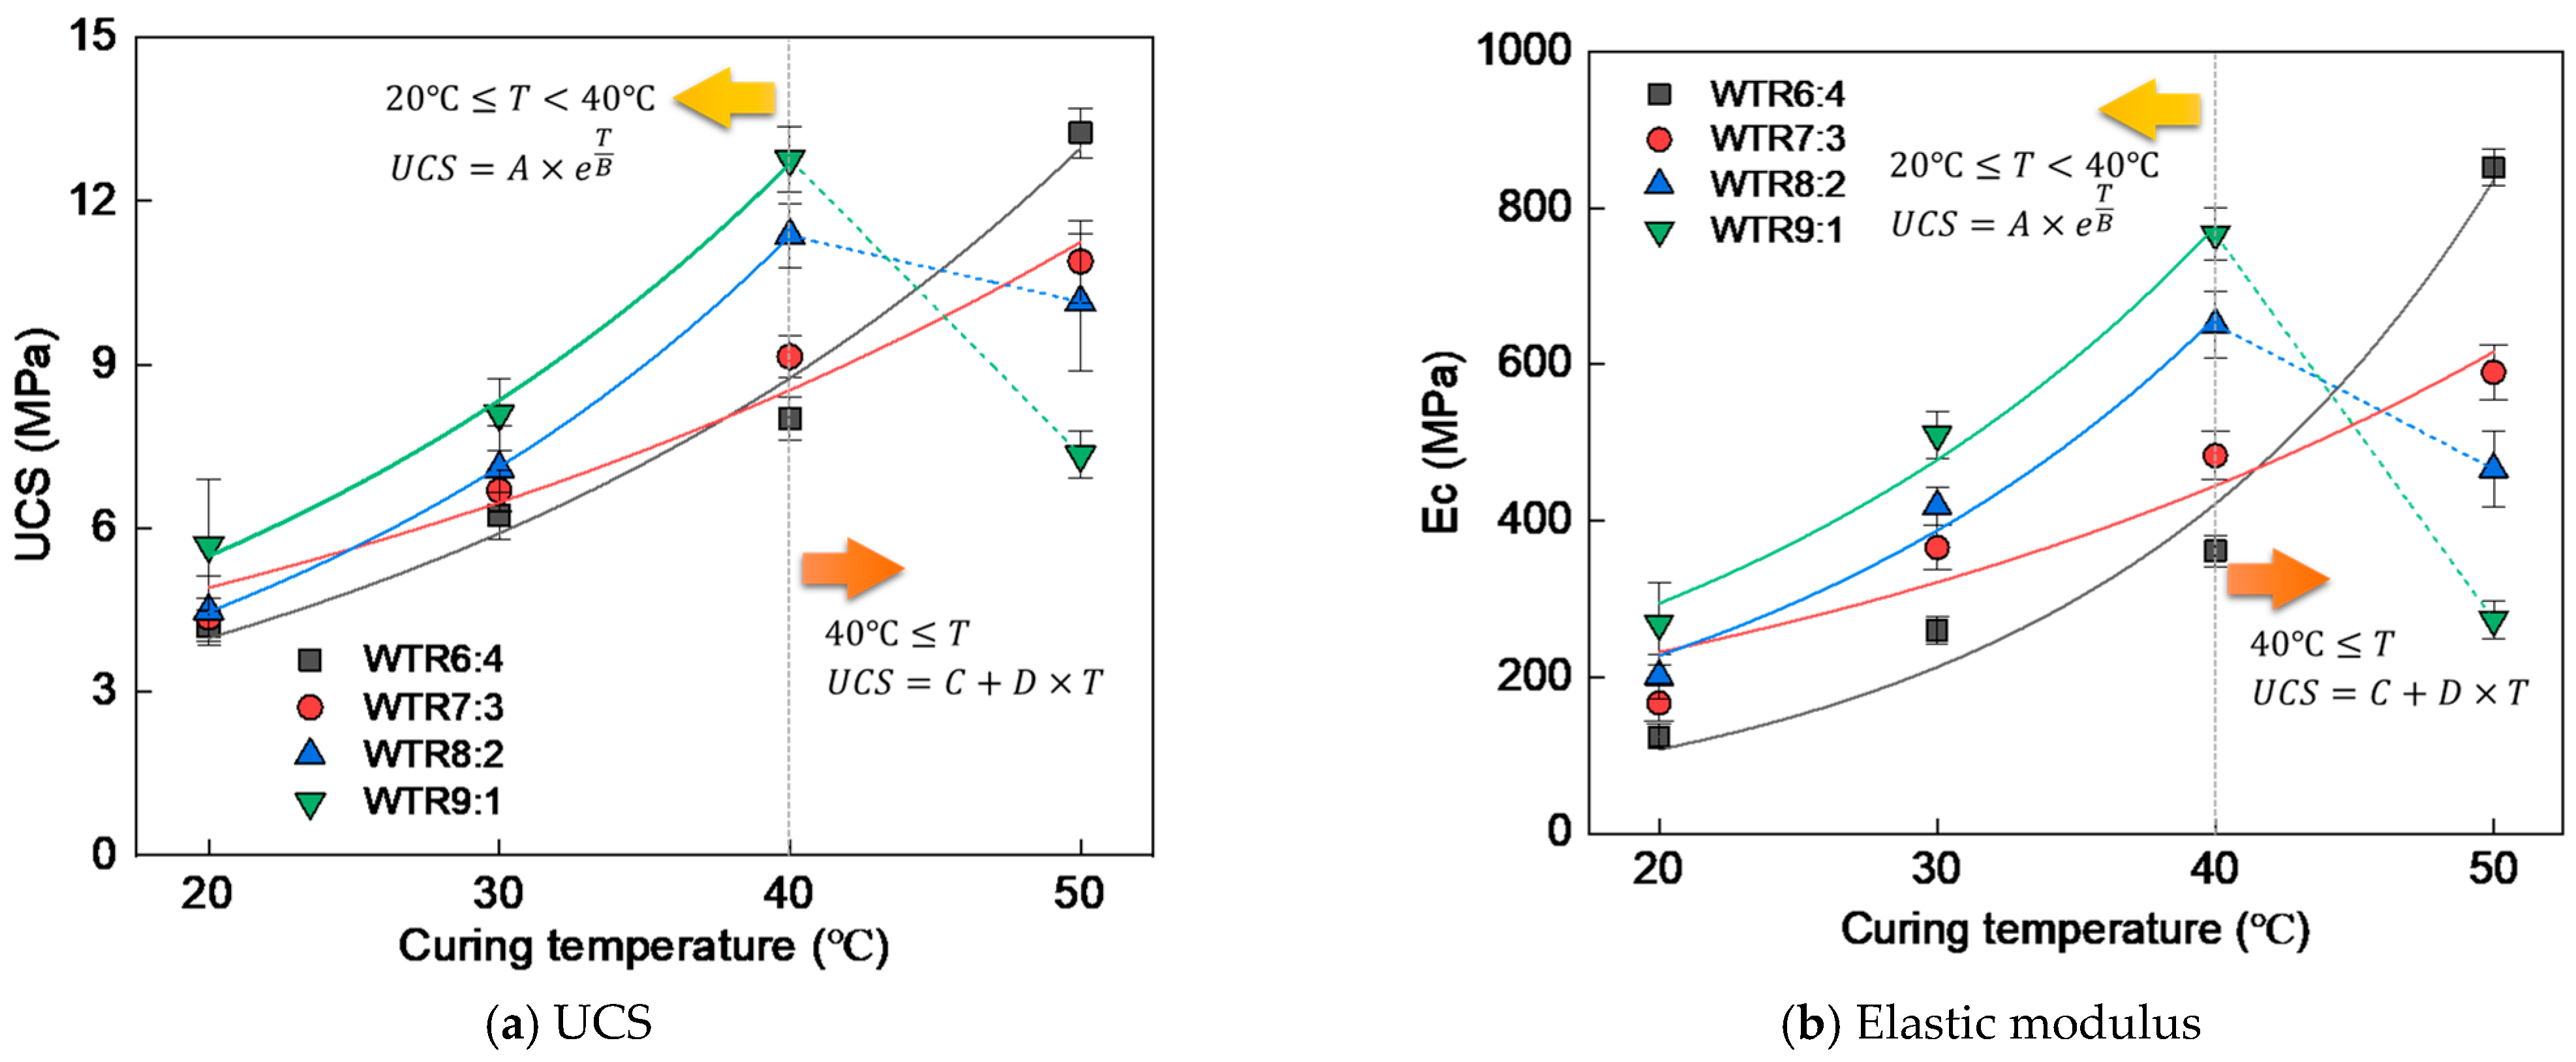
3.1. Mechanical Behavior

Figure 5 shows the stress–strain curves of CTRB with different waste ratio and curing condition at 28 d under uniaxial compression strength test. The corresponding UCS and E are presented in Figure 6. It is noted that the simulated response is linear in the initial stage, and E is the slope σ c ε c of the stress–strain relation when σ c = 0.4 U C S as suggested in the Model Code (2010) [42].
Figure 5 shows the typical stress–strain curve consists of four stages: initial compaction, elastic deformation, plastic deformation, and failure. At curing temperatures between 20 °C and 40 °C, both the E and UCS increase with higher waste rock content. The failure behavior is brittle, characterized by minimal deformation after reaching peak strength. In contrast, at 50 °C, both the elastic modulus and strength tend to decrease as the waste rock content increases. For samples with a 9:1 waste rock-to-tailings ratio, the curve exhibits a noticeable yield plateau, indicating ductile failure characteristics.
As shown in Figure 6, the UCS and E of the backfill exhibits different temperature-dependent behaviors under different aggregate ratios: (1) For WTR = 6:4 and 7:3, the UCS and E increases exponentially with temperature over the 20–50 °C; (2) For ratios of 8:2 and 9:1, strength increases exponentially from 20 °C to 40 °C but shifts to a linear trend or even decline from 40 °C to 50 °C.
These behaviors can be fitted using the following functions
U C S = A × e T / B
U C S = A + B × T
where UCS is the uniaxial compressive strength (MPa), T is the curing temperature (°C), and A, B are fitting parameters. The corresponding fitting parameters are illustrated in Table 1 to quantify the effect of curing temperature on mechanical properties, and a temperature sensitivity coefficient ξ is introduced:
ξ = U C S 2 U C S 1 U C S 1 ( T 2 T 1 )
A larger absolute value of ξ indicates greater temperature sensitivity. For WTR = 6:4 and 7:3, ξ decreases with curing age, suggesting that temperature has a stronger effect on early-age strength. However, for WTR = 8:2 and 9:1, ξ becomes negative when the temperature exceeds 40 °C, implying that excessive heat may cause strength degradation. Additionally, the absolute value of ξ is higher between 20 °C and 40 °C than between 40 °C and 50 °C, indicating that strength development is more temperature-sensitive in the lower range. More analysis and discussion regarding the effect of curing temperature on the mechanical properties can be found in [23].

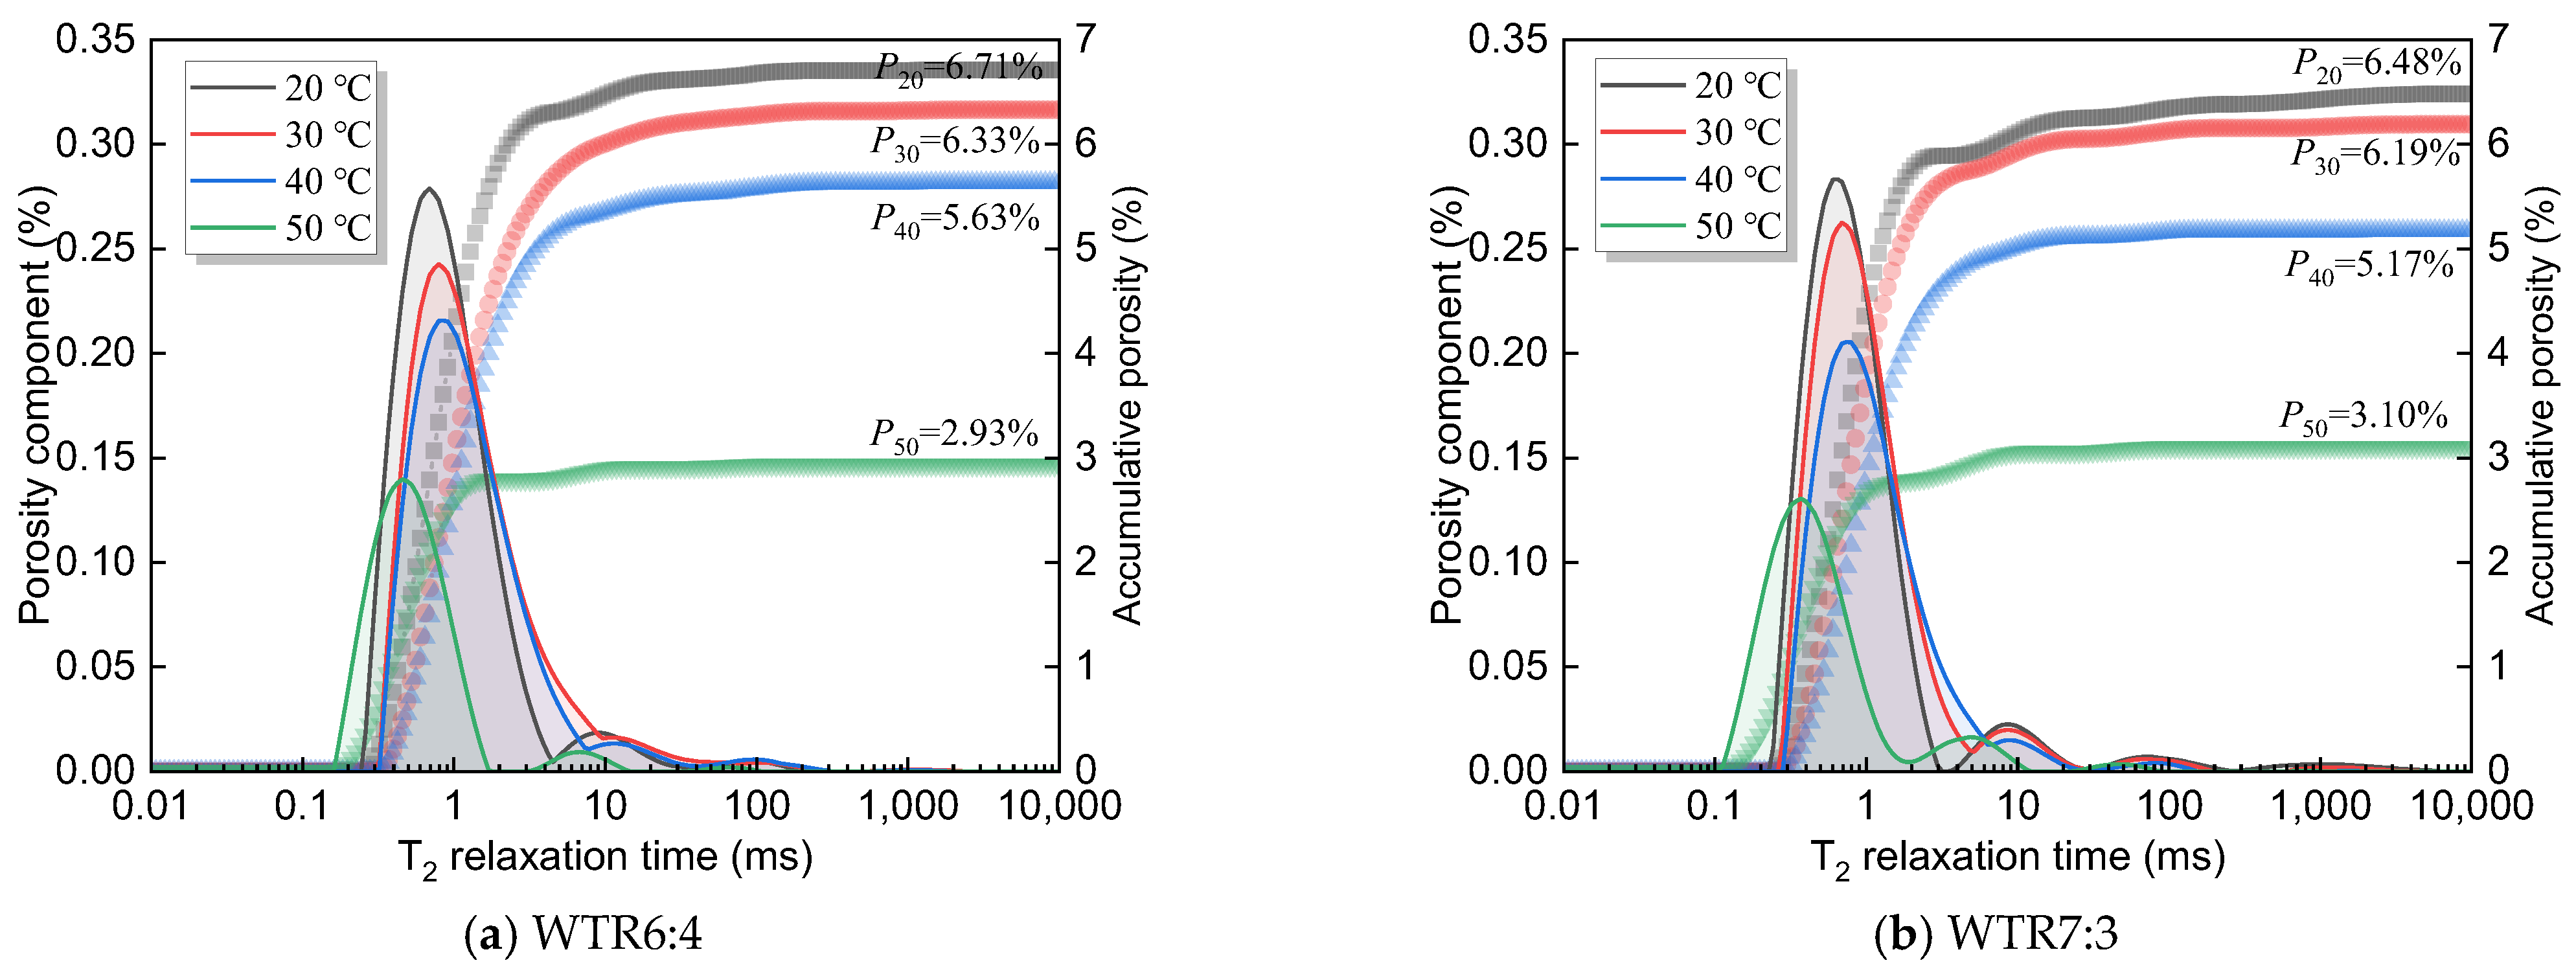
3.2. T2 Spectrum Distribution Curves

The resulting T 2 spectrum with different WTR and curing conditions is shown in Figure 7. Overall, the spectrum predominantly displays a primary peak and, in some cases, one or more secondary peaks, indicating a mix of micropores, mesopores, and macropores [23]. The peaks shift from left to right as pore size increases as indicated in Equation (1). The dominant peaks mostly fall within the range of 0.1–10 m s , suggesting that small pores dominate the backfill structure.
When the WTR is 6:4 or 7:3, the main peak intensity decreases continuously as the curing temperature increases. In this case, the T 2 relaxation time of the primary peak shifts to longer times from 20 °C to 40 °C, indicating pore enlargement or enhanced connectivity. However, at 50 °C, the T 2 relaxation time shifts sharply to shorter times, suggesting thermal shrinkage, dehydration, or structural degradation of the pore network.
In case of WTR increasing to 8:2 or 9:1, the response is nonlinear. The main peak intensity initially decreases then increases with curing temperature, with 40 °C serving as a transition point. For instance, at 8:2 and 50 °C, the T 2 relaxation time at the primary peak shifts forward, and cumulative porosity increases to a level between those observed at 20 °C and 30 °C, leaning closer to 20 °C. In contrast, at 9:1 and 50 °C, the relaxation time shows minimal forward shift, but the cumulative porosity still increases, approaching that at 30 °C.
These results suggest that moderate temperature improves microstructure densification, while excessive temperature weakens pore refinement, especially when finer particles are scarce at high coarse aggregate ratios.

4. Discussion

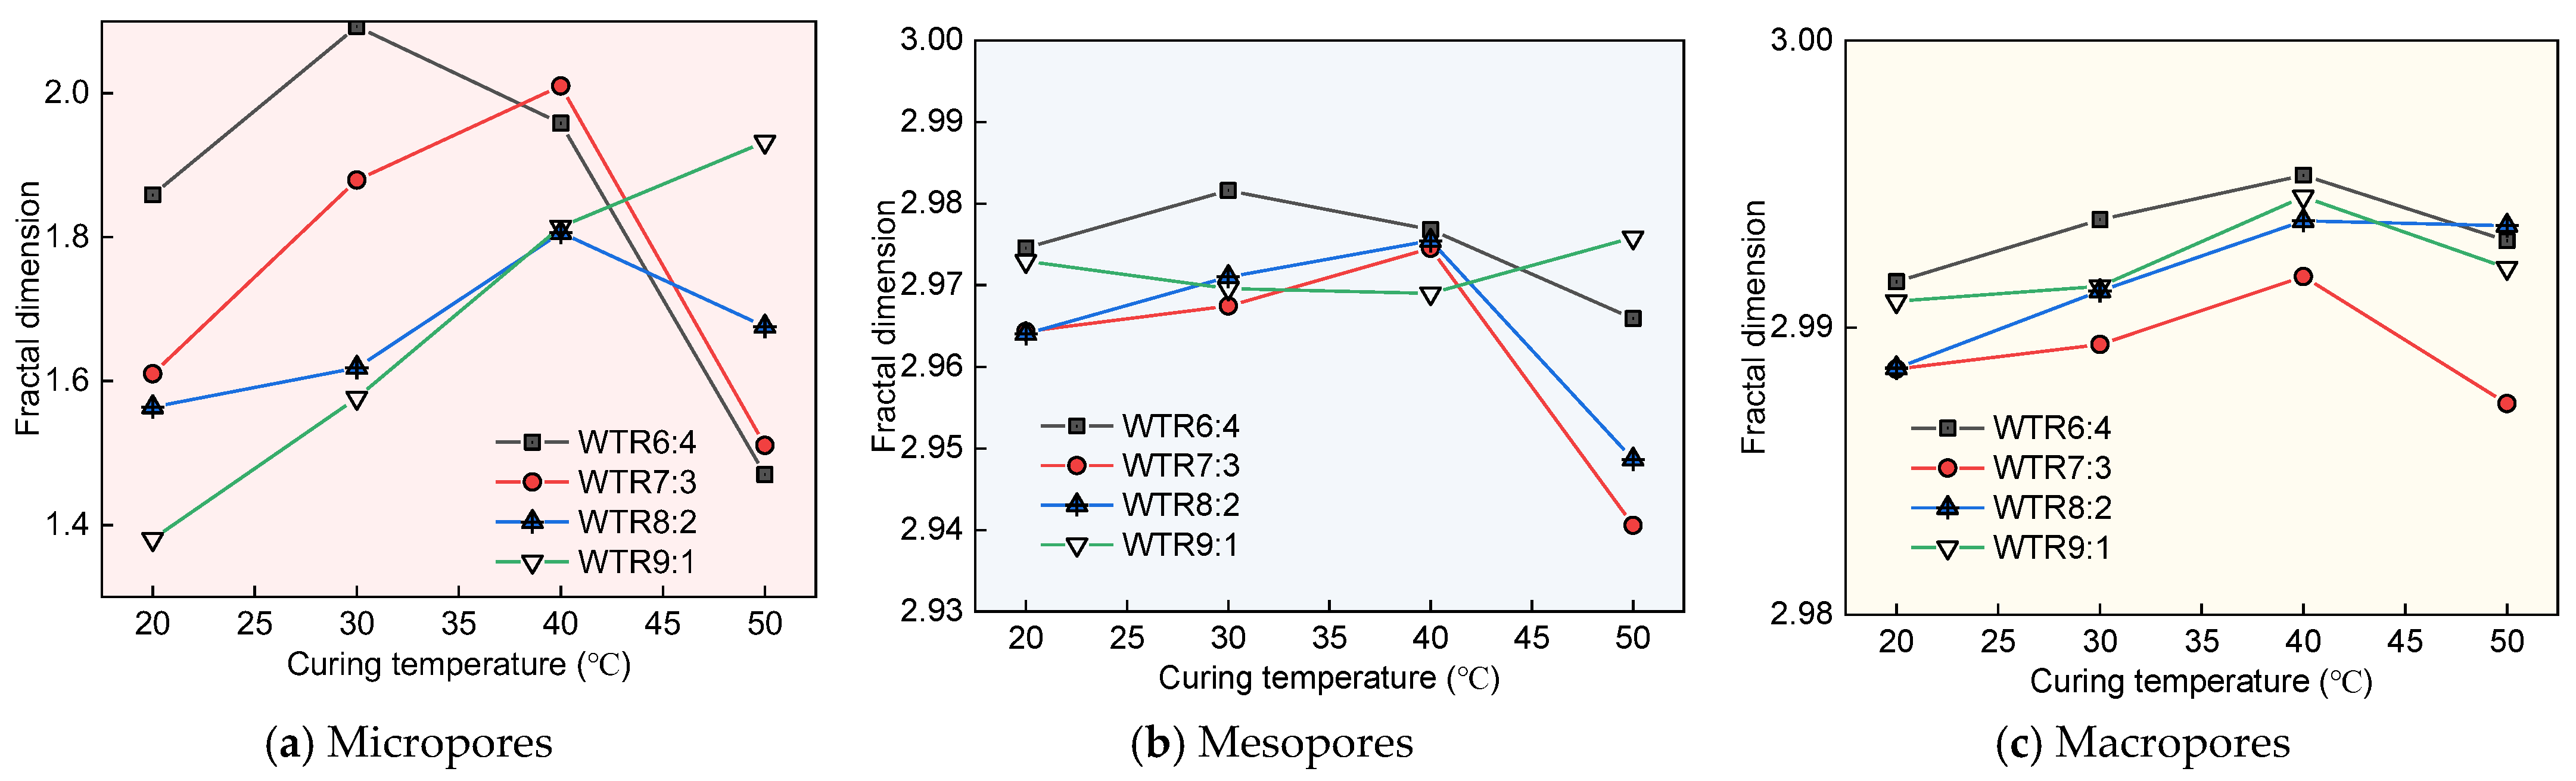
4.1. Fractal Dimension of Pore Structure

To quantitatively describe the geometric complexity of the pore structure across different scales, fractal theory was applied to analyze the NMR T 2 relaxation spectrum. The cumulative pore volume distribution S v in log–log coordinates was used to derive the fractal dimension D , based on the power–law relationship in Equation (10).
Different types of pores were identified from the NMR T 2 spectrum in Figure 7 when the specimen spectrum of porosity component becomes minimum as indicated in [27]. After processing the T 2 spectrum, typically three peaks are identified and the respective T 2 cut-off time is labeled T 2 a , T 2 b , and T 2 c . The different types of pores are denoted as micropores ( T 2 < T 2 a ), mesopores ( T 2 a < T 2 < T 2 b ), and macropores ( T 2 b < T 2 ). Separate regressions were performed for micropores, mesopores, and macropores, allowing the calculation of fractal dimensions D a , D b , and D c .
Figure 8 shows the fractal fitting of log S v log T 2 for 16 backfill specimens. Each subplot corresponds to one specimen, with three fitting segments representing micropores, mesopores, and macropores. The slopes of the linear regressions are used to calculate the fractal dimensions for each pore scale.
Table 2 summaries the fractal fitting parameters. Sample codes follow the format “CTRBXX_YY”, where XX indicates the coarse aggregate content (in percentage) and YY represents the curing temperature (in °C). For example, CTRB91_50: 90% coarse aggregate, 10% fine tailings, cured at 50 °C. The coefficient of determination, R 2 , was used to assess the fitting quality, with most values exceeding 0.90, indicating robust fractal behavior. Figure 9 plots the variation in fractal dimension with curing temperature.
The following is observed from Figure 9:
The D a was found to be the most sensitive indicator of pore structural complexity under varying curing temperatures and aggregate gradations. At a constant WTR, D a typically increased from 20 °C to 40 °C, suggesting enhanced hydration reactions and more refined micropore structures at moderate temperatures. For example, at WTR73, D a increased from 1.61 (20 °C) to 2.01 (40 °C), indicating a significant gain in microstructural complexity. However, as temperature further rose to 50 °C, D a sharply dropped to 1.51, likely due to thermal over-curing, microcracking, or pore coarsening effects that disrupt the gel network.
This nonlinear response indicates that moderate heat can facilitate secondary hydration products and improve particle packing at the microscale, whereas excessive temperature may lead to unstable hydration kinetics and lower structural refinement.
Across all temperature conditions, D a consistently decreased as the proportion of WTR increased from 60% to 90%. For instance, at 30 °C curing, the D a of WTR64 is 2.09, while D a for WTR91 is 1.58. This trend suggests that higher coarse aggregate content reduces the volume fraction of fine particles, thereby limiting gel formation and micropore connectivity. The fine matrix phase is critical in forming a well-interconnected micropore network, and its reduction leads to simpler, less space-filling structures, as reflected in the lower fractal dimension.
Regarding mesopores, D b values are generally high (2.94–2.98), indicating well-connected and space-filling mesopore networks. Slight increases in D b are observed until 20–40 °C, supporting optimal gel development at moderate heat. The effect of coarse aggregate ratio is minor, but at the same temperature, D b in 60–70% aggregate groups slightly exceeds that in 90% group, reflecting better gel continuity in finer mixes.
Regarding macropores, D c values are consistent from 2.99 to 3.00, regardless of temperature or aggregate ratio. This implies that macropores are primarily formed by inter-particle voids among coarse aggregates, which dominate spatial occupation regardless of mix changes.
The hierarchical sensitivity of fractal dimensions follows the order: D a (micropores) > D b (mesopores) > D c (macropores), indicating that finer-scale pores are more susceptible to compositional and environmental factors and serve as key indicators for microstructural complexity modulation.

4.2. Cross-Scale Analysis

Figure 10 shows the Pearson correlation matrix of pore structure parameters, temperature, gradation index, and mechanical properties of CTRB. Blue indicates positive correlations, and red indicates negative correlations. The pore volume fractions of micro-, meso-, and macro-pores are denoted as δ a δ b , and δ c , which are obtained from T 2 spectrum. The detailed calculation method can be found in [43]. The correlation analysis in Figure 10 provided a comprehensive view of the interactions among pore structure parameters and their collective impact on the mechanical behavior of CTRB.
In general, most Pearson correlation coefficients between pore structure parameters, fractal dimensions, curing temperature, and mechanical properties fall within the range of moderate correlation (|r| = 0.4–0.7). Prior to the analysis, the correlation trends among these variables were not known. This exploratory statistical approach helped identify the key factors influencing the mechanical performance. In particular, parameters such as δ a , D a , T 2 a , and D b exhibit relatively strong correlations ( | r | > 0.7) with both UCS and E, suggesting that pore size distribution and relaxation characteristics play a crucial role in strength development under thermal curing conditions. These findings highlight the necessity of multi-variable coupling analysis to better understand the microstructure–mechanical property relationships in cemented backfill materials.
The correlation analysis revealed significant interdependencies among pore structure characteristics derived from NMR measurements, including pore volume fractions ( δ a , δ b , δ c ), T 2 cutoff ( T 2 a , T 2 b , T 2 c ), and fractal dimensions ( D a , D b , D c ). A strong positive correlation was observed between T 2 a and D a ( R = 0.91), indicating that micropore size is closely linked to its geometric complexity at the same scale. Similar positive correlations existed between T 2 b and D b , and between δ a and T 2 a ( R = 0.71), confirming that increased pore volume is generally associated with larger pore size and complex geometry. Conversely, δ c (macropore content) exhibited a strong negative correlation with D c ( R = −0.53), implying that as macropore volume decreases, their spatial distribution becomes more irregular and complex—possibly due to fragmentation or closure of macropores.
In terms of mechanical properties, the UCS was significantly and negatively correlated with δ a (R = −0.87), δ b (−0.81), and δ c (−0.68), indicating that excessive pore volume at any scale detrimentally affects mechanical stability. By contrast, UCS exhibited a moderate positive correlation with D a ( R = 0.43), suggesting that increased micropore complexity enhances load-bearing capacity by promoting structural continuity and internal cohesion. Additionally, UCS was positively correlated with curing temperature ( T , R = 0.67), which in turn was moderately correlated with D a , indicating that elevated temperatures refine micropore geometry through enhanced hydration kinetics.
Overall, these findings support a comprehensive microstructure–strength mechanism in which reduced total porosity, small pore diameters, and increased pore complexity, especially in the micropore range, collectively enhance the mechanical performance of CTRB. The strong internal correlations among δ , T 2 , and D across all pore scales further validate the use of NMR-based fractal analysis as a powerful tool for evaluating and engineering pore structure evolution under different curing conditions.

4.3. Interdependency Between Fractal Dimensions and Pore Structure Indicators

Figure 11 shows the correlation plots between fractal dimensions and other pore structure parameters. Each subplot includes Pearson correlation coefficient ( R ) and p-value. The results reveal strong internal coupling, indicating that fractal complexity is closely linked to pore size and content at multiple scales.
The scatter plots clearly demonstrate strong internal coupling between fractal dimensions and key NMR-derived pore structure parameters. These correlations provide strong evidence that fractal dimensions across all pore scales reflect coherent structural evolution mechanisms within the backfill.
For the micropore system, the fractal dimension D a showed an exceptionally strong positive correlation with the micropore diameter (R = 0.91, p < 0.00001), and moderate correlations with both mesopore diameter (R = 0.67) and volume fraction (R = 0.54). This indicates that greater micropore geometric complexity is associated with larger micropore size and increased mesopore content, which highlights a multi-scale structural refinement mechanism under thermal variation.
Similarly, the fractal dimension, D b , exhibited strong correlations with both size of micropore and mesopores (R = 0.69 and R = 0.71, respectively), as well as with volume fraction of micropore (R = 0.56), confirming that increased mesopore complexity occurs concurrently with pore coarsening and redistribution across scales. Interestingly, D c was positively associated with T 2 a and D b (R = 0.5 for both) but negatively correlated with δ c (macropore content, R = −0.53, p = 0.036). This suggests that as the volume of large pores decreases, their spatial distribution becomes more complex and fragmented—likely reflecting microcrack closure, secondary hydration, or internal stress-driven pore collapse.

4.4. Microstructural Control Pathways on Strength

To establish a quantitative understanding of how pore structural characteristics, curing condition and gradation index influence the mechanical performance of CTRB. Figure 12 shows the Pearson correlation-based sensitivity ranking for UCS and E with respect to each pore structure-related variable, curing condition, and gradation index.
Among all parameters, the most positively correlated with UCS were curing temperature T (R = 0.67) and the macropore fractal dimension D c (R ≈ 0.43), indicating that enhanced stiffness, thermal activation, and macropore refinement significantly contribute to strength gain. Notably, the pore contents exhibited progressively stronger negative effects, with δ a being the most detrimental (R = −0.87). A nearly identical trend was observed for E, which was most positively correlated with T, and negatively influenced by all pore volume and T 2 indicators.
To further evaluate the quantitative influence of pore-scale features on mechanical performance, multiple linear regression (MLR) models were constructed for both UCS and E , based on the six most influential variables identified in the correlation ranking. The multivariate linear regression model used in this study is defined as
y = β 0 + β 1 x 1 + β 2 x 2 + β 3 x 3 + β 4 x 4 + β 5 x 5 + β 6 x 6
where y represents the response variable (either UCS or E ), β 0 is the intercept, and β 1 to β 6 are the regression coefficients. For the UCS model, the predictors included curing temperature ( T ), macropore fractal dimension ( D c ), macropore T 2 cutoff ( T 2 c ), and the volume fractions of micropores ( δ a ), mesopores ( δ b ), and macropores ( δ c ). For the E model, the predictors are basically same except the D c becoming T 2 c .
All predictor variables were normalized using the Z-score method, which standardizes each variable to have a mean of zero and a standard deviation of one. The transformation is defined as follows:
Z i = X i μ σ
where Z i is the standardized value of the original variable X i , μ is the sample mean, and σ is the standard deviation. This normalization ensures that variables with different units and scales can be compared directly and the corresponding μ ad σ are presented in Table 3.
The results of multivariate linear regression model are shown in Table 4. The inverse sign of D c in the two models is particularly noteworthy, as it suggests a potential trade-off between compressive strength enhancement and stiffness reduction caused by increased macropore complexity.
Figure 13 compares the predicted and measured values of UCS and E using the developed multivariate regression models. Both models exhibited excellent goodness-of-fit, with coefficients of determination R 2 of 0.99 for UCS and 0.98 for E , respectively, which demonstrate near 1:1 agreement between predicted and actual values across the full data range. These results confirm that the selected parameters (T, T 2 , δ , D ) collectively capture the essential features governing mechanical behavior in CTRB.
Table 2 indicated that the UCS and E share similar structural determinants: lower total porosity, reduced pore size, and increased spatial complexity. Figure 14 shows the correlation between UCS and E . UCS and E exhibit an exceptionally strong linear relationship, with a coefficient of determination = 0.98 and a slope of 0.018.
This high level of correlation suggests that both parameters are not only interrelated but also respond similarly to variations in pore structure—particularly porosity distribution and fractal geometry. These findings reinforce the conclusion that strength and stiffness in CTRB are governed by coupled microstructural mechanisms rather than isolated variables.
It is noteworthy that the regression model aims to explore the combined influence of key microstructural parameters on mechanical properties. While not intended for direct field application, it offers useful insight into the relative importance of each factor. Future work will focus on simplifying the model through variable selection or dimensionality reduction to improve its practical applicability as well as focus on optimizing these key parameters—identified through the model—in order to regulate pore structure and improve the quality and strength of cemented backfill materials.

5. Conclusions

This study investigated the multiscale pore structure evolution and its coupling relationship with mechanical behavior in cemented tailings backfill (CTRB) using low-field nuclear magnetic resonance (NMR) and fractal theory. Based on systematic experiments across different waste rock-to-tailings ratios (WTR) and curing temperatures, the following conclusions can be drawn:
  • The mechanical performance and pore structure of CTRB are strongly influenced by the combined effect of aggregate gradation and curing temperature. Optimal performance is achieved at WTRs of 60–80% and curing temperatures between 20 °C and 40 °C, while excessive curing temperature (50 °C) leads to structural degradation and reduced strength;
  • The hierarchical sensitivity of fractal dimensions follows the order: Da (micropores) > Db (mesopores) > Dc (macropores), indicating that finer pores are more responsive to compositional and environmental changes, and serve as key indicators of microstructural complexity;
  • The fine matrix phase plays a critical role in forming a well-connected micropore network. An increase in coarse aggregate content reduces this matrix, leading to simpler, less space-filling structures with lower fractal dimensions and weaker mechanical performance;
  • A nonlinear thermal response was observed: moderate heat promotes secondary hydration products and enhances particle packing, whereas excessive temperature causes hydration instability, microcracking, and coarsened pore structure;
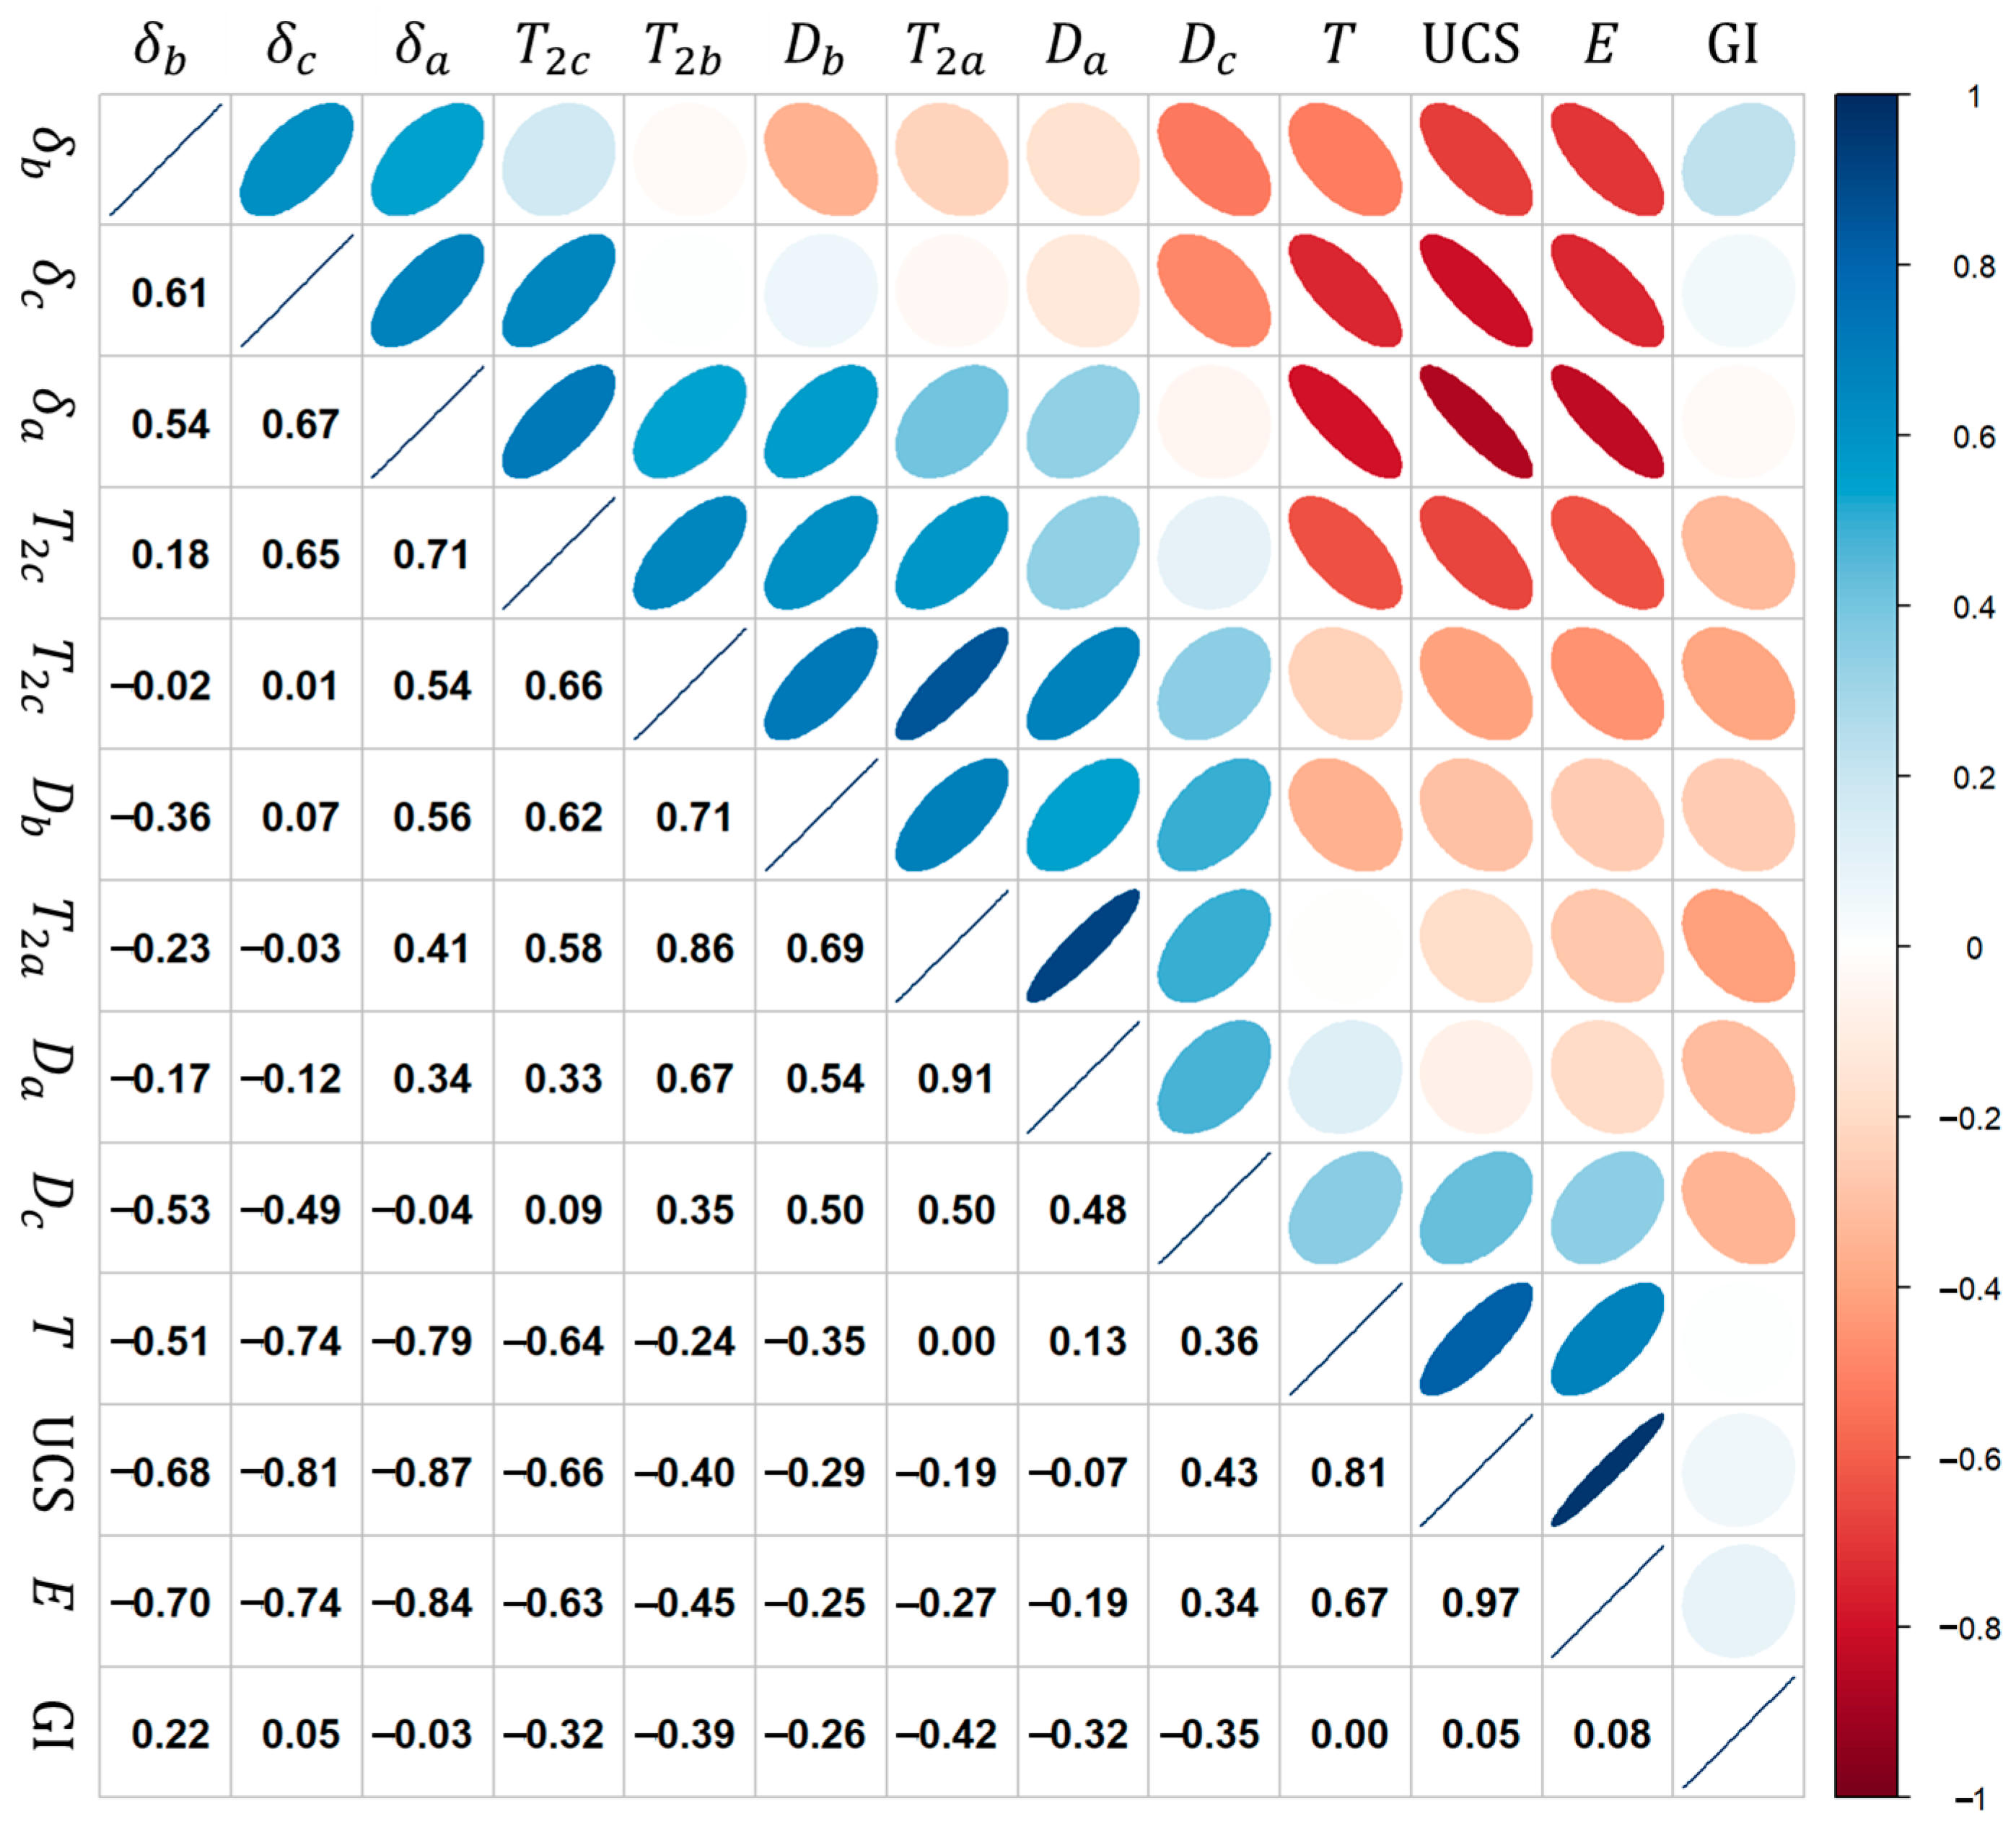
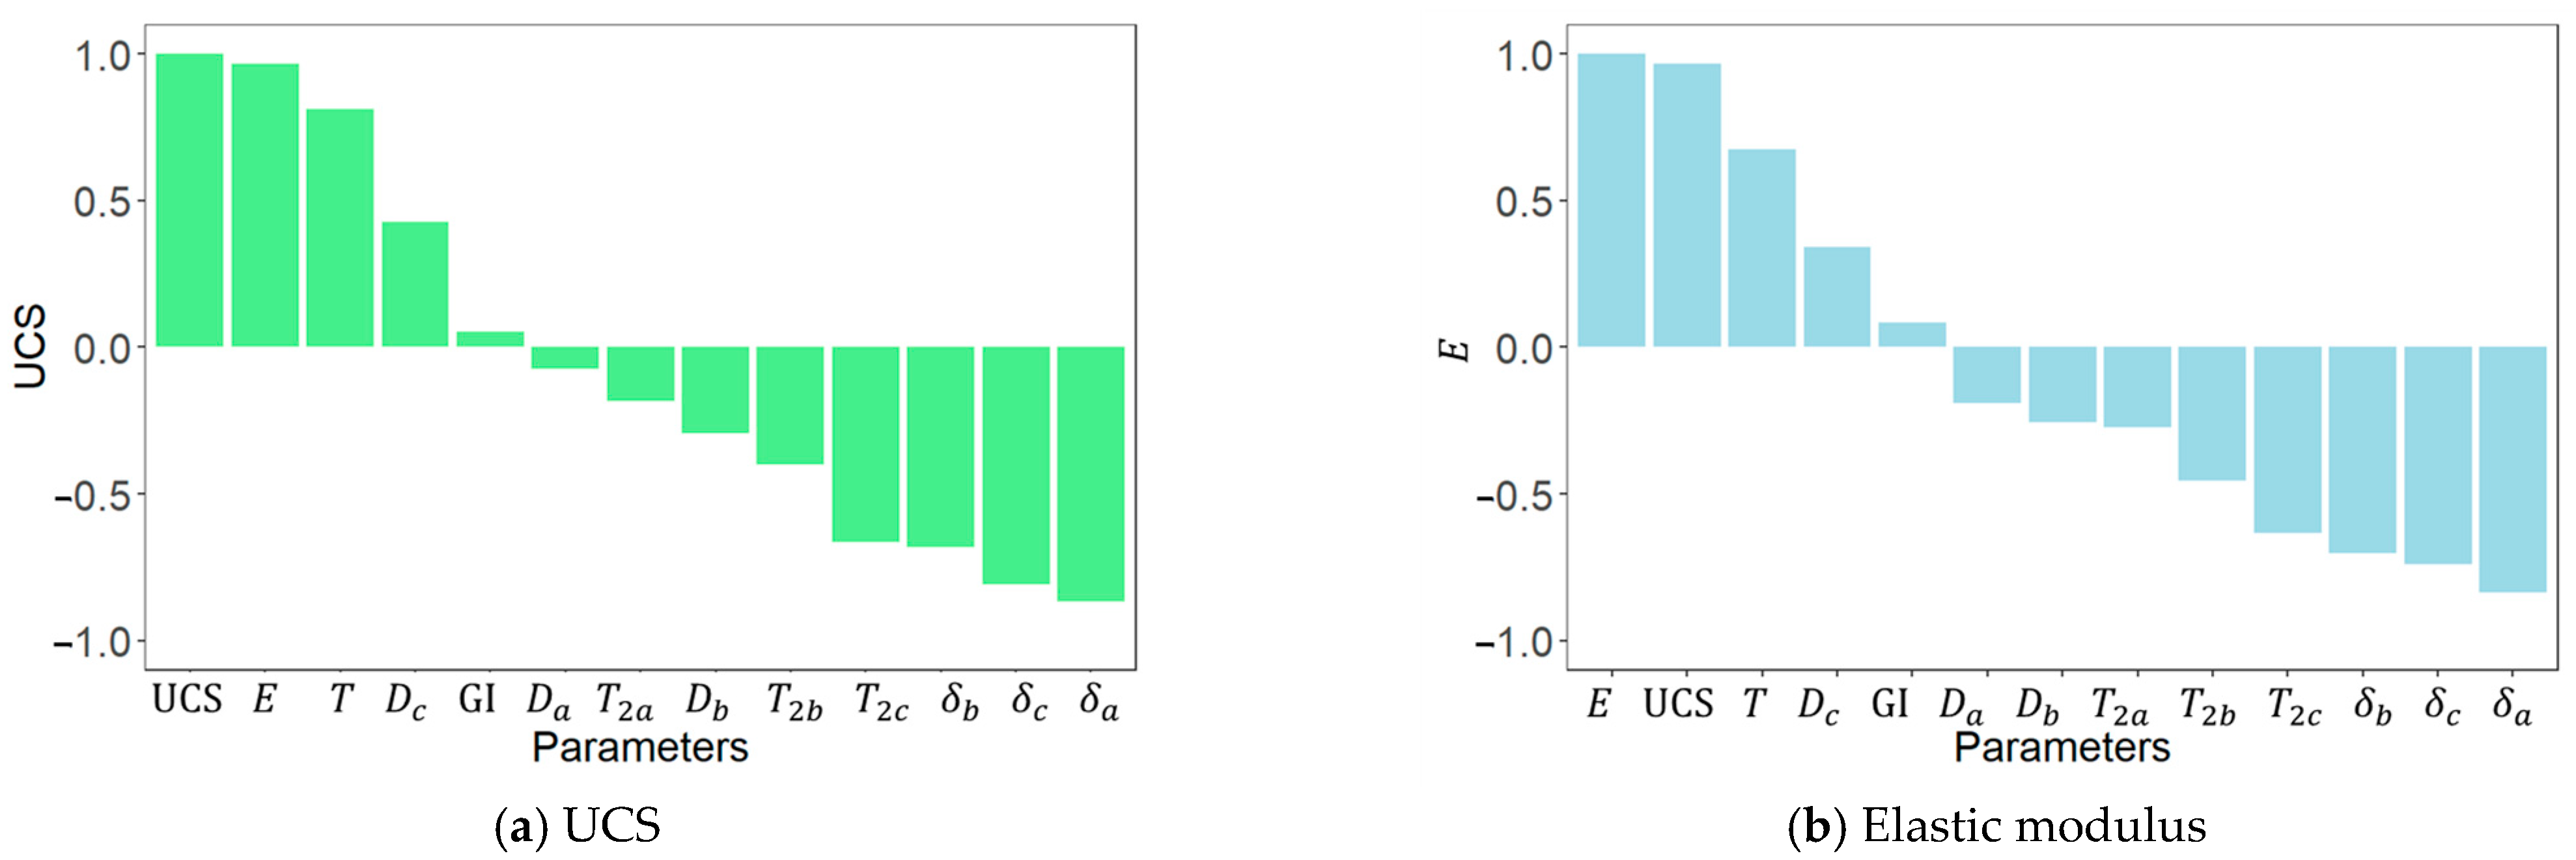
  • Pore volume fractions at all scales (δa, δb, δc) exhibit strong negative correlations with both UCS and E, with micropores showing the highest impact (R = −0.87). Reduced porosity and more compact pore structure significantly improve quality of backfill material through better particle packing, denser microstructure, and improved stress transfer;
  • Strong internal correlations were identified between NMR-derived pore size, relaxation time, fractal dimension, and porosity, validating the utility of fractal theory as a reliable descriptor for pore structure evolution in cemented materials;
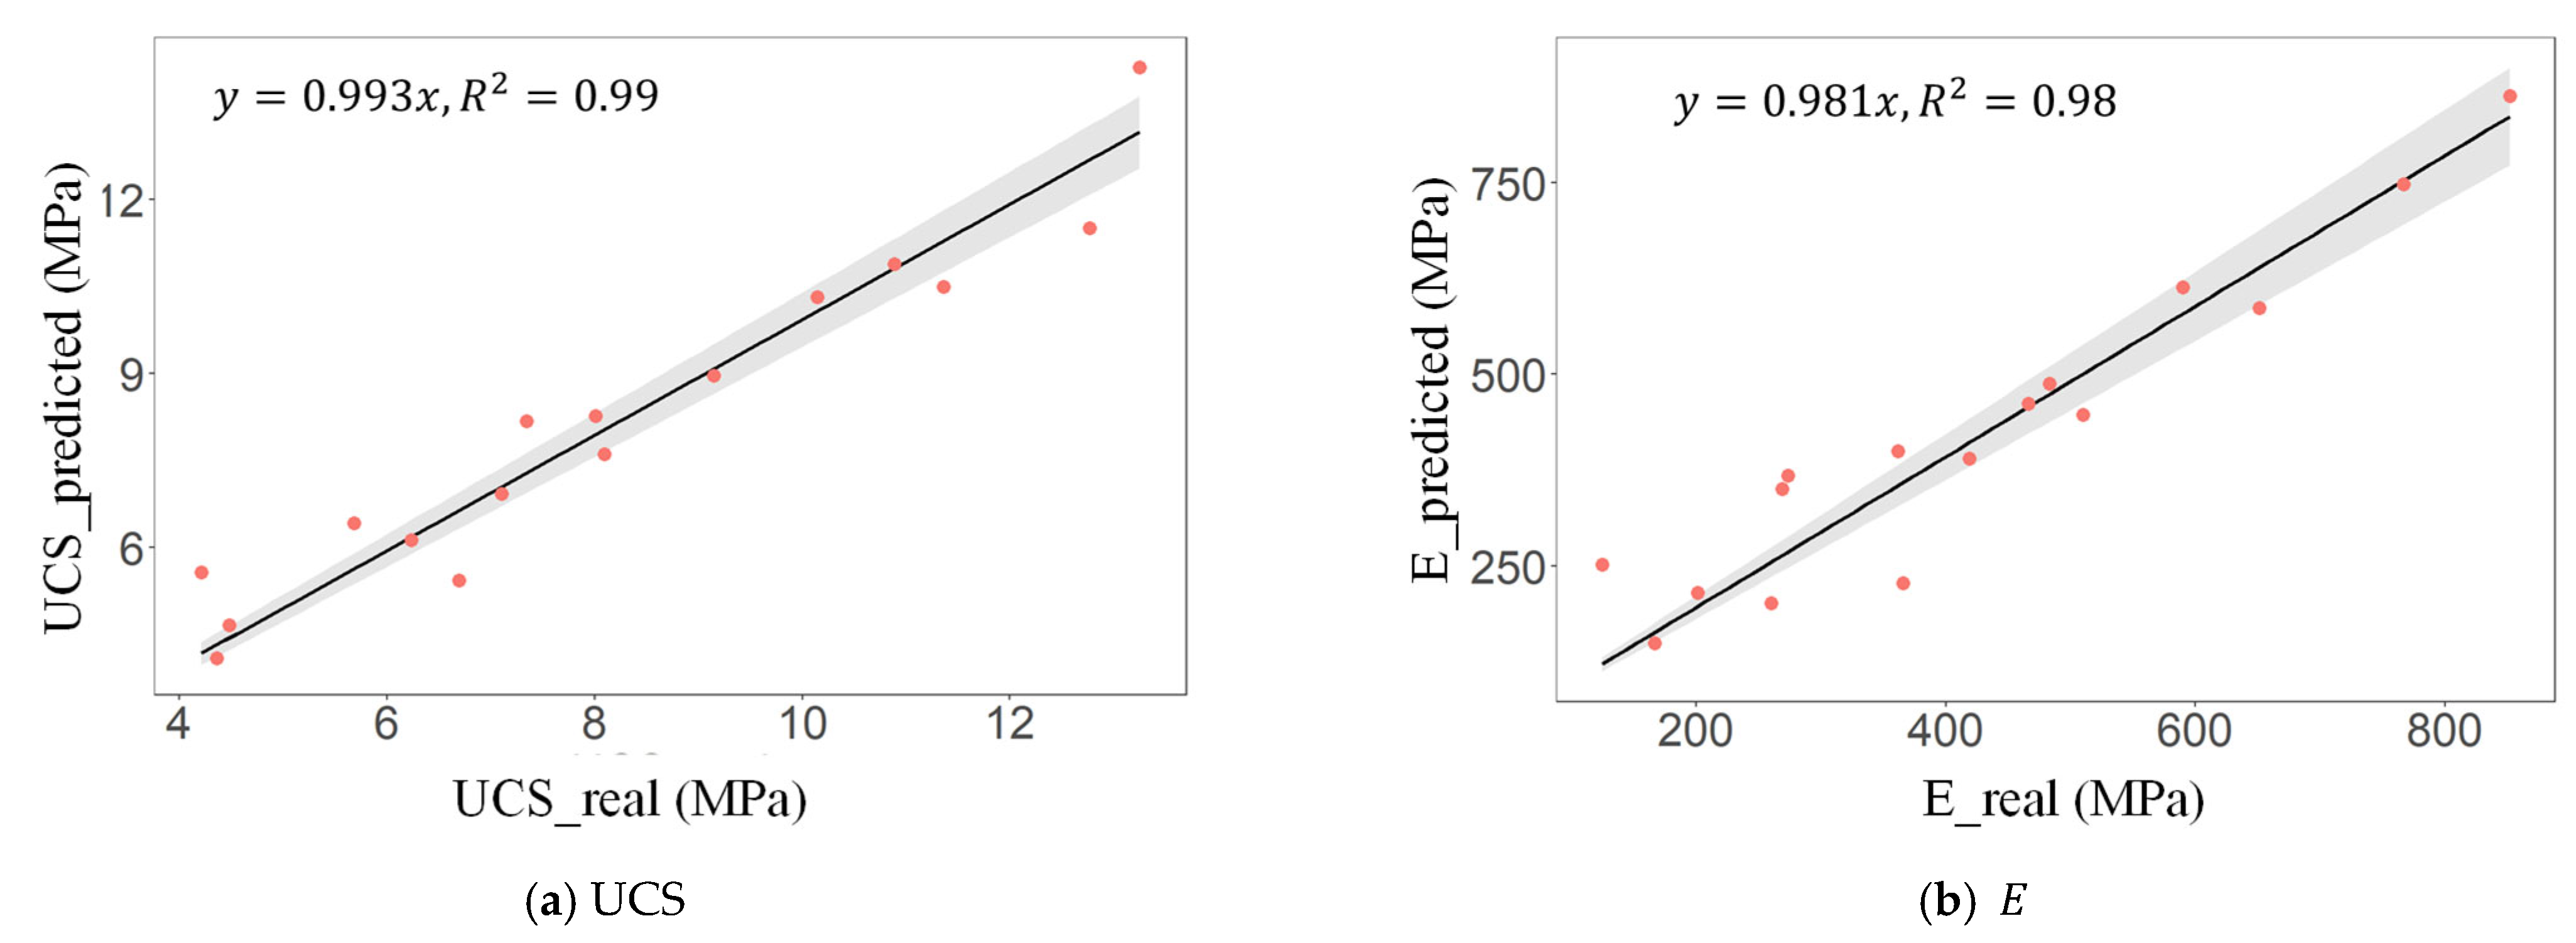
  • Multiple linear regression models incorporating six key variables achieved excellent predictive accuracy (R2 = 0.99 for UCS; R2 = 0.98 for E), confirming the effectiveness of microstructure-based modeling in predicting CTRB mechanical behavior;
The findings offer theoretical insights and practical design parameters for optimizing mine backfill systems. By quantifying the influence of microstructural attributes on macroscopic strength, this study provides a scientific basis for microstructure-oriented design and deep mine filling strategies.
However, this study did not consider the effects of curing time, different types of tailings (which may have varying chemical compositions and temperature sensitivities), cement types, or alternative mix proportions. These factors could also significantly influence the pore structure evolution and mechanical behavior of cemented tailings backfill. Future work will explore the effects of cement type and curing time on pore structure evolution and further optimize mix design based on the multi-linear regression results to improve the quality and strength of cemented backfill.

Author Contributions

Conceptualization, K.Z.; methodology, J.Q. and X.X.; software, J.Q.; investigation, J.Q. and X.X.; data curation, J.Q.; writing—original draft, J.Q.; writing—review and editing, X.X.; supervision, K.Z.; funding acquisition, K.Z. All authors have read and agreed to the published version of the manuscript.

Funding

This work was supported by the Guangxi Key Research and Development Program of China (Grant No. 2024AD47009).

Data Availability Statement

The original contributions presented in this study are included in the article. Further inquiries can be directed to the corresponding author(s).

Conflicts of Interest

The authors declare no conflicts of interest.

References

  1. Huang, J.; Wu, C.; Huang, N.; Deng, L.; Zhu, D. Utilization of Waste Rock from a Low-Carbon Perspective: Mechanical Performance Analysis of Waste Rock-Cemented Tailings Backfill. J. CO2 Util. 2025, 94, 103058. [Google Scholar] [CrossRef]
  2. Li, J.; Cao, S.; Song, W.; Sun, L. Visualization and Quantification of Pore Structure in Cement Tailings Waste Rock Composites Using X-Ray Computed Tomography and Deep Learning. Constr. Build. Mater. 2025, 476, 141341. [Google Scholar] [CrossRef]
  3. Zhu, T.; Chen, Z.; Wang, Z.; Cao, J.; Hao, J.; Zhou, Z. Energy Damage Evolution and Mesoscopic Failure Mechanism of Cemented Waste Rock Tailing Backfill under Axial Compression. Structures 2025, 71, 108057. [Google Scholar] [CrossRef]
  4. Gao, T.; Wu, A.; Wang, S.; Ruan, Z.; Chen, C.; Sun, W. Experimental and Numerical Investigations of Bending Mechanical Properties and Fracture Characteristics of Cemented Tailings-Waste Rock Backfill under Three-Point Bending. Constr. Build. Mater. 2024, 447, 138149. [Google Scholar] [CrossRef]
  5. Wang, B.; Kang, M.; Liu, C.; Yang, L.; Li, Q.; Zhou, S. Experimental Study on Mechanical and Microstructure Properties of Cemented Tailings-Waste Rock Backfill with Continuous Gradation. J. Build. Eng. 2024, 95, 110146. [Google Scholar] [CrossRef]
  6. Yin, S.; Zeng, J.; Yan, Z.; Wang, L.; Chen, W.; Chen, D.; Yang, J. Damage Constitutive Models and Damage Evolution of Cemented Tailings and Waste-Rock Backfill under Impact Loading. Constr. Build. Mater. 2025, 460, 139838. [Google Scholar] [CrossRef]
  7. Liu, S.; Wu, W.; Sun, X.; Tian, H.; Li, J.; Zhou, R.; Dembele, B.D.; Shen, X. Investigation of Temperature and Humidity Impact on Thermal Comfort in Deep Underground Tunnel during Construction in Hot Climate: A Case Study in an Underground Hydropower Station. Tunn. Undergr. Space Technol. 2025, 162, 106669. [Google Scholar] [CrossRef]
  8. Wang, X.; Wang, Y.; Lai, X.; Wang, G.; Sang, C. Investigation of Heat Stress and Thermal Response in Deep Hot-Humid Underground Environments: A Field and Experimental Study. Build. Environ. 2025, 270, 112506. [Google Scholar] [CrossRef]
  9. Yan, R.; Yin, S.; Zhang, H.; Wang, L.; Chen, D. Effect of Superplasticizer on the Setting Behaviors and Mechanical Properties of Tailings-Waste Rock Cemented Paste Backfills. Case Stud. Constr. Mater. 2023, 18, e01714. [Google Scholar] [CrossRef]
  10. Zhu, T.; Chen, Z.; Cao, J.; Nian, G.; Zhang, L.; Hao, J.; Zhou, Z. Investigation of the Fracture Behavior of Cemented Waste Rock-Tailing Backfill by Digital Image Correlation Technique and Discrete Element Modeling. Constr. Build. Mater. 2024, 428, 136367. [Google Scholar] [CrossRef]
  11. Zhu, T.; Chen, Z.; Wang, Z.; Cao, J.; Hao, J.; Zhou, Z. Experimental and DEM Analyses of Type I Fracture Characteristics of Waste Rock Aggregate Reinforced Cemented Tailing Backfill. Theor. Appl. Fract. Mech. 2025, 135, 104764. [Google Scholar] [CrossRef]
  12. Zhang, S.; Sun, W.; Hou, Z.; Wu, A.; Li, Z.; Wang, S.; Jiang, M.; Liu, Z. Research on Damage and Crack Evolution Mechanism of Backfill under the Coupling Effect of Layer-Inclined Angle-Pore Triple Defect Structure. Constr. Build. Mater. 2024, 444, 137793. [Google Scholar] [CrossRef]
  13. Li, Y.; Fu, J.; Wang, K.; He, Z. Influence of Shell Ash on Pore Structure and Mechanical Characteristics of Cemented Tailings Backfill. Constr. Build. Mater. 2024, 411, 134473. [Google Scholar] [CrossRef]
  14. Li, J.; Liu, H.; Ai, K.; Zhu, L. An NMR-Based Experimental Study on the Pore Structure of the Hydration Process of Mine Filling Slurry. Adv. Civ. Eng. 2018, 2018, 4720356. [Google Scholar] [CrossRef]
  15. Zhou, A.; Qian, R.; Miao, G.; Zhang, Y.; Xue, C.; Zhang, Y.; Qiao, H.; Shi, J. Gas Permeability Characteristics of Granite-Manufactured Sand Concrete and Its Numerical Simulation Using NMR-MIP Modified Method. Constr. Build. Mater. 2024, 431, 136520. [Google Scholar] [CrossRef]
  16. Wang, D.; Zhang, H.; Chen, P.; Ju, Y.; Guo, P. Study on Freeze-Thaw Resistance and Pore Structure Deterioration of Fly Ash Reactive Powder Concrete Based on Low-Field NMR Relaxation. Case Stud. Constr. Mater. 2025, 22, e04334. [Google Scholar] [CrossRef]
  17. Gao, H.; Zhai, Y.; Wei, S. Research on Compressive Failure and Damage Mechanism of Concrete-Granite Composites with Different Roughness Coefficient by NMR and DIC Techniques. Eng. Fail. Anal. 2025, 170, 109291. [Google Scholar] [CrossRef]
  18. Abdo, S.; Phung, Q.T.; Caspeele, R.; Seetharam, S.C.; Wan-Wendner, R. Microstructure Evolution, Hydration Kinetics and Development of the Mechanical and Transport Properties of a Lining Concrete at Ambient Temperature. Constr. Build. Mater. 2025, 472, 140959. [Google Scholar] [CrossRef]
  19. Xu, W.; Zhang, Y.; Zhang, Y.; Wang, Q.; Li, Y. Prediction of Temperature Distribution in Manufactured Sand Concrete Based on Hydration-Temperature Coupling Model. J. Build. Eng. 2025, 101, 111961. [Google Scholar] [CrossRef]
  20. Zhao, Z.; Hu, Y.; Zhao, Z.; Liu, Y.; Xie, C.; Hu, Z. Effect of Curing Temperature on the Hydration Process of Carbon Nanotubes Modified Face Slab Concrete at the Ultra-Early Age. Mater. Lett. 2025, 394, 138633. [Google Scholar] [CrossRef]
  21. Aminossadati, S.M.; Mohammed, N.M.; Shemshad, J. Distributed Temperature Measurements Using Optical Fibre Technology in an Underground Mine Environment. Tunn. Undergr. Space Technol. 2010, 25, 220–229. [Google Scholar] [CrossRef]
  22. Wang, Z.; Wang, Y.; Dino, G.A.; Zhang, L.; Ruan, Z.; Zhang, M.; Li, J.; Wu, A. Degradation of Hemihydrate Phosphogypsum-Based Backfill in Underground Mining: Mechanical and Microstructural Insights on the Effects of pH and Temperature of Mine Water. Process Saf. Environ. Prot. 2025, 193, 272–285. [Google Scholar] [CrossRef]
  23. Gao, R.; Wang, W.; Xiong, X.; Li, J.; Xu, C. Effect of Curing Temperature on the Mechanical Properties and Pore Structure of Cemented Backfill Materials with Waste Rock-Tailings. Constr. Build. Mater. 2023, 409, 133850. [Google Scholar] [CrossRef]
  24. Zhang, P.; Gao, Z.; Shi, Y.; Lin, Y.; Li, J. Effect of Large Broken Stone Content on Properties of Roller Compacted Concrete Based on Fractal Theory. Constr. Build. Mater. 2020, 262, 120821. [Google Scholar] [CrossRef]
  25. Dong, W.; Wang, J. Research on Capillary Water Absorption Characteristics of Aeolian Sand Concrete under Sulfate Freeze-Thaw Coupling Based on Fractal Theory. Constr. Build. Mater. 2024, 455, 139184. [Google Scholar] [CrossRef]
  26. Su, H.; Zhu, Z.; Jia, W.; Li, T.; Cheng, Z.; Xiang, H. Analysis of Fractal and Energy Characteristics of Low-Temperature Concrete under an Impact Load. Cold Reg. Sci. Technol. 2025, 235, 104493. [Google Scholar] [CrossRef]
  27. Hu, J.; Ren, Q.; Yang, D.; Ma, S.; Shang, J.; Ding, X.; Luo, Z. Cross-Scale Characteristics of Backfill Material Using NMR and Fractal Theory. Trans. Nonferrous Met. Soc. China 2020, 30, 1347–1363. [Google Scholar] [CrossRef]
  28. GB/T 50123-2019; Standard for Soil Test Methods. China Institute of Water Resources and Hydropower Research and Design, Ministry of Water Resources. Nanjing Hydraulic Research Institute: Beijing, China, 2019.
  29. GB/T51450-2022; Technical Standard for Backfill Eengineering in Metal and Non-Metal Mines. China Planning Press Co., Ltd.: Beijing, China, 2022.
  30. Ren, Q.; Pacheco, J.; De Brito, J. Methods for the Modelling of Concrete Mesostructures: A Critical Review. Constr. Build. Mater. 2023, 408, 133570. [Google Scholar] [CrossRef]
  31. Fuller William, B.; Thompson Sanford, E. The Laws of Proportioning Concrete. Trans. Am. Soc. Civ. Eng. 1907, 59, 67–143. [Google Scholar] [CrossRef]
  32. Tashman, L.; Masad, E.; Peterson, B.; Saleh, H. Internal Structure Analysis of Asphalt Mixes to Improve the Simulation of Superpave Gyratory Compaction to Field Conditions. In Proceedings of the Journal of the Association of Asphalt Paving Technologists, Clearwater Beach, FL, USA, 19–20 March 2001; Volume 70. [Google Scholar]
  33. Talbot, A.N.; Richart, F.E. The Strength of Concrete, Its Relation to the Cement Aggregates and Water; University of Illinois, Engineering Experiment Station, Bulletin no. 137; University of Illinois at Urbana Champaign, College of Engineering. Engineering Experiment Station: Champaign, IL, USA, 1923. [Google Scholar]
  34. Wu, D.; Guo, W.; Luo, F.; Li, M. Simulation Experimental Investigations on Particle Breakage Mechanism and Fractal Characteristics of Mixed Size Gangue Backfill Materials. J. Mater. Res. Technol. 2023, 24, 125–142. [Google Scholar] [CrossRef]
  35. Hu, J.; Ding, X.; Ren, Q.; Luo, Z.; Jiang, Q. Effect of Incorporating Waste Limestone Powder into Solid Waste Cemented Paste Backfill Material. Appl. Sci. 2019, 9, 2076. [Google Scholar] [CrossRef]
  36. Hu, J.; Ren, Q.; Ding, X.; Jiang, Q. Trans-Scale Relationship Analysis between the Pore Structure and Macro Parameters of Backfill and Slurry. R. Soc. Open Sci. 2019, 6, 190389. [Google Scholar] [CrossRef] [PubMed]
  37. BS EN 12390-3; Testing Hardened Concrete—Compressive Strength of Test Specimens. BSI: London, UK, 2002.
  38. Li, B.; Zhang, W.; Xue, Y.; Li, Z.; Kong, F.; Kong, R.; Wang, G. Approach to Characterize Rock Fracture Surface: Insight from Roughness and Fractal Dimension. Eng. Geol. 2023, 325, 107302. [Google Scholar] [CrossRef]
  39. Yin, Y.; Ren, Q.; Lei, S.; Zhou, J.; Xu, L.; Wang, T. Mesoscopic Crack Pattern Fractal Dimension-Based Concrete Damage Identification. Eng. Fract. Mech. 2024, 296, 109829. [Google Scholar] [CrossRef]
  40. Zhou, S.; Wu, C.; Li, J.; Shi, Y.; Luo, M.; Guo, K. Study on the Influence of Fractal Dimension and Size Effect of Coarse Aggregate on the Frost Resistance of Hydraulic Concrete. Constr. Build. Mater. 2024, 431, 136526. [Google Scholar] [CrossRef]
  41. Luo, T.; Hua, C.; Li, L.; Zhang, T.; Lu, X.; Li, L.G.; Mostafa, S.A. The Effect of Micro Silica Fume (MSF) Content on Pore Fractal Dimension (PFD) and Mechanical Properties of Self-Consolidating Concrete. Case Stud. Constr. Mater. 2024, 21, e04065. [Google Scholar] [CrossRef]
  42. International Federation for Structural Concrete. Model Code Fib Model Code for Concrete Structures 2010; International Federation for Structural Concrete: Lausanne, Switzerland, 2010; ISBN 978-3-433-03061-5. Available online: https://www.ernst-und-sohn.de/index.php?q=en/fib-model-code-for-concrete-structures-2010 (accessed on 3 June 2025).
  43. Jiang, Z.; Cai, G.; Liu, Y.; Wang, P.; Yu, S. Pore Structure and Mechanical Characteristics of CRS Mortar Based on NMR and Fractal Theory. Constr. Build. Mater. 2024, 457, 139459. [Google Scholar] [CrossRef]
Figure 1. Chemical composition of tailings and waste rock.
Fractalfract 09 00367 g001
Figure 2. Particle size distribution of raw materials.
Fractalfract 09 00367 g002
Figure 3. Cumulative percentage and respective gradation index of CTRB with different waste rock-to-tailings ratios. (a) Particles size distribution and (b) Gradation index.
Fractalfract 09 00367 g003
Figure 4. Illustration of experimental procedures.
Fractalfract 09 00367 g004
Figure 5. Stress strain relations of CTRB with different WTR and curing temperature. (a) 20 °C, (b) 30 °C, (c) 40 °C and (d) 50 °C.
Fractalfract 09 00367 g005aFractalfract 09 00367 g005b
Figure 6. Variation in UCS and elastic modulus with curing temperature. (a) UCS and (b) Elastic modulus.
Fractalfract 09 00367 g006
Figure 7. T 2 spectrum distributions of porosity component and accumulative porosity regarding CTRB with different temperature and waste rock-tailings ratio. (a) WTR6:4, (b) WTR7:3, (c) WTR8:2 and (d) WTR9:1.
Fractalfract 09 00367 g007aFractalfract 09 00367 g007b
Figure 8. Illustration of the fractal dimension regarding micropore, mesopore, and macropore (with magnification for last two types of pore) for CTRB with different temperature and cemented tailings ratio. (a) WTR6:4, (b) WTR7:3, (c) WTR8:2 and (d) WTR9:1.
Fractalfract 09 00367 g008aFractalfract 09 00367 g008b
Figure 9. Fractal dimension of CTRB, respective for micropores, mesopores, and macropores. (a) Micropores, (b) Mesopores and (c) Macropores.
Fractalfract 09 00367 g009
Figure 10. Pearson correlation matrix of pore structure parameters, fractal dimensions, curing condition, and mechanical properties (Red and bule shades represent positive and negative correlations, respectively. The eccentricity of the ellipse corresponds to the magnitude of the correlation coefficient).
Fractalfract 09 00367 g010
Figure 11. Correlation of fractal dimension and pore structure parameters.
Fractalfract 09 00367 g011
Figure 12. Correlation coefficients between each pore structure-related variable and (a) UCS, and (b) elastic modulus (E).
Fractalfract 09 00367 g012
Figure 13. Comparison between predicted and measured values of (a) UCS and (b) E using the developed multivariate regression models.
Fractalfract 09 00367 g013
Figure 14. Correlation analysis between UCS and E.
Fractalfract 09 00367 g014
Table 1. Fitted equations for UCS and elastic modulus.
WTR T ( )UCS (MPa)Elastic Modulus (MPa)
Equation R 2 ξ Equation R 2
6:420 ≤ T < 50 U C S = 1.82 e T 25.44 0.977.16 U C S = 27.44 e T 14.64 0.97
7:320 ≤ T < 50 U C S = 2.83 e T 36.20 0.954.99 U C S = 121.12 e T 30.73 0.87
8:220 ≤ T < 40 U C S = 1.76 e T 21.42 0.997.67 U C S = 78.60 e T 18.79 0.97
40 ≤ T U C S = 0.12 t + 16.24 1−1.07 U C S = 18.49 t + 1390.91 1
9:120 ≤ T < 40 U C S = 2.37 e T 23.88 0.996.24 U C S = 111.66 e T 20.62 0.97
40 ≤ T U C S = 0.54 t + 34.47 1−4.25 U C S = 49.32 t + 2739.83 1
Table 2. Fractal fitting parameters derived from NMR T 2 spectrum for micropores, mesopores, and macropores.
GroupsMicropores Mesopores Macropores
T 2 a
(ms)
b k R 2 D a T 2 b
(ms)
b k R 2 D b T 2 c
(ms)
b k R 2 D c
CTRB64_204.50−0.451.140.711.8638.72−0.040.030.932.97191.16−0.020.010.992.99
CTRB64_309.66−0.590.910.642.0983.10−0.040.020.932.98289.94−0.010.010.932.99
CTRB64_407.84−0.611.040.661.9641.50−0.040.020.942.98310.79−0.010.000.753.00
CTRB64_501.70−0.051.530.781.4713.67−0.040.030.982.97102.34−0.010.010.982.99
CTRB73_202.97−0.351.390.731.6127.36−0.060.040.962.96252.35−0.030.010.982.99
CTRB73_304.82−0.471.120.691.8827.36−0.050.030.942.97191.16−0.020.010.982.99
CTRB73_406.37−0.510.990.692.0127.36−0.040.030.912.97144.81−0.020.010.982.99
CTRB73_501.700.001.490.741.5111.90−0.060.060.982.9483.10−0.020.010.982.99
CTRB82_202.58−0.291.440.741.5623.82−0.050.040.962.96252.35−0.030.010.972.99
CTRB82_303.18−0.391.380.731.6227.36−0.040.030.972.97191.16−0.020.010.982.99
CTRB82_404.50−0.471.190.701.8133.70−0.040.020.932.98166.38−0.010.010.982.99
CTRB82_502.10−0.091.320.731.6811.90−0.060.050.982.9577.53−0.010.010.852.99
CTRB91_202.25−0.241.620.741.3829.33−0.040.030.972.97219.64−0.020.010.992.99
CTRB91_302.97−0.381.420.741.5827.36−0.040.030.962.97155.22−0.020.010.982.99
CTRB91_404.20−0.461.190.731.8123.82−0.040.030.972.97155.22−0.010.010.982.99
CTRB91_505.94−0.531.070.711.9347.69−0.040.020.942.98166.38−0.020.010.992.99
Table 3. The mean and standard deviation for UCS and E during Z-score normalization.
UCS E
Variable μ σ Variable μ σ
T 35.0011.55 T 35.0011.55
D c 2.990.00 T 2 b 31.0017.07
T 2 c 184.3568.34 T 2 c 184.3568.34
δ a 5.021.04 δ a 5.021.04
δ b 0.260.07 δ b 0.260.07
δ c 0.070.04 δ c 0.070.04
Table 4. Parameters of multi regression for UCS and Elastic modulus.
ParametersUCSElastic Modulus
Values95% Confidence IntervalValues95% Confidence Interval
β 0 8.11[7.56, 8.66]422.58[373.92, 471.23]
β 1 −0.27[−1.46, 0.92]−5.08[−103.08, 92.92]
β 2 1.23[0.24, 2.23]−180.07[−336.05, −24.08]
β 3 −0.76[−1.89, 0.37]144.67[−45.28, [334.63]
β 4 −2.07[−3.43, −0.71]−22.61[−150.52, 105.31]
β 5 −0.27[−1.23, 0.69]−36.83[−125.88, 52.22]
β 6 0.10[−1.16, 1.37]−216.51[−402.86, −30.16]
Disclaimer/Publisher’s Note: The statements, opinions and data contained in all publications are solely those of the individual author(s) and contributor(s) and not of MDPI and/or the editor(s). MDPI and/or the editor(s) disclaim responsibility for any injury to people or property resulting from any ideas, methods, instructions or products referred to in the content.

