Article

Pore Structure Evolution Characteristics and Damage Mechanism of Sandstone Subjected to Freeze–Thaw Cycle Treatment: Insights from Low-Field Nuclear Magnetic Resonance Testing and Fractal Theory

1
School of Resources and Safety Engineering, Central South University, Changsha 410083, China
2
Research Center for Mining Engineering and Technology in Cold Regions, Central South University, Changsha 410083, China
*
Author to whom correspondence should be addressed.
Fractal Fract. 2025, 9(5), 293; https://doi.org/10.3390/fractalfract9050293
Submission received: 24 March 2025 / Revised: 23 April 2025 / Accepted: 24 April 2025 / Published: 1 May 2025

Abstract

To investigate the pore structure evolution characteristics and damage mechanism of sandstone subjected to treatment with freeze–thaw cycles, quantitative analyses were conducted on the longitudinal wave velocity (LWV) and T2 spectrum of sandstone before and after 10, 20, 30, and 40 freeze–thaw cycles, using longitudinal wave velocity testing, low-field nuclear magnetic resonance (NMR) testing, and fractal theory. The results show that, with the increase in the number of freeze–thaw cycles, the LWV of sandstone gradually decreases, the amplitude of the saturated T2 spectrum gradually increases, the amplitude of the centrifugal T2 spectrum gradually decreases, the total porosity and effective porosity increase, and the residual porosity decreases. After undergoing freeze–thaw cycles, sandstone exhibits obvious fractal characteristics in both the total porosity NMR fractal dimension and the effective porosity NMR fractal dimension, and the growth rates of both decrease exponentially with the increase in the number of freeze–thaw cycles. The magnitude of the fractal dimensions reflects the complexity of the pore structure, with smaller fractal dimensions indicating better pore connectivity. In summary, the damage evolution mechanism of sandstone under freeze–thaw cycles is characterized by the gradual expansion and interconnection of internal closed micro-pores (cracks), along with increased total porosity and effective porosity, leading to enhanced freeze–thaw damage.

1. Introduction

As a natural geological material, rocks always contain various micro-defects, such as micro-cracks and micro-pores [1]. Under freeze–thaw cycles, water inside these micro-defects repeatedly freezes and thaws [2,3]. When the temperature drops below the freezing point of the water inside the micro-defects, freezing occurs. During the freezing process, water continuously migrates to the freezing front and crystallizes into ice lenses, generating frost heave force [4]. Once the frost heave force reaches the threshold required for the expansion of the micro-defects, they undergo expansion [5,6,7]. Conversely, when the temperature rises above the freezing point of the water inside the micro-defects, the frozen water melts, releasing frost heave force and causing water migration [8,9,10]. This repeated freeze–thaw cycle process continuously expands the micro-defects inside the rocks [11,12,13]. To elucidate the evolution of micro-defects inside rocks subjected to freeze–thaw cycles, numerous scholars have employed various detection methods to observe and analyze the micro-defects inside rocks subjected to freeze–thaw cycles.
Under freeze–thaw cycles, common non-destructive testing methods for rock micro-defects include Computed Tomography (CT) and Scanning Electron Microscopy (SEM). Wang et al. [14] utilized CT to analyze the evolution characteristics of micro-cracks in cyclic dynamic disturbed marble after undergoing freeze–thaw cycles, revealing a gradual decrease in crack density with increasing freeze–thaw cycles. Song et al. [15] conducted three-dimensional reconstruction analysis through CT to investigate the crack evolution and damage characteristics of fissured sandstone under freeze–thaw cycles, observing an increase in the quantity of micro-cracks in the early stages and expansion and interconnection of micro-cracks in the later stages of the freeze–thaw cycles. Feng et al. [16] quantitatively characterized the micro-pore structure of sandstone under freeze–thaw cycles using CT, indicating damage to the micro-pore structure of sandstone due to freeze–thaw cycles, and analyzing the sensitivity of the characterization parameters to the damage response. Xu et al. [17] analyzed the evolution characteristics of micro-cracks and micro-pores in sandstone under freeze–thaw cycles using SEM, at a magnification of 400 times, observing gradual expansion of micro-cracks and the generation of new micro-cracks and micro-pores with increasing freeze–thaw cycles. Zhang et al. [18] analyzed SEM images of sandstone after different numbers of freeze–thaw cycles at a magnification of 200 times, revealing an increase in both the quantity and size of internal pores in sandstone with increasing freeze–thaw cycles. Hou et al. [19] employed SEM to analyze the evolution characteristics of micro-defects in the same location of gypsum rock with increasing freeze–thaw cycles, observing a gradual increase in surface roughness and specimen pore area.
In recent years, low-field nuclear magnetic resonance (NMR) technology, as a non-destructive and efficient detection method, has gradually been applied to the detection of the microstructure of rock, especially in the evolution of pore structures under freeze–thaw cycles. Zhou et al. [20] and Zhou et al. [21] first applied low-field NMR detection technology to study the evolution of the pore structure of rocks subjected to freeze–thaw cycles. Through freeze–thaw experiments and low-field NMR tests on granite, they investigated the evolution characteristics of the pore structure of granite subjected to freeze–thaw cycles. Subsequently, Li et al. [22] conducted low-field NMR tests on freeze–thawed sandstone in a chemical environment, and they studied the evolution characteristics of sandstone’s pore structure based on the T2 spectrum distribution curve. Jia et al. [23] obtained the evolution characteristics of sandstone’s pore size distribution, porosity, permeability, curvature, and pore size uniformity coefficient under freeze–thaw cycles based on the T2 spectrum distribution curve obtained from low-field NMR testing. Meng et al. [24] and Xiong et al. [13] conducted low-field NMR tests on sandstone subjected to freeze–thaw cycles, and the evolution characteristics of sandstone’s pore structure under freeze–thaw cycles were analyzed based on the T2 spectrum distribution curve. Liu et al. [25] and Liu et al. [26] studied the evolution characteristics of the pore structure of granite subjected to freeze–thaw cycles by comparing the T2 spectrum distribution curves of granite before and after freeze–thaw treatment.
The abovementioned research studied the evolution characteristics of rocks’ pore structure under freeze–thaw cycles by analyzing the changes in the T2 spectrum distribution curves of rocks before and after freeze–thaw treatment (changes in T2 spectrum curve amplitude and left or right shifts). However, the exploration of the deep-seated information contained in the T2 spectrum distribution curves has not been sufficiently thorough. The T2 spectrum distribution curves indirectly reflect the distribution of the rock’s pore structure, which typically exhibits fractal characteristics. Therefore, starting from the fractal characteristics of the T2 spectrum distribution curves, a more in-depth study of the evolution laws and damage mechanisms of rock pore structures under freeze–thaw cycles can be conducted. We first conducted freeze–thaw cycle experiments on sandstone with different freeze–thaw cycles. Secondly, longitudinal wave velocity (LWV) and low-field NMR tests were conducted on sandstone before and after freeze–thaw cycles, and the evolution laws of LWV, T2 spectrum curves, and porosity with freeze–thaw cycles were analyzed. Thirdly, combining low-field NMR theory and fractal theory, an expression for calculating the fractal dimension of sandstone’s pore structure based on the T2 spectrum curve was derived, and the evolution laws of sandstone’s pore structure fractal dimension with freeze–thaw cycles were analyzed. Finally, a correlation analysis of porosity with LWV and the pore structure fractal dimension was conducted to reveal the damage evolution mechanism of sandstone under freeze–thaw cycles, and a schematic diagram of the damage evolution mechanism of sandstone under freeze–thaw cycles was drawn.

2. Experimental Materials and Methods

2.1. Rock Specimen Preparation

The rock specimens used in the experiments were sandstone with a fine grain structure, good homogeneity, and no macroscopically visible joint fissures. According to the recommended methods of the International Society for Rock Mechanics for rock mechanics experiments, natural rock blocks were processed into cylindrical specimens with a diameter of 50 mm and a height of 100 mm. The flatness of the end face of the sandstone specimens was less than 0.05 mm, and the diameter and height deviations were less than 0.3 mm, with a perpendicularity of less than 0.25° [27]. The initial physical parameters of the sandstone are shown in Table 1. To avoid significant discrepancies in the experimental results, sandstone specimens with large differences were eliminated after measuring their LWV and NMR porosity.

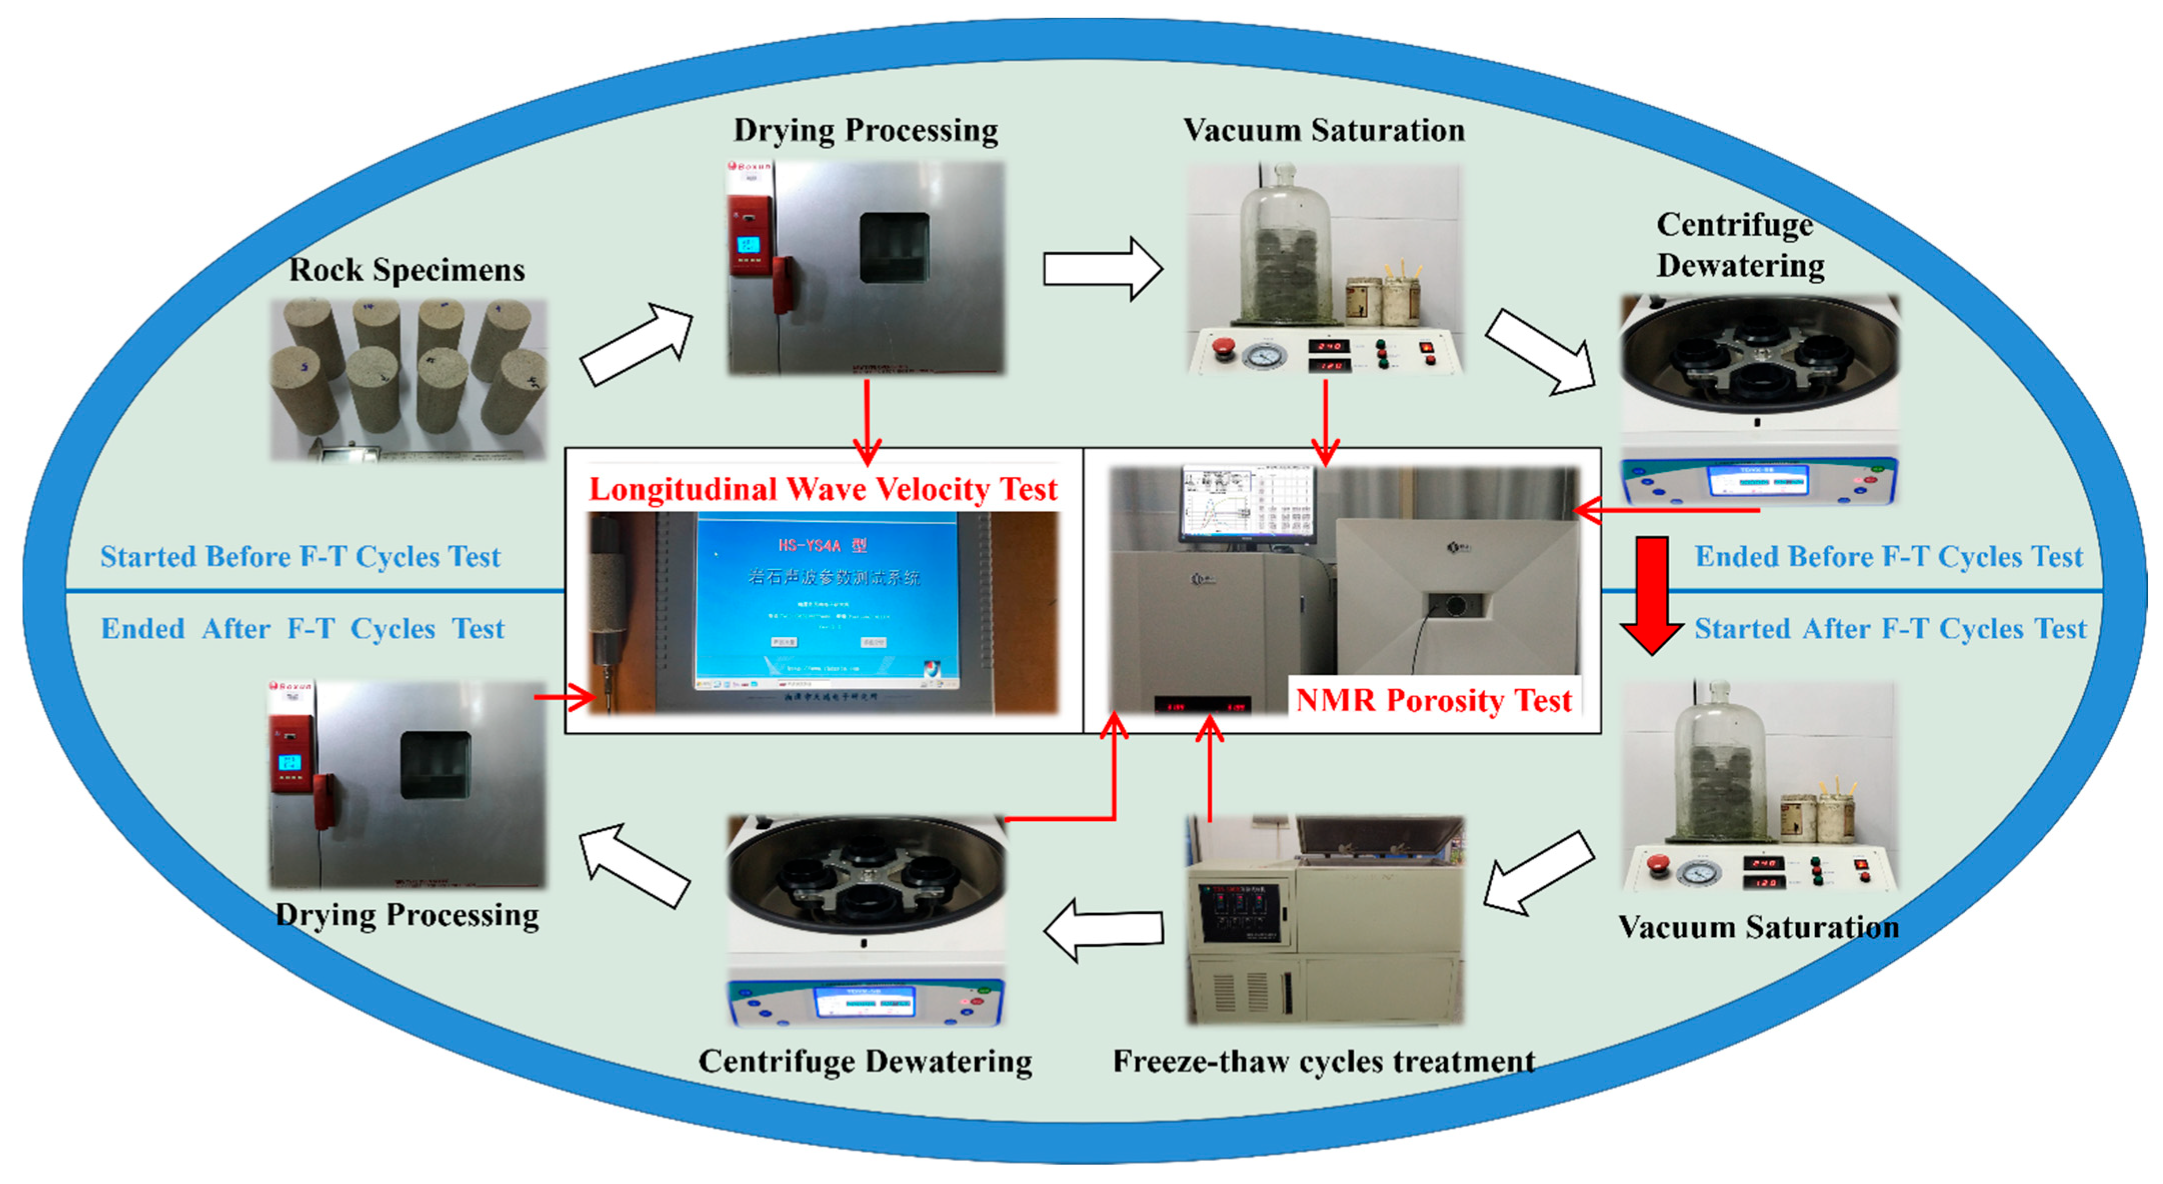
2.2. Experimental Procedures

(1)
After drying the sandstone specimens following their grouping, the LWV of the sandstone before the freeze–thaw cycles was measured using the HS-YS4A rock acoustic wave detector (Xiangtan Tianhong Electronic Research Institute, Xiangtan, China). Subsequently, they were placed in a vacuum pump and subjected to dry pumping for 4 h and wet pumping for 2 h under a vacuum pressure of 0.1 MPa [22]. Finally, the sandstone was removed and allowed to naturally soak in water for 24 h.
(2)
After soaking in water for 24 h, the sandstone specimens were tested using the MesoMR21-060H-I rock core NMR imaging analyzer (Suzhou Niumag Analytical Instrument Corporation, Suzhou, China) to determine the porosity of the saturated sandstone before the freeze–thaw cycles.
(3)
The saturated sandstone specimens, after testing, were placed in the TDYX-5B low-speed centrifuge (Suzhou Niumag Analytical Instrument Corporation, Suzhou, China) and centrifuged for 90 min at a centrifugal force of 200 psi. Subsequently, they were removed and tested using the MesoMR21-060H-I rock core NMR imaging analyzer to determine the porosity of the sandstone after centrifugation and before the freeze–thaw cycles.
(4)
The centrifuged sandstone specimens were placed in a vacuum pump and subjected to dry pumping for 4 h and wet pumping for 2 h under a vacuum pressure of 0.1 MPa. Then, they were removed and allowed to naturally soak in water for 24 h. After soaking for 24 h, they were placed in the TDS-300 automatic freeze–thaw test machine (Suzhou Donghua Test Instrument Co., Ltd. Suzhou, China) for 10, 20, 30, and 40 freeze–thaw cycles.
(5)
After reaching the designated number of freeze–thaw cycles in the tests, the corresponding sandstone specimens were removed and subjected to saturated water testing using the MesoMR21-060H-I rock core NMR imaging analyzer to determine the nuclear magnetic porosity of the saturated sandstone after the freeze–thaw cycles.
(6)
The saturated sandstone specimens, after freeze–thaw cycle testing, were subjected to centrifugation treatment using the TDYX-5B low-speed centrifuge. Then, they were tested using the MesoMR21-060H-I rock core NMR imaging analyzer to determine the porosity of the sandstone after the freeze–thaw cycles in the centrifuged state.
(7)
The sandstone specimens, after centrifugation, were placed in a vacuum-drying oven for drying treatment. After drying the sandstone specimens, the LWV of the sandstone after the freeze–thaw cycles was measured using the HS-YS4A rock acoustic wave detector. The overall experimental procedure is illustrated in Figure 1.

3. Experimental Results and Analysis

3.1. Longitudinal Wave Velocity

The LWV of rock is primarily influenced by micro-cracks and micro-pores within the rock. Internal micro-cracks and micro-pores hinder the transmission of ultrasound waves, resulting in reduced wave velocity. Measuring the LWV of sandstone reflects the extent of damage caused by freeze–thaw cycles. The changes in the LWV of sandstone before and after the freeze–thaw cycles are presented in Table 2. The variation in the LWV of the sandstone before and after the freeze–thaw cycles is illustrated in Figure 2. As shown in Figure 2, in the greater the number of freeze–thaw cycles, the greater the reduction in LWV compared to before the freeze–thaw cycles. This indicates that as the number of freeze–thaw cycles increases, the number of micro-cracks and micro-pores within the sandstone gradually increases, resulting in greater damage.
To better quantify the influence of the freeze–thaw cycles on the LWV of sandstone, the LWV growth rate was defined to characterize its evolution with the number of freeze–thaw cycles. The LWV growth rate can be expressed as follows:
Δ v = v post v pre v pre × 100 %
where Δ v represents the LWV growth rate (%), v pre denotes the LWV of the sandstone before the freeze–thaw cycles (m/s), and v post is the LWV of the sandstone after the freeze–thaw cycles (m/s).
Based on Table 2, the LWV growth rates of the sandstone after the freeze–thaw cycles can be calculated separately. As shown in Figure 3, after undergoing 10, 20, 30, and 40 freeze–thaw cycles, the LWV growth rates of the sandstone were −4.835%, −8.616%, −14.073%, and −24.043%, respectively. These negative growth rates indicate that after the freeze–thaw cycles, the internal pore structure of the sandstone continues to develop, with pores expanding and connecting, ultimately leading to a continuous decrease in the LWV of the sandstone. Experimental data fitting revealed an exponential decrease in the LWV growth rate of sandstone with the number of freeze–thaw cycles.

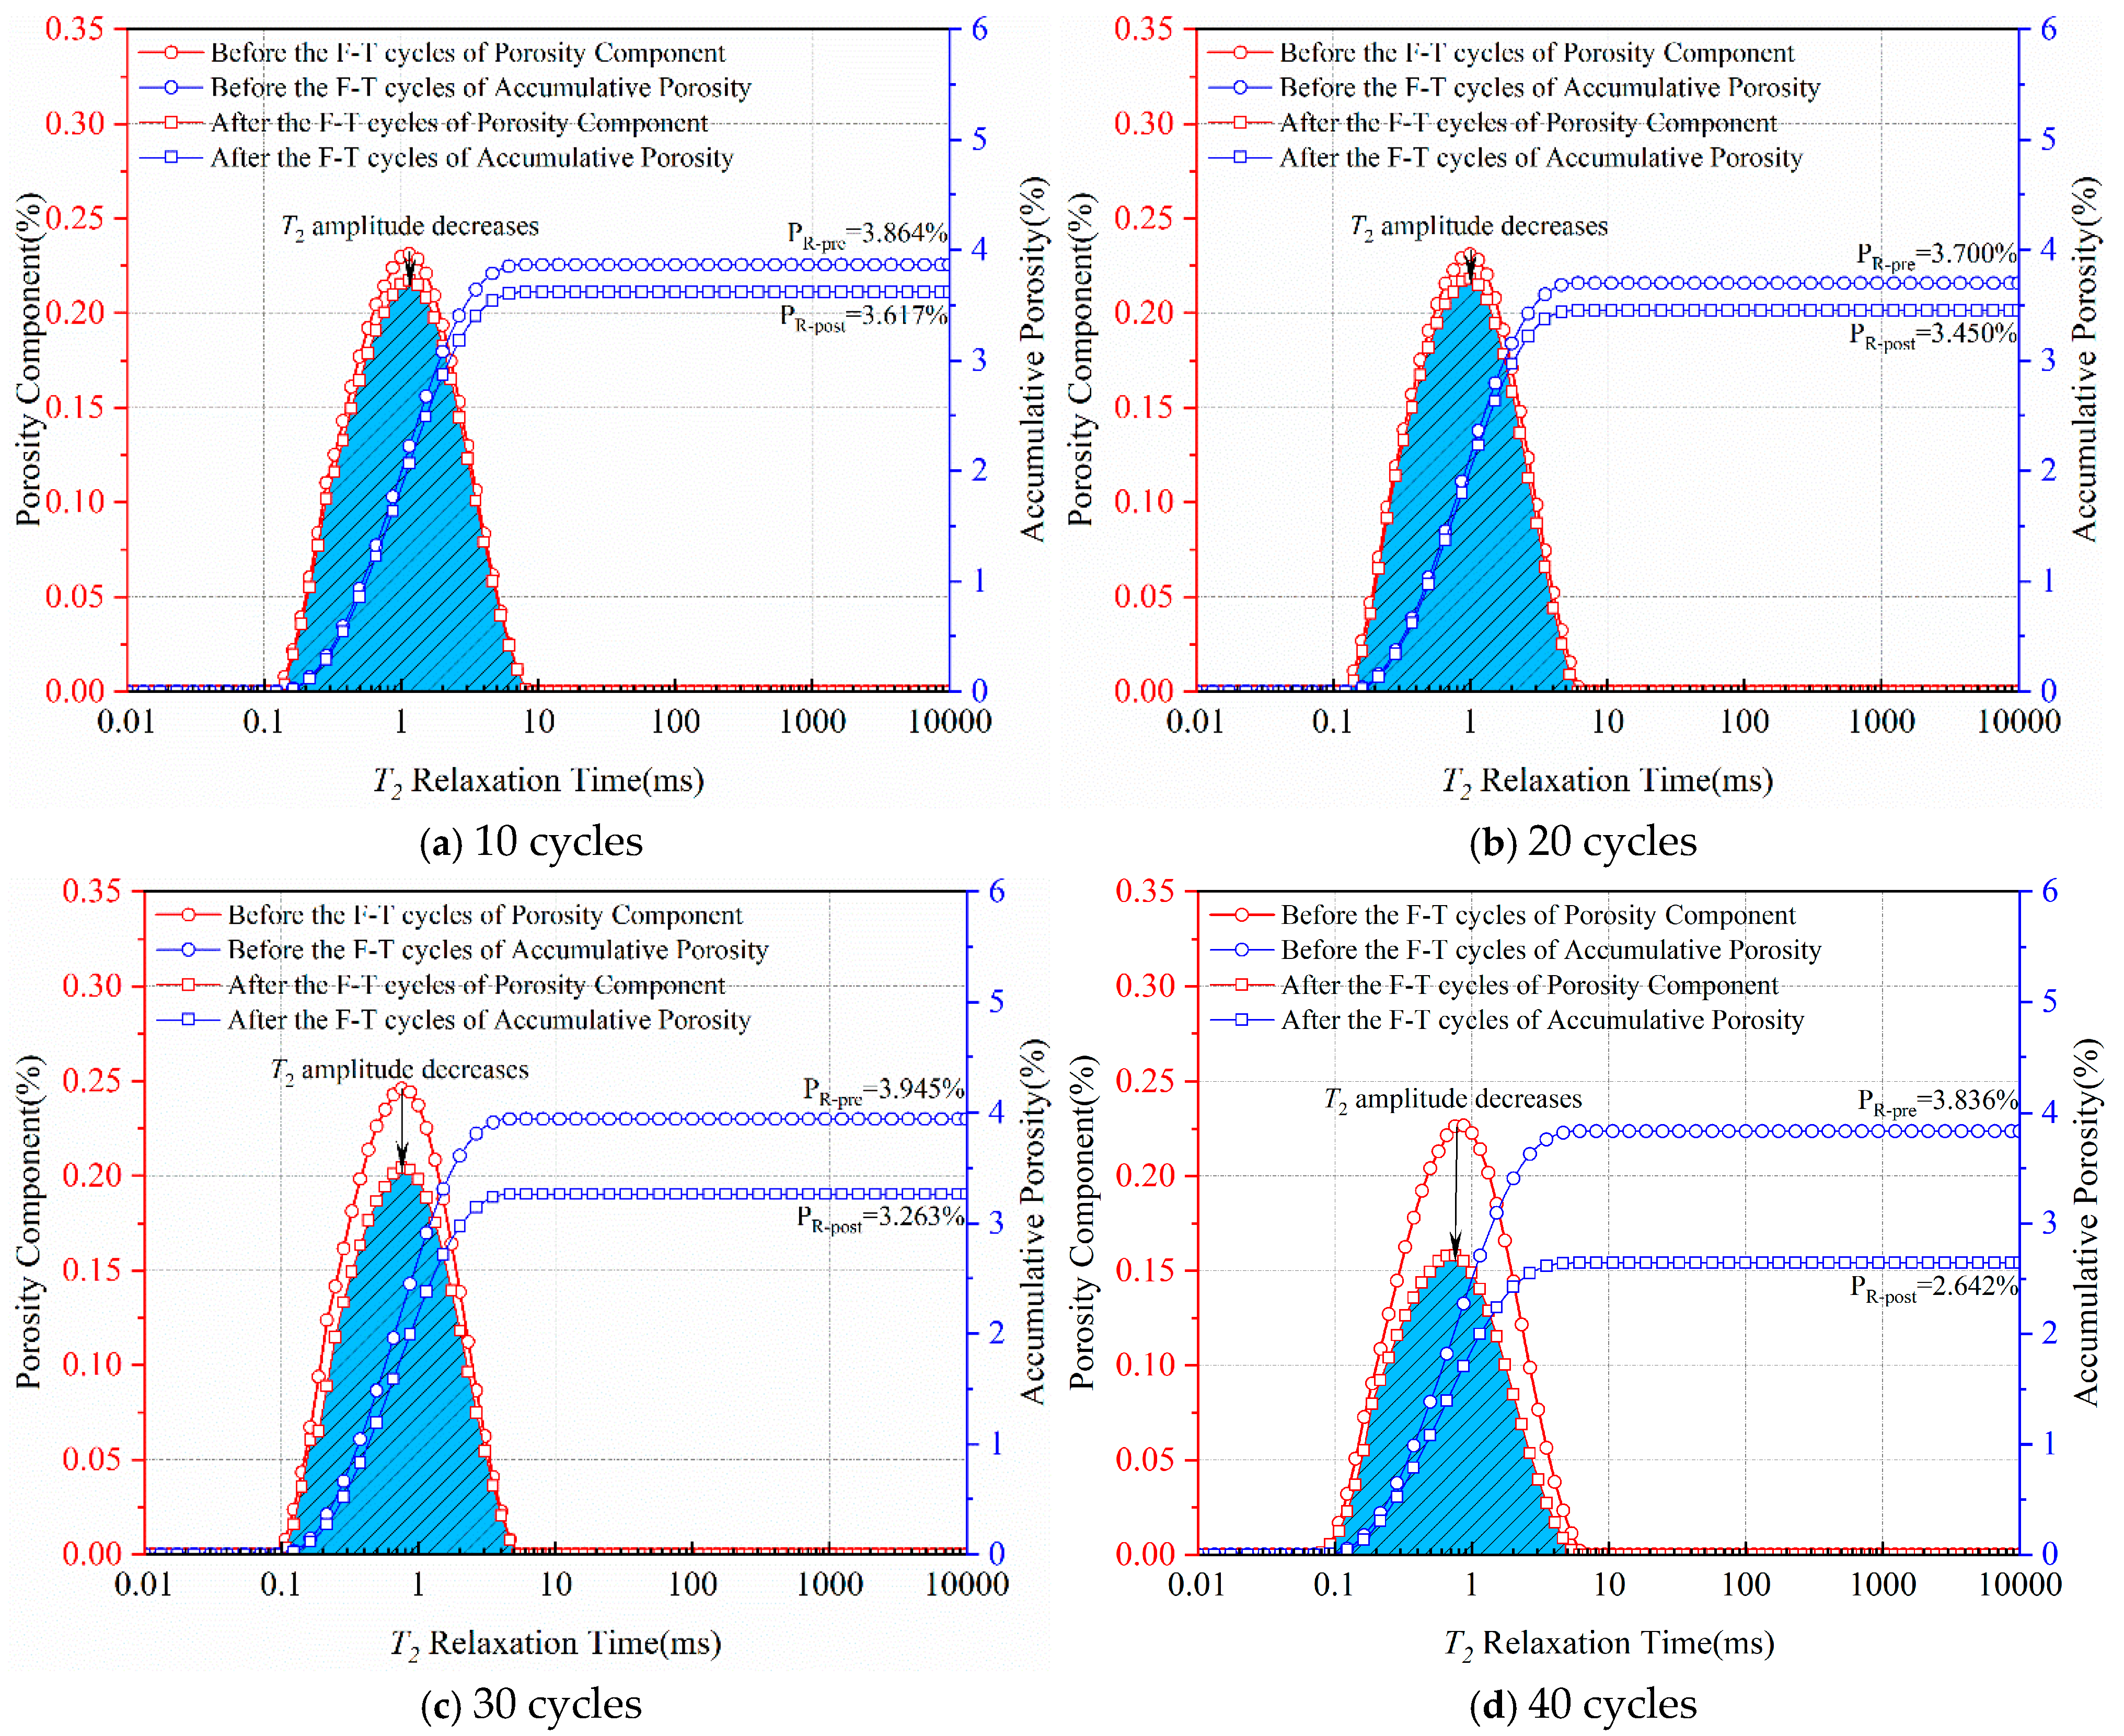
3.2. T2 Spectrum Curves
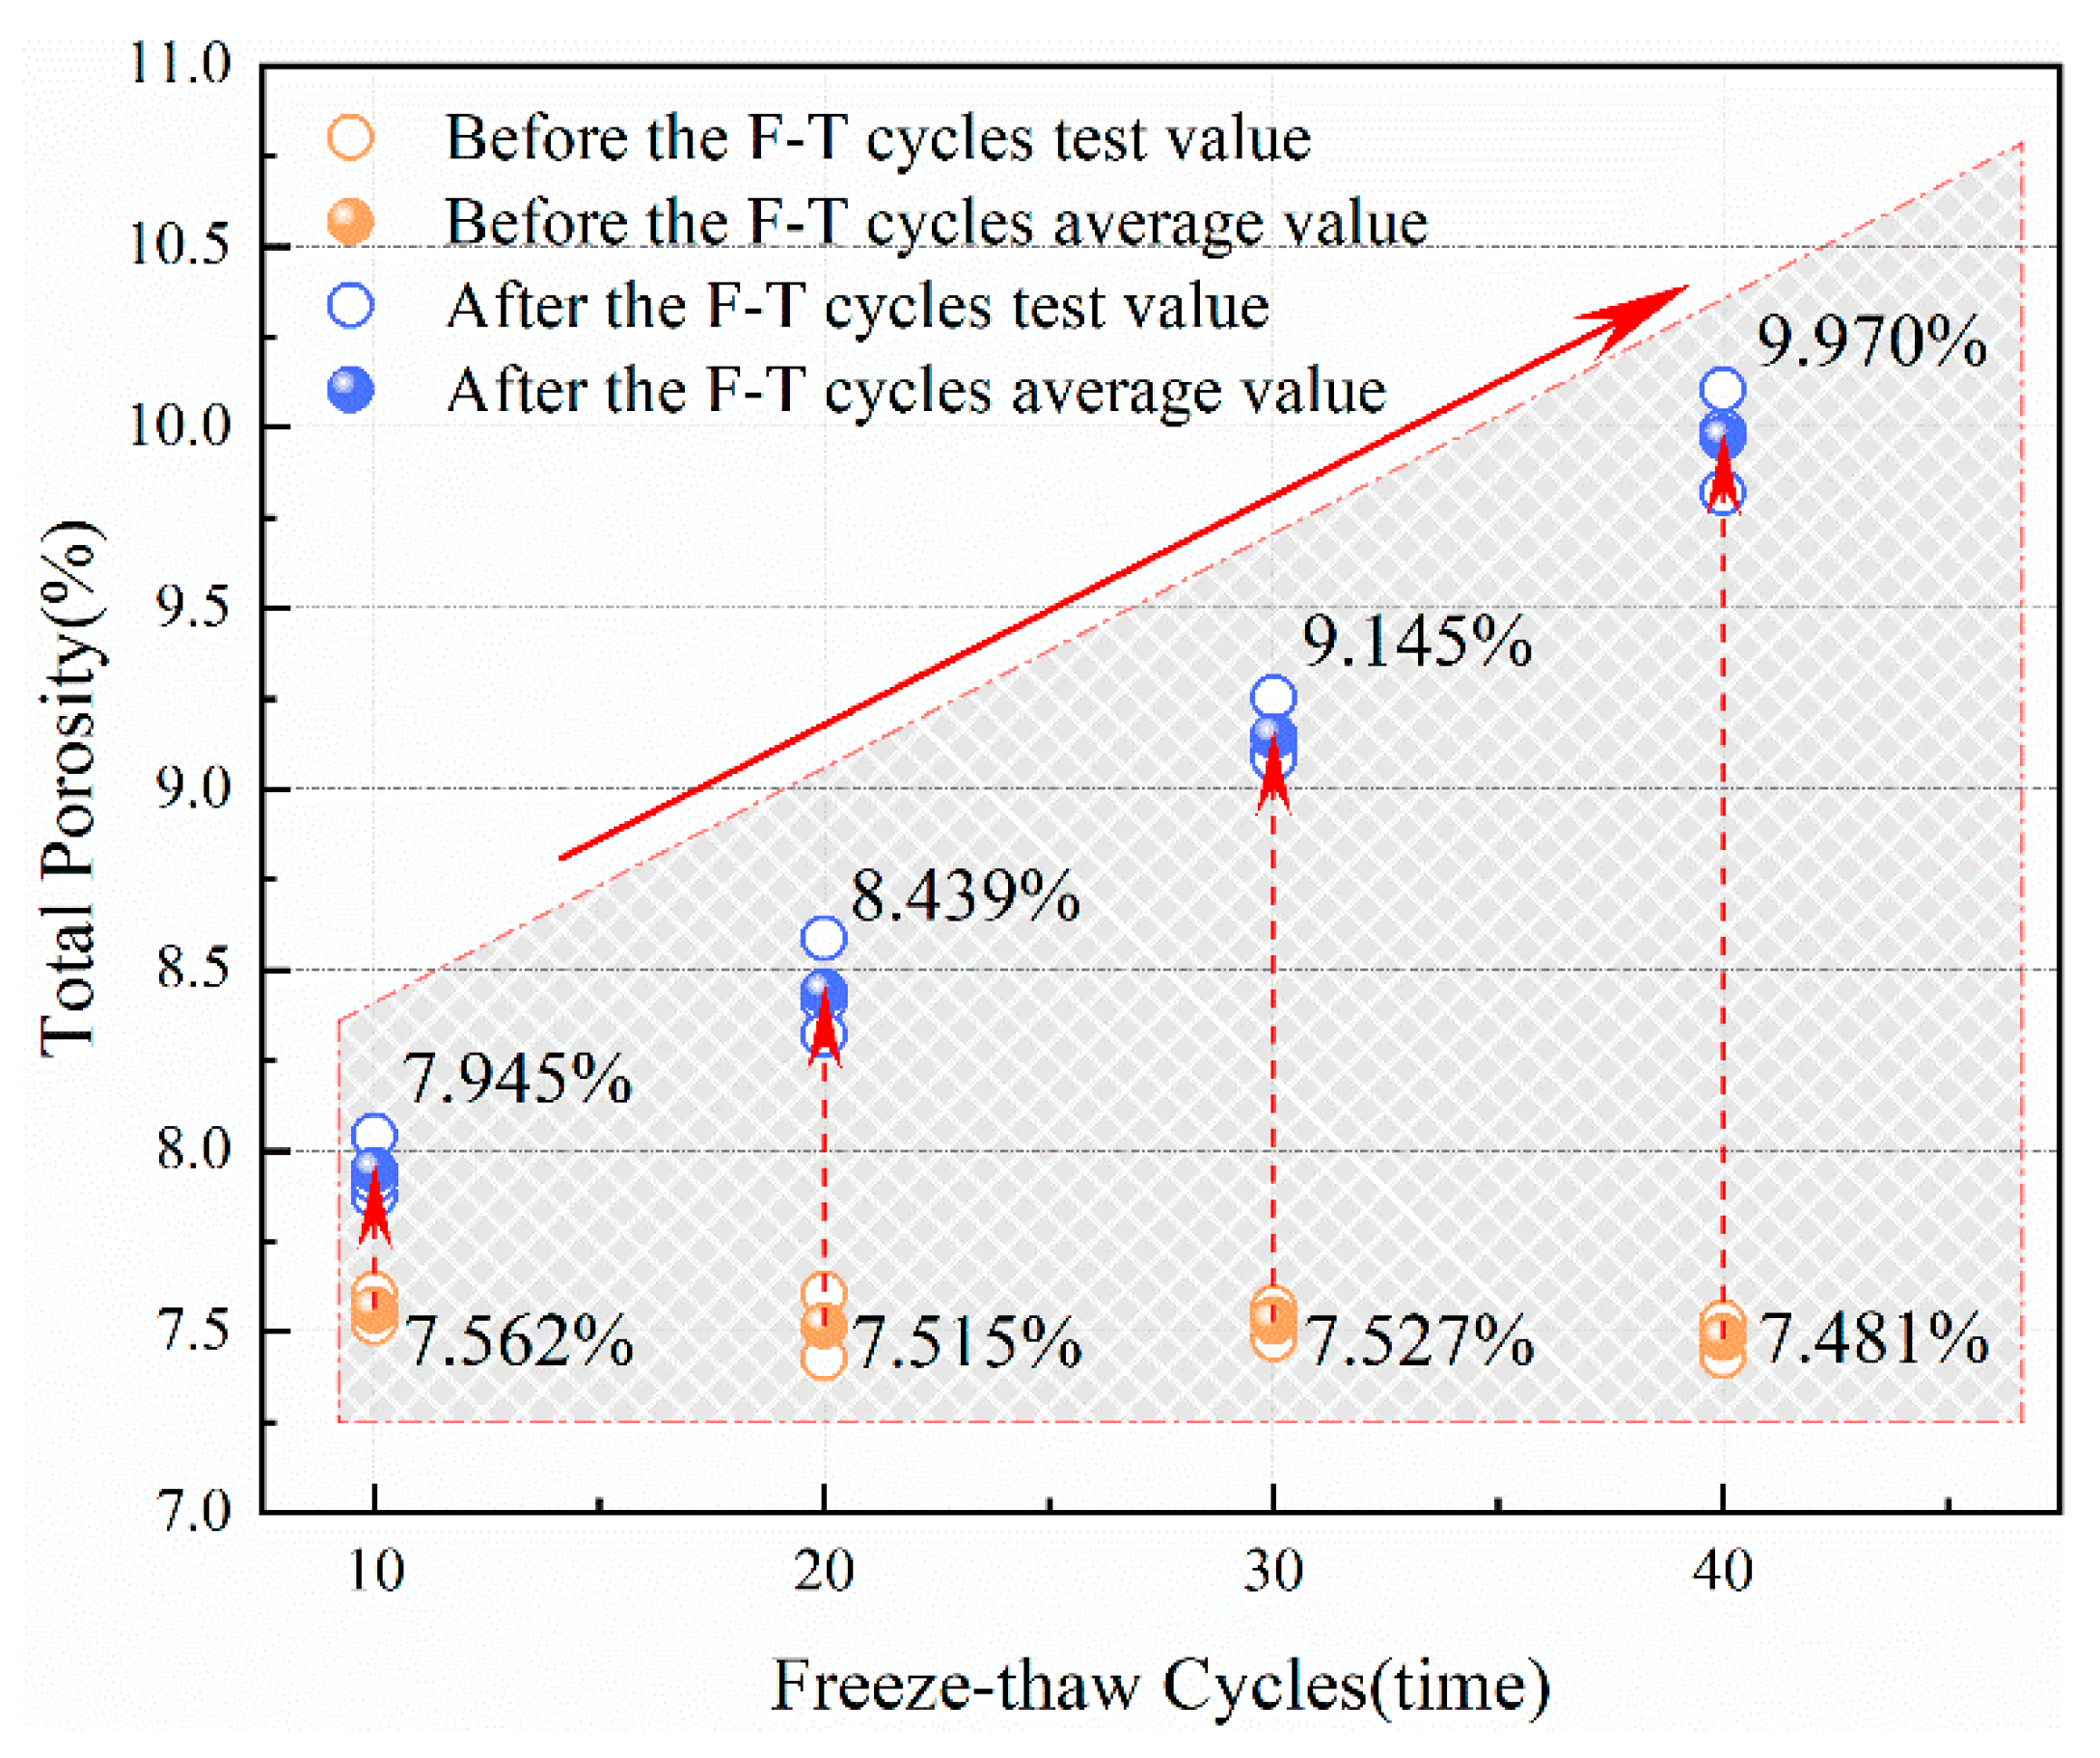
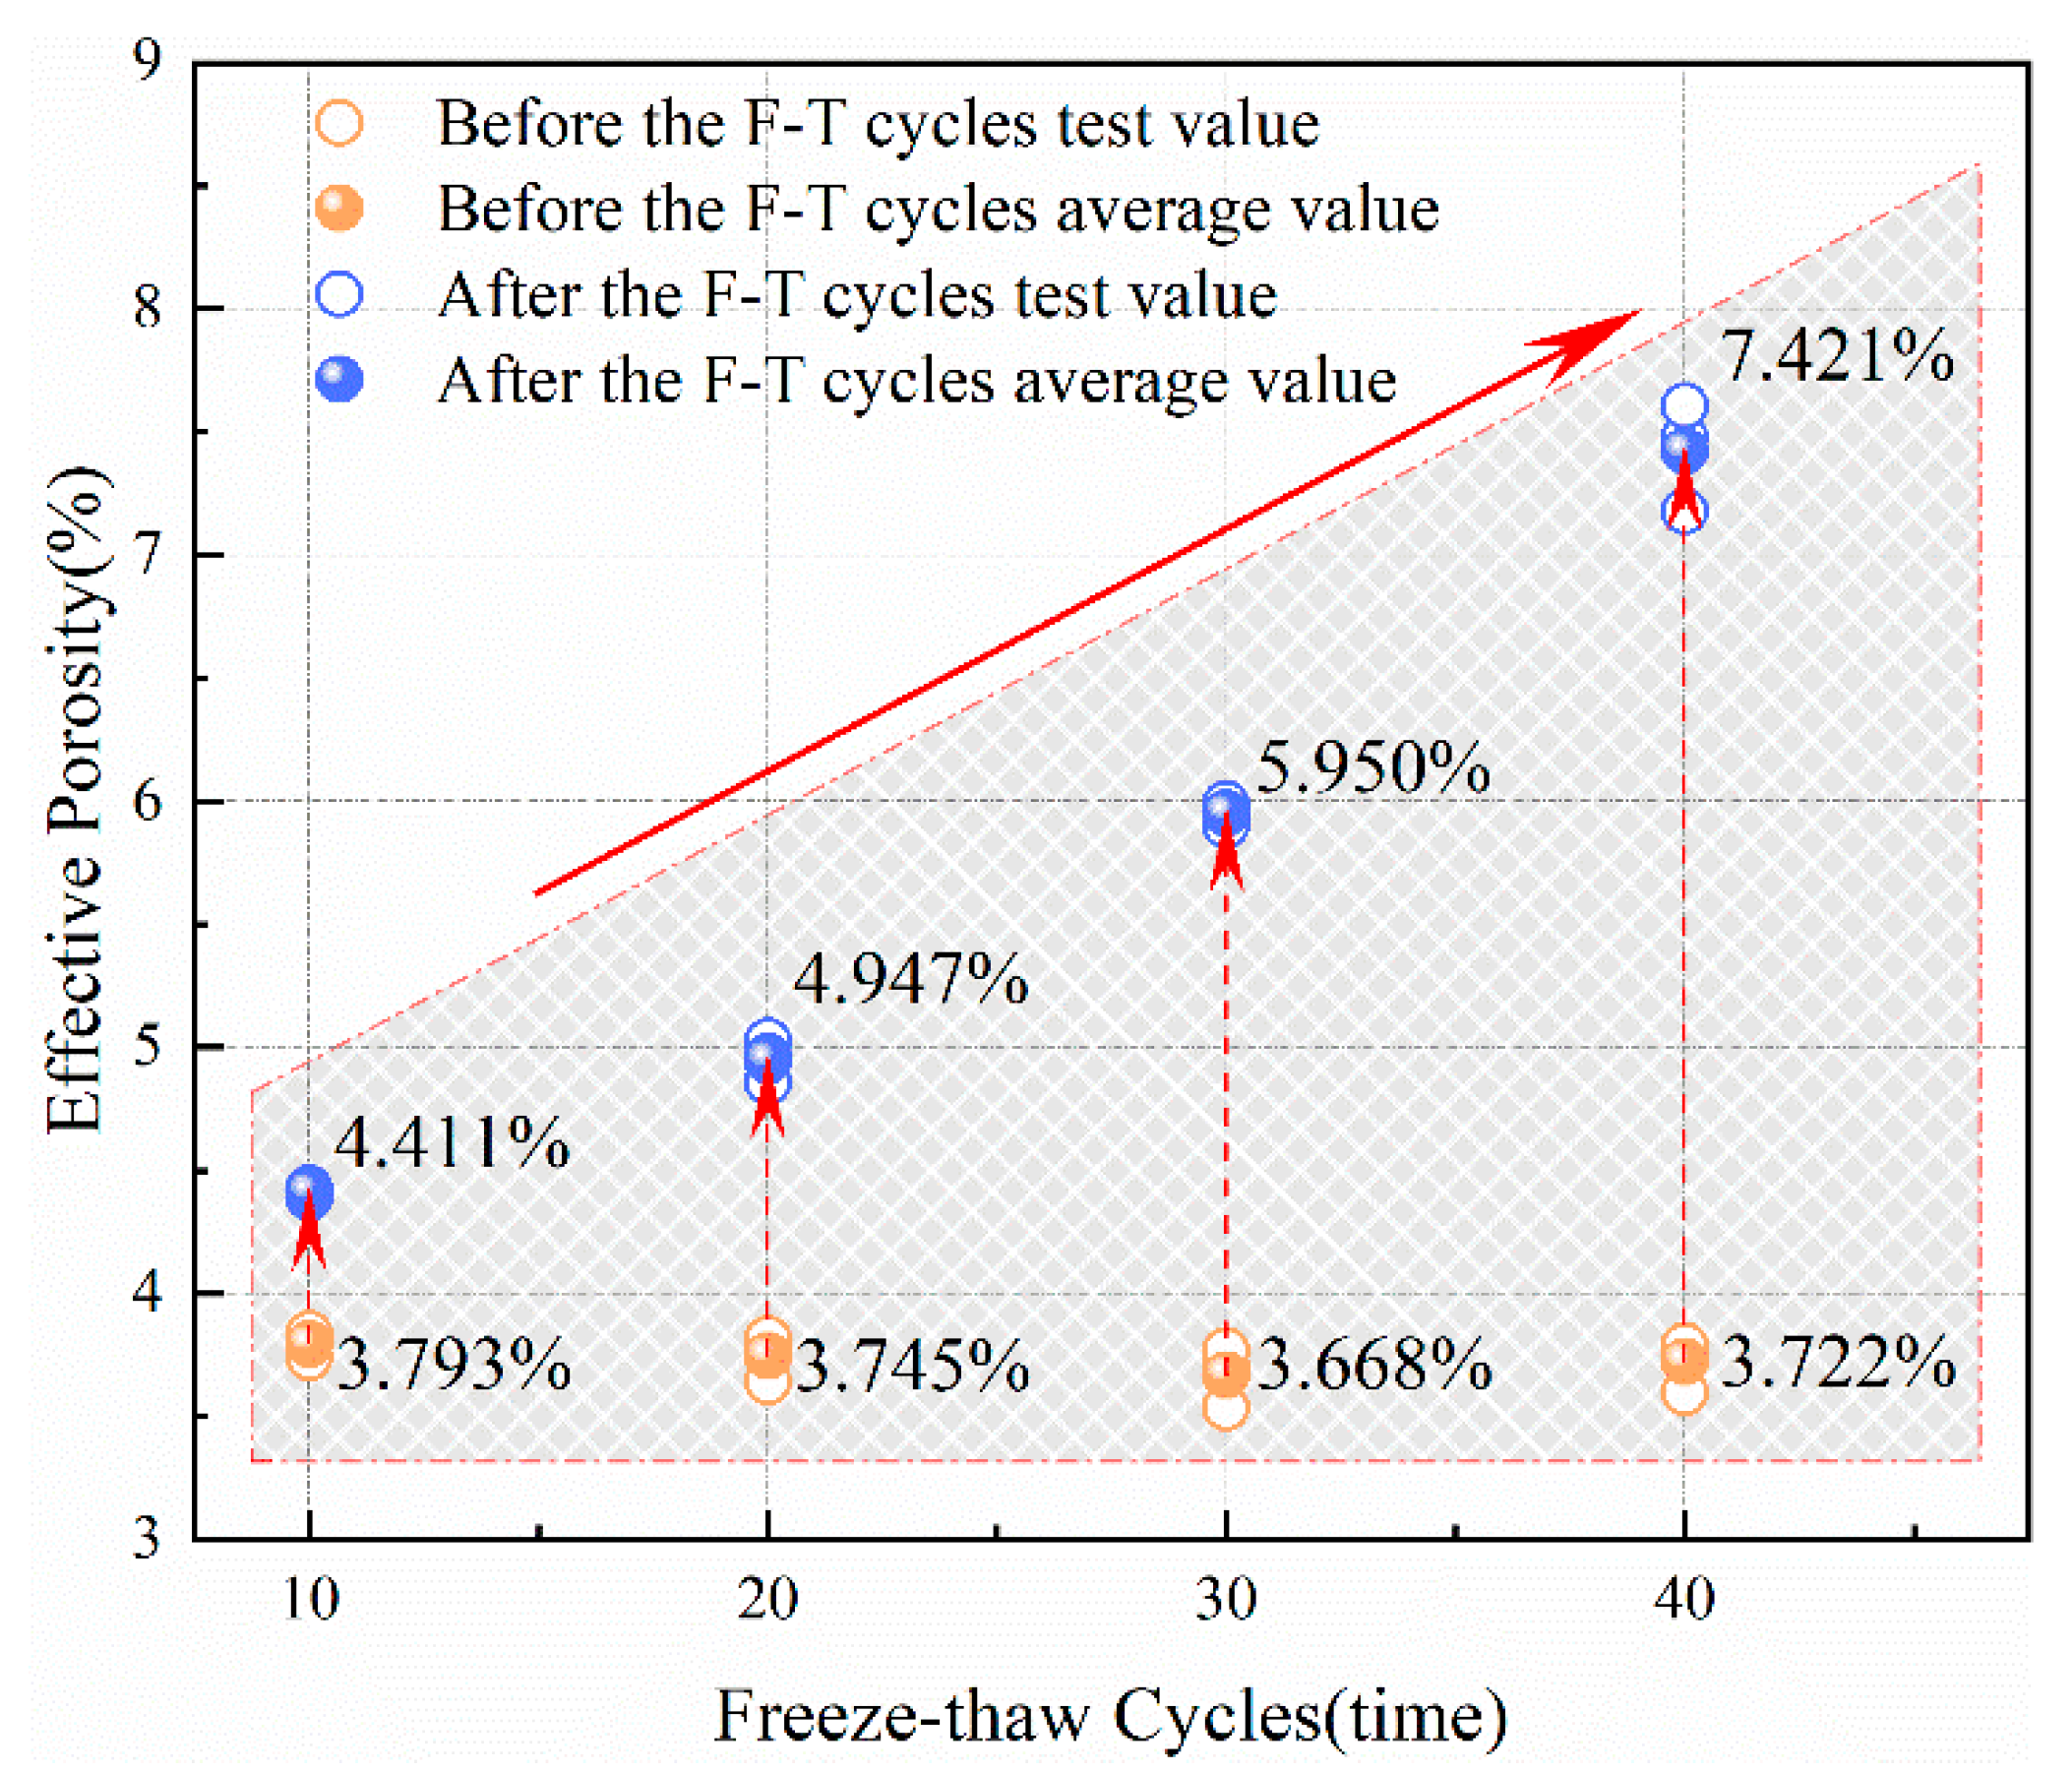
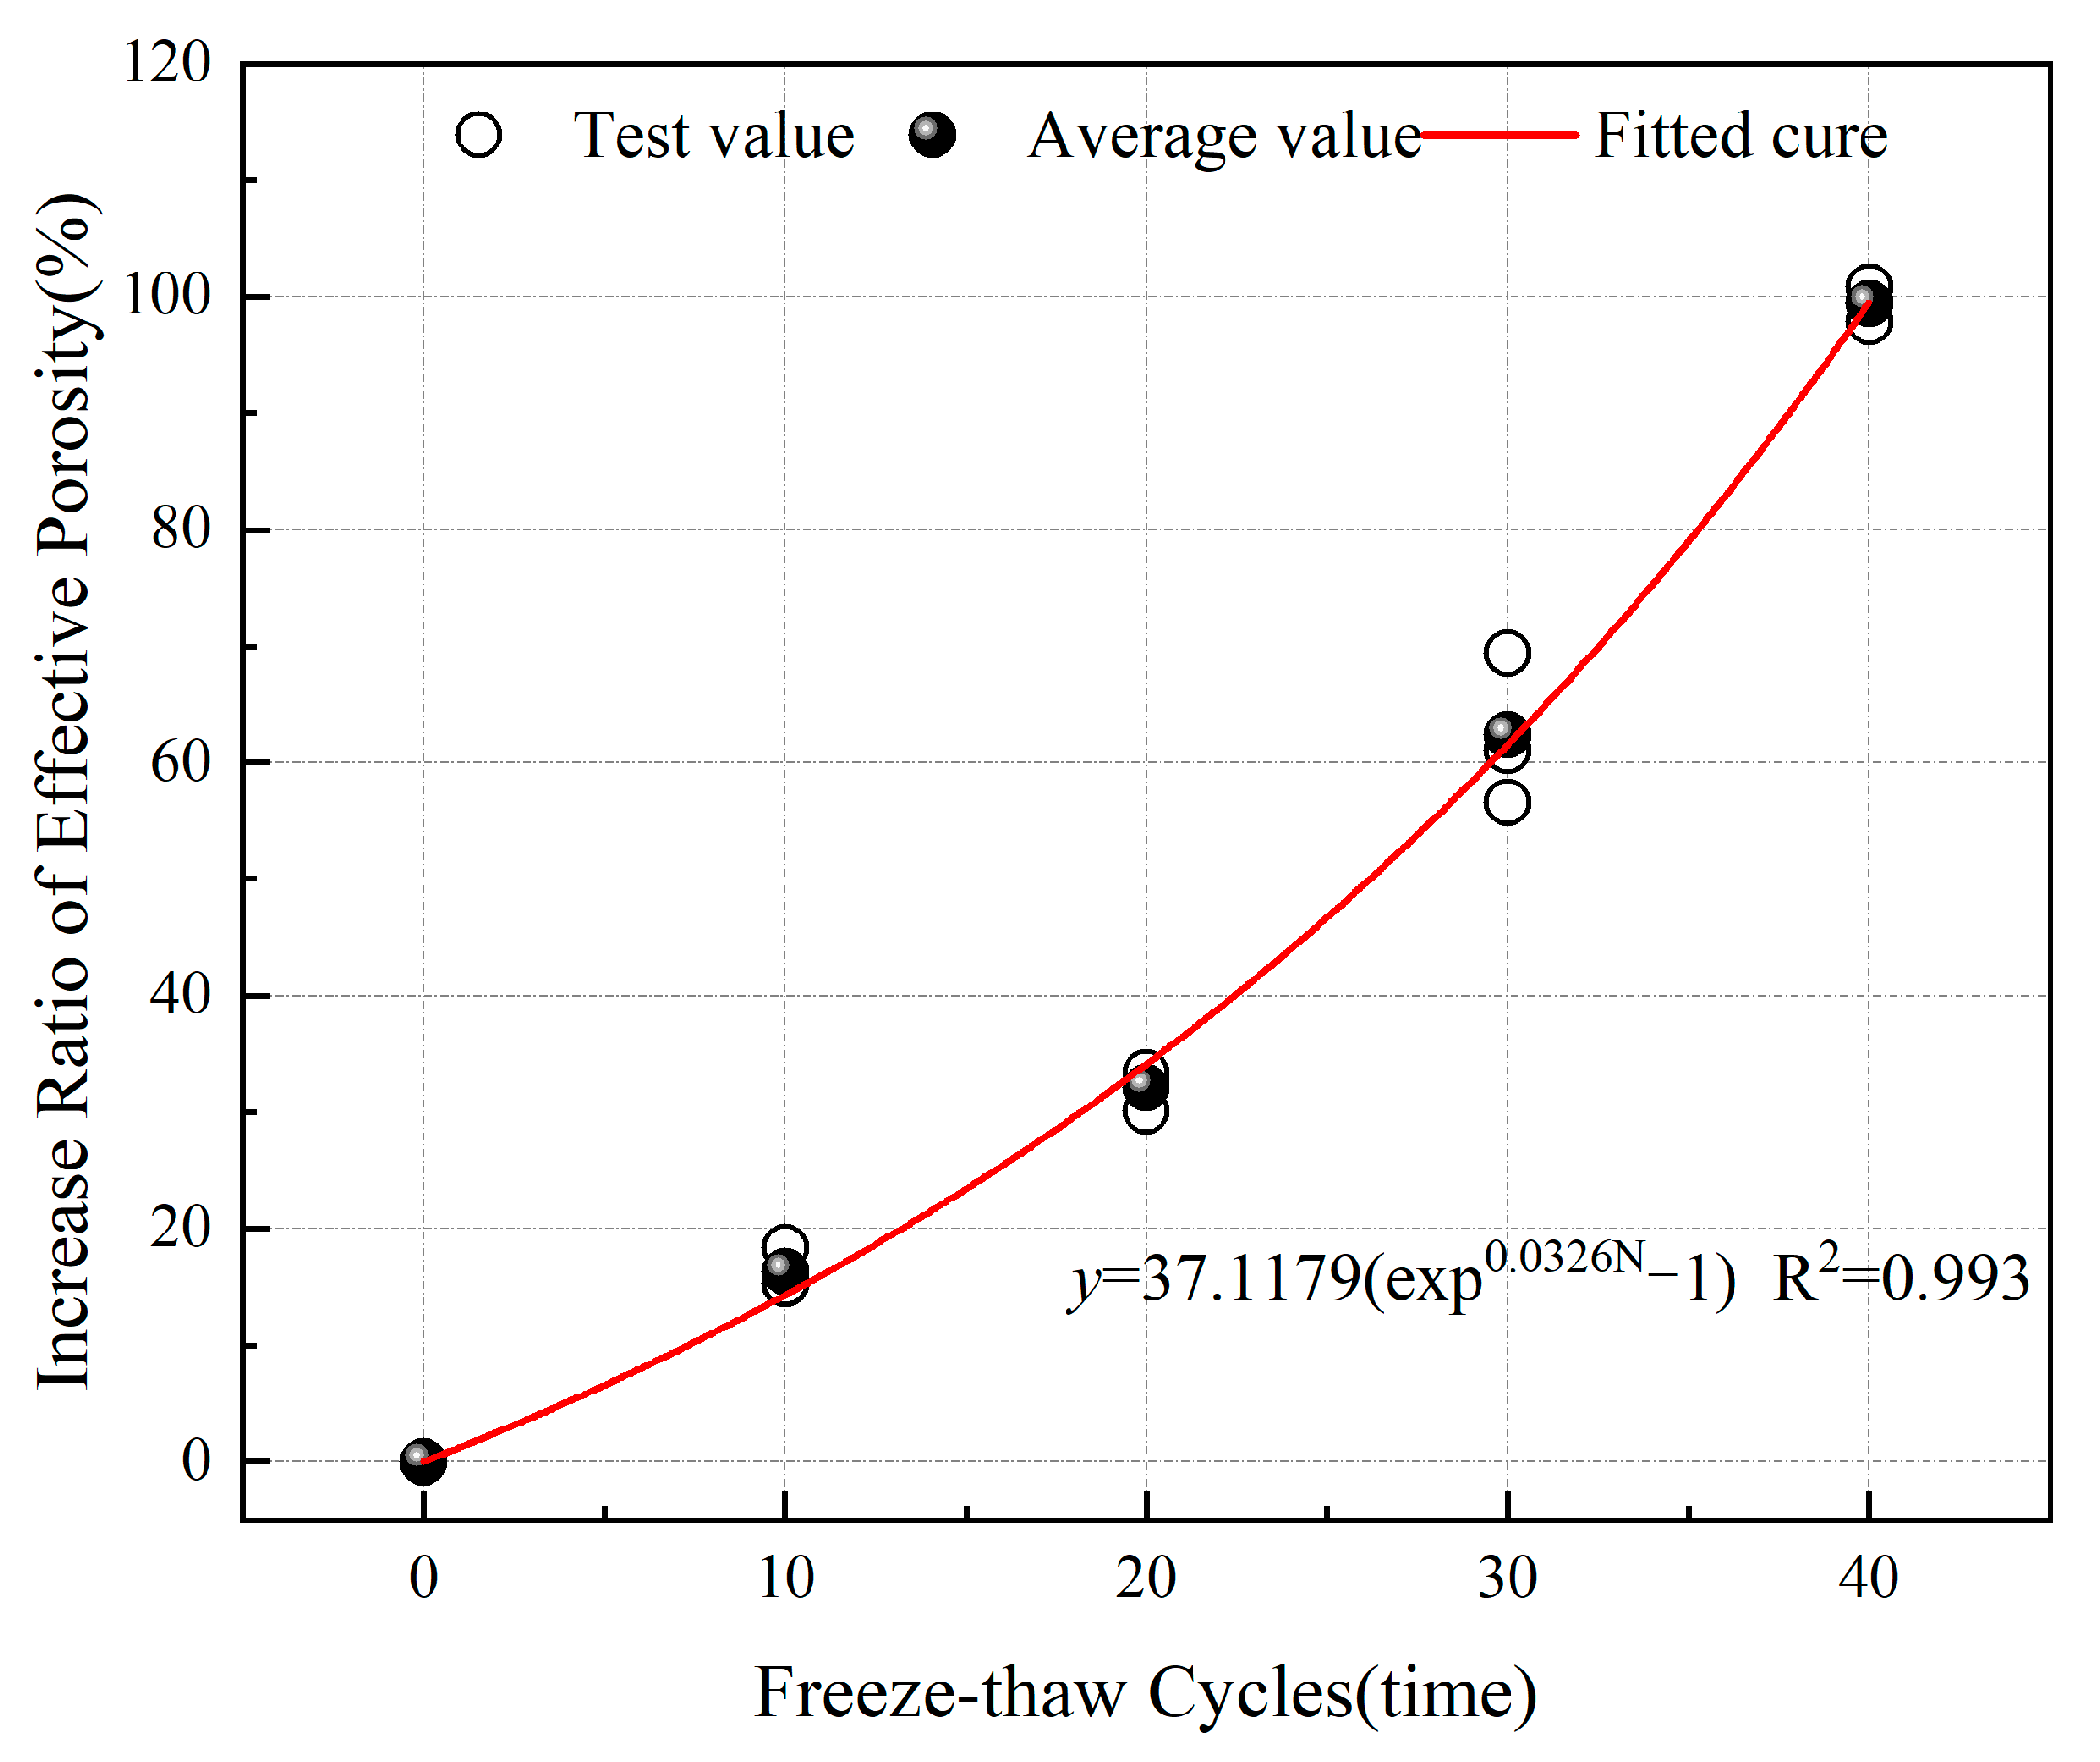
Figure 4 illustrates the typical T2 spectrum distribution curves of sandstone subjected to 10, 20, 30, and 40 freeze–thaw cycles under water-saturated conditions. It can be observed from Figure 4 that the amplitude of the T2 spectrum distribution curves and the cumulative T2 spectrum curves of sandstone under saturated conditions increases after the freeze–thaw cycles. Moreover, with the increase in the number of freeze–thaw cycles, the area of the T2 spectrum distribution curves and the amplitude of the cumulative T2 spectrum curves of sandstone under water-saturated conditions increase significantly, reflecting the increase in the total porosity of sandstone with the increase in the number of freeze–thaw cycles.
Figure 5 illustrates the typical T2 spectrum distribution curves of sandstone subjected to 10, 20, 30, and 40 freeze–thaw cycles under centrifugal conditions. It can be observed from Figure 5 that the amplitude of the T2 spectrum distribution curves and the cumulative T2 spectrum curves of sandstone under centrifugal conditions decreases after the freeze–thaw cycles. Furthermore, with the increase in the number of freeze–thaw cycles, the decrease in the amplitude of the T2 spectrum distribution curves and the cumulative T2 spectrum curves of sandstone under centrifugal conditions becomes more significant, reflecting the gradual decrease in the residual porosity of sandstone with the increase in the number of freeze–thaw cycles.

3.3. Porosity

Porosity refers to the ratio of the total volume of voids in a porous medium, such as rock, to the total volume of the medium. It is typically divided into total porosity, effective porosity, and residual porosity. Total porosity is the porosity measured when the rock is water-saturated; effective porosity refers to the porosity with good connectivity, and it is often calculated by subtracting residual porosity from total porosity; residual porosity represents the size of sealed pore spaces, and it is measured when the rock is under centrifugal conditions. The total porosity, effective porosity, and residual porosity of sandstone subjected to freeze–thaw cycles are shown in Table 3. The changes in the total porosity, effective porosity, and residual porosity of sandstone before and after freeze–thaw cycles are illustrated in Figure 6, Figure 7 and Figure 8, respectively. It can be observed from Figure 6, Figure 7 and Figure 8 that as the number of freeze–thaw cycles increases, compared to before the freeze–thaw cycles, the increase in the total porosity and effective porosity of the sandstone becomes greater, while the decrease in residual porosity becomes more significant, indicating that with an increase in the number of freeze–thaw cycles, the micro-cracks and micro-pores inside the sandstone gradually increase in number and become connected.
To measure the evolution law of sandstone’s porosity with the number of freeze–thaw cycles, we defined the porosity growth rate to characterize its evolution with the number of freeze–thaw cycles. The porosity growth rate can be expressed as follows:
Δ P = P post P pre P pre × 100 %
where Δ P represents the porosity growth rate (%), P pre is the porosity of the sandstone before the freeze–thaw cycles (%), and P post is the porosity of the sandstone after the freeze–thaw cycles, (%).
Based on the porosity data in Table 3, the growth rates of the total porosity, residual porosity, and effective porosity of sandstone subjected to freeze–thaw cycles can be calculated separately. From Figure 9, Figure 10 and Figure 11, it can be observed that after undergoing 10, 20, 30, and 40 freeze–thaw cycles, the total porosity growth rates of the sandstone were 5.063%, 12.301%, 21.508%, and 33.261%, respectively; the effective porosity growth rates were 16.306%, 32.097%, 62.361%, and 99.392%, respectively; and the residual porosity growth rates were −6.234%, −7.338%, −17.182%, and −32.215%, respectively. Throughout the entire freeze–thaw cycle process, the total and effective porosity growth rates of the sandstone were greater than 0, while the residual porosity growth rate was less than 0. Additionally, the effective porosity growth rate was consistently higher than the total porosity growth rate. This indicates that the closed micro-cracks and micro-pores of the sandstone gradually fractured due to the freeze–thaw cycles, becoming connected, with open pores, thereby continuously increasing the volume of effective porosity. Experimental data fitting revealed that the growth rates of the total porosity and effective porosity of sandstone exhibit an exponential increase with the number of freeze–thaw cycles, while the residual porosity growth rate exhibits an exponential decrease with the number of freeze–thaw cycles.

3.4. Fractal Dimension of Pore Structure

3.4.1. Fractal Dimension Calculation Based on NMR T2 Spectrum

According to the theory of fractal geometry, it can be inferred that the pore size distribution inside rocks follows a fractal structure, and the number of pores larger than r c , denoted as N > r c , is related to pore size by a power-law function [28,29,30]:
N > r c = r c r m a x P r d r = a r D
where r represents the pore size within the rock, r m a x denotes the maximum pore size within the rock, a is a proportionality constant, P r is the pore size distribution density function, and D stands for the fractal dimension of pores inside the rock.
By taking the derivative of Equation (3) with respect to r , the pore size distribution density function P r inside rocks can be obtained as follows:
P r = d N > r c d r = D a r D 1
The cumulative volume of pores inside rocks smaller than r c can be expressed as follows:
V < r c = r m i n r P r a r 3 d r
where a is the shape coefficient of the pores within the rock—when the pores are cubic in shape, a = 1 , and when the pores are spherical in shape, a = 4 π 3 —while r m i n is the minimum pore size inside the rock.
The integration of Equation (4) into Equation (5) yields
V < r c = D a 2 r 3 D r m i n 3 D
Therefore, the total pore volume inside the rock can be obtained as follows:
V s = D a 2 r m a x 3 D r m i n 3 D
The cumulative volume fraction of pores with diameters less than r c , denoted as S V , can be expressed as follows:
S V = V < r c V s = r 3 D r m i n 3 D r m a x 3 D r m i n 3 D
Since the minimum pore diameter r m i n inside the rock is significantly smaller than the pore diameter r c , Equation (8) can be simplified to
S V = r 3 D r m a x 3 D
The relationship between rock pore size and capillary pressure is as follows [31]:
P C = 2 σ cos θ r
where P C represents the capillary pressure corresponding to the pore radius r inside the rock, σ is the surface tension of the liquid, and θ is the wetting contact angle.
By solving Equations (9) and (10), the fractal geometric expression of the capillary pressure curve inside the rock can be obtained as follows:
S V = P C P C m i n D 3
where P C m i n represents the capillary pressure corresponding to the maximum pore radius r m a x inside the rock, while S V denotes the volume fraction of the wetting phase inside the rock at capillary pressure P C . For fluid inside the rock pores, there are three distinct relaxation mechanisms: firstly, free relaxation, which affects both T1 and T2 relaxation; secondly, surface relaxation, which also affects both T1 and T2 relaxation; and thirdly, diffusion relaxation under gradient magnetic fields, affecting only T2 relaxation. When these three relaxation phenomena coexist, the T2 relaxation time of the fluid inside the rock pores can be measured in a uniform magnetic field as follows [32,33]:
1 T 2 = 1 T 2 B + ρ 2 S V + D γ G T E 2 12
where the three terms on the right-hand side represent free relaxation, surface relaxation, and diffusion relaxation, respectively; T2 (ms) is the transverse relaxation time; T2B (ms) is the free relaxation time of fluid inside the rock pores; ρ 2   μ m / ms is the transverse surface relaxation rate of the rock; V   c m 3 represents the volume of the rock pores; S   c m 2 denotes the surface area of the rock pores; D   μ m 2 / ms is the diffusion coefficient; γ   ( rad · s - 1 · T - 1 ) the gyromagnetic ratio; G   Gs / cm is the magnetic field strength; and T E (ms) is the echo time interval, in milliseconds.
Under typical circumstances, the value of T 2 B typically ranges between 2000 ms and 3000 ms, which is much greater than the value of T 2 ; thus, the first term on the right side of Equation (12) can be neglected. In a homogeneous magnetic field, the magnetic field strength G is small. When the echo time interval T E is sufficiently short, the third term on the right side of Equation (12) can be neglected. Therefore, Equation (12) can be simplified to
1 T 2 = ρ 2 S V
Further simplification of Equation (13) yields
1 T 2 = F s ρ 2 r
where F s represents the shape factor (for spherical pores, F s   = 3, and for cylindrical pores, F s = 2).
Combining Equations (10) and (14), we obtain
P C = C T 2
where C = 2 σ cos θ ρ 2 F s is referred to as the conversion constant.
From the above analysis, it is known that the capillary pressure P C   inside rock pores is related to the T2 spectrum distribution curve, both of which correspond to the pore size inside the rock. According to Equation (15), it can be deduced that capillary pressure P C is negatively correlated with T 2 . Therefore, the relationship between P C m i n and T 2 m a x can be expressed as follows:
P C m i n = C T 2 m a x
where T 2 m a x represents the maximum T2 time in the NMR T2 spectrum distribution curve.
Substituting Equations (15) and (16) into Equation (11) yields
S V = T 2 m a x T 2 D 3
Taking the logarithm of both sides of Equation (17) yields
ln S V = 3 D ln T 2 + D 3 ln T 2 m a x
From Equation (18), it can be inferred that if the internal pore structure of the rock exhibits fractal geometric characteristics, then ln S V should have a linear correlation with ln T 2 . Therefore, Equation (18) can be utilized to perform linear regression analysis on the T2 spectrum test data to obtain the fractal dimension D of the internal pore structure of the rock.

3.4.2. Fractal Dimension Characteristics of Sandstone Subjected to Freeze–Thaw Cycles

According to Equation (18), the NMR fractal dimensions obtained by linear fitting of the T2 spectrum test data of sandstone before and after freeze–thaw cycles in a water-saturated state are denoted as the total porosity fractal dimensions D T - Pre and D T - Post ; the NMR fractal dimensions obtained by linear fitting of the T2 spectrum test data of sandstone before and after freeze–thaw cycles in a centrifuged state are denoted as the residual porosity fractal dimensions D R - Pre and D R - Post ; and the NMR fractal dimensions obtained by linear fitting of the difference between the T2 spectrum test data of sandstone before and after freeze–thaw cycles in a water-saturated and centrifuged state are denoted as the effective porosity fractal dimensions D E - Pre and D E - Post . The fractal dimensions of sandstone subjected to different numbers of freeze–thaw cycles are shown in Table 4. According to fractal geometry theory, the NMR fractal dimensions of the internal pore structure of sandstone are between 2 and 3. From the NMR fractal dimension calculation graph in Figure 12, it can be observed that the NMR fractal dimensions of the total porosity and effective porosity of sandstone before and after the freeze–thaw cycles are between 2 and 3, with the correlation coefficients all greater than 0.500. However, the fractal dimensions of residual porosity are all less than 2, indicating that the total porosity and effective porosity of sandstone before and after freeze–thaw cycles exhibit geometric fractal characteristics, while the residual porosity does not exhibit obvious geometric fractal characteristics.
The changes in the NMR fractal dimensions of the total porosity and effective porosity of sandstone before and after freeze–thaw cycles are shown in Figure 13 and Figure 14, respectively. As indicated by Figure 13 and Figure 14, with the increase in the number of freeze–thaw cycles, the decrease in the NMR fractal dimensions of the total porosity and effective porosity of sandstone is more significant compared to before the freeze–thaw cycles, indicating that freeze–thaw cycles lead to an increase in micro-cracks and micro-pores inside the sandstone, which gradually connect with each other.
To quantify the evolution of the NMR fractal dimensions of porosity in sandstone with the number of freeze–thaw cycles, the growth rate of the NMR fractal dimensions of porosity was defined to characterize its evolution with the number of freeze–thaw cycles. The growth rate of the NMR fractal dimensions of porosity can be expressed as follows:
Δ D = D post D pre D pre × 100 %
where ΔD represents the growth rate of porosity (%), D pre denotes the NMR fractal dimensions of the porosity of sandstone before freeze–thaw cycles (/), and D post represents the NMR fractal dimensions of the porosity of sandstone after freeze–thaw cycles (/).
Based on the NMR fractal dimensions in Table 4, the growth rates of the NMR fractal dimensions of total porosity and effective porosity of sandstone subjected to freeze–thaw cycles can be obtained. According to Figure 15 and Figure 16, after undergoing 10, 20, 30, and 40 freeze–thaw cycles, the growth rates of the NMR fractal dimension of total porosity were −0.126%, −0.642%, −1.371%, and −3.484% respectively, while the growth rates of the NMR fractal dimension of effective porosity were −4.682%, −5.585%, −7.267%, and −9.969% respectively. Throughout the entire freeze–thaw cycle process, the growth rate of the NMR fractal dimensions of effective porosity was consistently lower than that of total porosity. Fitting the experimental data revealed that the growth rates of the NMR fractal dimensions of total porosity and effective porosity exhibited an exponentially decreasing relationship with the number of freeze–thaw cycles. According to fractal geometry theory, the magnitude of the fractal dimension reflects the complexity of the pore structure, with a smaller fractal dimension indicating weaker heterogeneity of pore distribution and more uniform distribution of pores inside the sandstone. This indicates that, after undergoing freeze–thaw cycles, the internal pores of the sandstone connect with each other, the heterogeneity of the pore structure gradually weakens, and the pore connectivity improves.

4. Discussions

4.1. Correlation Analysis of Porosity and Longitudinal Wave Velocity

The porosity of rocks can quantitatively describe the distribution of micro-cracks and micro-pores inside the rock, while the LWV is mainly influenced by the micro-cracks and micro-pores inside the rock. Therefore, a correlation analysis can be conducted between the porosity and LWV of sandstone. Based on the condition and properties of the sandstone, the formula v p = a p + b p P (where P represents porosity, and a p and b p are coefficients determined based on experimental data) is used for correlation analysis, as shown in Figure 17. From Figure 17, it can be observed that the total porosity of sandstone is linearly negatively correlated with the LWV, with a correlation coefficient of 0.991. Sandstone without undergoing freeze–thaw cycles has smaller porosity and higher velocity, as shown in the upper left of Figure 17. After undergoing different numbers of freeze–thaw cycles, the porosity of the sandstone increases, and the velocity decreases, gradually moving towards the lower right of Figure 17. It can be seen that after undergoing different numbers of freeze–thaw cycles, sandstone develops numerous defects, such as micro-cracks and micro-pores, due to the freeze–thaw cycles, resulting in an increase in porosity and a decrease in LWV.

4.2. Correlation Analysis of NMR Fractal Dimension

Figure 18 shows the correlation analysis between the effective porosity NMR fractal dimension and the total porosity and effective porosity. It can be observed from Figure 18 that the effective porosity NMR fractal dimension is negatively correlated with both total porosity and effective porosity. A quadratic function was selected to fit the experimental data, with correlations exceeding 0.95. According to the equations of the fitted curves, the effective porosity NMR fractal dimension forms upward-opening parabolas with both total porosity and effective porosity. Additionally, the rate of decrease in the effective porosity NMR fractal dimension with effective porosity is higher than that with total porosity, indicating a greater impact of the effective porosity NMR fractal dimension on effective porosity.
Through the correlation analysis between the effective porosity NMR fractal dimension and the total porosity and effective porosity, we found that the effective porosity NMR fractal dimension reflects the magnitude of the porosity. The smaller the effective porosity NMR fractal dimension, the larger the total porosity and effective porosity. At the same time, the size of the fractal dimension reflects the complexity of the pore structure. The smaller the fractal dimension, the weaker the heterogeneity, and the better the pore connectivity. It can be seen that with an increase in freeze–thaw cycles, the closed micro-cracks and micro-pores inside the sandstone gradually become connected under the action of the freeze–thaw cycles. The total porosity and effective porosity of the sandstone gradually increase, while the homogeneity of the pore structure gradually decreases, and the pore connectivity gradually strengthens.

4.3. Damage Mechanism of Sandstone Subjected to Freeze–Thaw Cycles

Freeze–thaw cycles induce the process of alternate freezing and swelling in water within micro-cracks and micro-defects within sandstone, leading to the release of frost heave forces and the migration of moisture, resulting in the connection of micro-defects inside the sandstone. Based on NMR technology and fractal theory, the changes in the pore structure inside sandstone subjected to freeze–thaw cycles were investigated. The results indicate that freeze–thaw cycles significantly affect the characteristics of the pore structure inside sandstone, leading to a decrease in the homogeneity of the internal pore structure and a significant enhancement of pore connectivity. According to the analysis results presented earlier, a schematic illustration of the damage evolution mechanism within sandstone during freeze–thaw cycles was proposed. As shown in Figure 19, the modes of action of freeze–thaw cycles primarily include the following steps: Under low-temperature conditions, water inside the sandstone gradually freezes to form ice crystals. Due to the large volume of ice, the expansion of water as it freezes inside the sandstone produces tensile stress. As the temperature increases, the frozen ice crystals gradually melt back into water, and the continuous freeze–thaw cycles inside the sandstone lead to the generation of pores and cracks. Therefore, the amplitude of the T2 spectrum of centrifuged sandstone after freeze–thaw cycles decreases, indicating that the water inside the residual pores of the sandstone is affected by freeze–thaw cycles, and the pores expand and connect to form effective pores; however, the amplitude of the T2 spectrum of water-saturated sandstone after freeze–thaw cycles increases, indicating that the expansion of residual pores forms effective pores, reflecting a decrease in the heterogeneity and an increase in connectivity and damage under freeze–thaw cycles. On the other hand, the results of the LWV of sandstone before and after freeze–thaw cycles show that the LWV of sandstone significantly decreases after freeze–thaw cycles, indicating that the freeze–thaw cycles lead to an increase in micro-cracks and micro-pores inside the sandstone and an increase in damage.

5. Conclusions

To quantitatively assess the evolution of the pore structure inside sandstone subjected to freeze–thaw cycles, low-field NMR testing technology, LWV testing, and fractal theory were employed to conduct quantitative analyses of the pore structure inside sandstone before and after freeze–thaw cycles, yielding the following main conclusions:
(1)
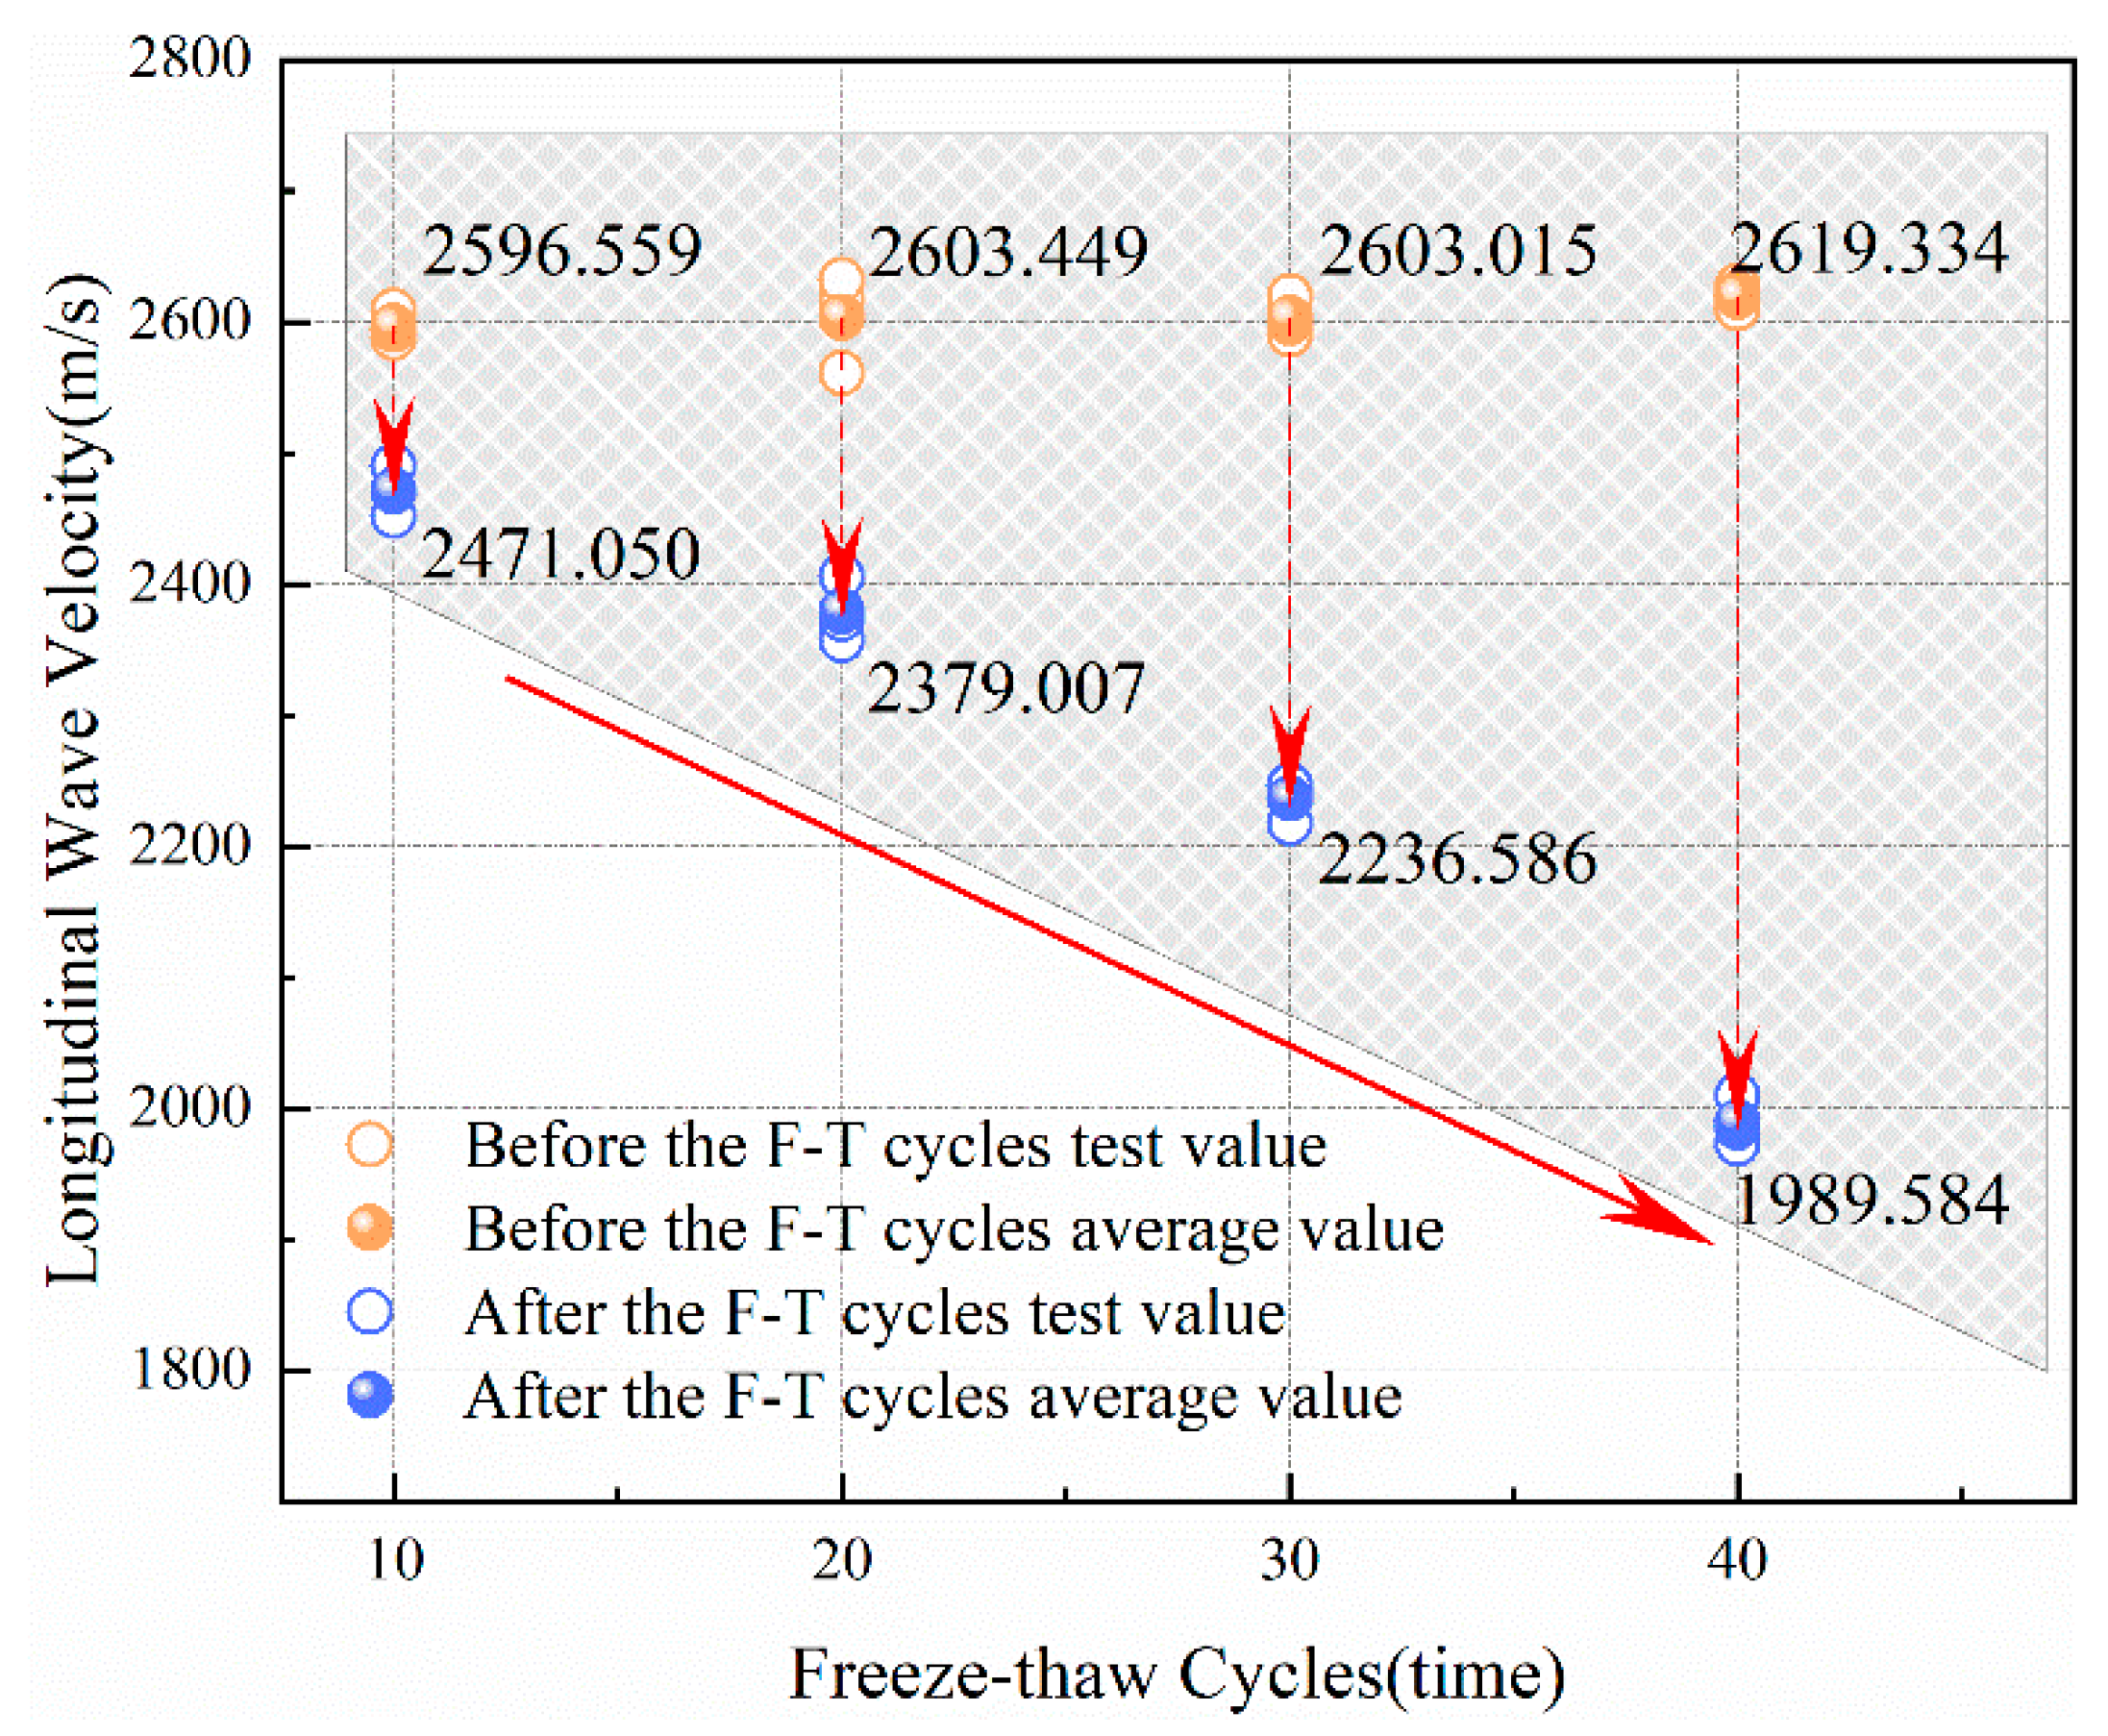
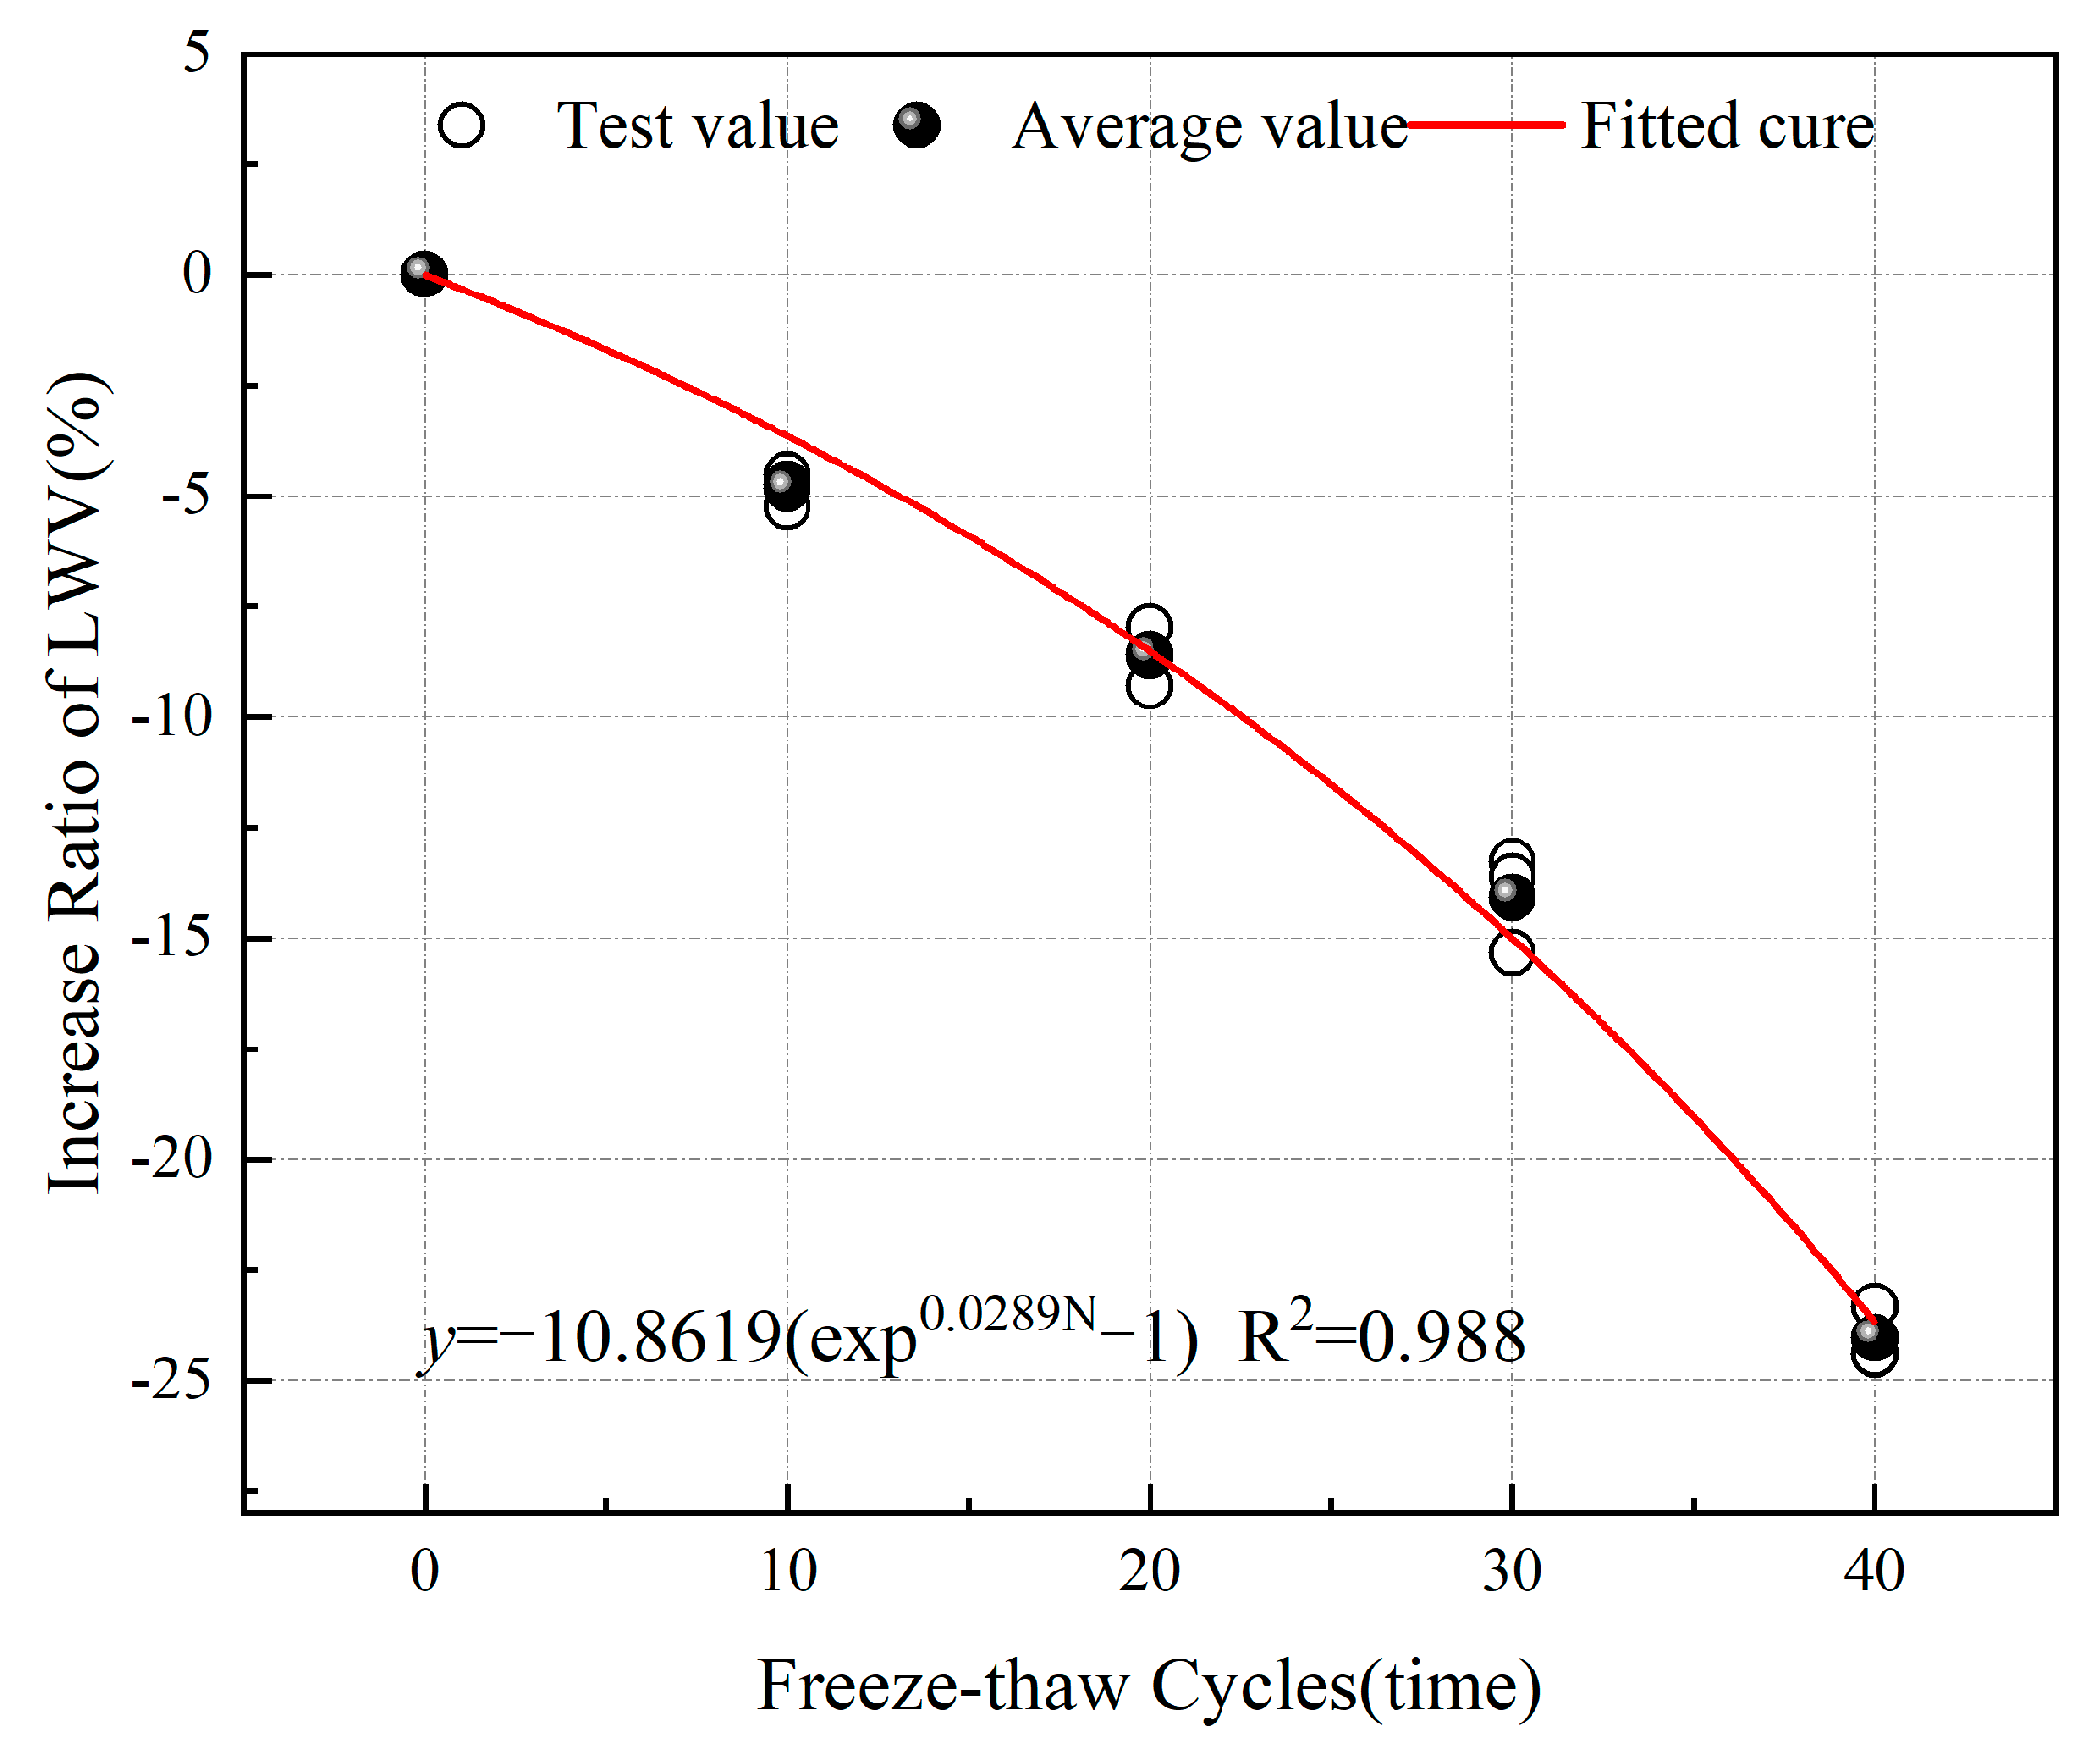
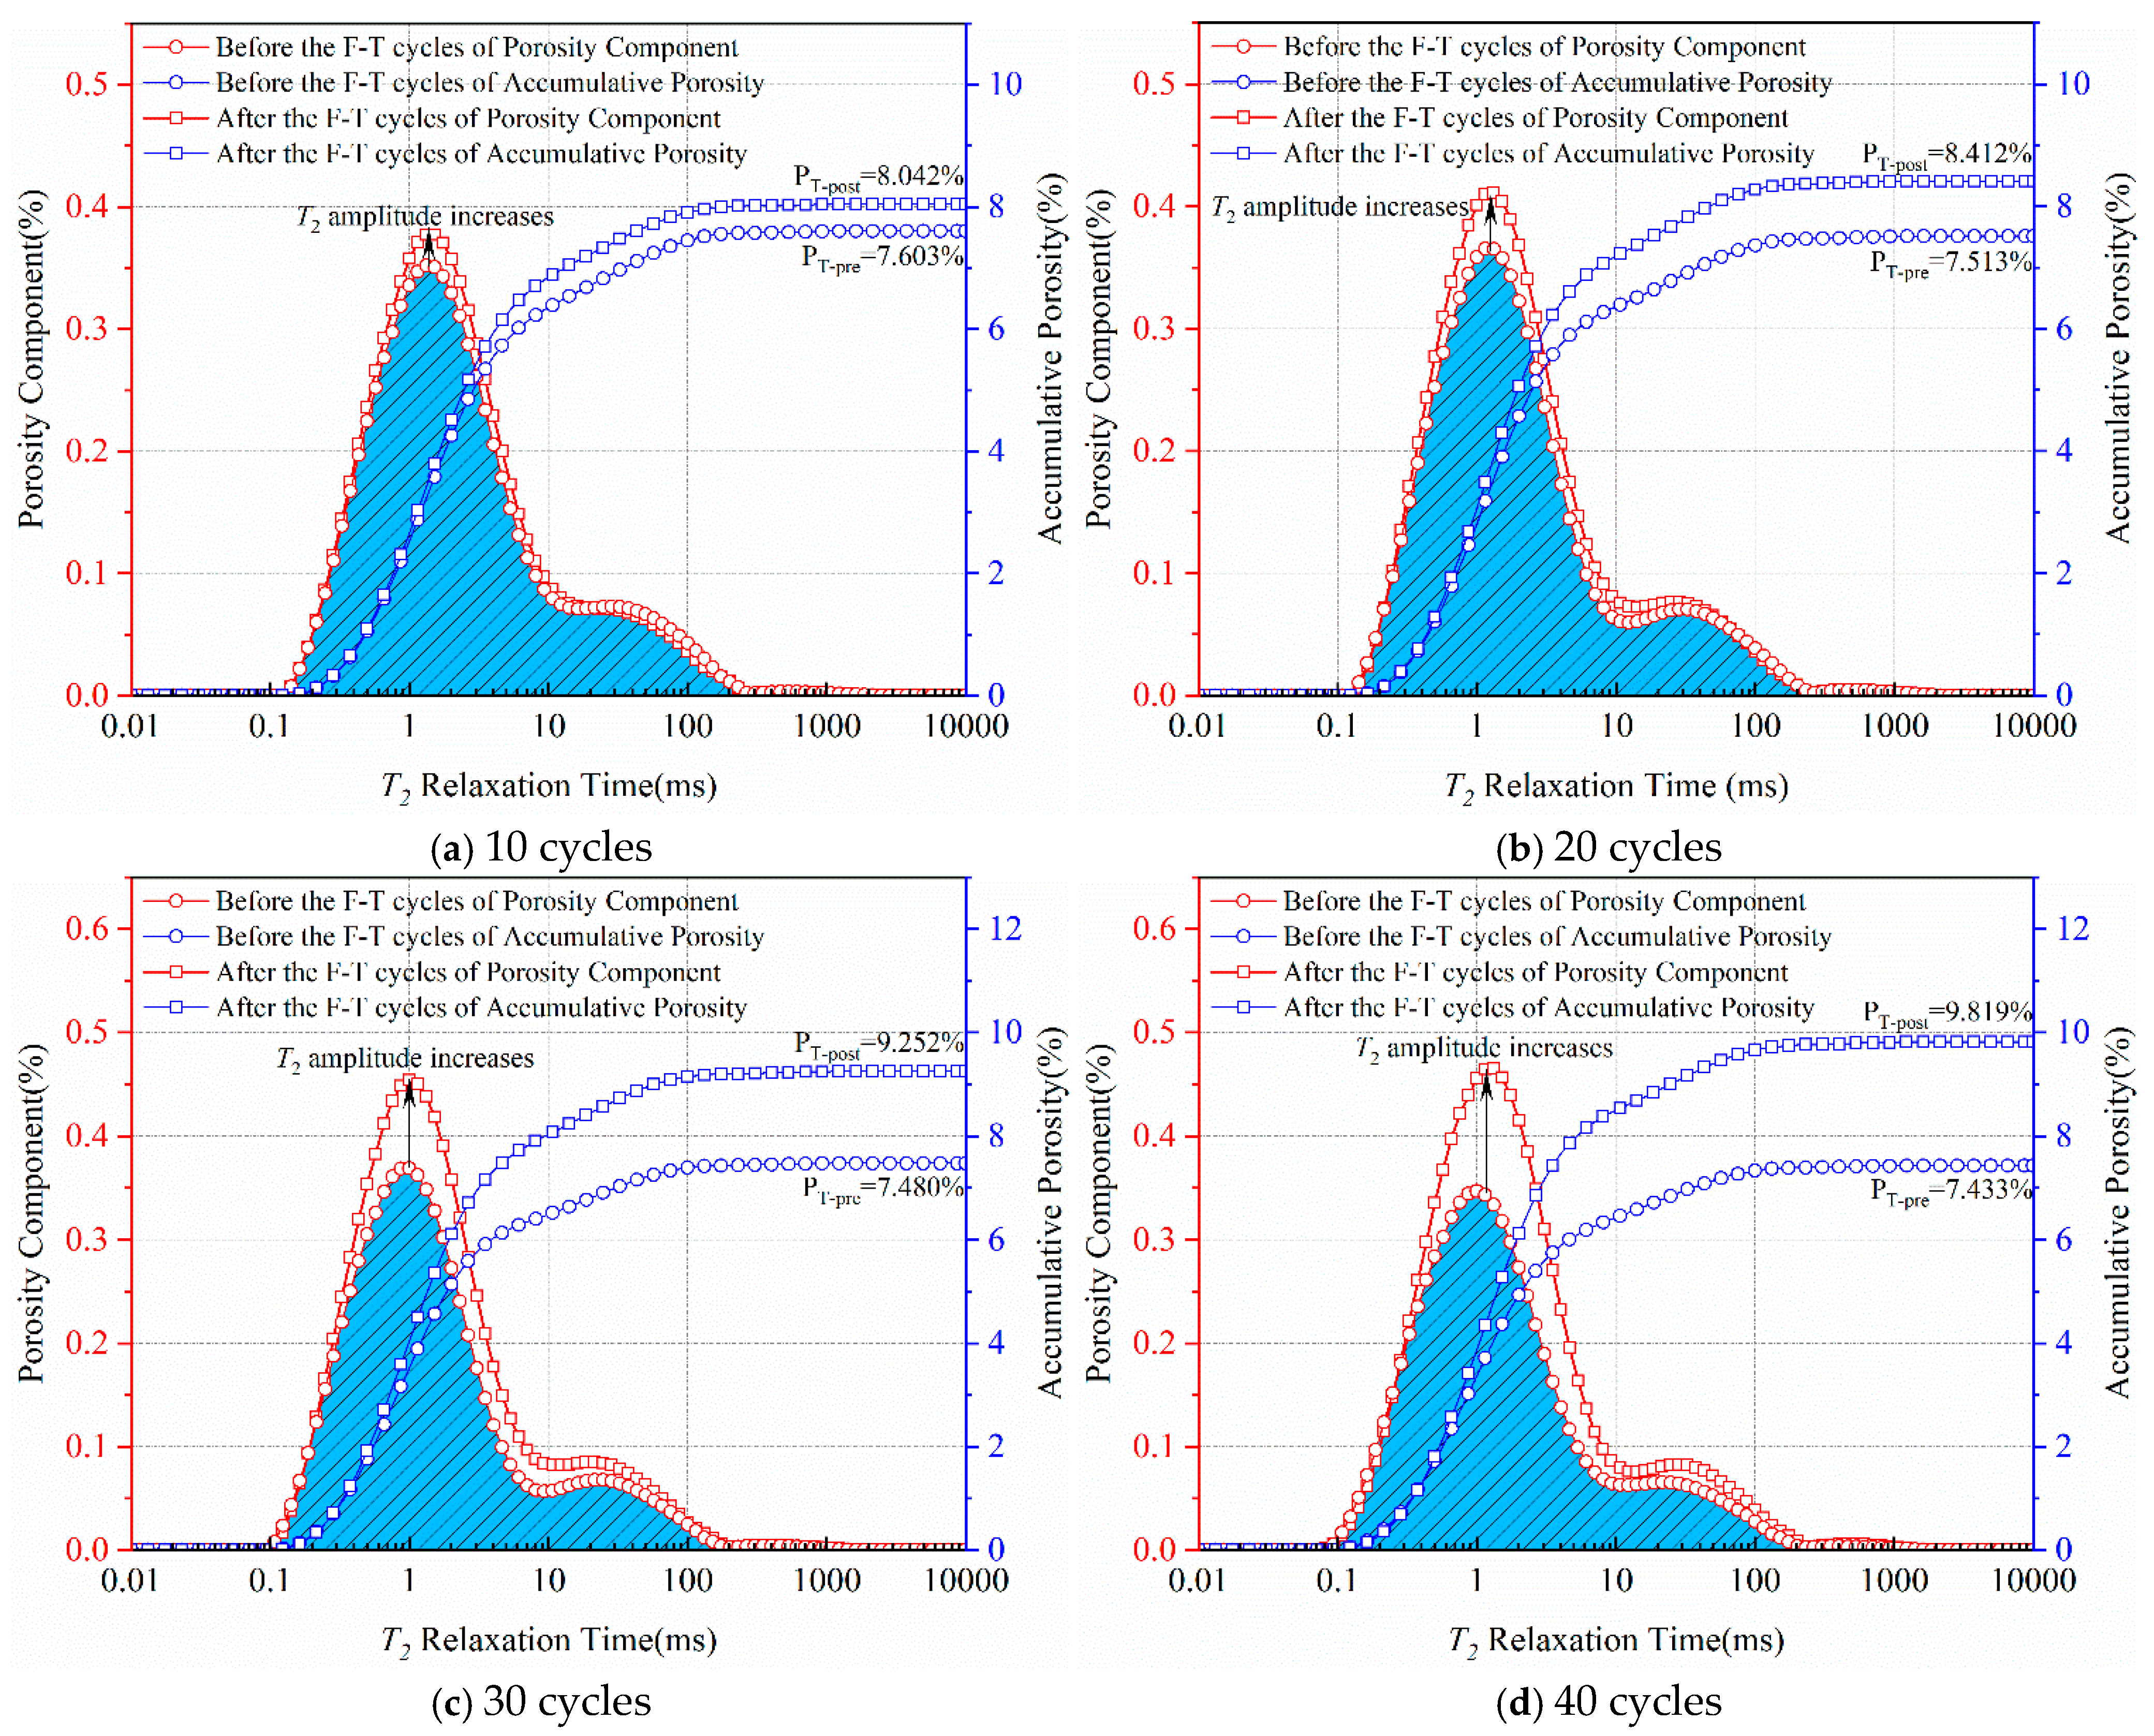
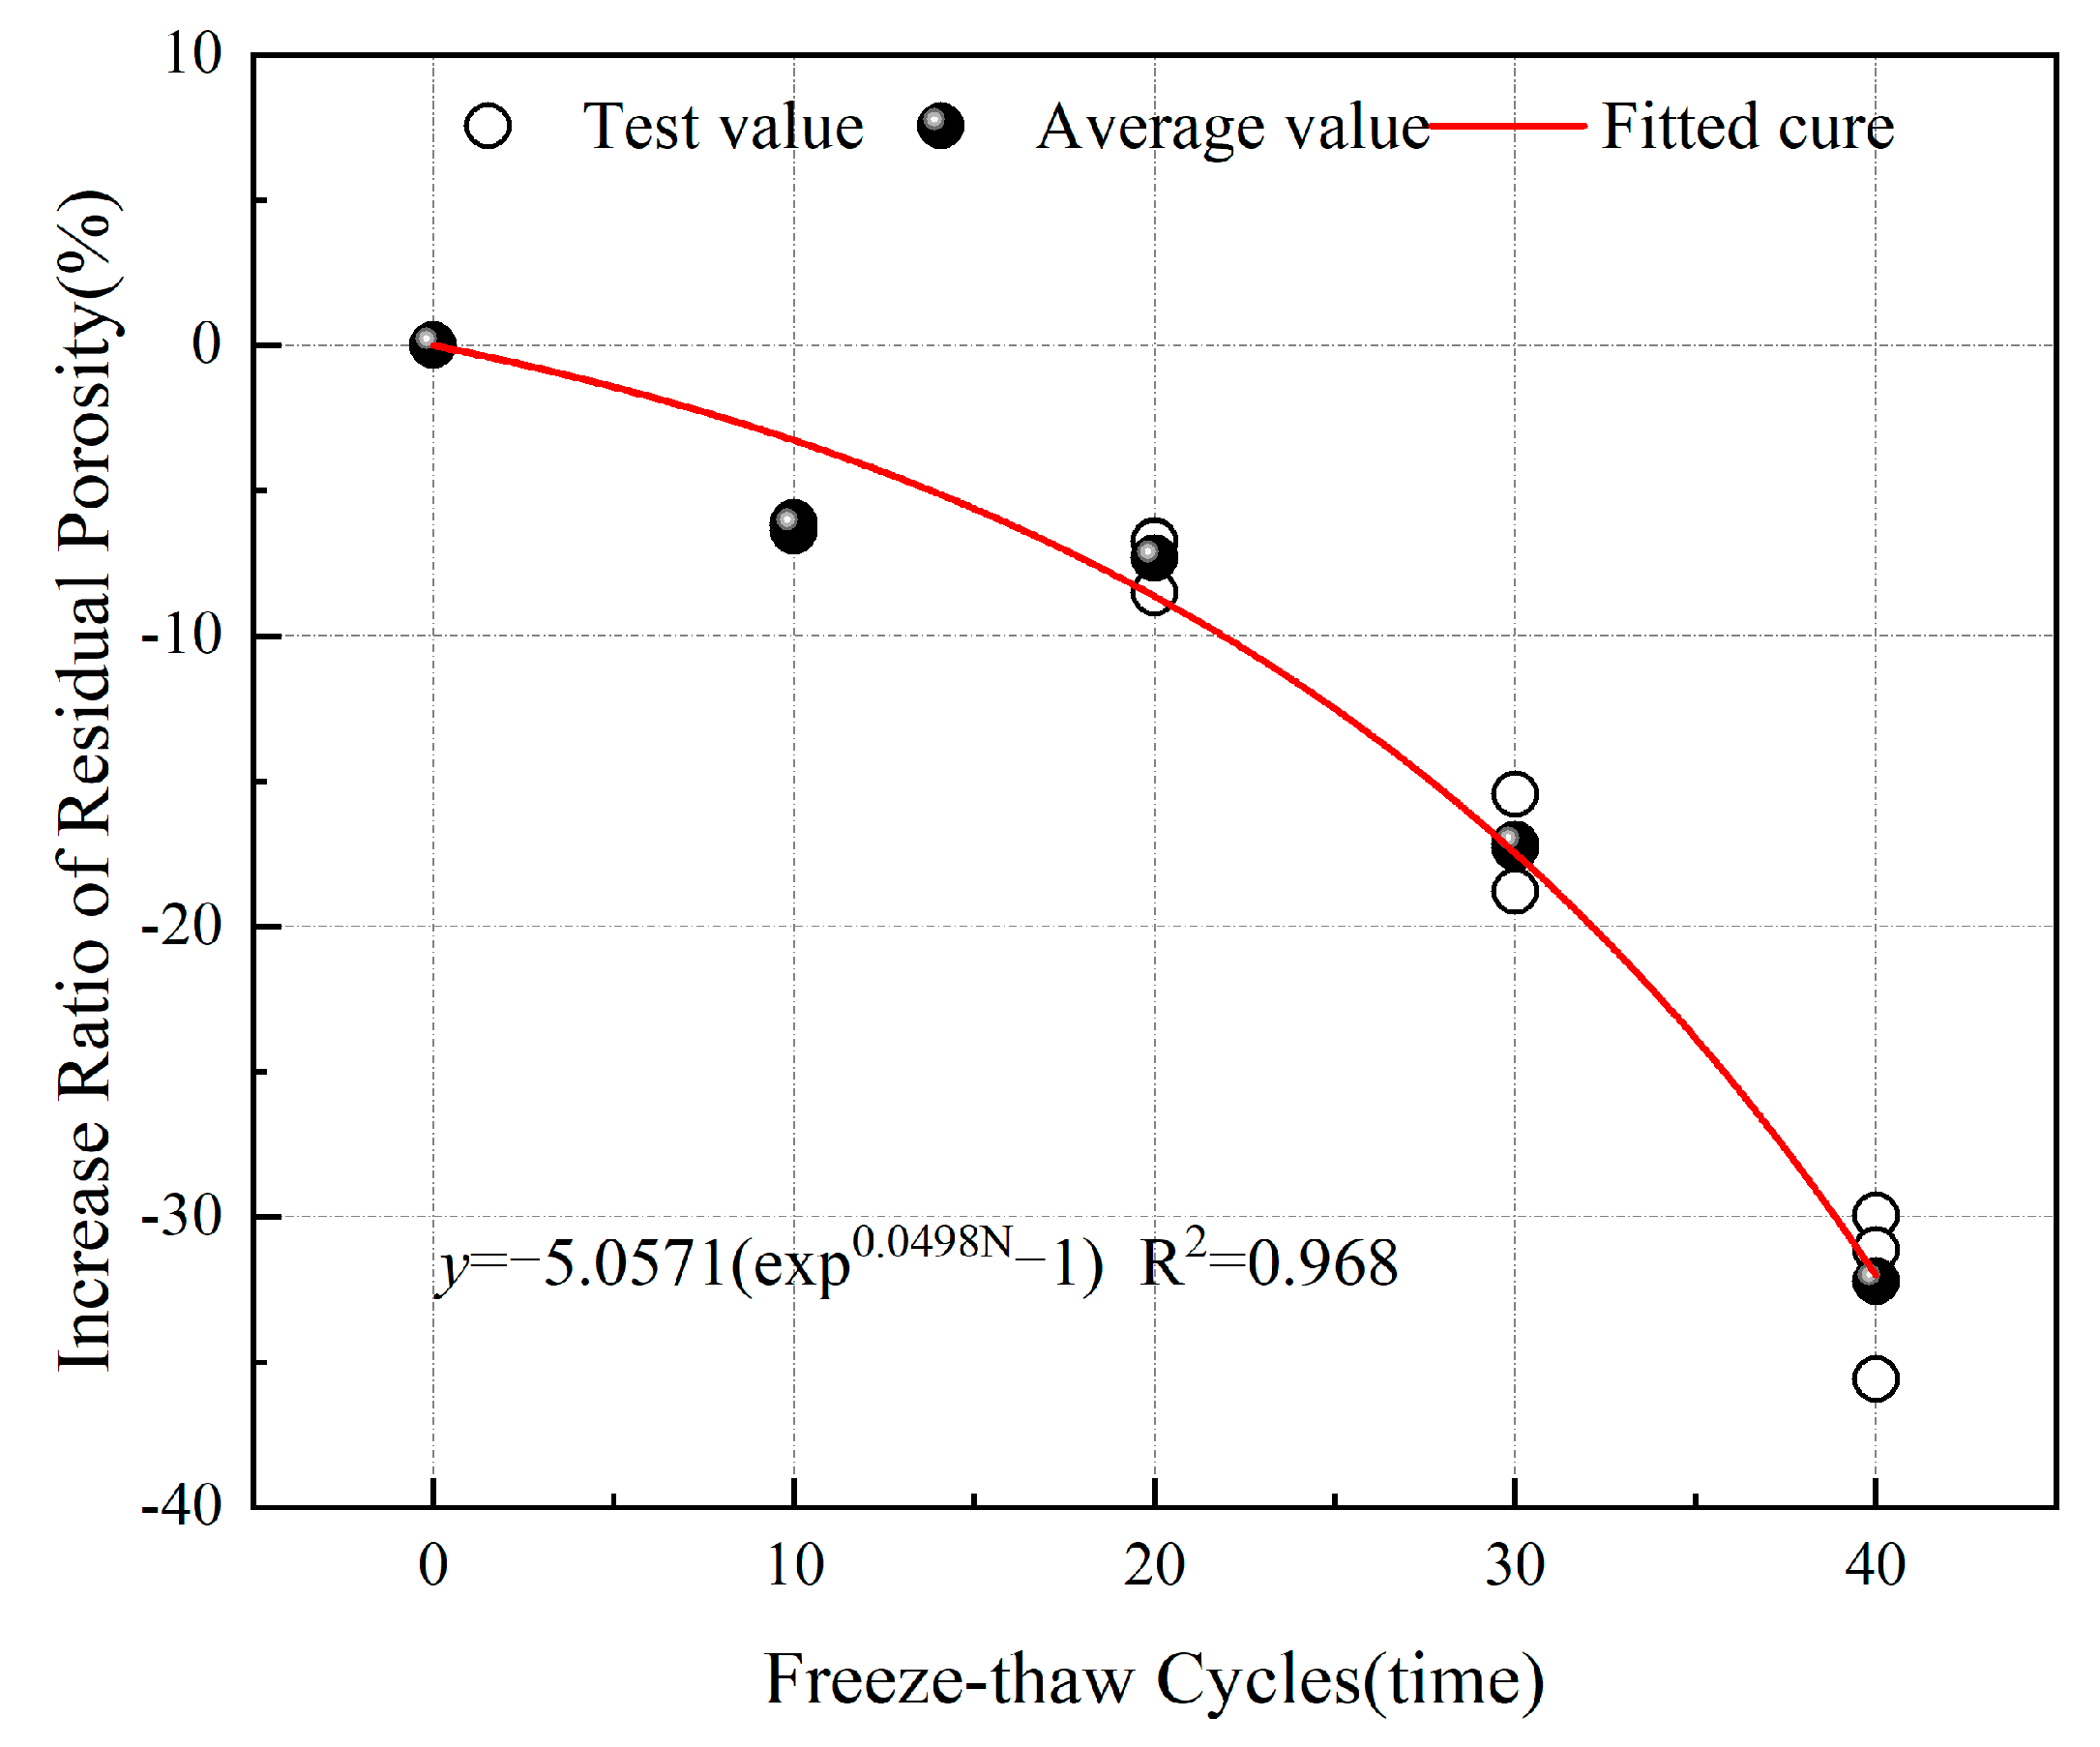
As the number of freeze–thaw cycles increases, the LWV of the sandstone gradually decreases, the amplitude of the water-saturated T2 spectrum increases, the amplitude of the centrifuged T2 spectrum decreases, the total porosity and effective porosity increase, and the residual porosity decreases. Additionally, the growth rates of total porosity and effective porosity exhibit exponential growth with increasing freeze–thaw cycles, while the growth rates of residual porosity and LWV exhibit exponential decreases.
(2)
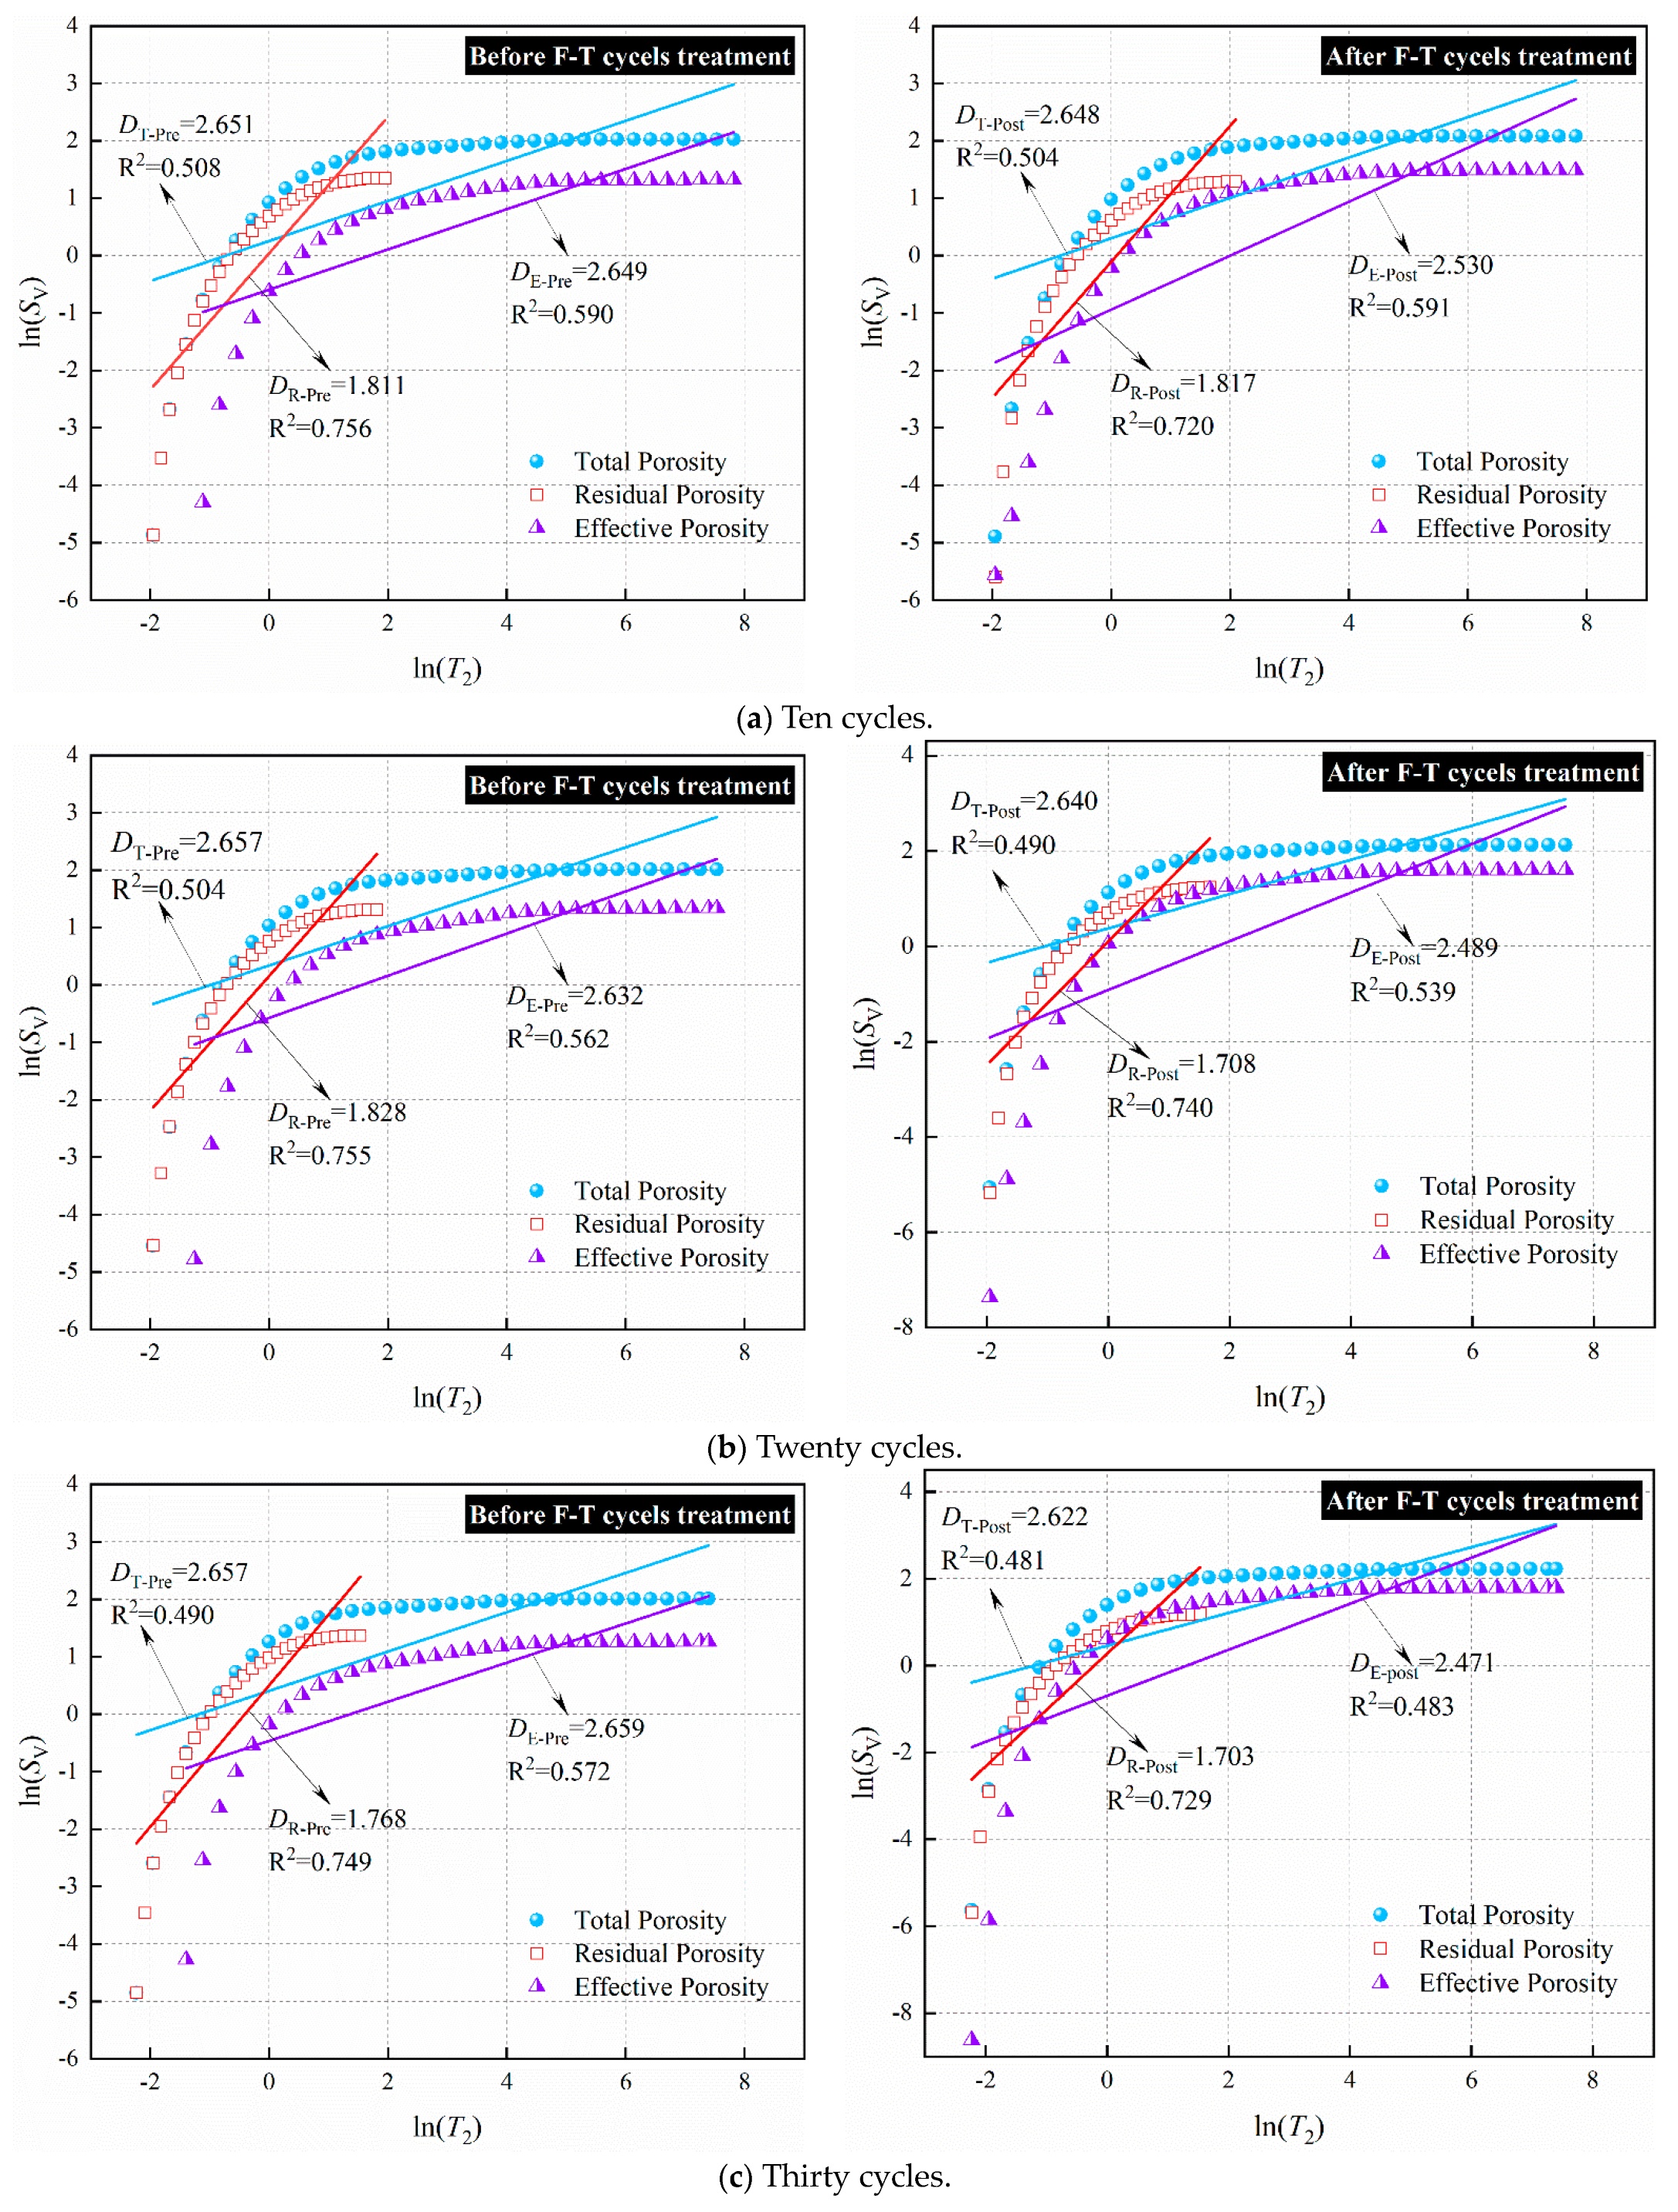
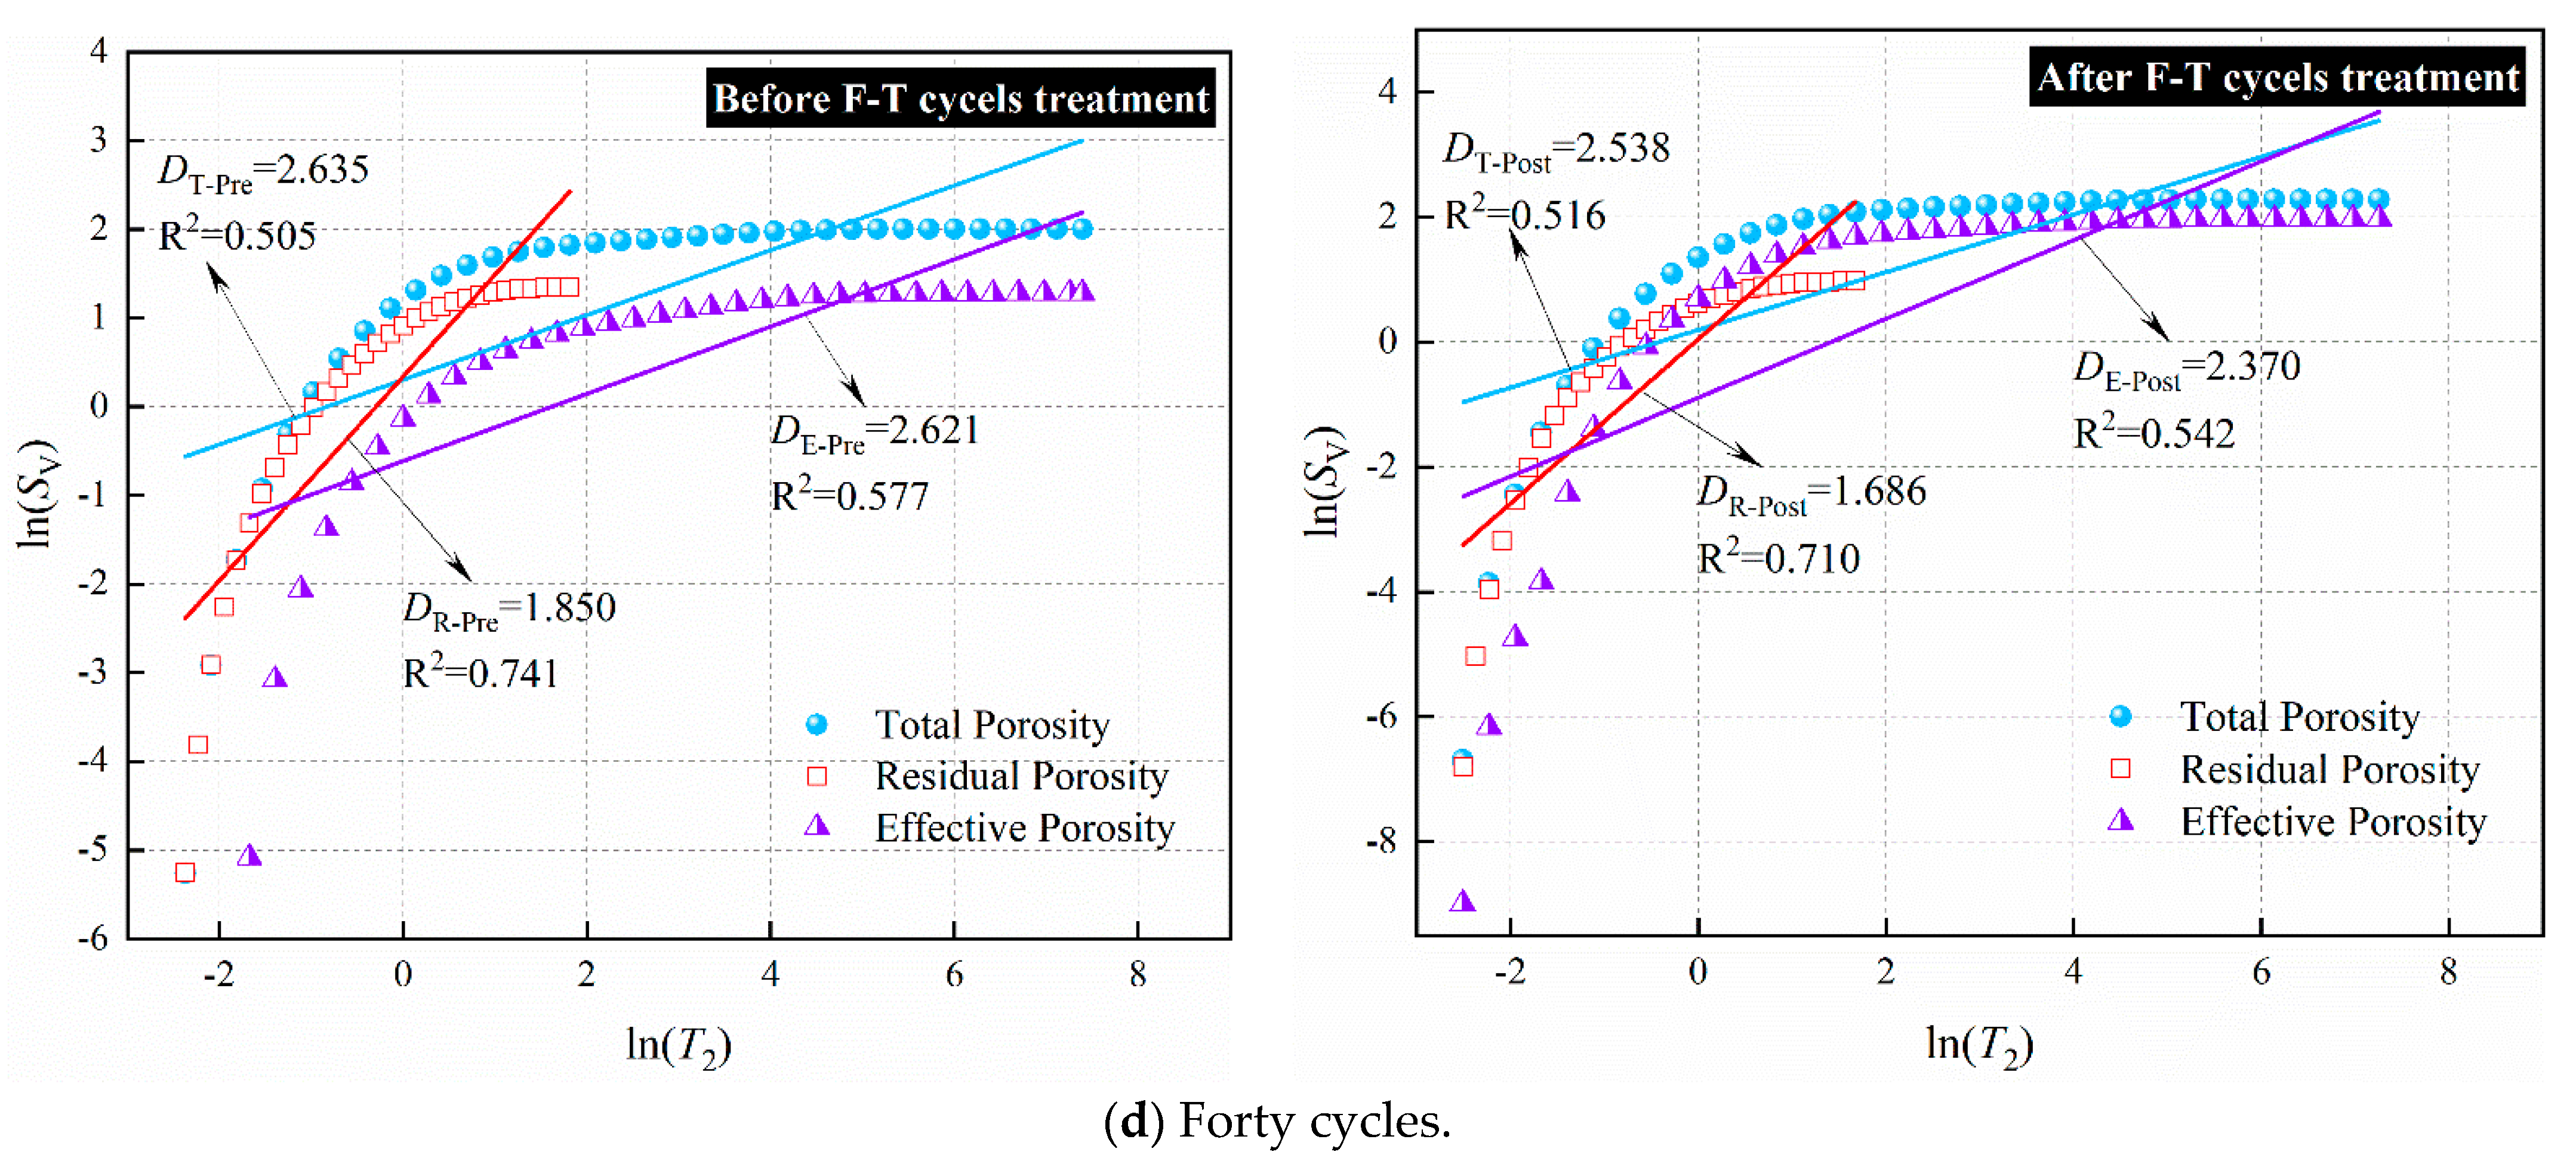
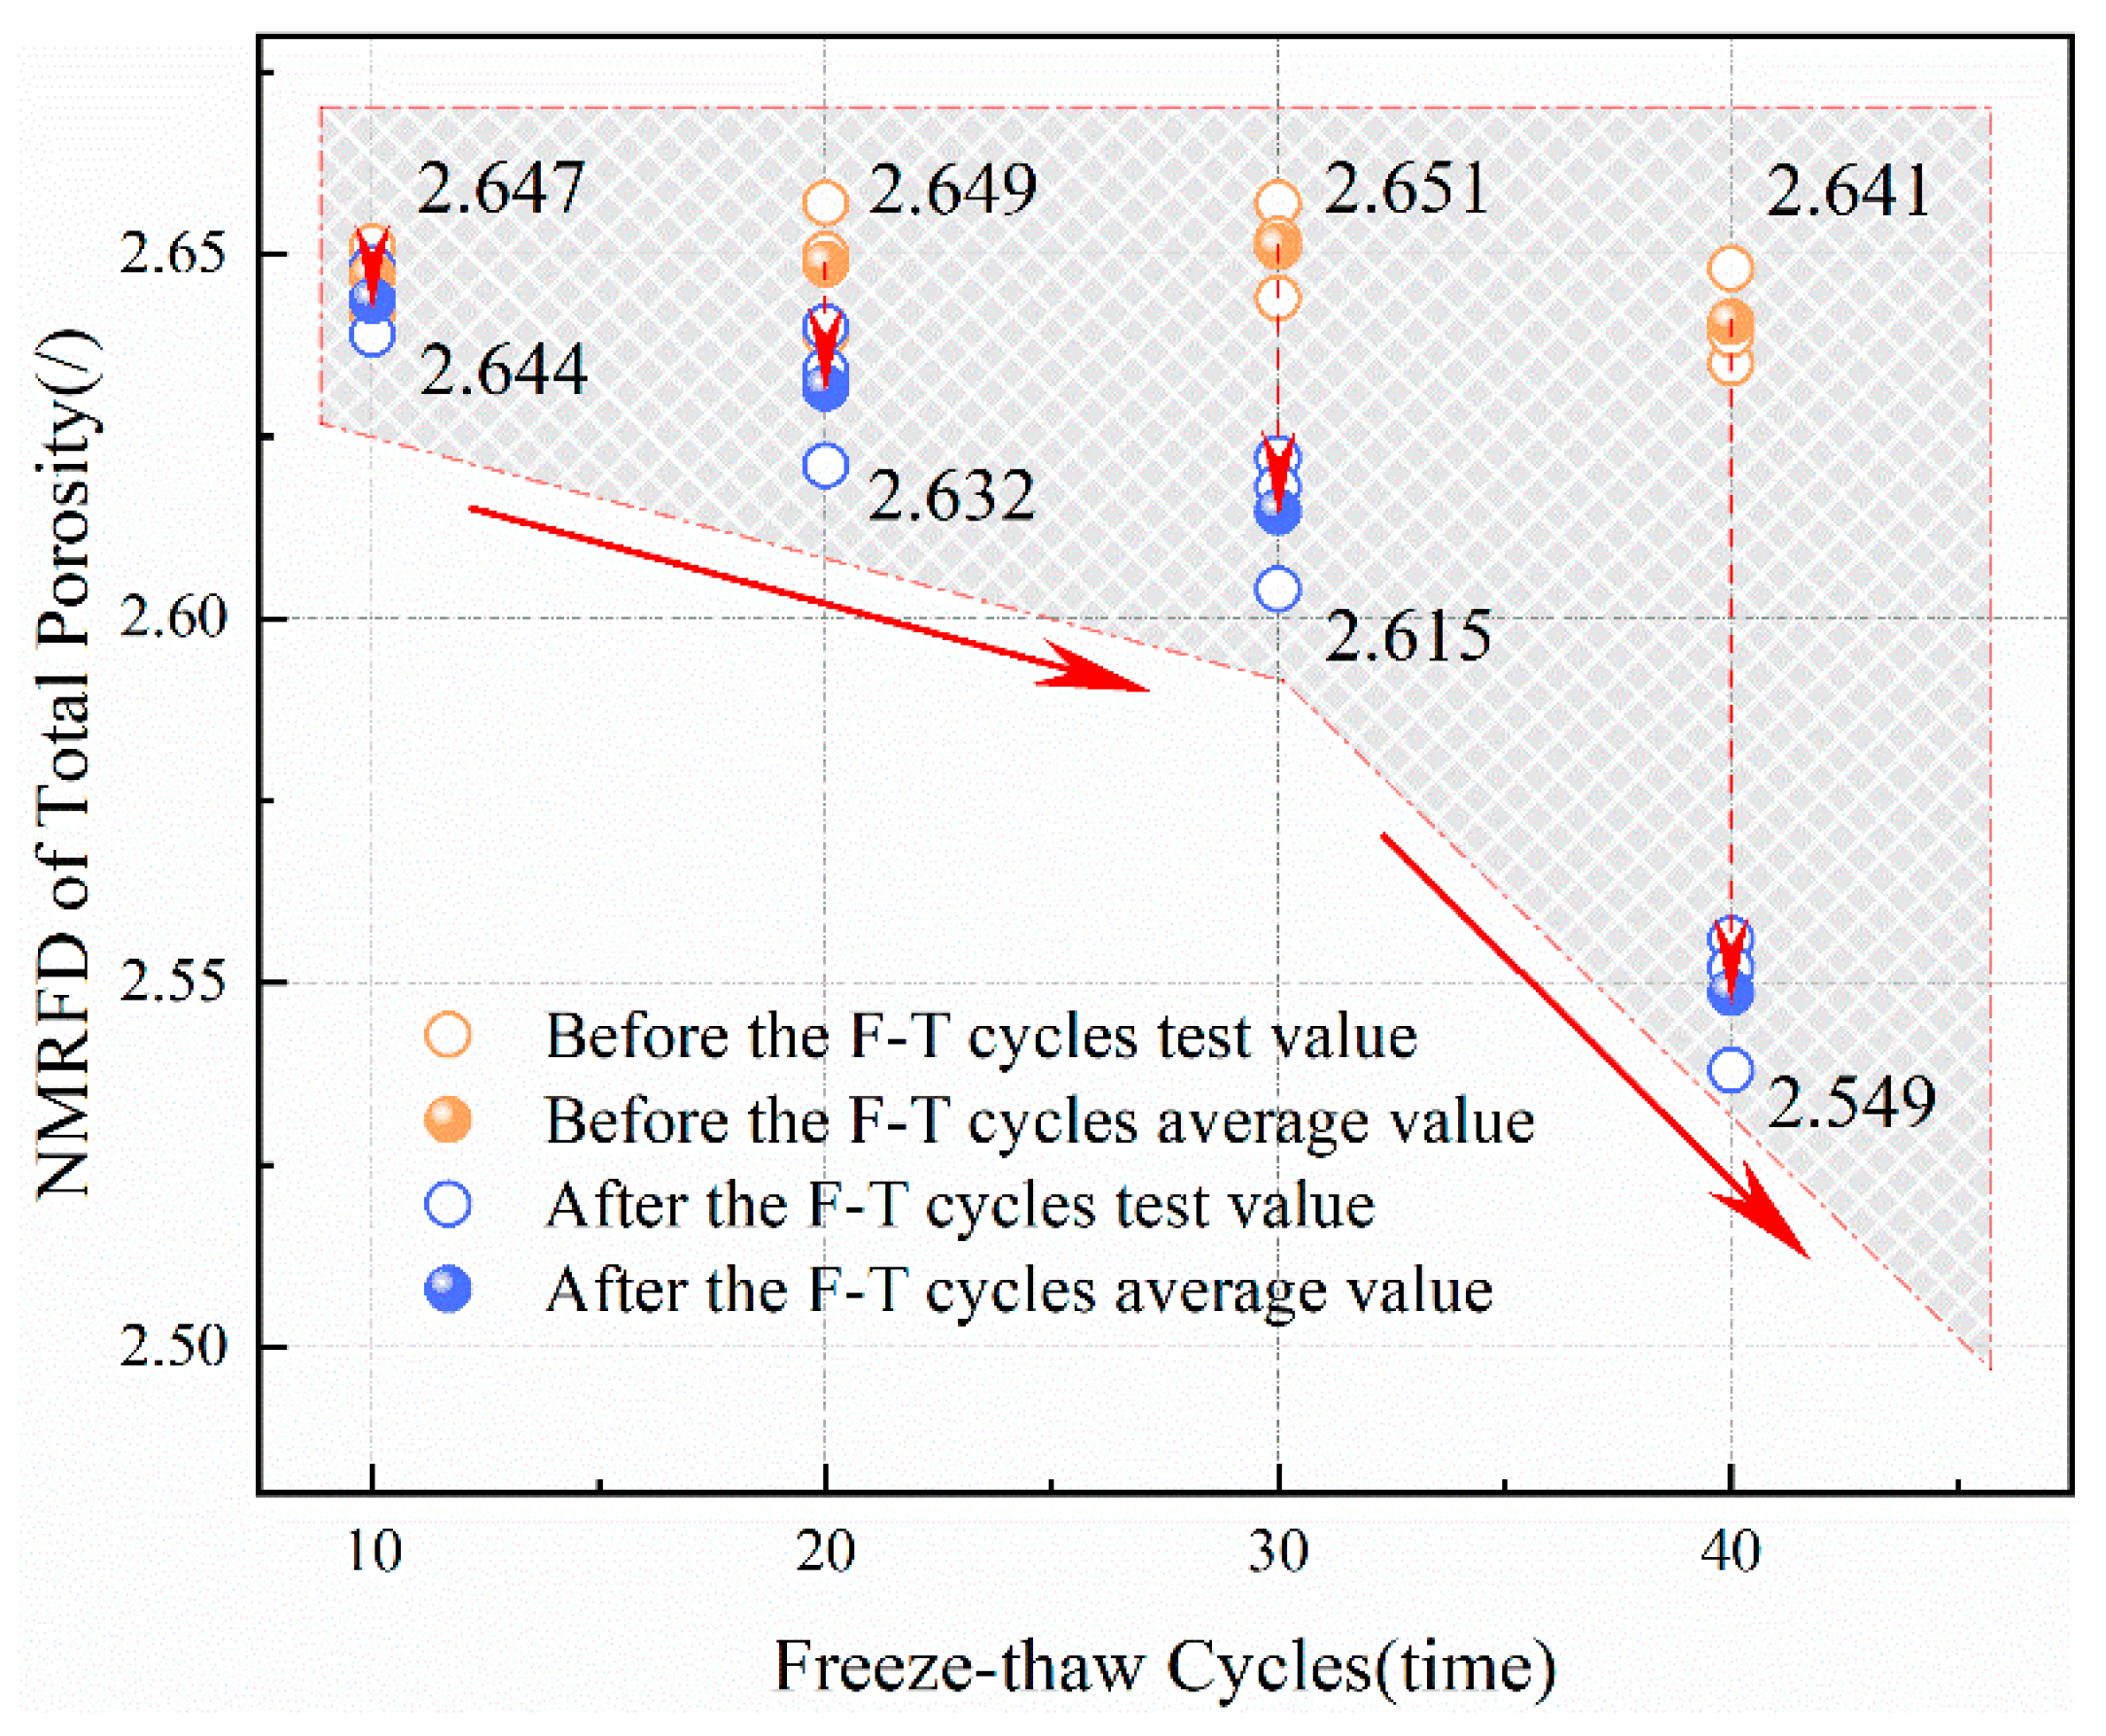
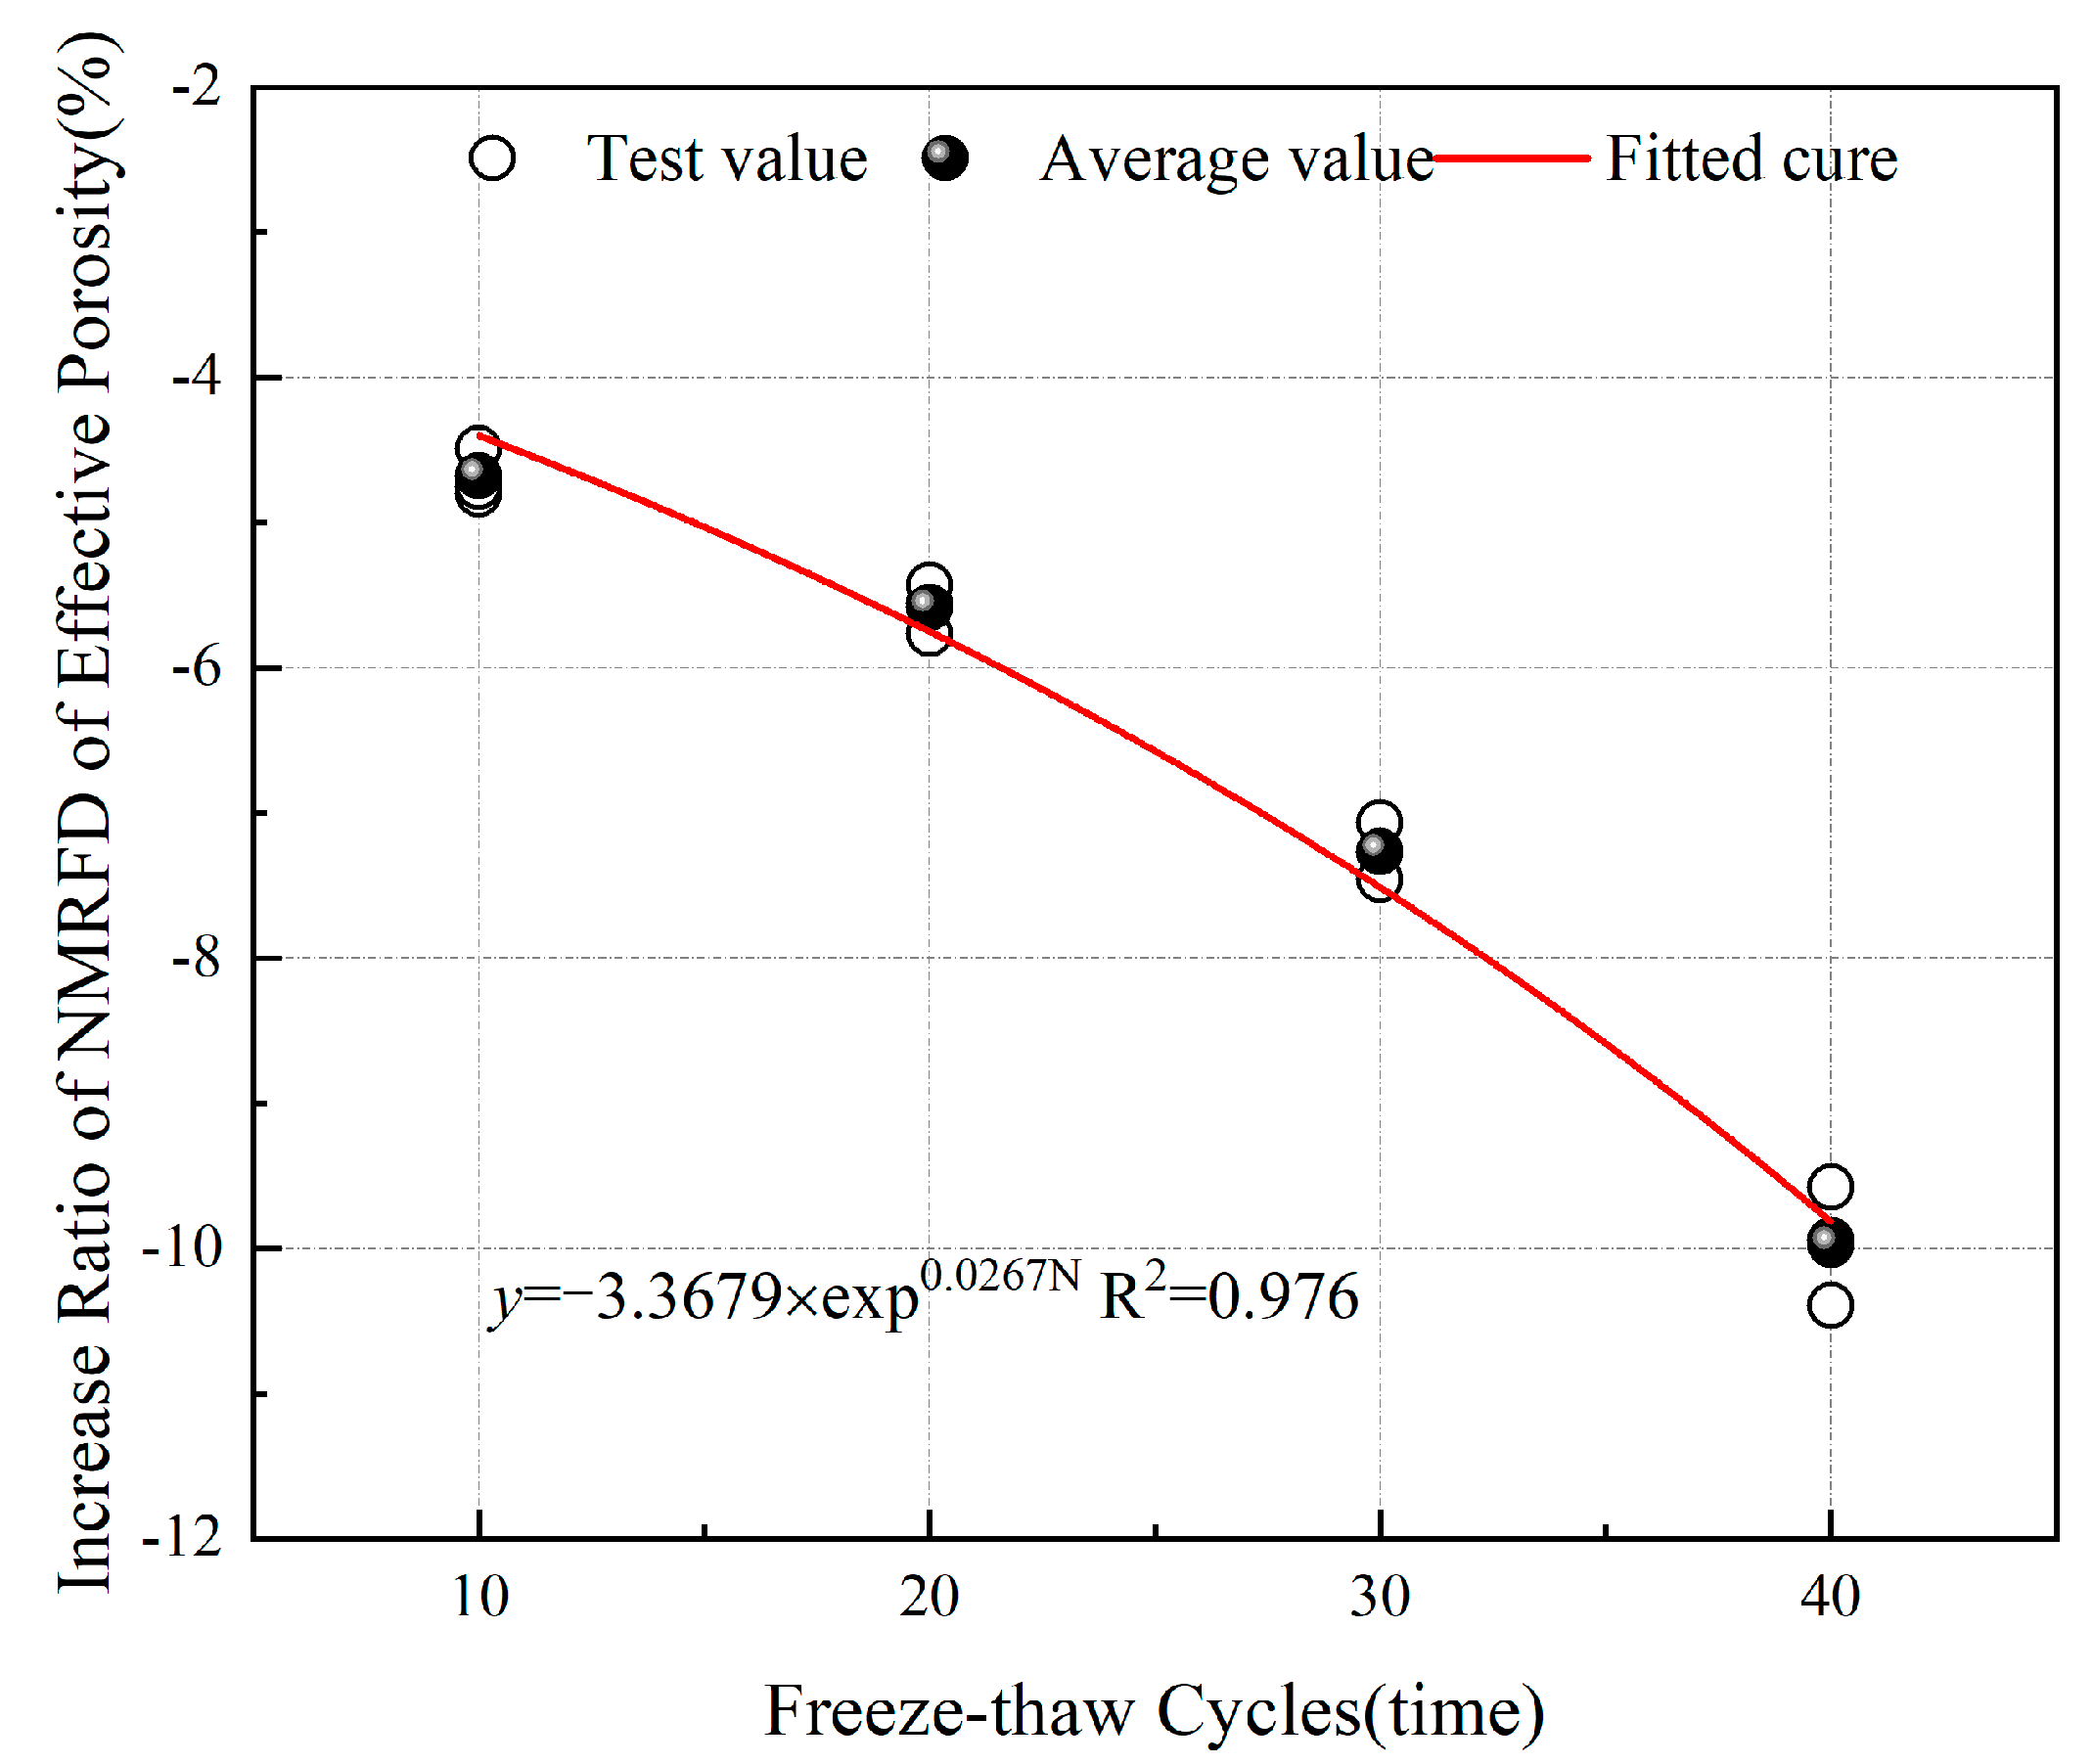
Based on fractal theory and NMR principles, the NMR fractal dimension of the sandstone was obtained. It was found that, after undergoing different numbers of freeze–thaw cycles, the total porosity NMR fractal dimension and effective porosity NMR fractal dimension of the sandstone exhibited obvious fractal characteristics, while the residual porosity NMR fractal dimension did not. The growth rates of the total porosity NMR fractal dimension and effective porosity NMR fractal dimension decreased exponentially with increasing freeze–thaw cycles.
(3)
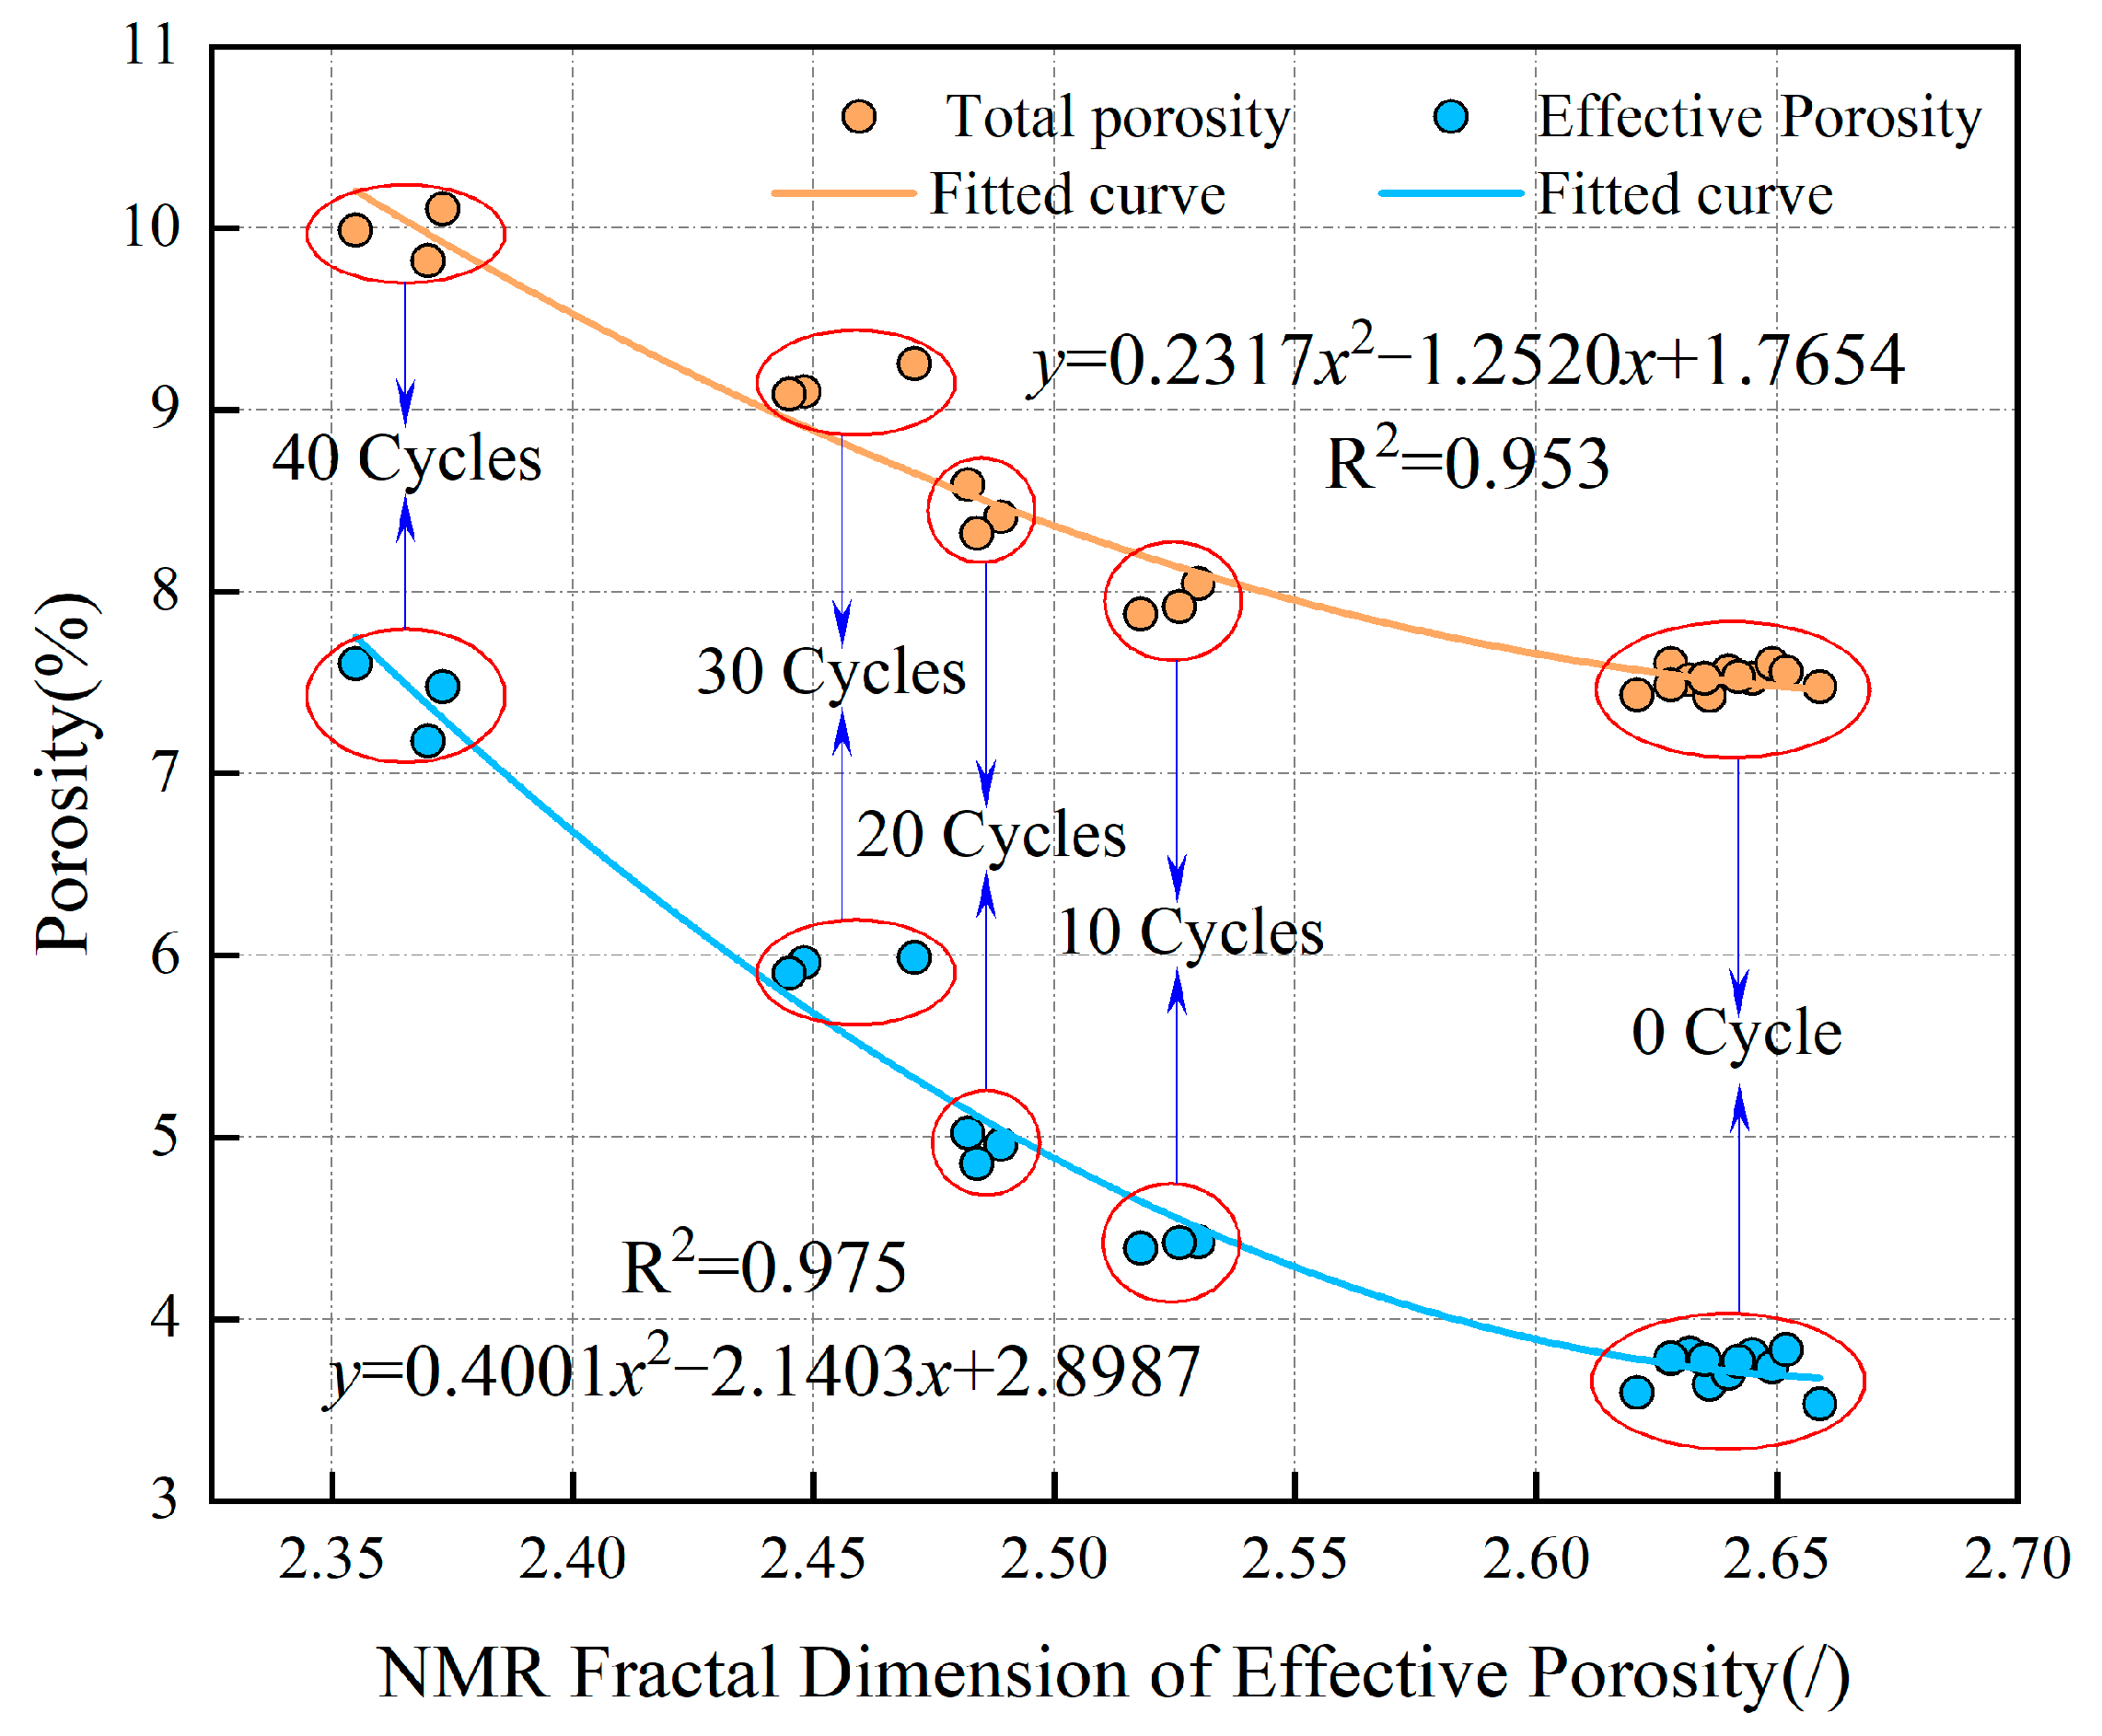
A correlation analysis was conducted between the NMR fractal dimensions of effective porosity and total porosity, as well as effective porosity, yielding predictive models for the total porosity and effective porosity based on the NMR fractal dimension of effective porosity. It was found that the smaller the NMR fractal dimension of effective porosity, the larger the total porosity and effective porosity. Additionally, the rate of decrease in the NMR fractal dimension of effective porosity with effective porosity was higher than that with total porosity.
(4)
Based on the analysis results of the LWV, porosity, T2 spectrum curves, and NMR fractal dimension of sandstone before and after undergoing freeze–thaw cycles, the damage evolution mechanism of sandstone under freeze–thaw cycles was revealed—that is, the gradual expansion and connection of micro-cracks and micro-pores inside the sandstone, leading to an increase in effective porosity and total porosity with increasing freeze–thaw cycles.

Author Contributions

Conceptualization, F.G. and K.Z.; Methodology, X.X. and J.L.; Software, X.X.; Investigation, X.X. and C.Y.; Data curation, X.X.; Writing—original draft, X.X.; Writing—review & editing, J.L.; Supervision, F.G. and K.Z.; Funding acquisition, J.L. All authors have read and agreed to the published version of the manuscript.

Funding

This work was supported by the National Natural Science Foundation of China (Grant No. 52474167).

Data Availability Statement

Data is contained within the article.

Conflicts of Interest

The authors declare that they have no known competing financial interests or personal relationships that could have appeared to influence the work reported in this paper.

References

  1. Zhu, Z.; Tian, H.; Jiang, G.; Cheng, W. Effects of High Temperature on the Mechanical Properties of Chinese Marble. Rock Mech. Rock Eng. 2018, 51, 1937–1942. [Google Scholar] [CrossRef]
  2. Jia, H.; Wei, X.; Shen, Y.; Yang, G. Discussion of the key issues within calculation of the fatigue damage of rocks subjected to freeze-thaw cycles. Chin. J. Rock Mech. Eng. 2017, 36, 335–346. [Google Scholar] [CrossRef]
  3. Wang, P.; Xu, J.; Liu, S.; Liu, S.; Wang, H. A prediction model for the dynamic mechanical degradation of sedimentary rock after a long-term freeze-thaw weathering: Considering the strain-rate effect. Cold Reg. Sci. Technol. 2016, 131, 16–23. [Google Scholar] [CrossRef]
  4. Girard, L.; Gruber, S.; Weber, S.; Beutel, J. Environmental controls of frost cracking revealed through in situ acoustic emission measurements in steep bedrock. Geophys. Res. Lett. 2013, 40, 1748–1753. [Google Scholar] [CrossRef]
  5. Chen, T.; Yeung, M.; Mori, N. Effect of water saturation on deterioration of welded tuff due to freeze-thaw action. Cold Reg. Sci. Technol. 2004, 38, 127–136. [Google Scholar] [CrossRef]
  6. Momeni, A.; Abdilor, Y.; Khanlari, G.R.; Heidari, M.; Sepahi, A.A. The effect of freeze-thaw cycles on physical and mechanical properties of granitoid hard rocks. Bull. Eng. Geol. Environ. 2016, 75, 1649–1656. [Google Scholar] [CrossRef]
  7. Park, J.; Hyun, C.-U.; Park, H.-D. Changes in microstructure and physical properties of rocks caused by artificial freeze-thaw action. Bull. Eng. Geol. Environ. 2015, 74, 555–565. [Google Scholar] [CrossRef]
  8. Huang, S.; He, Y.; Yu, S.; Cai, C. Experimental investigation and prediction model for UCS loss of unsaturated sandstones under freeze-thaw action. Int. J. Min. Sci. Technol. 2022, 32, 41–49. [Google Scholar] [CrossRef]
  9. Huang, S.; Cai, C.; Yu, S.; He, Y.; Cui, X. Study on damage evaluation indexes and evolution models of rocks under freeze-thaw considering the effect of water saturations. Int. J. Damage Mech. 2022, 31, 1477–1505. [Google Scholar] [CrossRef]
  10. Qin, X.; Meng, S.; Cao, D.; Tu, Y.; Sabourova, N.; Grip, N.; Ohlsson, U.; Blanksvärd, T.; Sas, G.; Elfgren, L. Evaluation of freeze-thaw damage on concrete material and prestressed concrete specimens. Constr. Build. Mater. 2016, 125, 892–904. [Google Scholar] [CrossRef]
  11. Gao, F.; Xiong, X.; Xu, C.; Zhou, K. Mechanical property deterioration characteristics and a new constitutive model for rocks subjected to freeze-thaw weathering process. Int. J. Rock Mech. Min. Sci. 2021, 140, 104642. [Google Scholar] [CrossRef]
  12. Xiong, X.; Gao, F.; Zhou, K.; Li, C.; Zhang, Y. Dynamic tensile mechanical properties of water-saturated and frozen sandstone after freeze-thaw fatigue damage treatment. J. Mater. Res. Technol. 2023, 24, 9323–9338. [Google Scholar] [CrossRef]
  13. Xiong, X.; Zhou, K.; Gao, F.; Xu, C.; Li, J. A new damage constitutive model for frozen-thawed sandstone under triaxial conditions: Considering the characteristics of pre-peak compaction and post-peak residual strength. Int. J. Damage Mech. 2024, 33, 193–222. [Google Scholar] [CrossRef]
  14. Wang, Y.; Zhu, C.; He, M.; Wang, X.; Le, H. Macro-meso dynamic fracture behaviors of Xinjiang marble exposed to freeze thaw and frequent impact disturbance loads: A lab-scale testing. Geomech. Geophys. Geo-Energy Geo-Resour. 2022, 8, 154. [Google Scholar] [CrossRef]
  15. Song, Y.; Tan, H.; Yang, H.; Chen, S.; Che y Chen, J. Fracture evolution and failure characteristics of sandstone under freeze-thaw cycling by computed tomography. Eng. Geol. 2021, 294, 106370. [Google Scholar] [CrossRef]
  16. Feng, Q.; Hou, S.; Liu, W.; Zhang, S.; Li, W.; Tian, M. Study on the simulation method and mesoscopic characteristics of rock freeze-thaw damage. Comput. Geotech. 2023, 153, 105038. [Google Scholar] [CrossRef]
  17. Xu, Y.; Chen, B.; Wu, B.; Chen, Z.; Yang, L.; Li, P. Influence of freeze-thaw cycling on the dynamic compressive failure of rocks subjected to hydrostatic pressure. Bull. Eng. Geol. Environ. 2022, 81, 276. [Google Scholar] [CrossRef]
  18. Zhang, Q.; Liu, Y.; Dai, F.; Jiang, R. Experimental assessment on the fatigue mechanical properties and fracturing mechanism of sandstone exposed to freeze-thaw treatment and cyclic uniaxial compression. Eng. Geol. 2022, 306, 106724. [Google Scholar] [CrossRef]
  19. Hou, C.; Jin, X.; He, J.; Li, H. Experimental studies on the pore structure and mechanical properties of anhydrite rock under freeze-thaw cycles. J. Rock Mech. Geotech. 2022, 14, 781–797. [Google Scholar] [CrossRef]
  20. Zhou, K.; Li, J.; Xu, Y.; Zhang, Y.; Yang, P.; Chen, L. Experimental study of NMR characteristics in rock under freezing and thawing cycles. Chin. J. Rock Mech. Eng. 2012, 31, 731–737. [Google Scholar]
  21. Zhou, K.; Li, B.; Li, J.; Deng, H.; Bin, F. Microscopic damage and dynamic mechanical properties of rock under freeze-thaw environment. Trans. Nonferrous Met. Soc. China 2015, 25, 1254–1261. [Google Scholar] [CrossRef]
  22. Li, J.; Kaunda, R.B.; Zhou, K. Experimental investigations on the effects of ambient freeze-thaw cycling on dynamic properties and rock pore structure deterioration of sandstone. Cold Reg. Sci. Technol. 2018, 154, 133–141. [Google Scholar] [CrossRef]
  23. Jia, H.; Ding, S.; Zi, F.; Dong, Y.; Shen, Y. Evolution in sandstone pore structures with freeze-thaw cycling and interpretation of damage mechanisms in saturated porous rocks. Catena 2020, 195, 104915. [Google Scholar] [CrossRef]
  24. Meng, F.; Zhai, Y.; Li, Y.; Xie, Q.; Gao, H.; Dong, Q. Research on Deterioration Mechanism and Dynamic Triaxial Compression Characteristics of Freeze-Thaw Sandstone. Rock Mech. Rock Eng. 2023, 56, 2333–2355. [Google Scholar] [CrossRef]
  25. Liu, C.; Deng, J.; Yu, S.; Li, P.; Lin, Y. Effect of Freezing and Thawing on Microstructure Damage and Dynamic Flexural Tension of Granite. Rock Mech. Rock Eng. 2020, 53, 3853–3858. [Google Scholar] [CrossRef]
  26. Liu, C.; Deng, H.; Chen, X.; Xiao, D.; Li, B. Impact of Rock Samples Size on the Microstructural Changes Induced by Freeze–Thaw Cycles. Rock Mech. Rock Eng. 2020, 53, 5293–5300. [Google Scholar] [CrossRef]
  27. Ulusay, R. The ISRM Suggested Methods for Rock Characterization, Testing and Monitoring: 2007–2014; Springer International Publishing: Berlin/Heidelberg, Germany, 2015. [Google Scholar] [CrossRef]
  28. Daigle, H.; Johnson, A.; Thomas, B. Determining fractal dimension from nuclear magnetic resonance data in rocks with internal magnetic field gradients. Geophysics 2014, 79, D425–D431. [Google Scholar] [CrossRef]
  29. Friesen, W.I.; Mikula, R.J. Fractal dimensions of coal particles. J. Colloid Interface Sci. 1987, 120, 263–271. [Google Scholar] [CrossRef]
  30. Pfeifer, P.; Avnir, D. Chemistry in noninteger dimensions between two and three. I. Fractal theory of heterogeneous surfaces. J. Chem. Phys. 1984, 80, 4573. [Google Scholar] [CrossRef]
  31. Washburn, E.W. The dynamics of capillary flow. Phys. Rev. 1921, 17, 273. [Google Scholar] [CrossRef]
  32. Yao, Y.; Liu, D.; Che, Y.; Tang, D.; Tang, S.; Huang, W. Petrophysical characterization of coals by low-field nuclear magnetic resonance (NMR). Fuel 2010, 89, 1371–1380. [Google Scholar] [CrossRef]
  33. Talabi, O.; Blunt, M.J. Pore-scale network simulation of NMR response in two-phase flow. J. Pet. Sci. Eng. 2010, 72, 1–9. [Google Scholar] [CrossRef]
Figure 1. Test flowchart.
Fractalfract 09 00293 g001
Figure 2. Longitudinal wave velocity of sandstone before and after freeze–thaw cycles.
Fractalfract 09 00293 g002
Figure 3. Relationship between the growth rate of P-wave velocity and the number of freeze–thaw cycles.
Fractalfract 09 00293 g003
Figure 4. T2 spectrum distribution curves of sandstone in a water-saturated state, before and after freeze–thaw cycles.
Fractalfract 09 00293 g004
Figure 5. T2 spectrum distribution curves of sandstone in a centrifugal state, before and after freeze–thaw cycles.
Fractalfract 09 00293 g005
Figure 6. Total porosity of sandstone before and after freeze–thaw cycles.
Fractalfract 09 00293 g006
Figure 7. Effective porosity of sandstone before and after freeze–thaw cycles.
Fractalfract 09 00293 g007
Figure 8. Residual porosity of sandstone before and after freeze–thaw cycles.
Fractalfract 09 00293 g008
Figure 9. Relationship between the growth rate of total porosity and the number of freeze–thaw cycles.
Fractalfract 09 00293 g009
Figure 10. Relationship between the growth rate of effective porosity and the number of freeze–thaw cycles.
Fractalfract 09 00293 g010
Figure 11. Relationship between the growth rate of residual porosity and the number of freeze–thaw cycles.
Fractalfract 09 00293 g011
Figure 12. NMR fractal dimension calculation of sandstone before and after freeze–thaw cycles.
Fractalfract 09 00293 g012aFractalfract 09 00293 g012b
Figure 13. NMR fractal dimensions of total porosity of sandstone before and after freeze–thaw cycles.
Fractalfract 09 00293 g013
Figure 14. NMR fractal dimension of effective porosity of sandstone before and after freeze–thaw cycles.
Fractalfract 09 00293 g014
Figure 15. Relationship between NMR fractal dimension of total porosity and number of freeze–thaw cycles.
Fractalfract 09 00293 g015
Figure 16. Relationship between NMR fractal dimension of effective porosity and number of freeze–thaw cycles.
Fractalfract 09 00293 g016
Figure 17. Relationship between total porosity and longitudinal wave velocity of sandstone.
Fractalfract 09 00293 g017
Figure 18. Relationship between the effective porosity NMR fractal dimension and the total porosity and effective porosity of sandstone.
Fractalfract 09 00293 g018
Figure 19. Diagram illustrating the damage mechanism of sandstone under freeze–thaw cycles based on pore structure evolution characteristics.
Fractalfract 09 00293 g019
Table 1. Initial physical parameters of sandstone.
Sample NamePhysico-Mechanical Index
Natural Density (kg/m3)Natural Moisture Content (%)Dry Density (kg/m3)Drying Wave
Velocity (km/s)
Saturated Water Density (kg/m3)Percentage of Saturated Water Content (%)Saturation Porosity (%)
Sandstone2339.2310.6142324.9402.6062426.6044.1907.521
Table 2. Longitudinal wave velocity of sandstone before and after freeze–thaw cycles.
Number of Freeze–Thaw CyclesLongitudinal Wave Velocity (m/s)
Before Freeze–Thaw CyclesAfter Freeze–Thaw Cycles
102608.0622489.963
2587.5652451.909
2594.0492471.277
202561.3322357.113
2616.9942373.808
2632.0212406.099
302590.0632246.278
2619.5022217.721
2599.4812245.758
402610.0841972.982
2626.8001985.912
2621.1472009.857
Table 3. Porosity of sandstone before and after freeze–thaw cycles at different numbers of freeze–thaw cycles.
Number of Freeze–Thaw CyclesPorosity Type
Total Porosity (%)Residual Porosity (%)Effective Porosity (%)
Before Freeze–Thaw CyclesAfter Freeze–Thaw CyclesBefore Freeze–Thaw CyclesAfter Freeze–Thaw CyclesBefore Freeze–Thaw CyclesAfter Freeze–Thaw Cycles
107.5257.8763.7183.4883.8074.388
7.6038.0423.8643.6173.7394.425
7.5587.9173.7243.4963.8344.421
207.6058.5873.8233.5653.7825.022
7.5138.4123.73.453.8134.962
7.4268.3193.7853.4633.6414.856
307.5669.0983.8663.1393.7005.959
7.4809.2523.9453.2633.5355.989
7.5349.0853.7663.1843.7685.901
407.52510.1033.7452.6243.7807.479
7.4339.8193.8362.6423.5977.177
7.4869.9883.6982.3823.7887.606
Table 4. NMR fractal dimensions of different pore structures of sandstone before and after freeze–thaw cycles.
Number of Freeze–Thaw CyclesNMR Fractal Dimensions of Different Pore Structures of Sandstone
DT-Pre (/)DT-Post (/)DR-Pre (/)DR-Post (/)DE-Pre (/)DE-Post (/)
102.6422.6391.7891.7962.6452.518
2.6512.6481.8111.8172.6492.530
2.6482.6441.8261.8332.6522.526
202.6392.6211.8161.7032.6282.482
2.6572.641.8281.7082.6322.489
2.6502.6341.7951.6922.6362.484
302.6442.6041.8081.7322.642.448
2.6572.6221.7681.7032.6592.471
2.6522.6181.7861.7152.6422.445
402.6482.5561.8321.6582.6352.373
2.6352.5381.8501.6862.6212.370
2.6392.5521.8151.6492.6282.355
Disclaimer/Publisher’s Note: The statements, opinions and data contained in all publications are solely those of the individual author(s) and contributor(s) and not of MDPI and/or the editor(s). MDPI and/or the editor(s) disclaim responsibility for any injury to people or property resulting from any ideas, methods, instructions or products referred to in the content.

