Article

Fractal Dimensions of Particle Size Distribution in Littoral Sandstones of Carboniferous Donghetang Formation in Hade Oilfield, Tarim Basin, NW China

by
Rui Yuan
*,
Qi Sun
,
Manli Zhan
,
Wenlu Liu
,
Ye Sun
,
Siyi Wang
and
Yufei Yuan
School of Geophysics and Petroleum Resources, Yangtze University, Wuhan 430100, China
*
Author to whom correspondence should be addressed.
Fractal Fract. 2025, 9(6), 364; https://doi.org/10.3390/fractalfract9060364
Submission received: 6 May 2025 / Revised: 31 May 2025 / Accepted: 1 June 2025 / Published: 2 June 2025

Abstract

Fractal theory of particle size distribution (PSD) is a widely used approach in soil science. However, fractal studies on sandstone PSDs are scarce in sedimentology and geology. Taking littoral sandstones in the Carboniferous Donghetang Formation of the Hade Oilfield as an example, fractal dimensions of 115 fine sandstone and 150 silty sandstone PSDs are calculated and compared with particle size compositions and traditional statistical parameters in this paper. The results show that fractal dimension values in fine sandstones, 1.69–2.17 averaged at 1.99, are usually lower than that in silty sandstones, 2.12–2.73 averaged at 2.37. Fractal dimension and sandy content of littoral sandstones show a strong negative linear relationship. Significant logarithmic correlations are implied between fractal dimension and silty and clayey contents of littoral sandstones, which is different from linear relations in soil PSDs. The relationships between fractal dimension and mean, sorting, and skewness of silty sandstone PSDs are better than those of fine sandstones. Fractal dimension and kurtosis of silty sandstones and fine sandstones exhibit weak negative and positive linear relationships, respectively. Fractal dimension values in lower-shoreface facies, 2.05–2.47 averaged at 2.33, are generally higher than that in upper-shoreface facies, 1.79–2.30 averaged at 2.11. Fractal dimension values in bar and beach microfacies are commonly lower than those in trough microfacies. Combined with additional sedimentary information from various clastic deposits, the fractal dimension can serve as a new depositional environment indicator.

1. Introduction

About 70% of terrene is covered in clastic deposits [1]. Sediments are used to understand the evolutions and environmental changes of the Earth. Particle size is the most fundamental property of sediment grains, implying their transport and deposition [2,3]. Defined as the frequency of occurrence of different diameter grains, particle size distribution (PSD) provides important clues about the sediment provenance, transport history, and depositional condition quantificationally [4,5]. To describe PSD in sedimentology and geology, several traditional statistical parameters are widely used, including: mean, denoting integral particle size; sorting, standard deviation of PSD, representing dispersion of different particle sizes; skewness, indicating asymmetry of PSD frequency curves; and kurtosis, displaying the relative concentration with the mean [6,7]. Numerous works have used these traditional statistical parameters to analyze ancient and modern clastic depositional environments [8,9].
The PSD of sediment shows a statistically self-similar hierarchical structure, which means that it has fractal characteristics [10,11]. Armstrong [12] proposed the concept of fractal dimension within some transient soil properties. Then, Tyler and Wheatcraft [13] developed the fractal theory of soil PSDs and illustrated its limitations. The concept of fractal dimension was raised to interpret soil PSDs and soil physical processes. The fractal dimension reflects the space-filling efficiency of particles: fine particles have a high capacity to fill space, and the corresponding fractal dimension values are higher than those of the coarse particles [13,14]. Many studies about soil science have reported on the applications of fractal dimension in agriculture, phytology, environment, hydraulic engineering, and so on [15,16]. For example, Tahmoures et al. [17] applied the fractal feature of PSDs as an indicator of land degradation under different types of land use. Mahdi and Ghaleno [18] evaluated the correlation between the fractal dimension of PSDs and soil water retention. Wei et al. [19] analyzed the fractal features of soil PSDs in layered sediments behind two check dams. Liu et al. [20] explored the fractal characteristics of deep profile soil under different vegetation types and the relationship with soil physicochemical properties and hydraulic parameters. Fractal dimensions have even been used to describe soil properties in the region and basin [21,22]. Despite these considerable scientific efforts in soil structures, the fractal dimension of sandstone PSDs has not yet been reported publicly.
Taking the littoral sandstones of the Carboniferous Donghetang Formation in the Hade Oilfield, Tarim Basin, as an example, the objectives and novelties of the current study are: (i) calculating and counting the volumetric fractal dimensions of different sandstone PSDs; (ii) comparing fractal dimensions with particle size compositions and traditional statistical parameters of different sandstone PSDs quantitatively; and (iii) discussing relationships between fractal dimension and littoral facies. The remaining sections are organized as follows. Section 2 describes the materials and methodologies, including the study area, sampling laboratory analysis, statistical parameter calculation, and fractal theory. Section 3 provides the numerical results, including particle size compositions, traditional statistical parameters, and fractal dimensions. Section 4 discusses the relationships between fractal dimensions and other information, including sandy content, silty content, clayey content, mean, sorting, skewness, kurtosis, and sedimentary facies of littoral sandstones. Section 5 presents the conclusions of this study.

2. Materials and Methods
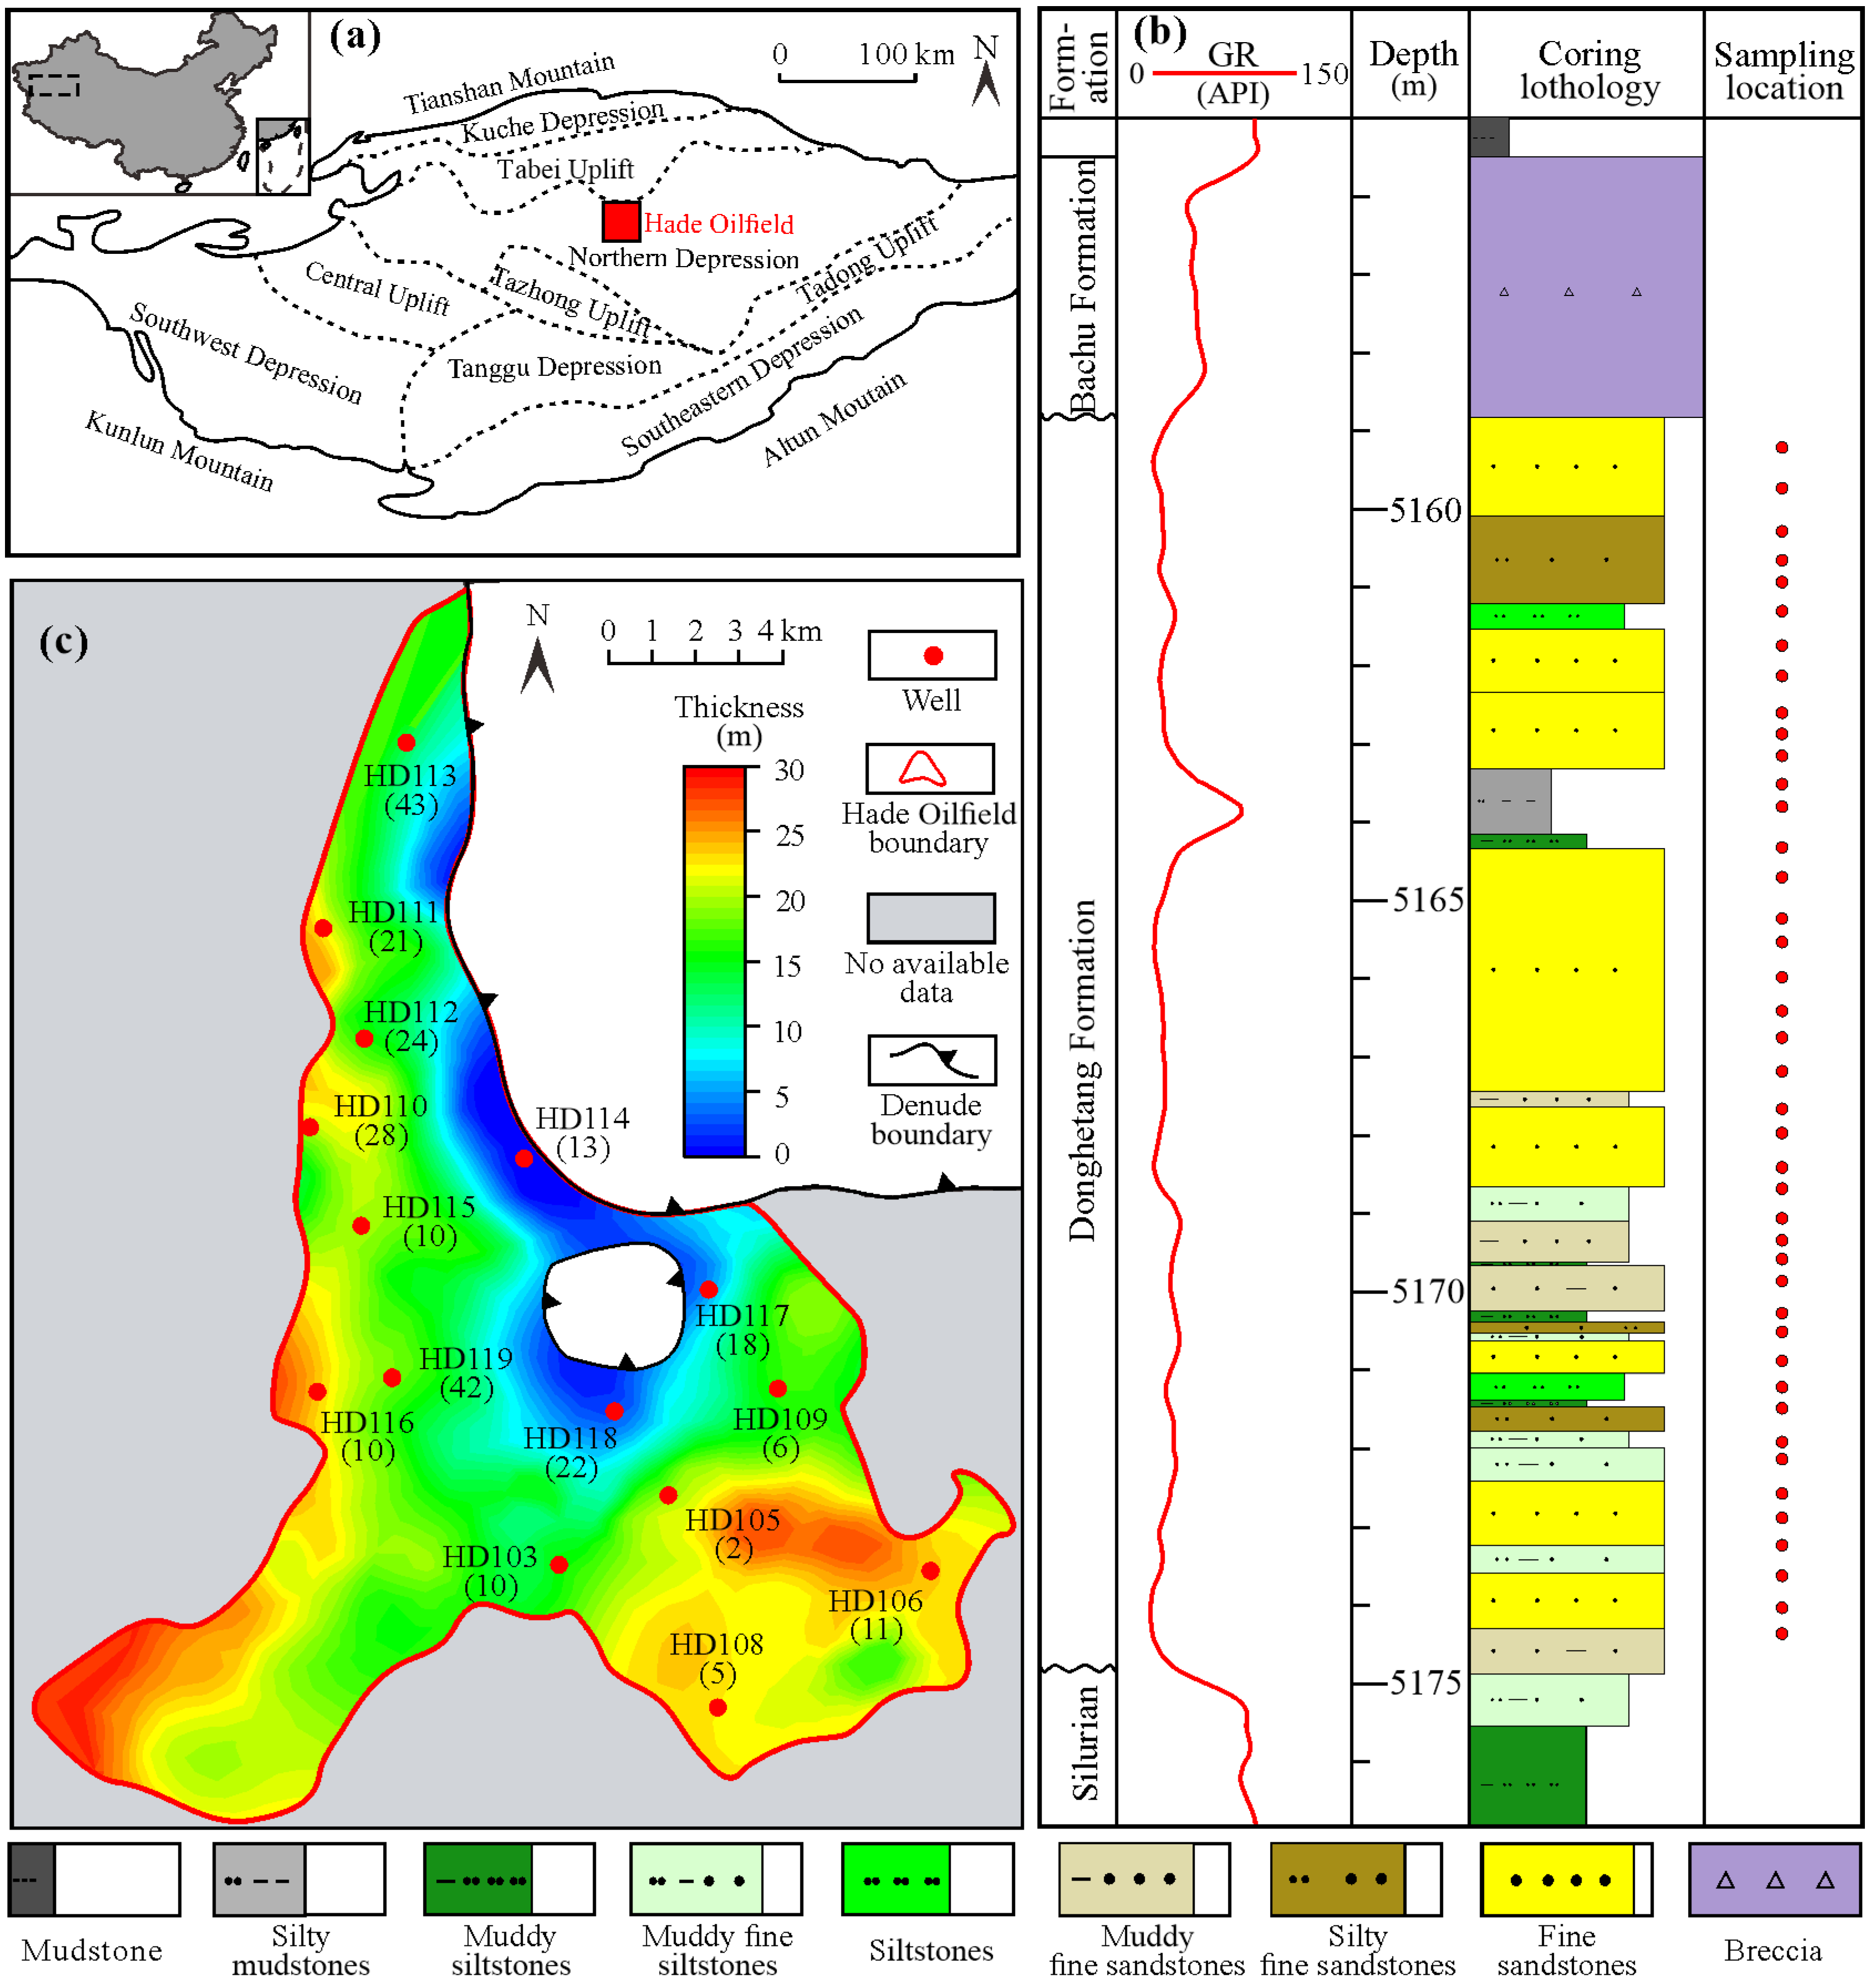
2.1. Study Area

The Tarim Basin is one of the most significant petroleum basins in northwestern China [23] (Figure 1a). The present study was conducted in the Early Carboniferous Donghetang Formation of the Hade Oilfield in this basin. The bottom contact of the Donghetang Formation is uncomformable with the underlying Silurian mudstones. The top contact is uncomformable with overlying breccias in the Carboniferous Bachu Formation [24]. From 0 to 30 m thickness in the Hade Oilfield, Donghetang Formation, is a high-quality sandstone petroleum reservoir [25,26]. The clastic particles are reddish-brown or gray quartz fine sands and slightly gray-green or reddish-brown muds and silts. In the littoral facies, sandy particles usually exhibit high compositional and textural maturity, and muds and silts are generally mixed with sands (Figure 1b).

2.2. Sampling and Analysis

Conventional natural gamma ray logging values (GR, API) in boreholes reflect the lithology indirectly: low values in sandstones and high readings in siltstones and mudstones (Figure 1b). Dozens of wells were cored in the Donghetang Formation while drilling. All cores were described so as to record color and lithology visually. This study totally collected 265 samples in the cores of 15 wells (Figure 1c). The weight of each sample was 15 g. The PSD experimental analysis was conducted using the oil and gas industry standard of China (SY/T 5434—2009) [27]. All if the samples were deoiled and pulverized. Samples were heated and stirred in hydrogen peroxide H2O2 (in 6% purity) to remove organic matters. Calcareous cements were eliminated by hydrochloric acid HCl (in 10% purity) in heating and stilling. Sediment particles were separated using Calgon (NaPO3)6 (in 1% purity). Then, individual samples were placed in fully automatic sizing tools to be sieved and weighed from 10 μm to 2000 μm. If particle diameters were less than 10 μm, their size scale was assigned as 1 μm. Finally, PSD was exported in the weight percentage of different diameter particles (Figure 2).

2.3. Statistical Parameter Calculation

Statistical formulas used in the calculation of PSD parameters, including mean Me (μm), sorting So, skewness Sk, and kurtosis Ku, are given by [6]:
M e = e x p l n P 16 + l n P 50 + l n P 84 3
S o = e x p l n P 16 l n P 84 4 + l n P 5 l n P 95 6.6
S k = l n P 16 + l n P 84 2 l n P 50 2 l n P 84 l n P 16 + l n P 5 + l n P 95 2 l n P 50 2 l n P 95 l n P 5
K u = l n P 95 2 l n P 5 2.44 l n P 75 l n P 25
where Px (μm) is particle diameters at the cumulative percentile value of x. All PSDs were calculated by the equations to acquire traditional statistical parameters.

2.4. Fractal Dimension Theory

The volumetric fractal dimension D was established based on the PSDs, as shown in the following equation [28,29]:
V i V T = R i R m a x 3 D
where Ri (μm) is the arithmetic mean of the upper and lower limit of the ith particle size level; Rmax (μm) is the maximum particle size; Vi (μm3) is the cumulative volume of particles smaller than Ri; VT (μm3) is the total volume of sediment particles; Vi/VT (%) is the cumulative volume percentage of particles smaller than Ri.
To calculate D from the PSD data, the following natural logarithmic expression was derived [30,31]:
ln V i V T = 3 D ln R i R m a x
where the volumetric fractal dimension D is equal to 3 minus the slope of the logarithmic linear regression equation by fitting different Ri and Vi [32,33].

2.5. Statistical Analysis

Traditional statistical parameters were calculated by GRADISTAT (version 8), a package for the analysis of the grain size statistics from any of the standard measuring techniques [34]. Using this program, particle size compositions, namely sand (63–2000 μm), silt (2–63 μm), and clay (<2 μm), were counted in a sand–silt–clay triangular diagram. EXCEL (version 2016, Microsoft (China) Co., Ltd., Beijing, China) was used for the fractal analysis and data fitting. Origin (version 2025, OriginLab Corporation, Northampton, MA, USA) was used for the statistical analysis in the boxplot and Pearson’s correlation. Coefficient of determination R2 ∈ [0, 1] is used to evaluate the quality of fitting and correlation.

3. Results

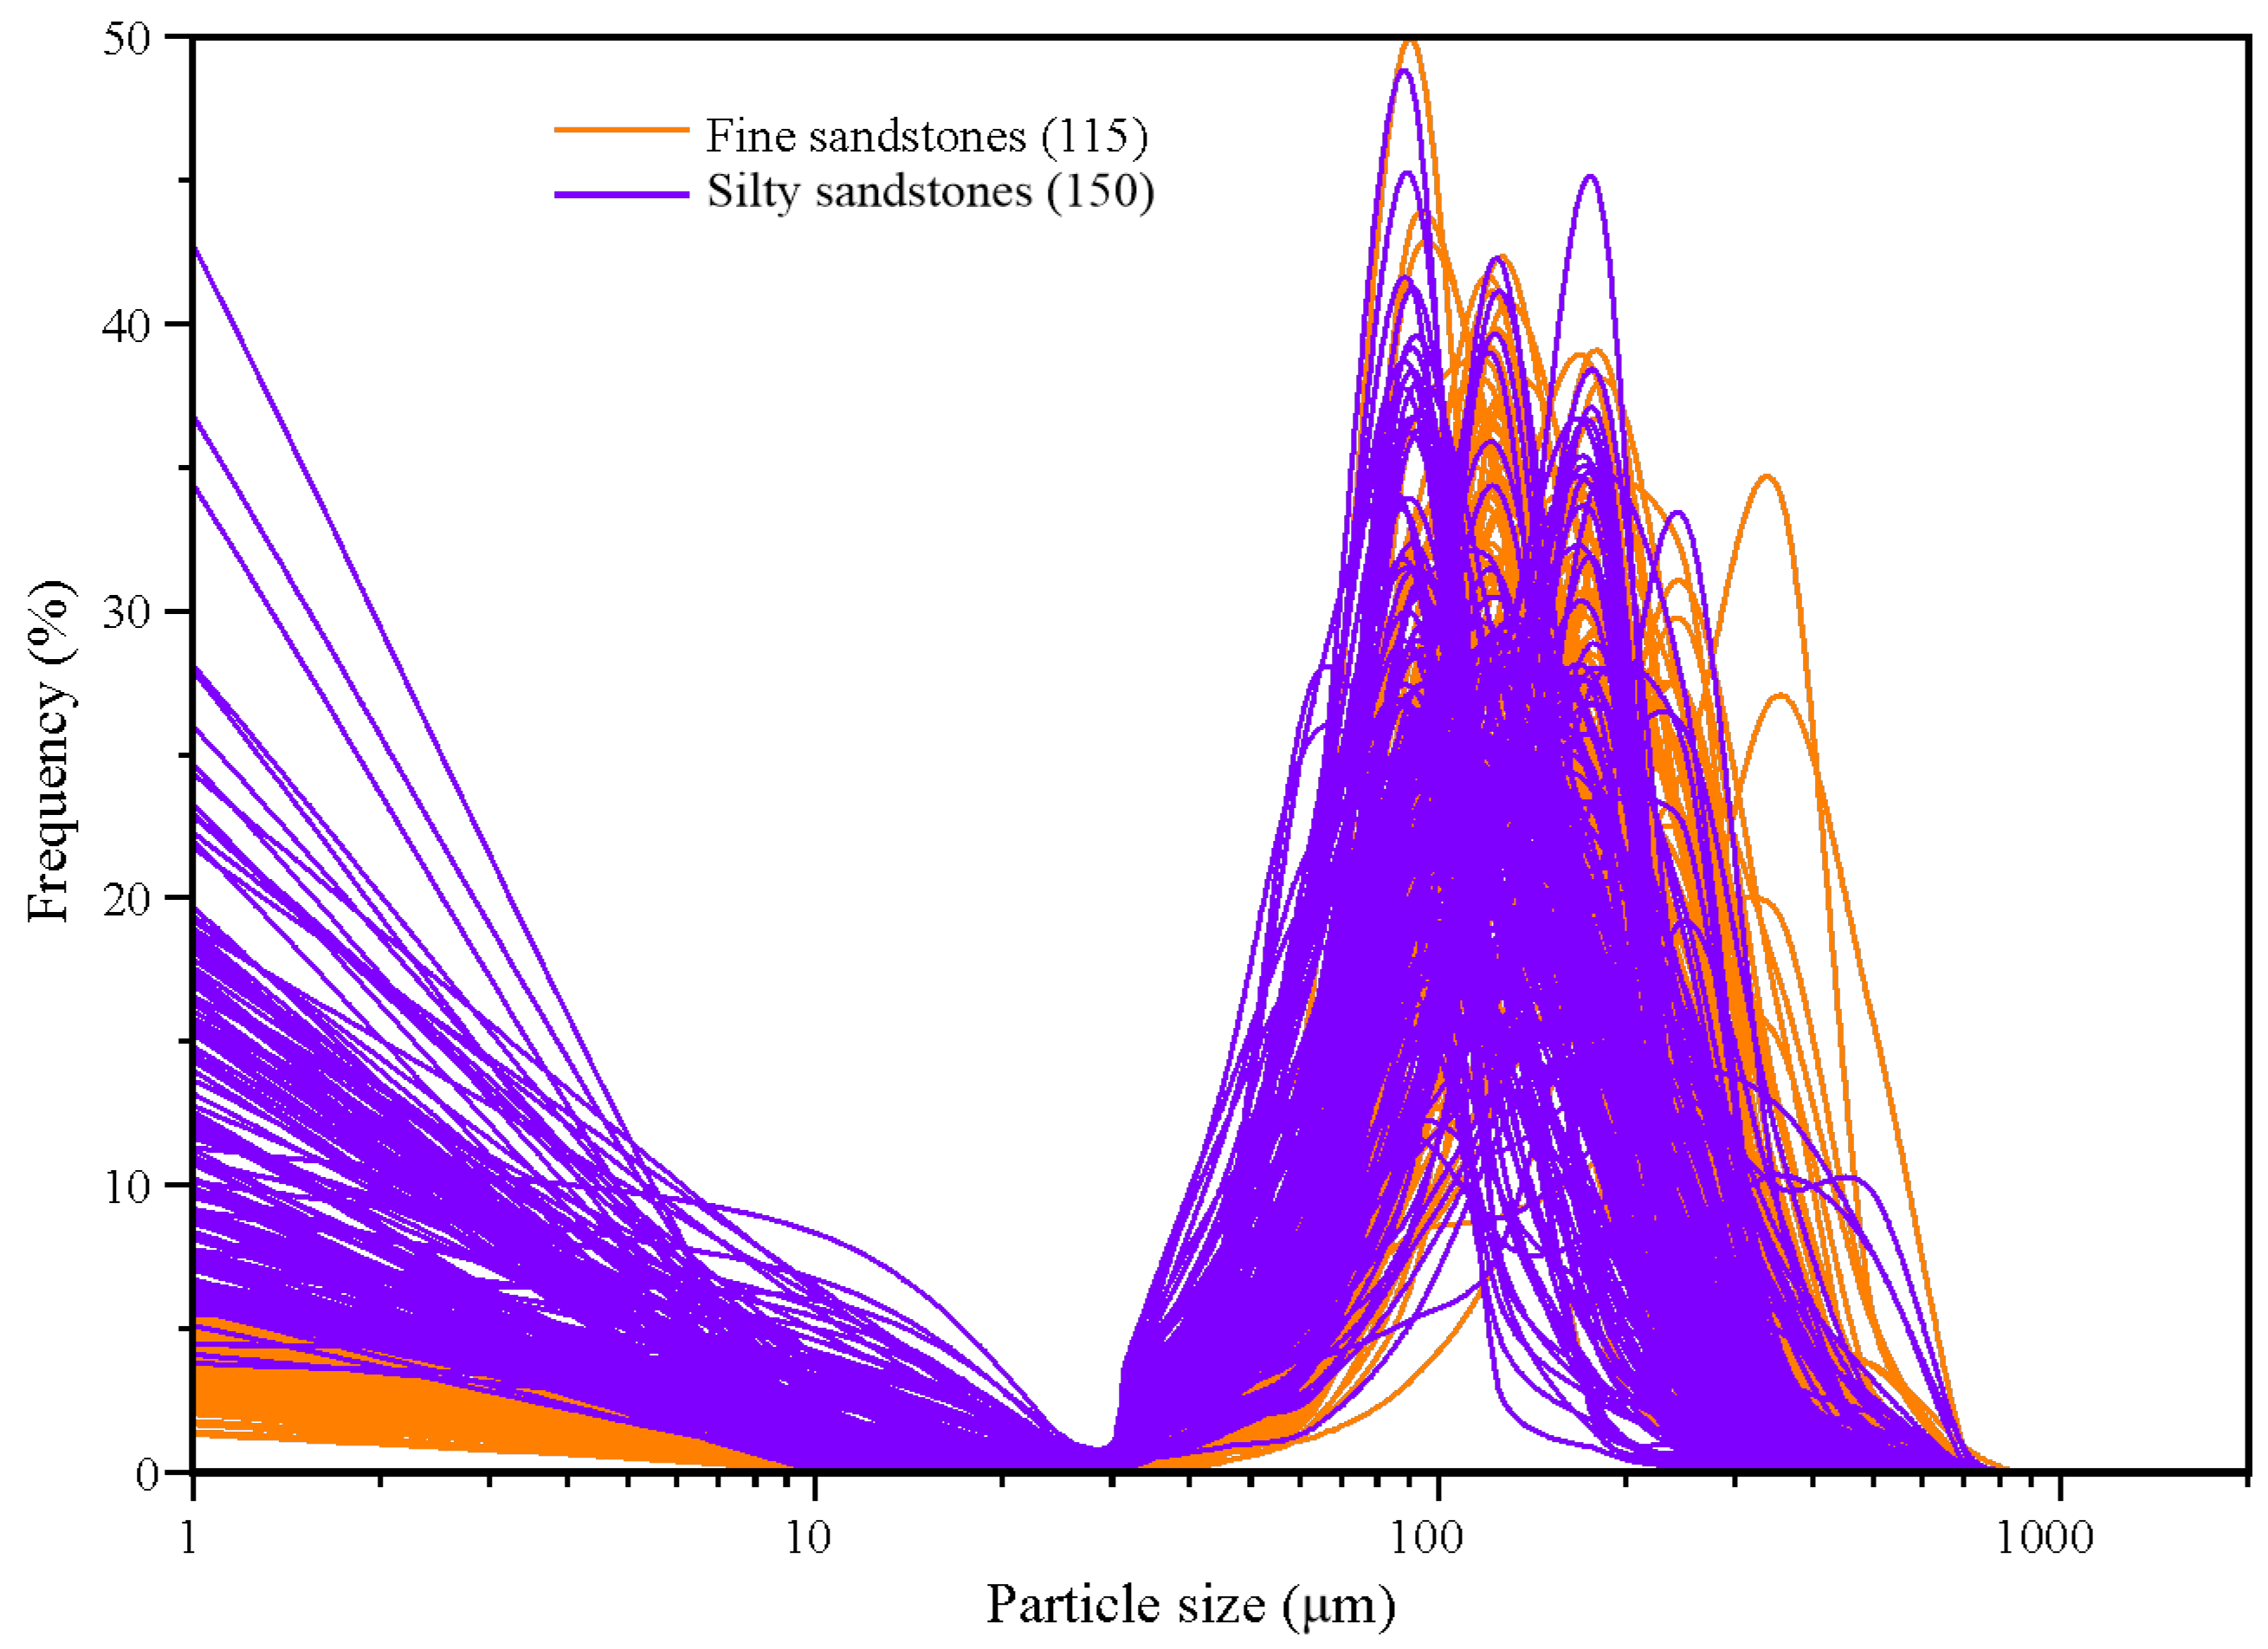
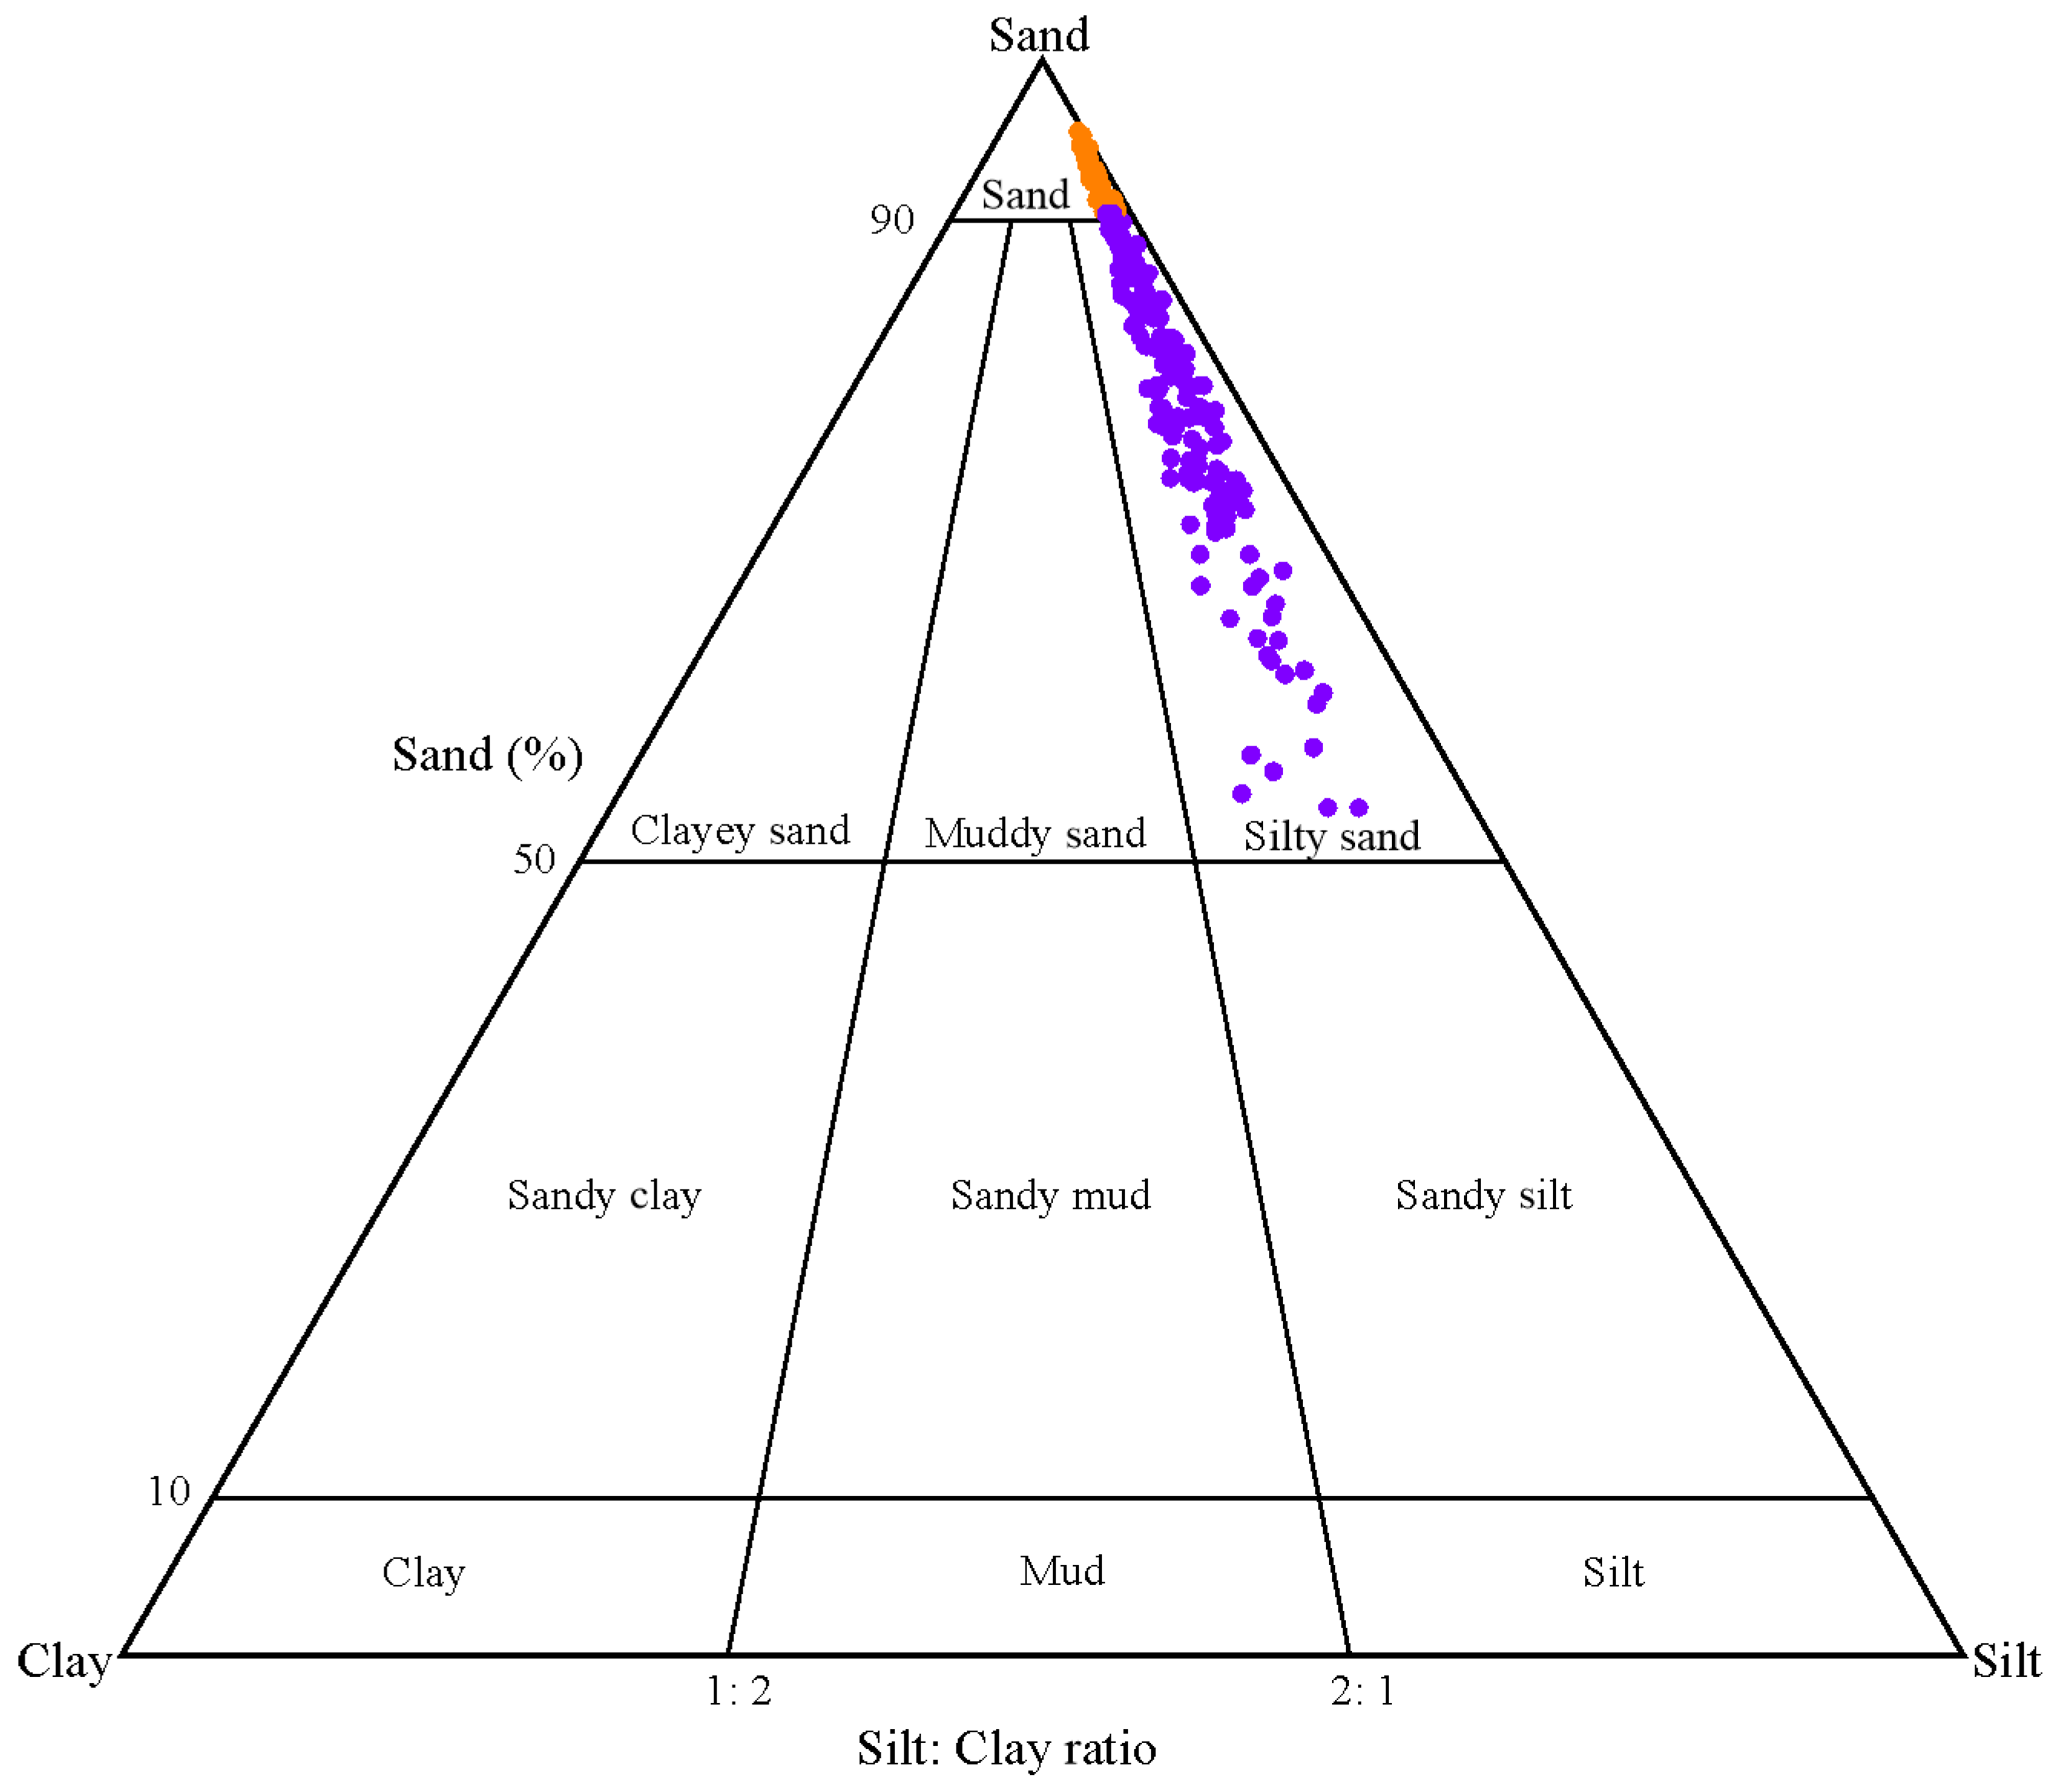
3.1. Particle Size Compositions

According to the rock naming scheme from a sand–silt–clay triangular diagram of Folk [35] for PSD, these littoral sandstones can be divided into fine sandstone and silty sandstone. In this scheme, there are 115 samples from fine sandstones and 150 samples from silty sandstones. Fine sandstones contain 90.04–97.49% fine sand particles, 2.02–8.84% silty contents, and 0.38–1.94% clayey contents. Silty sandstones contain 54.74–89.82% sandy contents, 8.43–38.78% silty contents, and 1.10–12.44% clayey contents (Figure 3). PSDs of fine sandstones are mainly unimodal distributions and PSDs of silty sandstones are unimodal with fine tails (Figure 2).

3.2. Traditional Statistical Parameters

The traditional statistical parameters, namely mean, sorting, skewness, and kurtosis, of both lithologies are presented in Figure 4. The mean values of fine sandstones are 102.49–284.72 μm, averaged at 163.33 μm; those of silty sandstones are 28.03–181.99 μm, averaged at 98.67 μm (Figure 4a). The mean values of fine sandstones are commonly higher than those of silty sandstones. Sorting values of fine sandstones are 1.45–2.72, averaged at 1.86; those of silty sandstones are 1.84–7.54, averaged at 3.41 (Figure 4b). It indicates that the fine sandstones are mainly moderately well sorted and moderately sorted, while silty sandstones are poorly and very poorly sorted [34]. Skewness values of fine sandstones are −0.46–0.13, averaged at −0.20; those of silty sandstones are −0.79–−0.17, averaged at −0.50 (Figure 4c). This suggests frequency curves of fine sandstones are fine skewed and symmetrical, while that of silty sandstones are very fine skewed [34]. Kurtosis values of fine sandstones are 0.89–2.82, averaged at 1.53; those of silty sandstones are 0.56–3.38, averaged at 2.12 (Figure 4d). This implies that the frequency curve peaks of both lithologies are leptokurtic and very leptokurtic [34].

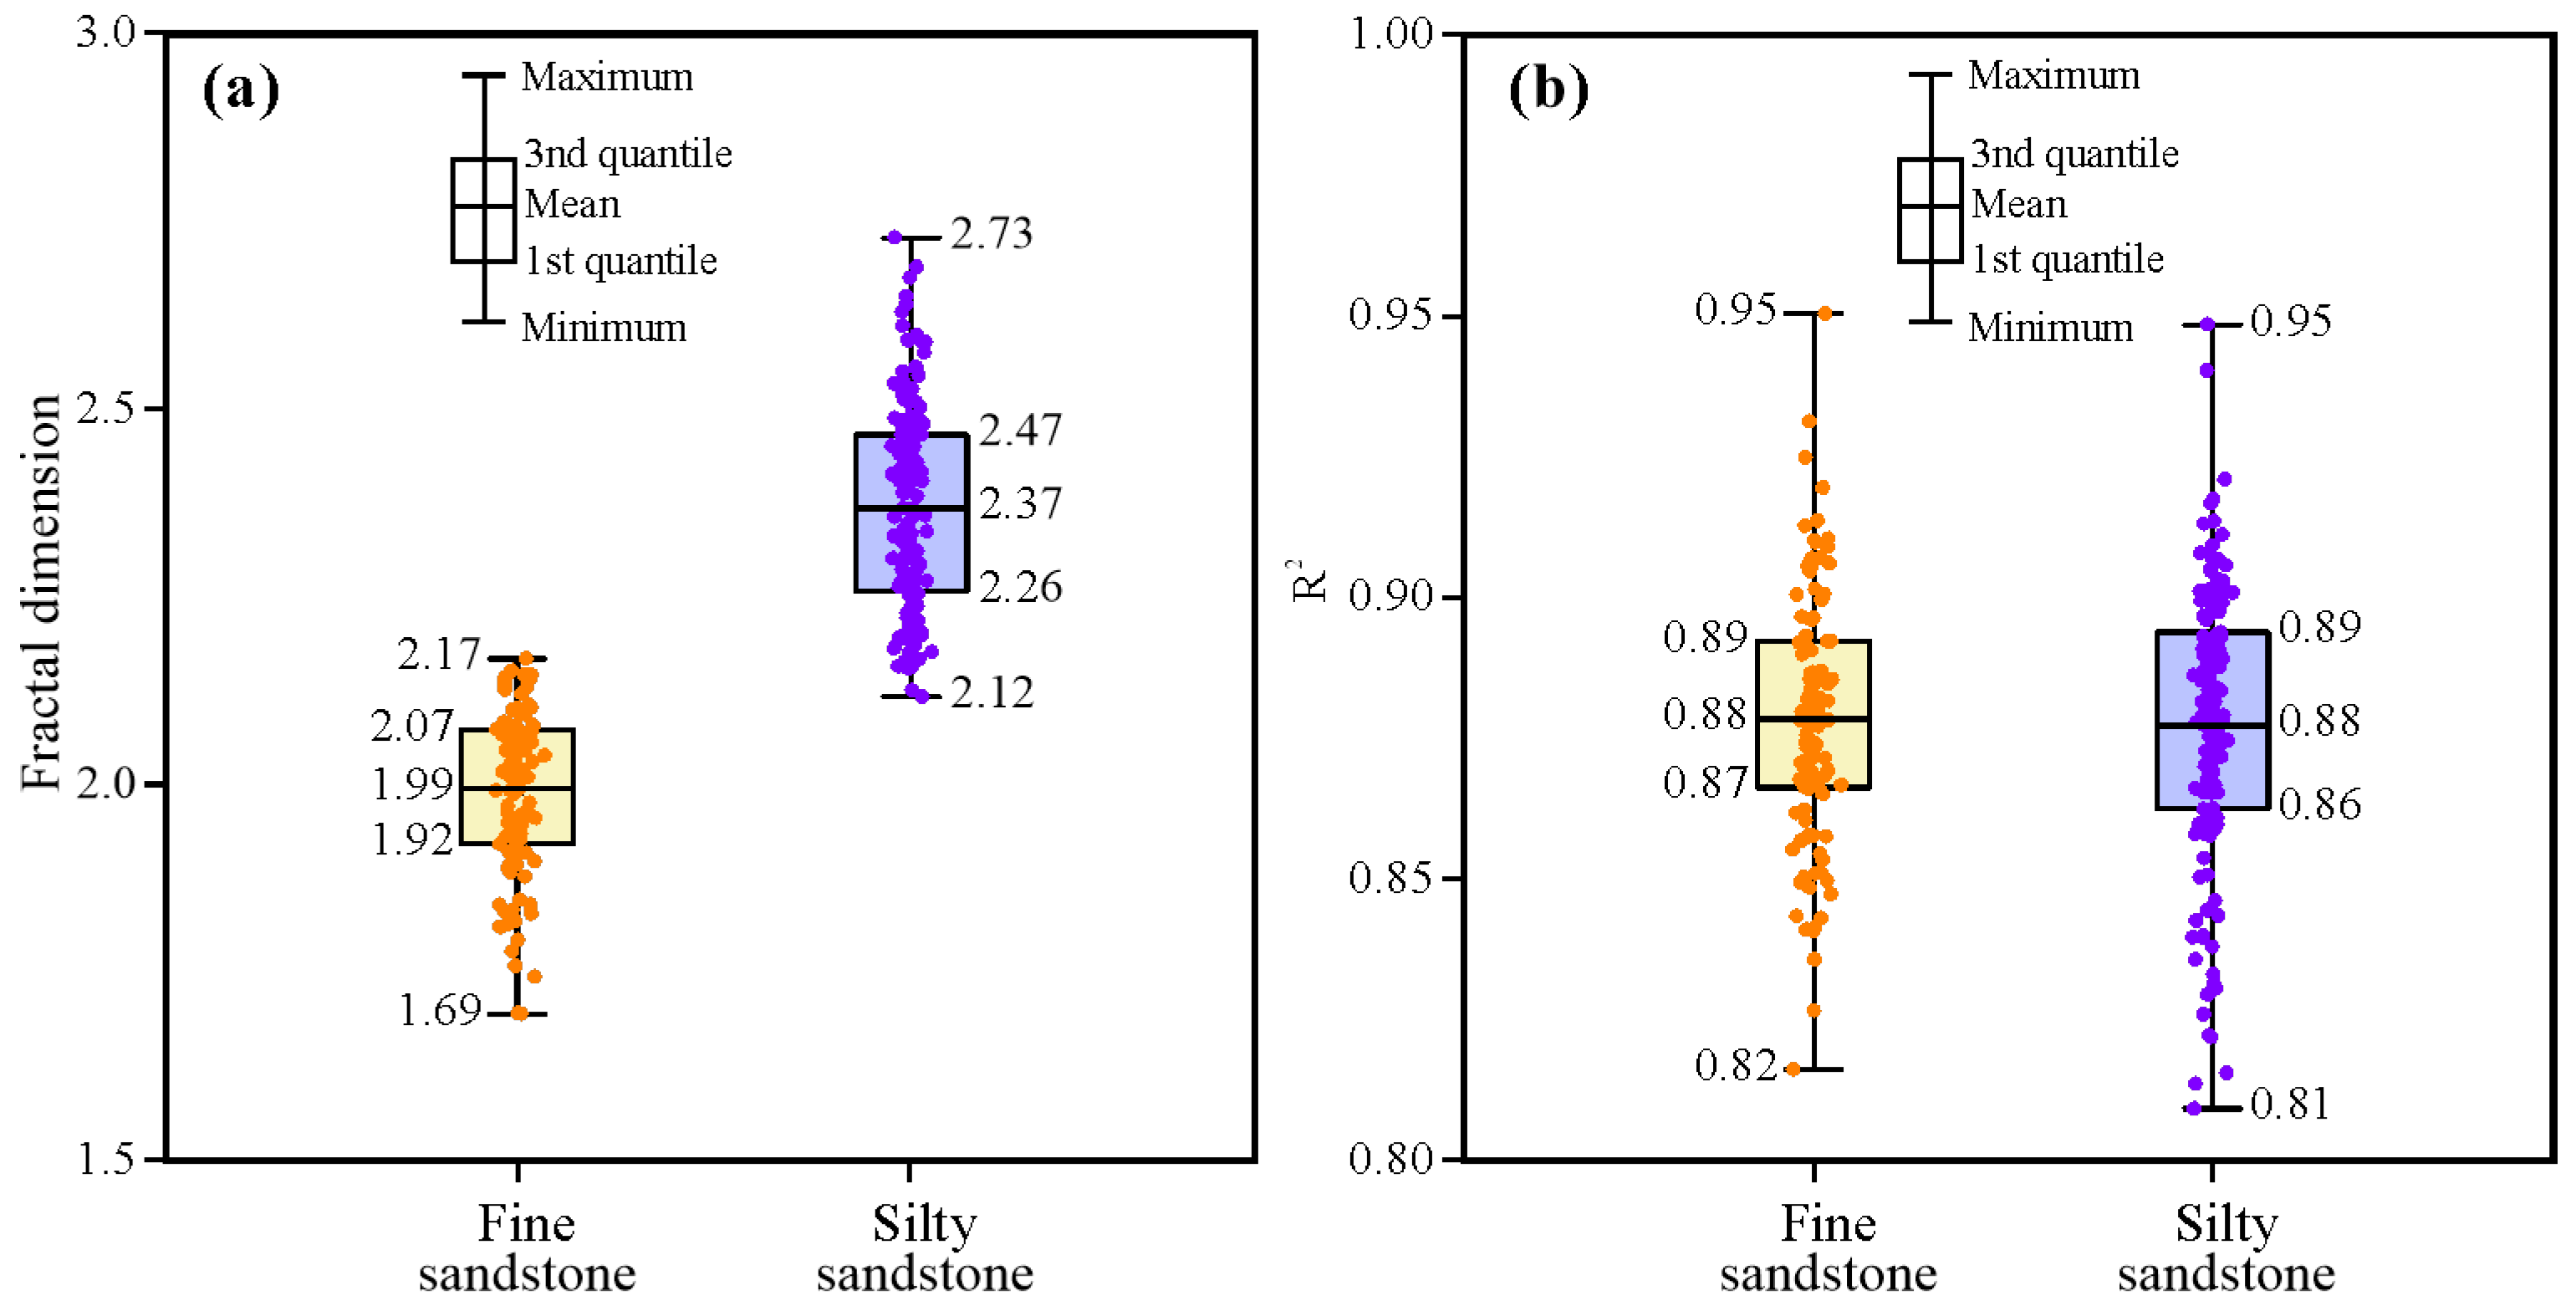
3.3. Fractal Dimensions

By line fitting in the scatter diagram of double logarithmic scale, the fractal dimension of PSD can be acquired individually. For example, typical frequency curves of fine sandstone and silty sandstone PSDs are shown in Figure 5a. The corresponding fractal dimension fitting results are exhibited in Figure 5b. The scatters in the vertical axis ln(Vi/VT) and horizontal axis ln(Ri/Rmax) are sigmoidal and increase monotonically. The linear fitting coefficient of determination R2 of fine sandstone and silty sandstone PSD is 0.95 and 0.81, respectively (Figure 5b). All fractal dimensions and R2 values of fine sandstones and silty sandstones are presented in Figure 6. Fractal dimension values of fine sandstones are 1.69–2.17, averaged at 1.99; those of silty sandstones are 2.12–2.73, averaged at 2.37. The fractal dimensions of fine sandstones are generally less than those of silty sandstones (Figure 6a). This suggests that the silty sandstones have a higher space-filling capacity than fine sandstones. The fitting R2 values of fine sandstones are 0.82–0.95, averaged at 0.88; that of silty sandstones are 0.81–0.95, averaged at 0.88. The R2 ranges of both sandstones are similar (Figure 6b).

4. Discussion

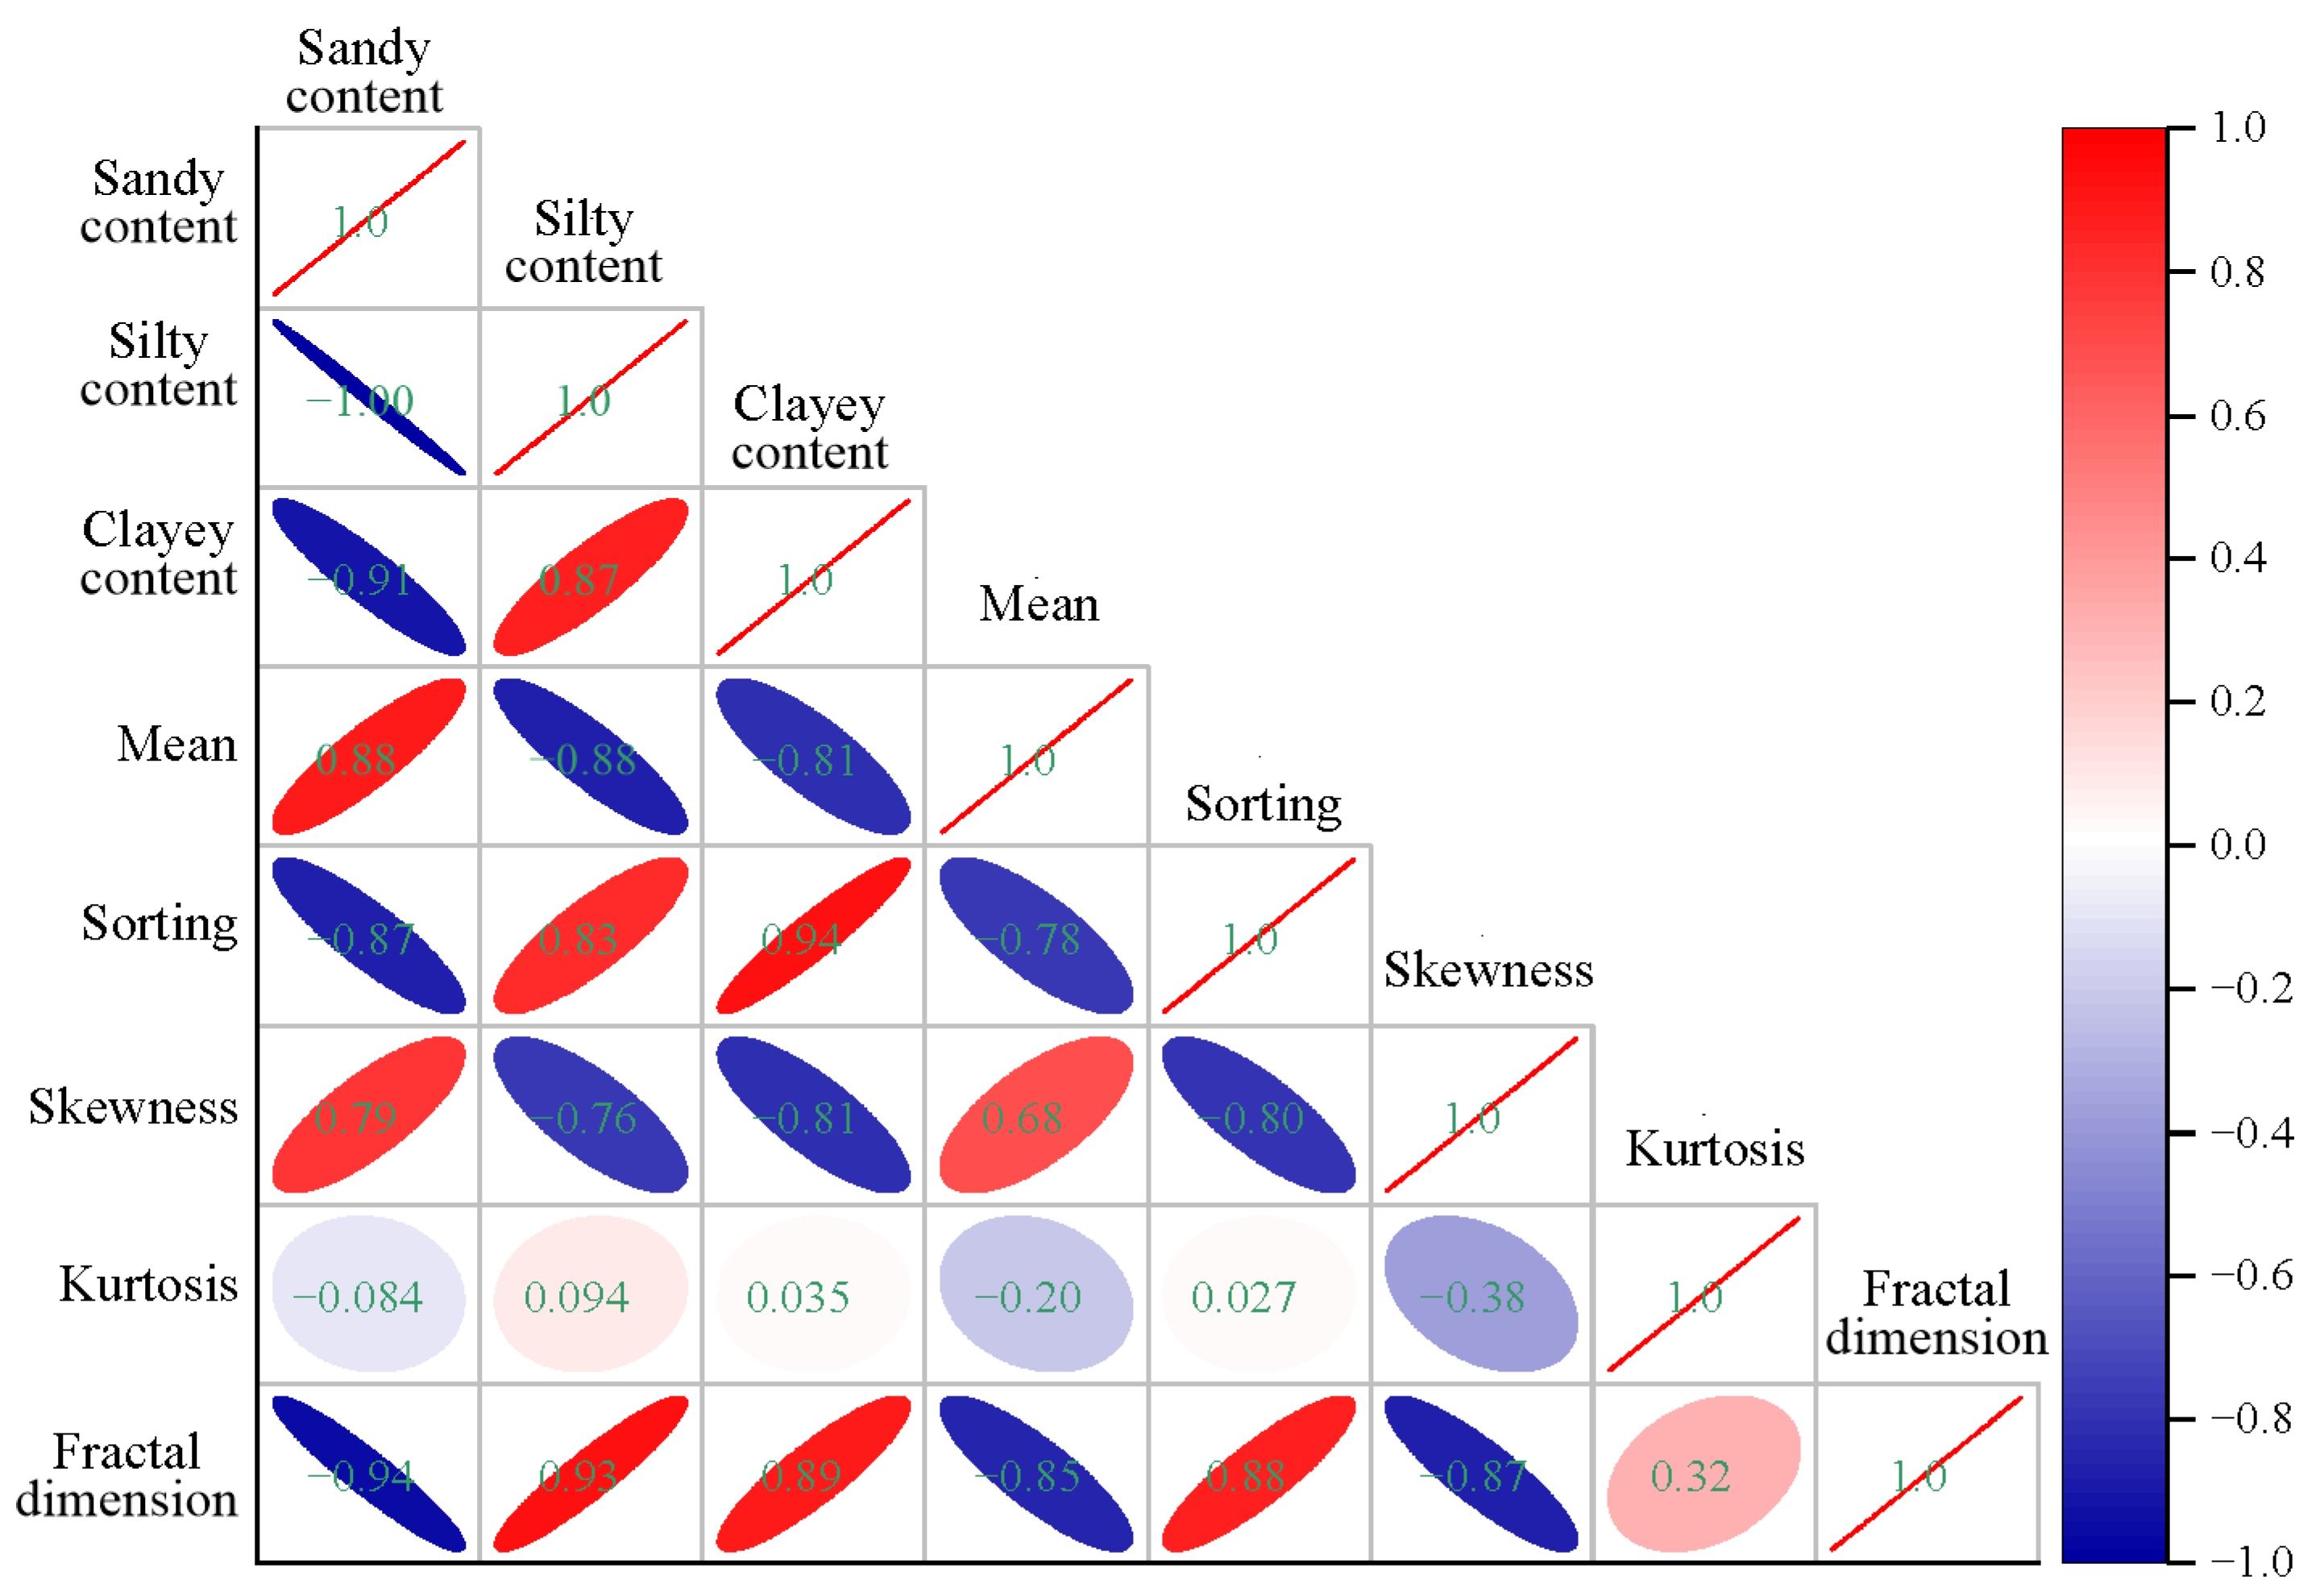
4.1. Pearson’s Correlation of All Parameters

Pearson’s correlation coefficients are calculated to analyze the correlations between the particle size compositions, traditional statistical parameters, and fractal dimension in Figure 7. The positive number, right-leaning ellipse, and red color suggest a positive correlation. The negative number, left-leaning ellipse, and blue color represent a negative correlation. A high ellipse ellipticity and dark color mean a good relationship. A low ellipse ellipticity and light color indicate a bad correlation.
Among all of the parameters of the 256 PSDs, sandy content is negatively correlated with silty and clayey content, while silty content is positively correlated with clayey content. The mean and skewness are positively correlated with sandy content and negatively correlated with silty and clayey content. The sorting has negative correlations with mean and skewness. Kurtosis has weak or no correlation with the other parameters. The fractal dimension is positively correlated with silty content, clayey content, and sorting, and negatively correlated with sandy content, mean, and skewness. The relationships between fractal dimension and other parameters are further analyzed in different lithologies.

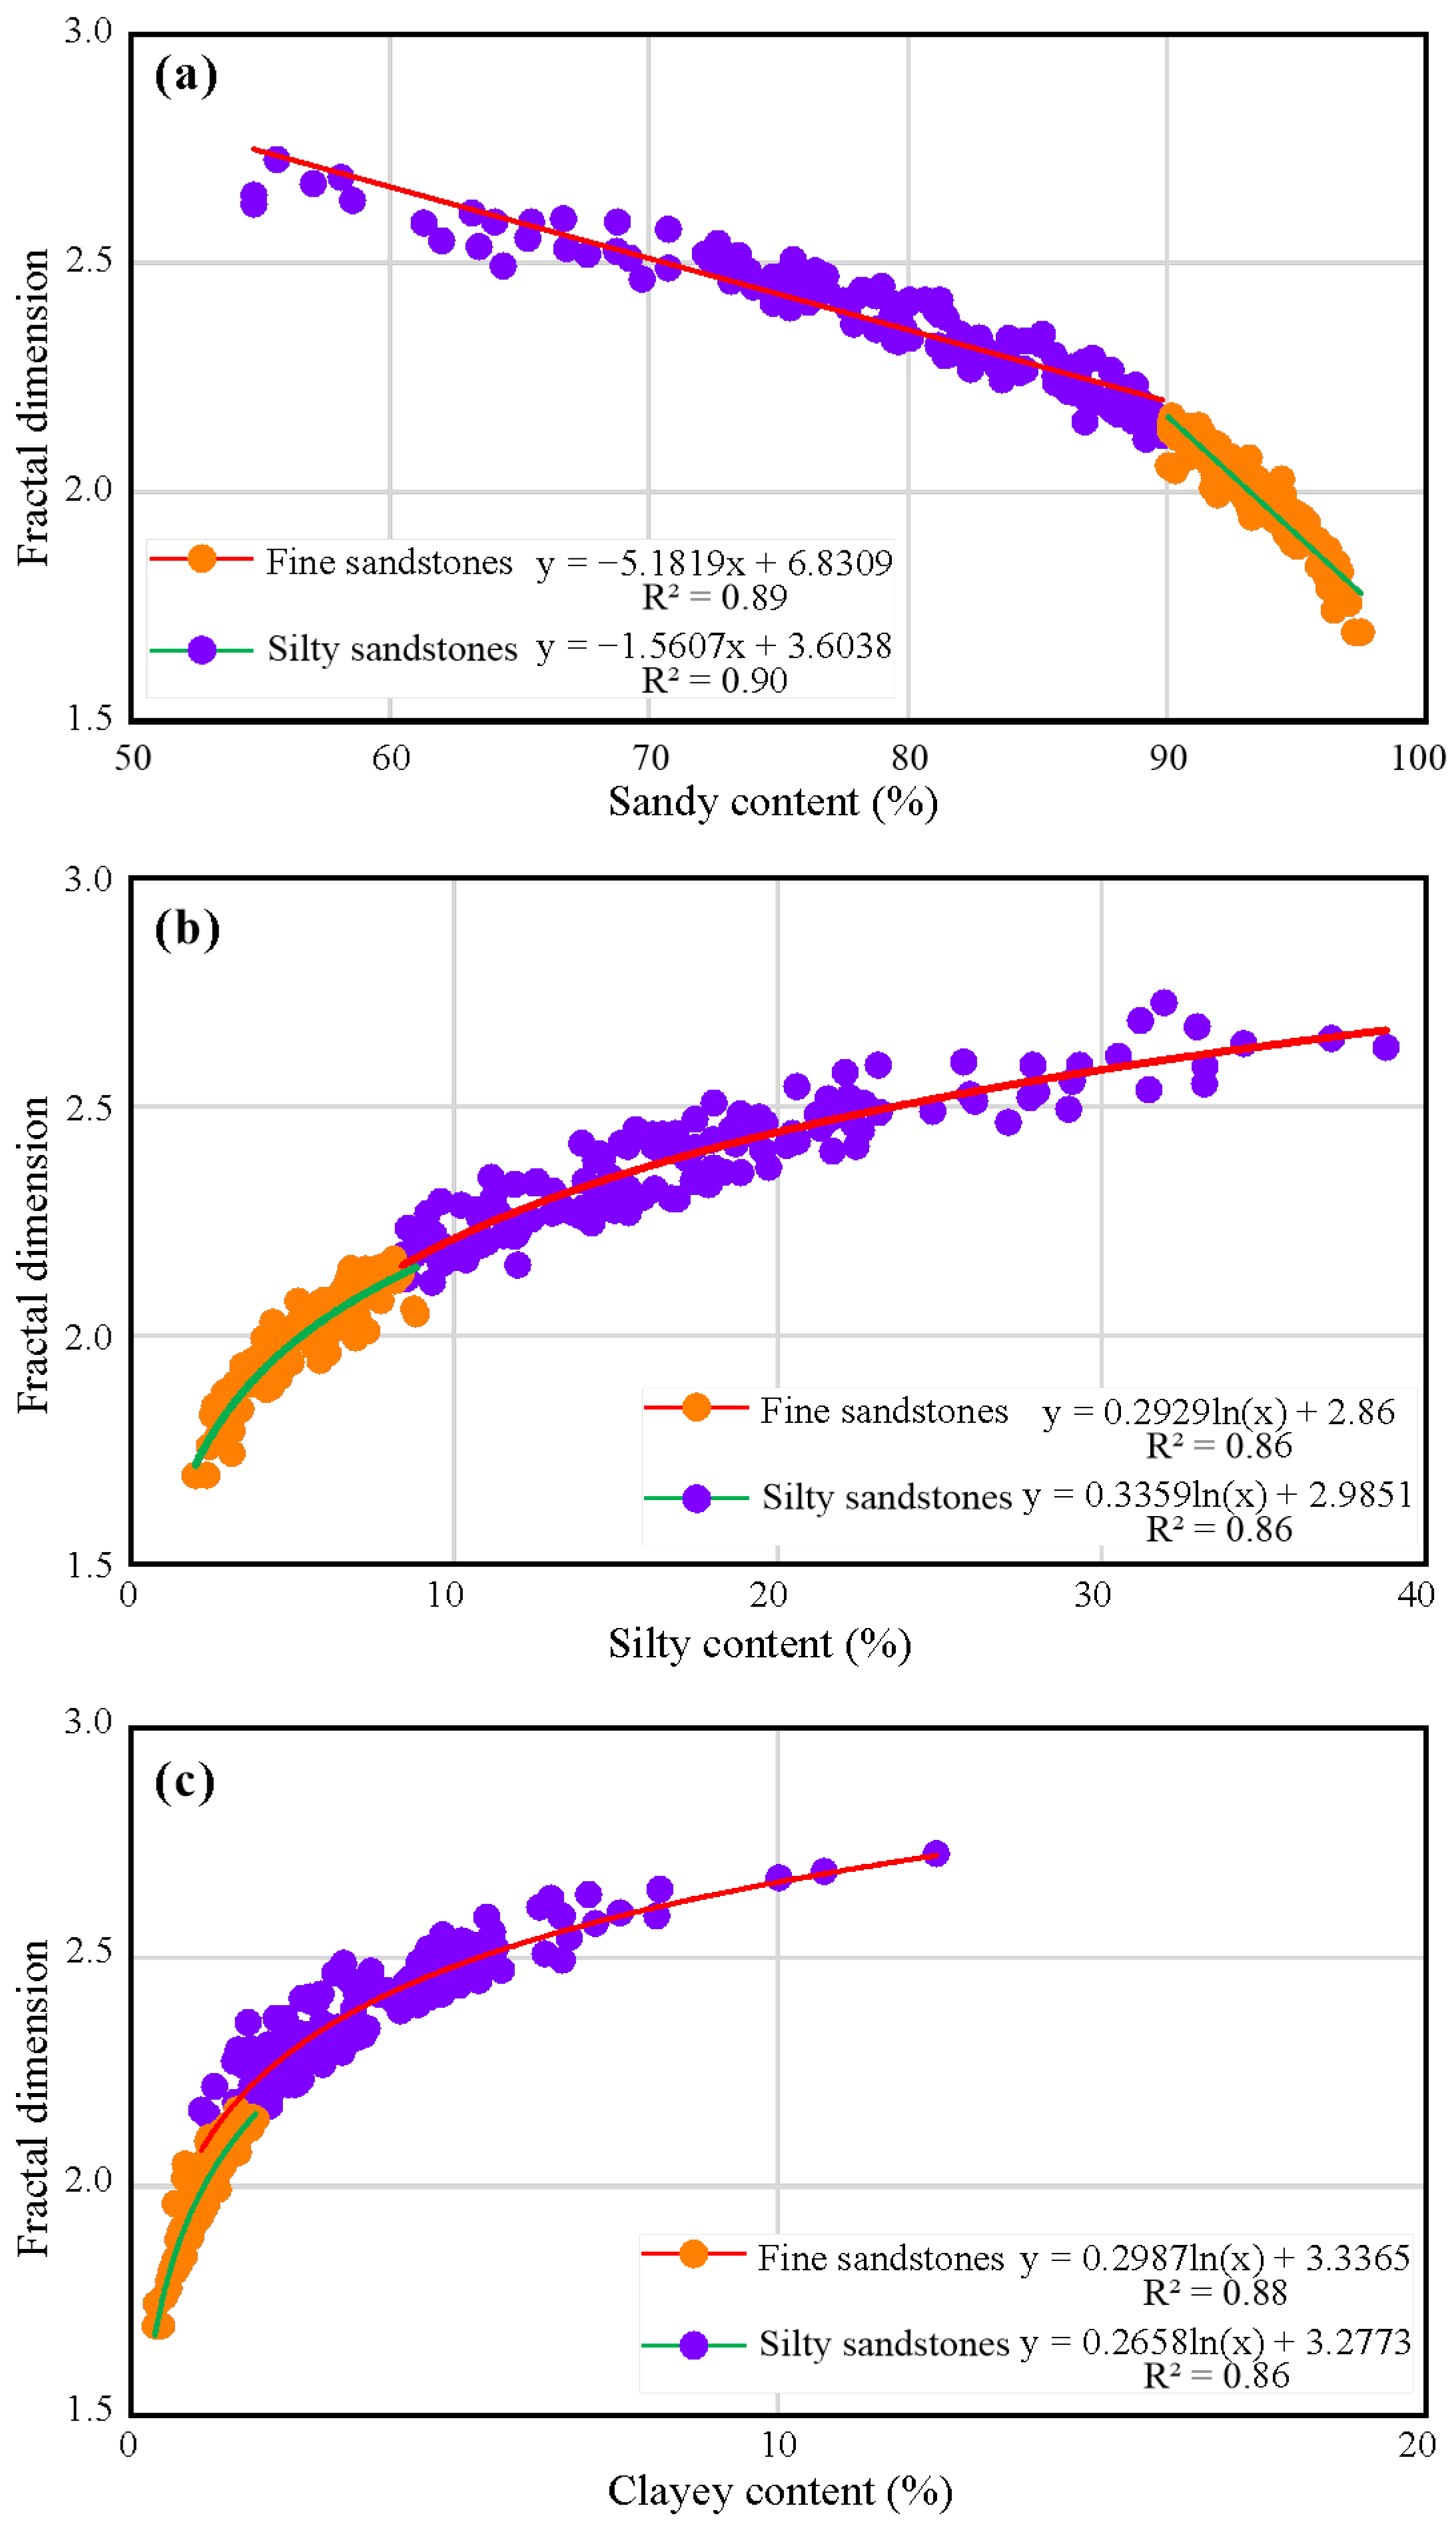
4.2. Relationships Between Fractal Dimension and Particle Size Compositions

Many studies have investigated the relationships between the fractal dimension of soil PSD and soil particle compositions [30,36]. It has been reported that fractal dimension has significant positive linear relationships with the clay and silt contents, and a significant negative linear relationship with the sand content [36]. Different from soil PSD, the relationships between fractal dimension and particle size compositions in littoral sandstones of the Donghetang Formation are illustrated in Figure 8. Fractal dimension and sandy content of fine sandstones and silty sandstones show strong negative linear relations. The absolute slope of linear regression equation in fine sandstones is larger than that in silty sandstones. It implies that the sandy contents have greater negative influences on the fractal dimension of fine sandstones (Figure 8a). Both regression equations have similar R2 with ~0.89. However, the R2 values of littoral sandstones are higher than those of soils [30,36].
Relationships between fractal dimension and silty and clayey contents of fine sandstones and silty sandstones are significantly logarithmic, not linear in soils (Figure 8b,c). Their regression R2 values are larger than 0.86. In logarithmic regression equations of silty sandstones, if the silty or clayey content is 100%, the corresponding fractal dimension is about 4.5. In soil PSDs, if the silty and clayey contents are 100%, the extreme fractal dimension was inferred at 4.77 [30]. Therefore, the upper limits of fractal dimension in sand and soil PSDs are close to each other. Defined by the slope of the line relation between fractal dimension and silty and clayey contents in soil PSDs, the variation rate of fractal dimension is constant with the changes of silty and clayey contents [29,30]. In the logarithmic relation in sandstone PSDs, however, the variation rate of fractal dimension reduces gradually with the increase in silty and clayey contents. In fact, the logarithmic relationship in this paper may be more rational.

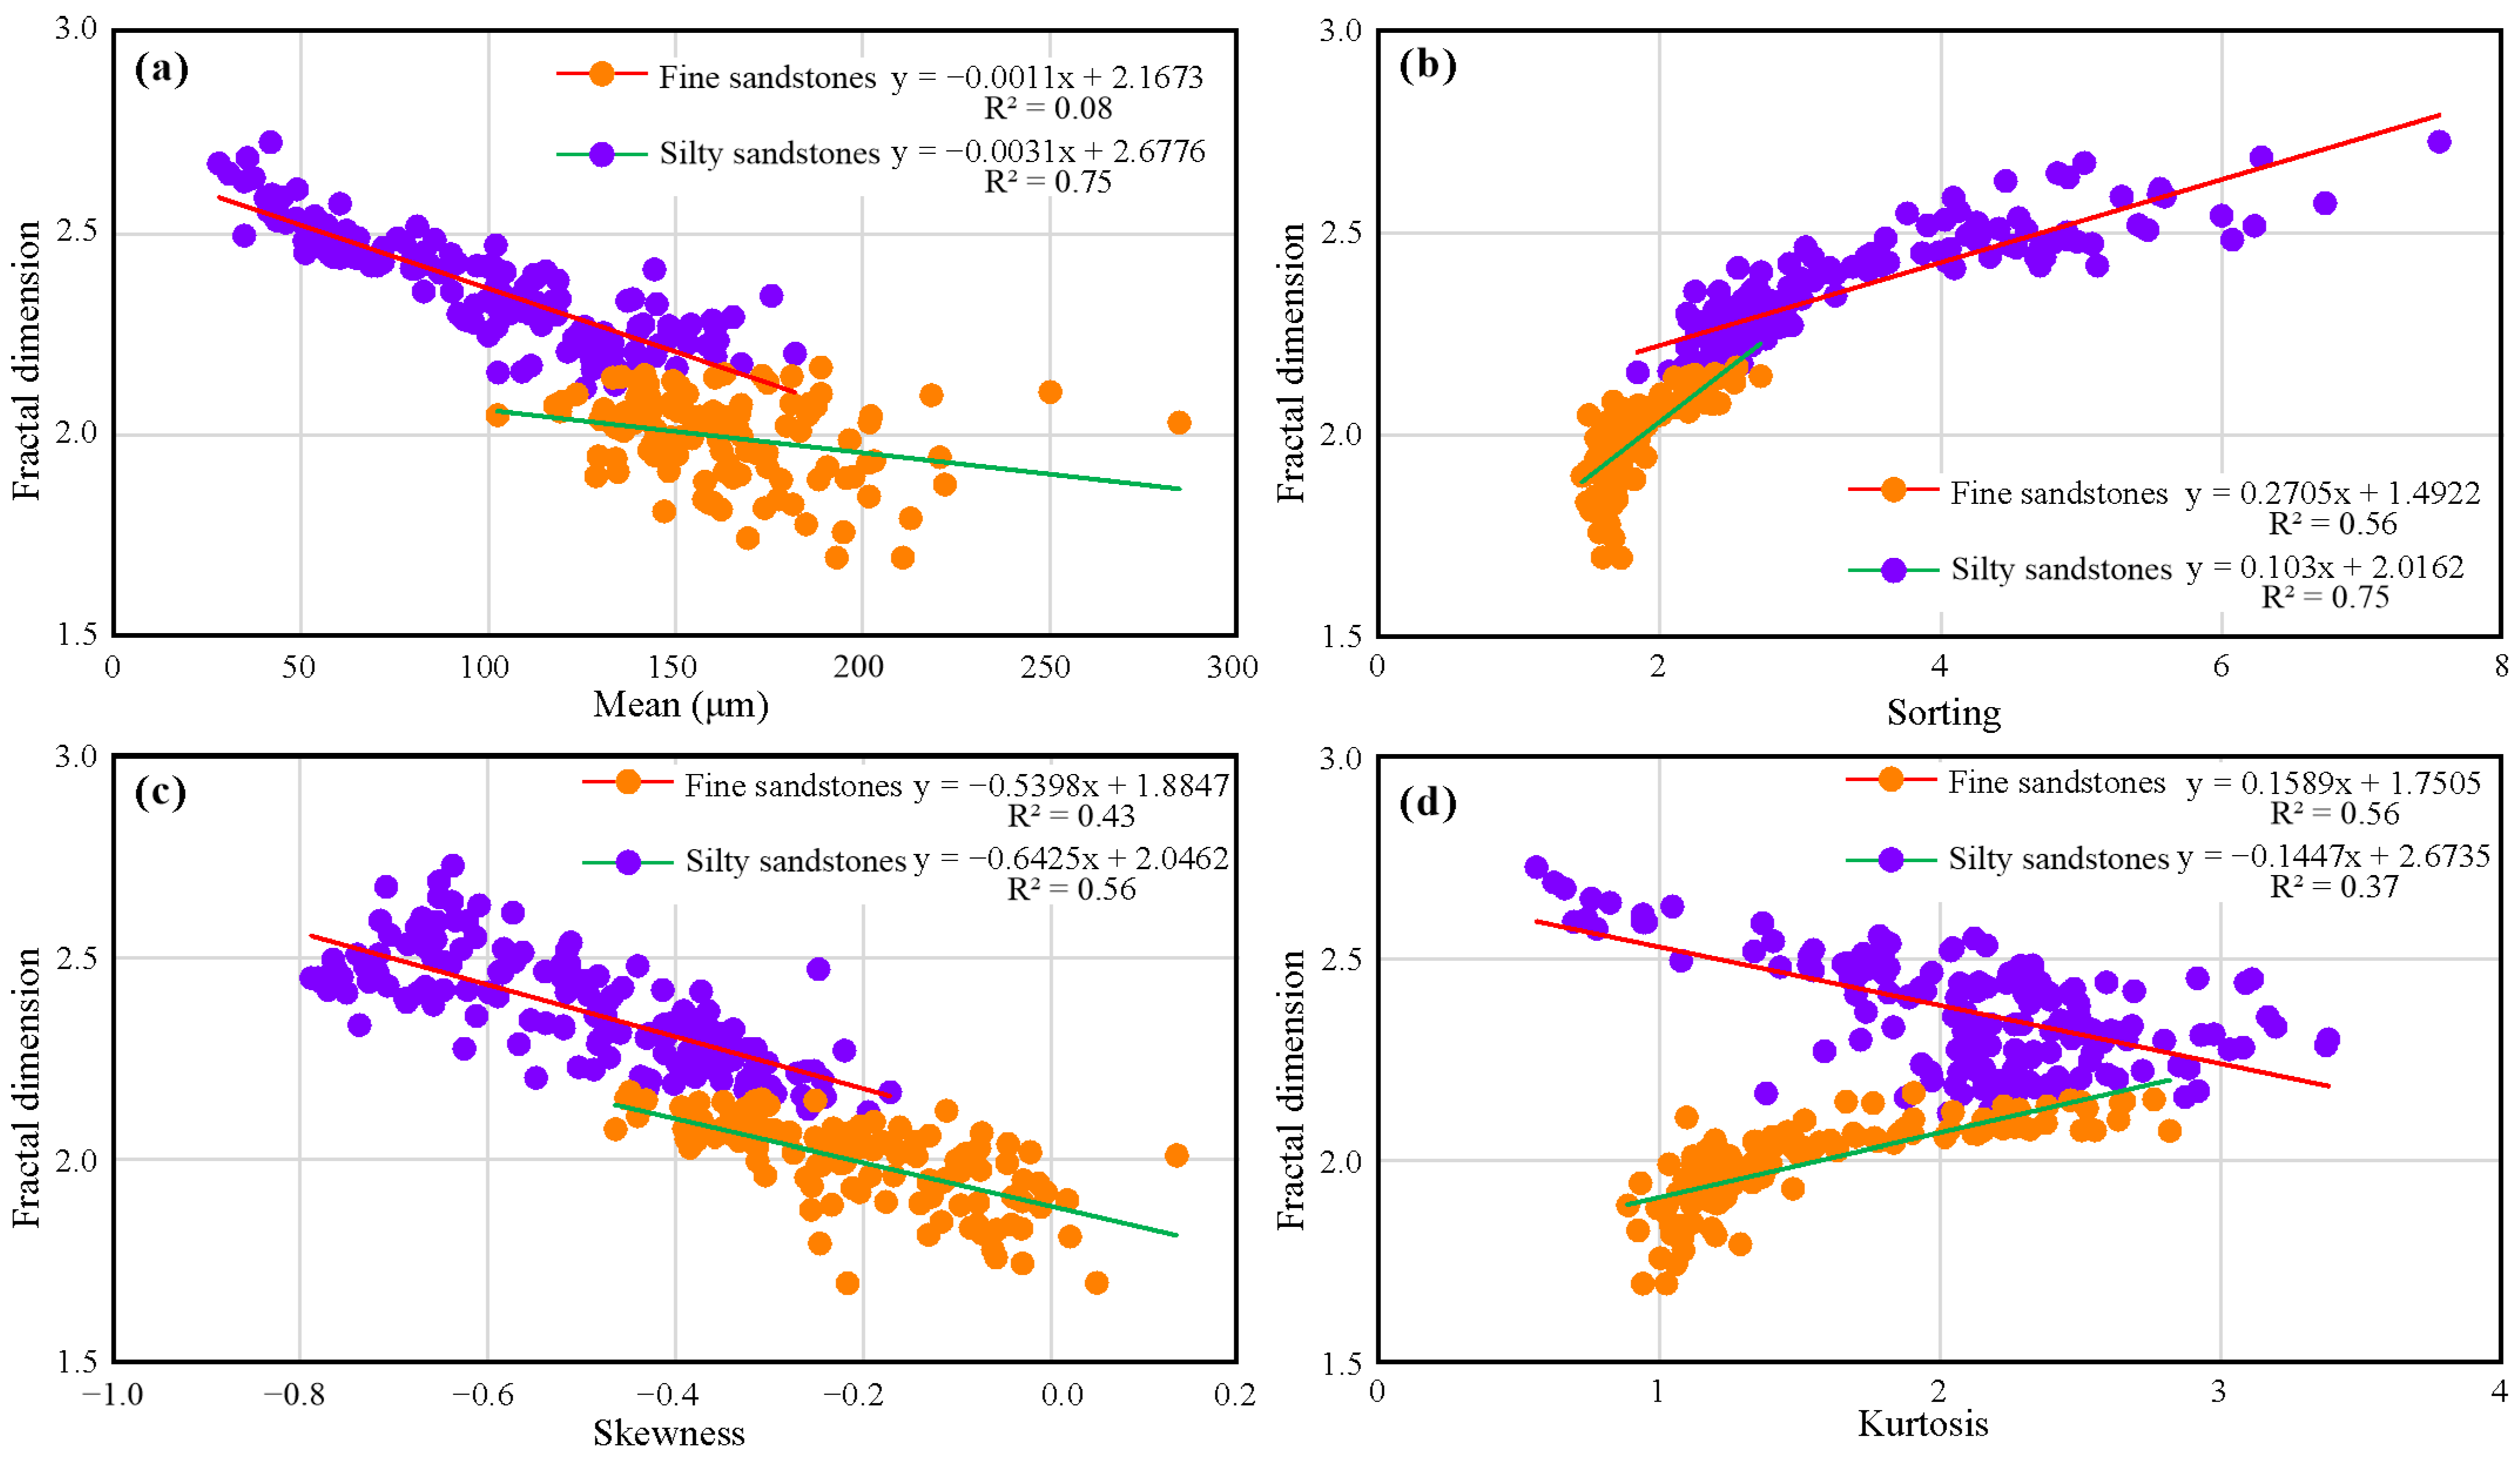
4.3. Relationships Between Fractal Dimension and Traditional Statistical Parameters

Traditional statistical parameters, including mean, sorting, skewness, and kurtosis, are usually used to describe texture features of PSD frequency curves. Relationships between fractal dimension and these statistical parameters of littoral sandstones in the Donghetang Formation are illustrated in Figure 9. Fractal dimension and mean of silty sandstones show a strong negative linear relationship (R2 = 0.75), while both for fine sandstones exhibit no correlation (R2 = 0.08) (Figure 9a).
Fractal dimension and sorting of silty sandstones show strong a positive linear relationship (R2 = 0.75), but both of fine sandstones exhibit a weak positive linear correlation (R2 = 0.56) (Figure 9b). Fractal dimension and skewness of fine sandstones and silty sandstones show weak negative linear relationships (R2 = 0.43 and 0.56, respectively) (Figure 9c). Generally speaking, the relationships between fractal dimension and mean, sorting, and skewness of silty sandstones are better than those of fine sandstones. Fractal dimension and kurtosis of silty sandstones have a weak negative linear relationship (R2 = 0.37), inversely, both of the fine sandstones show a weak positive linear relation (R2 = 0.56) (Figure 9d). This means that if sandy particle sizes are more concentrated in fine sandstone, they would have a higher capacity to fill space.

4.4. Relationships Between Fractal Dimension and Sedimentary Facies

In the subsurface littoral strata, bar and beach microfacies in wave-dominated upper-shoreface facies were usually clean fine sandstones; bar and beach microfacies in lower-shoreface facies were mainly silty and clayey sandstones; high silt and clay contents indicated local trough microfacies as the boundaries of sand bodies [37,38]. Based on relationships between particle sizes and littoral facies, the fractal dimensions may reflect the littoral depositional environment.
In HD119 Well, for example, the Donghetang Formation is obviously divided into two intervals: the lower-shoreface facies and the upper-shoreface facies (Figure 10). In the bar and beach microfacies of sandstones in lower-shoreface facies, sandy contents were 74.37–92.86% (averaged at 81.84%), means were 55.63–185.50 μm (averaged at 116.63 μm), sorting values are 2.01–4.71 (averaged at 3.15), and fractal dimension values were 2.05–2.47 (averaged at 2.33). In the bar and beach microfacies of sandstones in upper-shoreface facies, sandy contents were 81.59–96.25% (averaged at 89.65%), means were 102.31–212.87 μm (averaged at 143.25 μm), sorting values were 1.48–2.71 (averaged at 2.16), and fractal dimension values were 1.79–2.30 (averaged at 2.11). Sandy contents and means of sandstones in upper-shoreface facies are higher than those in lower-shoreface facies. Sorting and fractal dimension values of sandstones in upper-shoreface facies are lower than those in lower-shoreface facies. The intervals within the highest fractal dimension values correspond with high silty and clayey contents, which suggests the trough microfacies in littoral facies.
In the HD119 Well, sandy content, mean, sorting, skewness, and fractal dimension show a strong relationship with each other. Kurtosis is not related with other parameters. The fractal dimension shows a strong positive relationship with sorting, and a negative relationship with sandy content, mean, and skewness (Figure 11). This means that the fractal dimension can denote the sandy component, integral particle size, dispersion of different particle sizes, and asymmetry of littoral sandstone PSDs efficiently. Many present literatures use mean, sorting, skewness, and kurtosis of PSDs to discuss the general depositional environment [6,7]. With the help of more sedimentary information, the fractal dimension can be used as a new depositional indicator in various clastic deposits.

5. Conclusions

Taking the Carboniferous Donghetang Formation of the Hade Oilfield in the Tarim Basin as an example, fractal dimensions of 265 littoral sandstone PSDs are calculated and compared with particle size compositions, traditional statistical parameters, and facies. The main conclusions comprise the following three points:
(1)
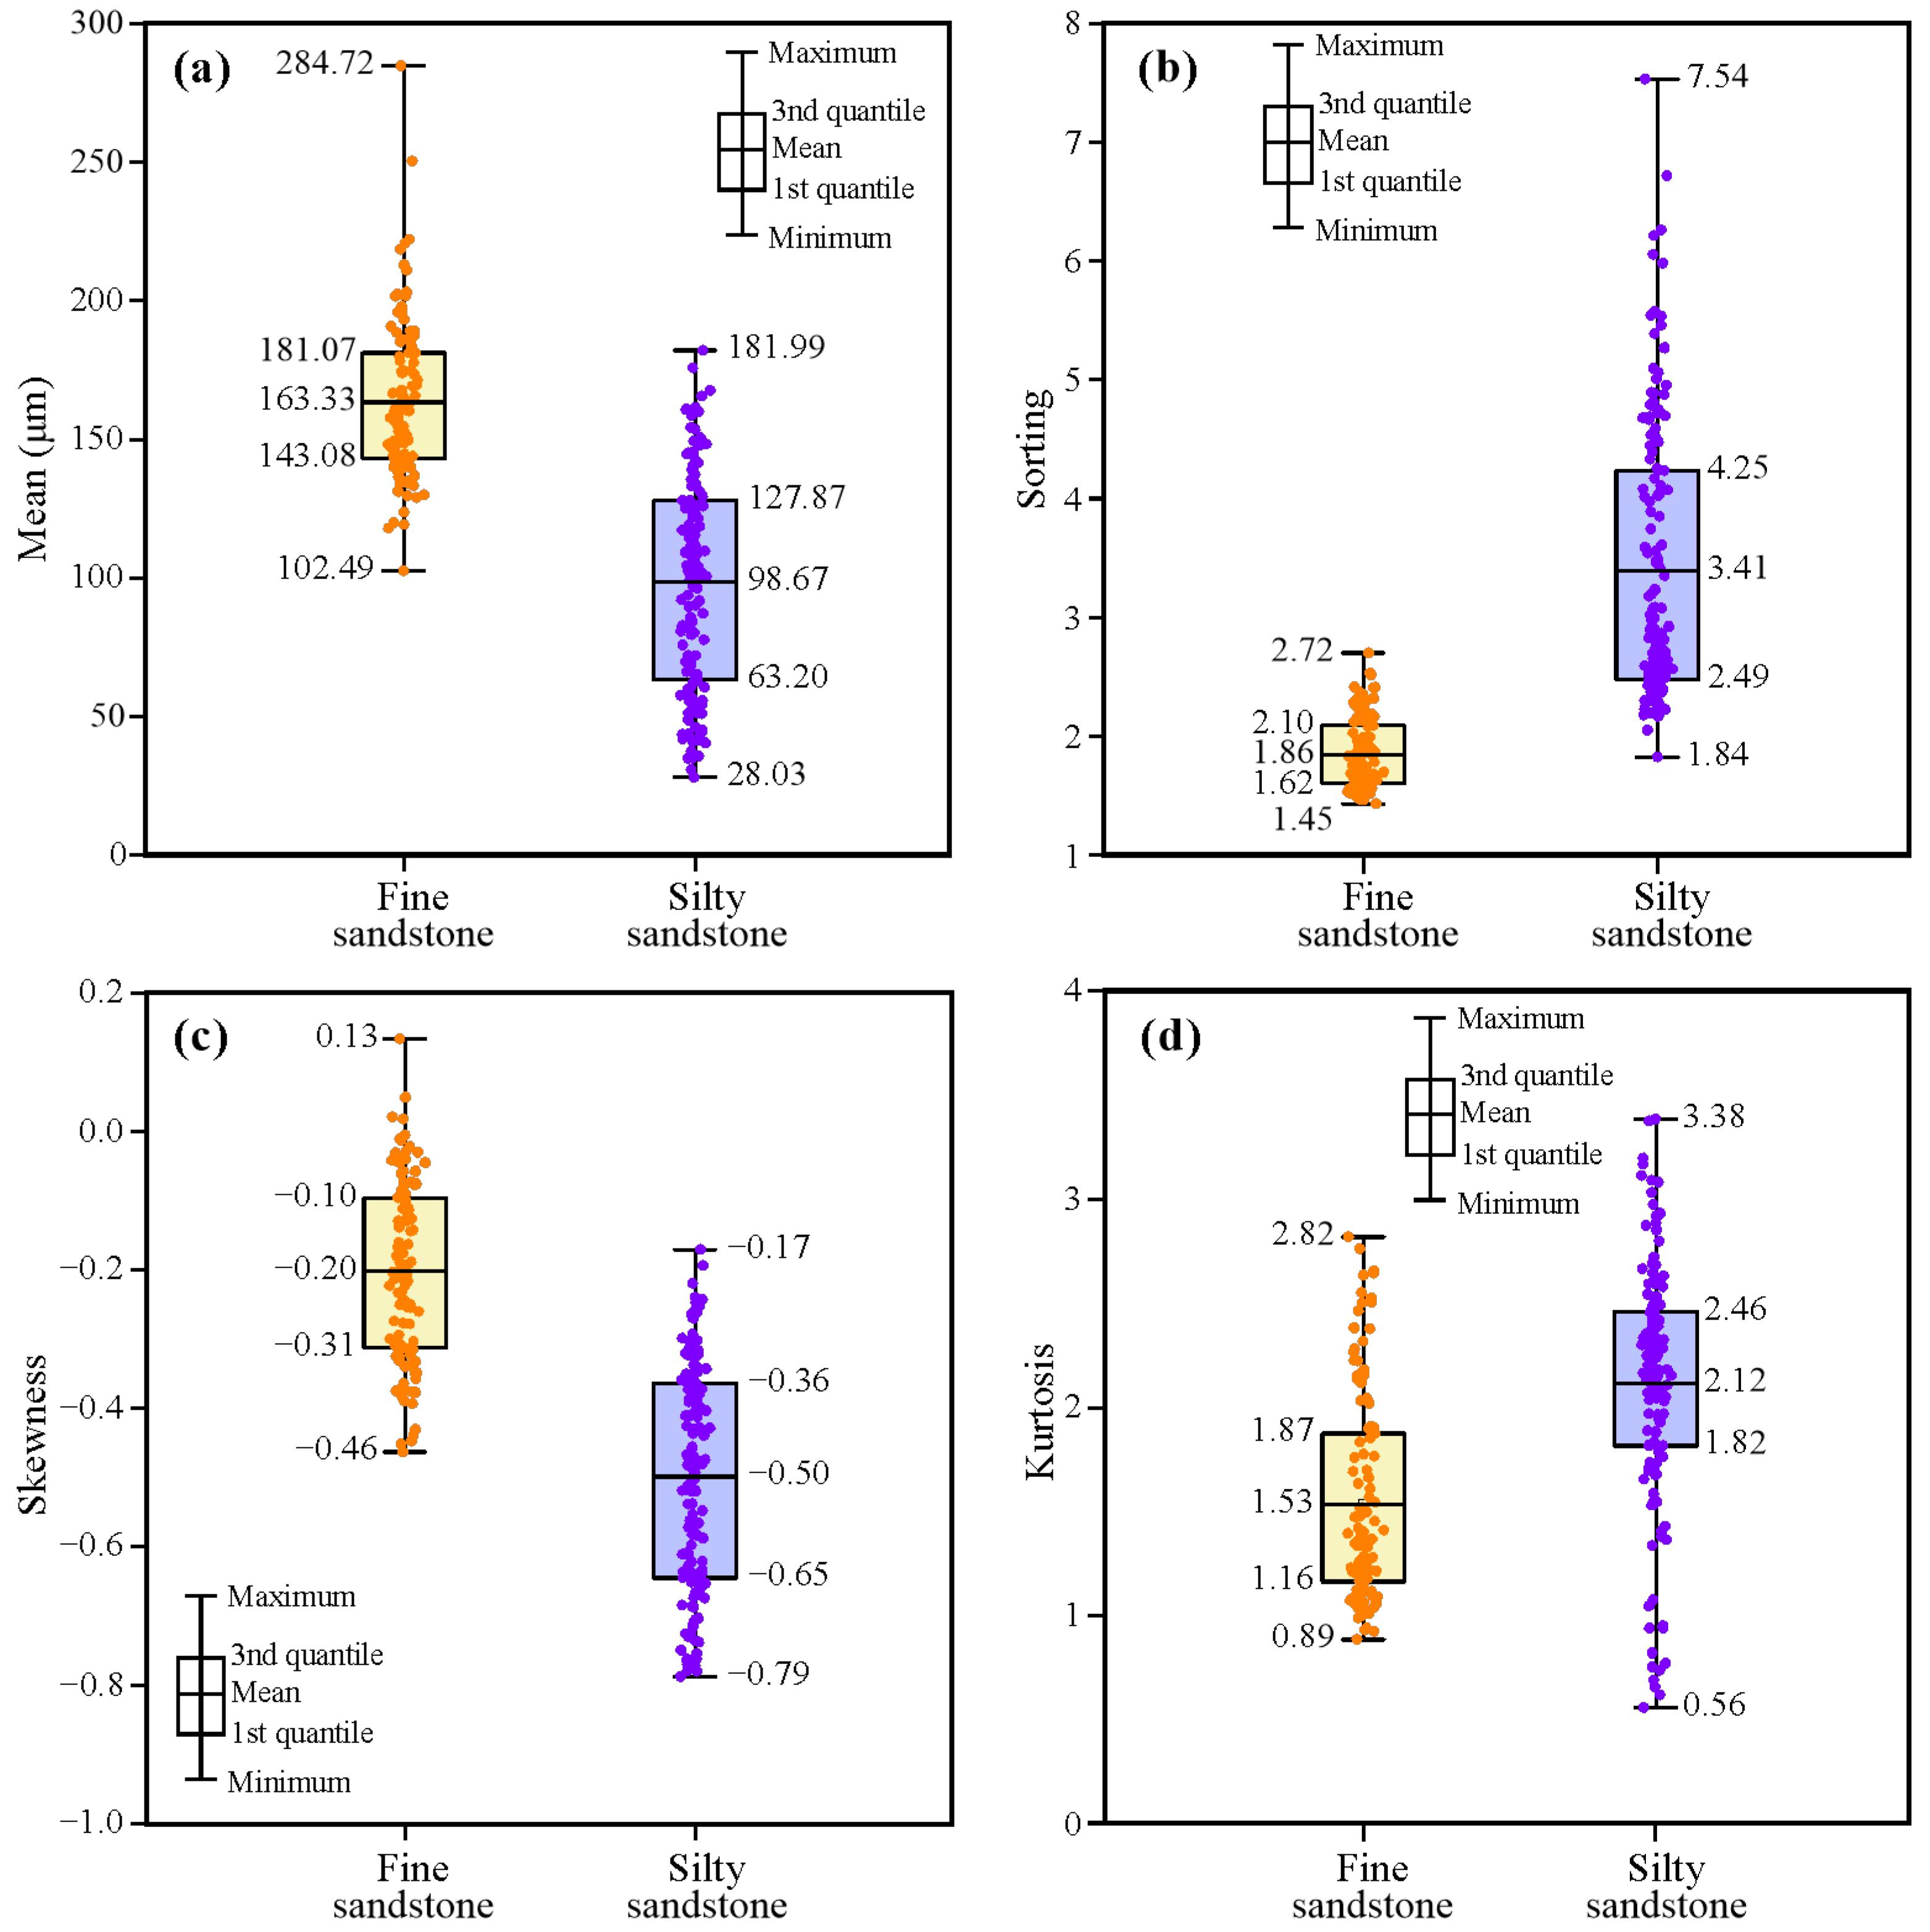
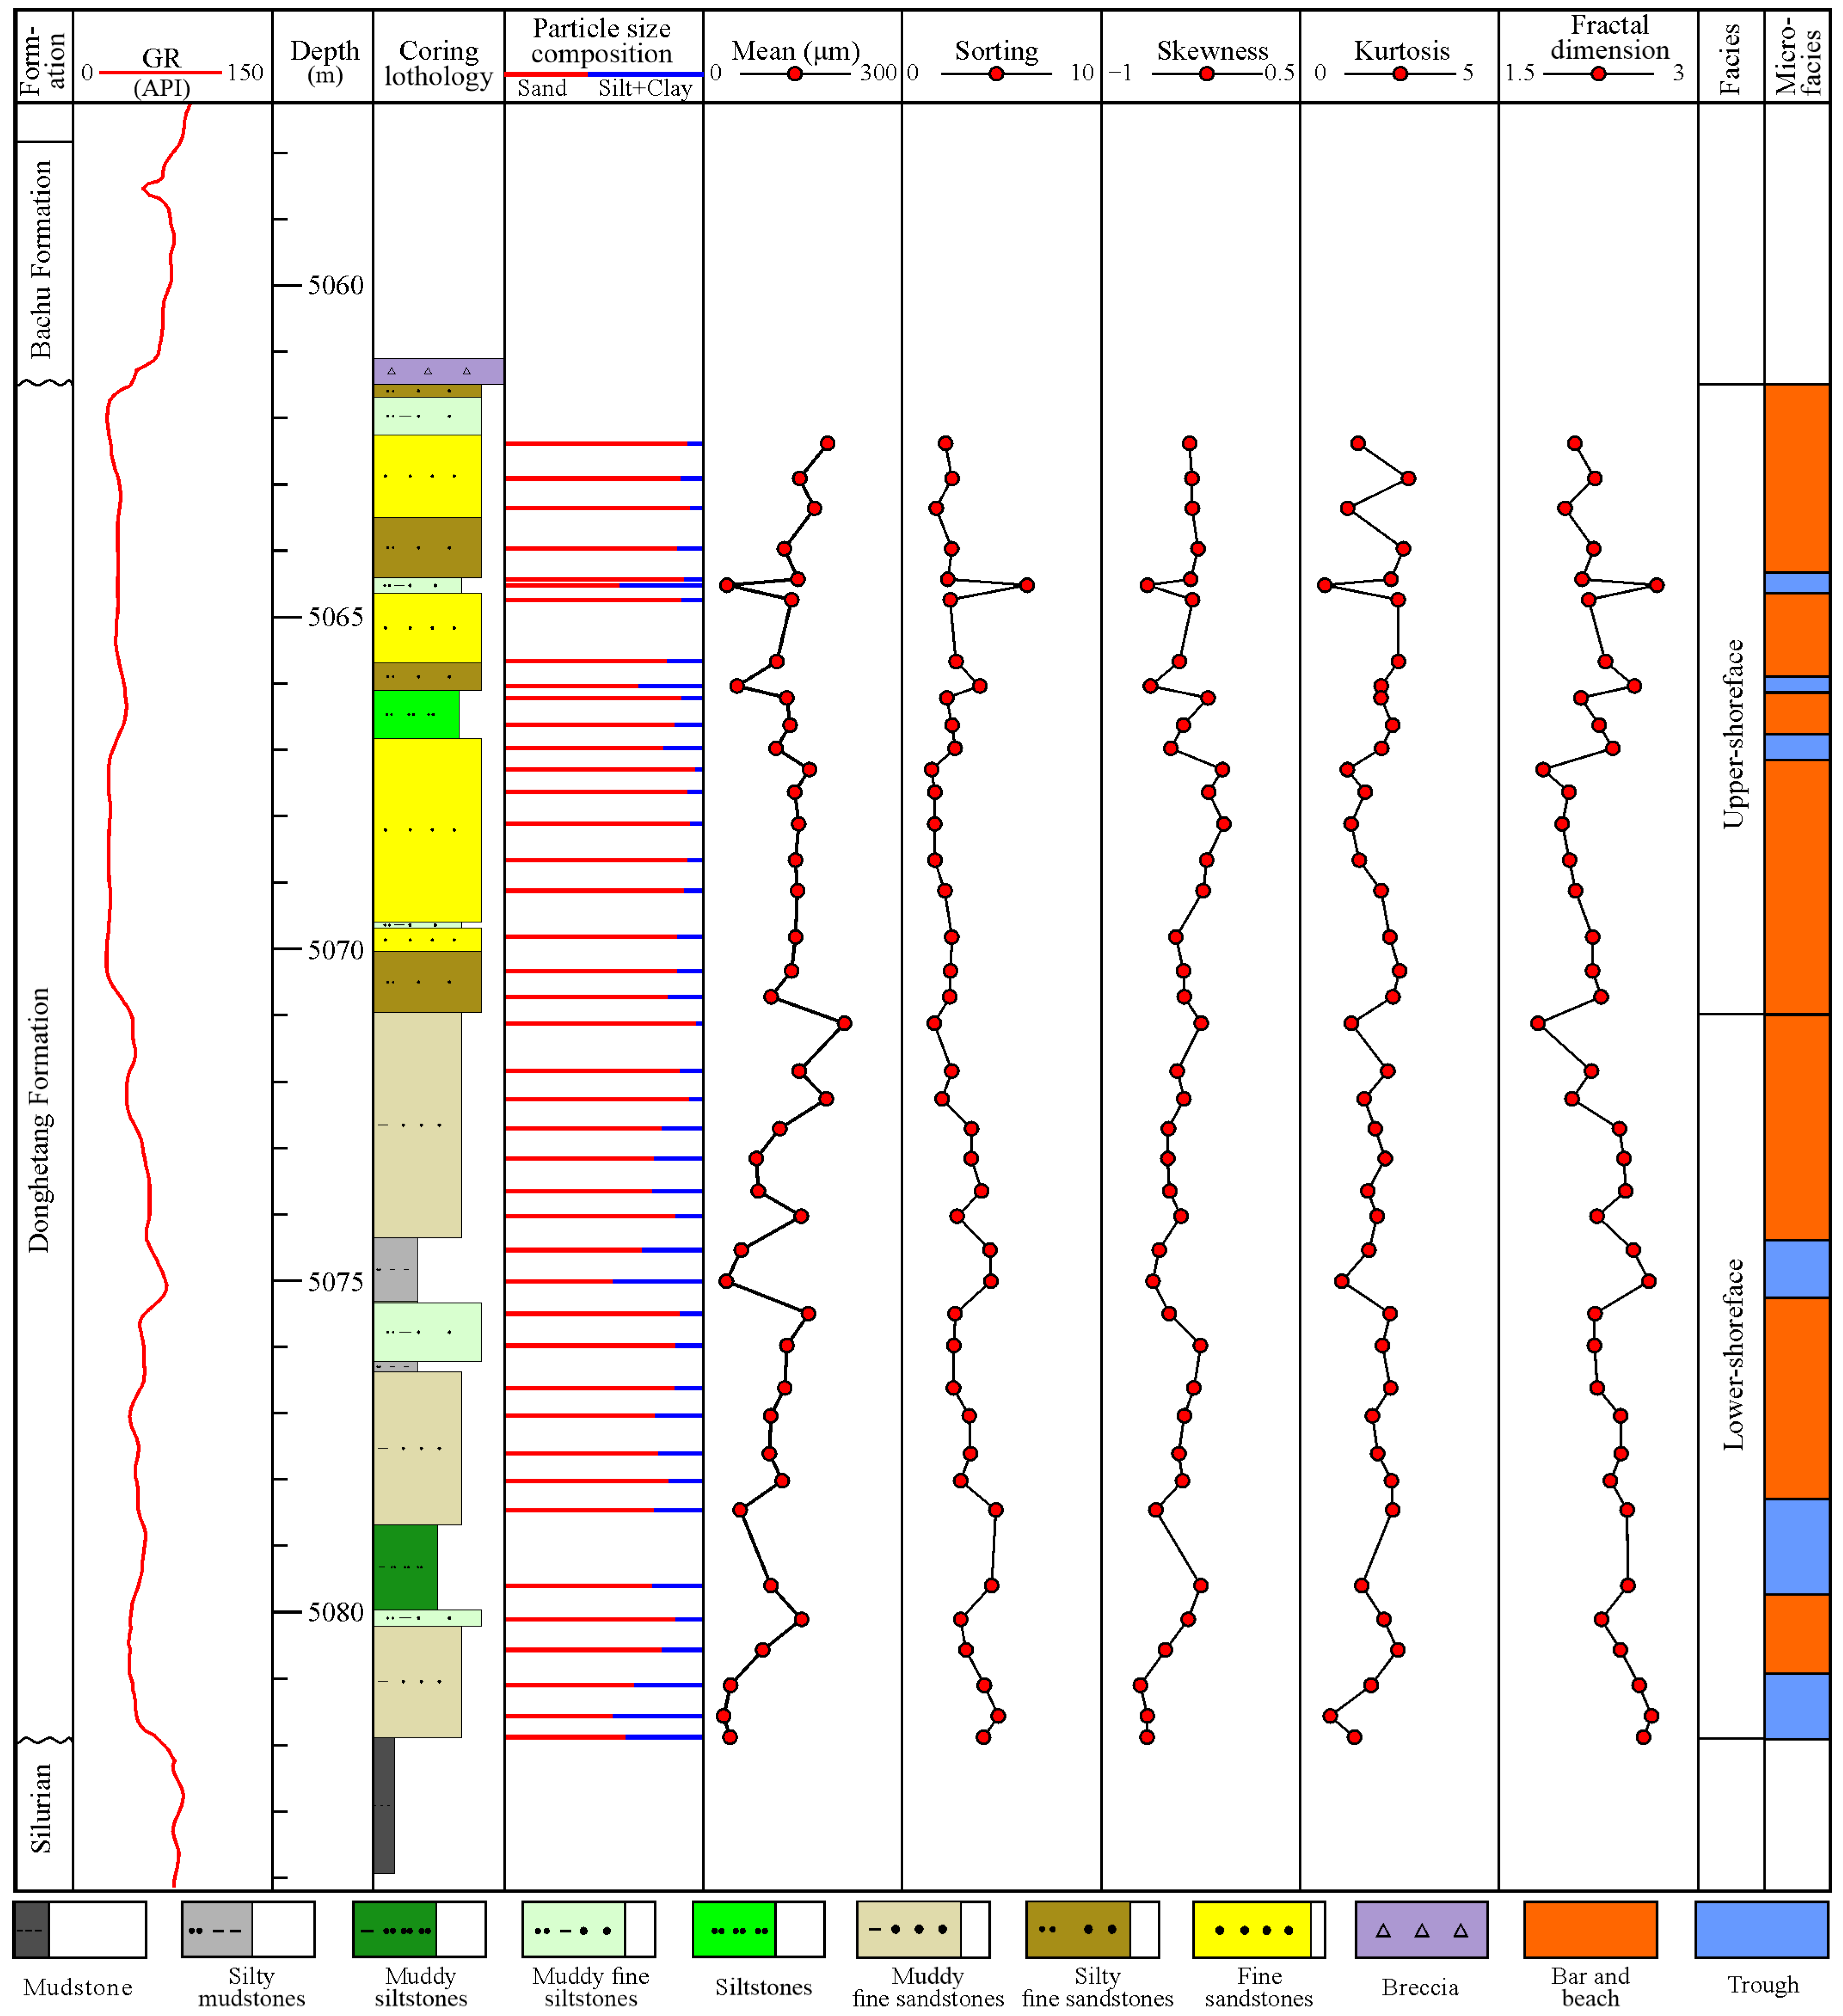
Littoral sandstones of the Donghetang Formation are divided into fine sandstones and silty sandstones. Mean, sorting, skewness, kurtosis, and fractal dimension values of fine sandstones are mainly 102.49–284.72 μm, 1.45–2.72, −0.46–0.13, 0.89–2.82, and 1.69–2.17, respectively. Those values of silty sandstones are dominantly 28.03–181.99 μm, 1.84–7.54, −0.79–−0.17, 0.56–3.38, and 2.12–2.73, respectively.
(2)
In PSDs of fine sandstones and silty sandstones, fractal dimension and sandy content show strong negative linear relationships. Fractal dimension and silty and clayey contents exhibit significant logarithmic relations. Relationships between fractal dimension and mean, sorting, and skewness of silty sandstones are better than those of fine sandstones. Fractal dimension and kurtosis of both sandstones have weak positive and negative linear relationships.
(3)
In littoral facies, fractal dimension values in lower-shoreface, 2.05–2.47 averaged at 2.33, are generally higher than that in upper-shoreface, 1.79–2.30 averaged at 2.11. In littoral microfacies, the fractal dimension values in bar and beach are commonly lower than that in trough. Combined with more sedimentary information, the fractal dimension can serve as another new depositional indicator in various clastic deposits.

Author Contributions

Conceptualization, R.Y. and Q.S.; methodology, R.Y.; software, Q.S.; validation, Q.S., M.Z. and W.L.; formal analysis, Y.S. and S.W.; investigation, M.Z. and W.L.; resources, R.Y.; data curation, Q.S., M.Z. and Y.Y.; writing—original draft, R.Y. and Q.S.; writing—review and editing, R.Y. and Q.S.; supervision, R.Y.; project administration, R.Y.; funding acquisition, R.Y. All authors have read and agreed to the published version of the manuscript.

Funding

This study was financially supported by the National Natural Science Foundation of China (No. 42202113) and Innovation and Entrepreneurship Training Program of Yangtze University (No. Yz2024041).

Institutional Review Board Statement

Not applicable.

Informed Consent Statement

Not applicable.

Data Availability Statement

The original contributions presented in this study are included in the article. Further inquiries can be directed to the corresponding author(s).

Acknowledgments

The reviewers are gratefully acknowledged for constructive comments that substantially improved the quality of this manuscript. We also appreciate the editor’s suggestions to revise this manuscript.

Conflicts of Interest

The authors declare that the research was conducted in the absence of any commercial or financial relationships that could be construed as a potential conflict of interest.

Abbreviations

The following abbreviations are used in this manuscript:
PSDParticle size distribution
GRNatural gamma ray logging, API
MeMean value of PSD, μm
SoSorting value of PSD
SkSkewness value of PSD
KuKurtosis value of PSD
RiArithmetic mean of the upper and lower limit of the ith particle size level, μm
RmaxMaximum particle size, μm
ViCumulative volume of particles smaller than Ri, μm3
VTTotal volume of sediment particles, μm3
DVolumetric fractal dimension of PSD

References

  1. Yuan, R. Progress on mining methods of sedimentological information from grain-size distribution from the background of big data. Acta Sediment. Sin. 2025, 43, 361–375. [Google Scholar] [CrossRef]
  2. IJmker, J.; Stauch, G.; Dietze, E.; Hartmann, K.; Diekmann, B.; Lockot, G.; Opitz, S.; Wünnemann, B.; Lehmkuhl, F. Characterisation of transport processes and sedimentary deposits by statistical end-member mixing analysis of terrestrial sediments in the Donggi Cona lake catchment, NE Tibetan Plateau. Sediment. Geol. 2012, 281, 166–179. [Google Scholar] [CrossRef]
  3. Bright, C.; Mager, S.; Horton, S. Response of nephelometric turbidity to hydrodynamic particle size of fine suspended sediment. Int. J. Sediment Res. 2020, 35, 444–454. [Google Scholar] [CrossRef]
  4. Román-Sánchez, A.; Temme, A.; Willgoose, G.; Berg, D.; Gura, C.M.; Vanwalleghem, T. The fingerprints of weathering: Grain size distribution changes along weathering sequences in different lithologies. Geoderma 2021, 383, 114753. [Google Scholar] [CrossRef]
  5. Liu, Y.M.; Wang, T.; Liu, B.; Long, Y.L.; Liu, X.X.; Sun, Y.B. Universal decomposition model: An efficient technique for palaeoenvironmental reconstruction from grain-size distribution. Sedimentology 2023, 70, 2127–2149. [Google Scholar] [CrossRef]
  6. Folk, R.L.; Ward, W.C. Brazos River bar: A study in the significance of grain size parameters. J. Sediment. Petro. 1957, 27, 3–26. [Google Scholar] [CrossRef]
  7. Cai, G.F.; Fan, D.D.; Shang, S.; Wu, Y.J.; Sha, L. Difference in grain-size parameters of tidal deposits derived from the graphic and its potential causes. Mar. Geol. Quat. Geol. 2014, 34, 195–204. [Google Scholar] [CrossRef]
  8. Parsons, A.J.; Michael, N.A.; Whittaker, A.C.; Duller, R.A.; Allen, P.A. Grain-size trends reveal the late orogenic tectonic and erosional history of the south–central Pyrenees, Spain. J. Geol. Soc. Lond. 2012, 169, 111–114. [Google Scholar] [CrossRef]
  9. Gao, S. Grain size trend analysis: Principle and applicability. Acta Sediment. Sin. 2009, 27, 826–836. [Google Scholar] [CrossRef]
  10. Li, J.L.; He, X.B.; Wei, J.; Bao, Y.H.; Tang, Q.; de Dieu Nambajimana, J.; Nsabimana, G.; Khurram, D. Multifractal features of the particle-size distribution of suspended sediment in the Three Gorges Reservoir, China. Int. J. Sediment Res. 2021, 36, 489–500. [Google Scholar] [CrossRef]
  11. Qiao, J.B.; Zhu, Y.J.; Jia, X.X.; Shao, M.A. Multifractal characteristics of particle size distributions (50–200 m) in soils in the vadose zone on the Loess Plateau, China. Soil Till. Res. 2021, 205, 104786. [Google Scholar] [CrossRef]
  12. Armstrong, A.C. On the fractal dimensions of some transient soil properties. J. Soil Sci. 1986, 37, 641–652. [Google Scholar] [CrossRef]
  13. Tyler, S.W.; Wheatcraft, S.W. Fractal scaling of soil particle-size distributions: Analysis and limitations. Soil Sci. Soc. Am. J. 1992, 56, 362–369. [Google Scholar] [CrossRef]
  14. Anderson, A.N.; McBratney, A.B.; Crawford, J.W. Applications of fractals to soil studies. Adv. Agron. 1997, 63, 1–76. [Google Scholar] [CrossRef]
  15. Mohammadi, M.; Shabanpour, M.; Mohammadi, M.H.; Davatgar, N. Characterizing spatial variability of soil textural fractions and fractal parameters derived from particle size distributions. Pedosphere 2019, 29, 224–234. [Google Scholar] [CrossRef]
  16. Sun, Z.; Ma, X.Z.; Chen, Y.H. Fractal and multifractal characteristics of soil particle-size distribution in different forest types in typical karst regions of Guangxi. Bull. Soil Water Conserv. 2025, 45, 10–19. [Google Scholar] [CrossRef]
  17. Tahmoures, M.; Honarbakhsh, A.; Afzali, S.F.; Abotaleb, M.; Ingram, B.; Ostovari, Y. Fractal features of soil particles as an indicator of land degradation under different types of land use at the watershed scale in Southern Iran. Land 2022, 11, 2093. [Google Scholar] [CrossRef]
  18. Mahdi, C.M.; Ghaleno, M.R.D. Evaluating fractal dimension of the soil particle size distributions and soil water retention curve obtained from soil texture components. Arch. Agron. Soil Sci. 2020, 66, 1668–1678. [Google Scholar] [CrossRef]
  19. Wei, X.; Li, X.G.; Wei, N. Fractal features of soil particle size distribution in layered sediments behind two check dams: Implications for the Loess Plateau, China. Geomorphology 2016, 266, 133–145. [Google Scholar] [CrossRef]
  20. Liu, Y.D.; Ji, W.J.; Li, Z. Soil fractal characteristics of deep profiles under different vegetation in Loess areas of Northern Shaanxi, China. Res. Soil Water Conserv. 2024, 31, 250–256+264. [Google Scholar] [CrossRef]
  21. He, Y.; Lv, D. Fractal expression of soil particle-size distribution at the basin scale. Open Geosci. 2022, 14, 70–78. [Google Scholar] [CrossRef]
  22. He, Y.J.; Peng, B.R.; Dai, L.; Wang, Y.Y.; Liu, Y.; Wang, G.L. The spatial variation of soil structure fractal derived from particle size distributions at the basin scale. Fractal Fract. 2024, 8, 570. [Google Scholar] [CrossRef]
  23. Yan, L.L.; Song, Y.H. Physical and experimental simulation of unconventional reservoir formation for Carboniferous in Hudson Oilfield, Tarim Basin, China. Front. Earth Sci. 2024, 12, 1430019. [Google Scholar] [CrossRef]
  24. Zhao, J.W.; Xu, H.M.; He, C.; Jiang, T.W.; Xu, Z.H.; Yang, J.P.; Wang, C.; Yu, Y.C. Control mechanism of sea level rise and fall on the macroscopic heterogeneity of marine reservoirs: An example of the Donghe Sandstone reservoir in the Hadeson Oilfield, Tarim Basin. Geol. Explor. 2017, 53, 590–598. [Google Scholar] [CrossRef]
  25. Li, J.C.; Chen, Y.Z.; He, H.; Song, H.M.; Xu, J.; Wu, J. Oil and gas distribution in Devonian Donghe Sandstone of Tarim Basin. Xinjiang Petrol. Geol. 2017, 38, 505–511. [Google Scholar] [CrossRef]
  26. Zhao, J.W.; Xu, H.M.; Jiang, T.W.; He, C.; Xu, Z.H.; Yang, J.P.; Yu, Y.C.; Wang, C. The controlling effect of sea level changing on the microscopic heterogeneity of marine reservoir: Taking shoreface subfacies reservoir of Donghe Sandstone in Hade 4 Oilfield as an example. J. China Univ. Min. Technol. 2018, 47, 1068–1080. [Google Scholar] [CrossRef]
  27. SY/T 5434-2009; Analysis Method for Particle Size of Clastic Rocks. Oil and Gas Industry Standard of China. National Energy Administration: Beijing, China, 2009.
  28. Prosperini, N.; Perugini, D. Particle size distributions of some soils from the Umbria Region (Italy): Fractal analysis and numerical modelling. Geoderma 2008, 145, 185–195. [Google Scholar] [CrossRef]
  29. He, F.; Mohamadzadeh, N.; Sadeghnejad, M.; Ingram, B.; Ostovari, Y. Fractal features of soil particles as an index of land degradation under different land-use patterns and slope-aspects. Land 2023, 12, 615. [Google Scholar] [CrossRef]
  30. Liu, X.; Zhang, G.C.; Heathman, G.C.; Wang, Y.Q.; Huang, C.H. Fractal features of soil particle-size distribution as affected by plant communities in the forested region of Mountain Yimeng, China. Geoderma 2009, 154, 123–130. [Google Scholar] [CrossRef]
  31. Deng, J.F.; Wan, L.Y.; Hou, R.P.; Li, J.H.; Wu, B.; Han, M.; Shi, X.L. Soil grain fractal characteristics and soil properties of five forest stand types in the Liaodong Mountains area. J. Northeast For. Univ. 2024, 52, 99–108. [Google Scholar] [CrossRef]
  32. Fu, X.; Ding, H.; Sheng, Q.; Zhang, Z.; Yin, D.; Chen, F. Fractal analysis of particle distribution and scale effect in a soil–rock mixture. Fractal Fract. 2022, 6, 120. [Google Scholar] [CrossRef]
  33. Diao, E.L.; Cao, G.C.; Cao, S.K.; Yuan, J.; Tong, S.; Qiu, X.X. Soil particle size and fractal characteristics at different scales. Res. Soil Water Conserv. 2024, 31, 212–220. [Google Scholar] [CrossRef]
  34. Blott, S.J.; Pye, K. GRADISTAT: A grain size distribution and statistics package for the analysis of unconsolidated sediments. Earth Surf. Process. Landf. 2001, 26, 1237–1248. [Google Scholar] [CrossRef]
  35. Folk, R.L. The distinction between grain size and mineral composition in sedimentary-rock nomenclature. J. Geol. 1954, 62, 344–359. [Google Scholar] [CrossRef]
  36. Gao, G.L.; Ding, G.D.; Zhao, Y.Y.; Wu, B.; Zhang, Y.Q.; Qin, S.G.; Bao, Y.F.; Yu, M.H.; Liu, Y.D. Fractal approach to estimating changes in soil properties following the establishment of Caragana korshinskii shelterbelts in Ningxia, NW China. Ecol. Indic. 2014, 43, 236–243. [Google Scholar] [CrossRef]
  37. Li, W.L.; Xu, H.M.; Gao, S.Y.; Yu, Y.C.; Ning, C.Z.; Yang, J.K.; Jiang, T.W. Inner architectural characteristics of wave-dominated shoreface deposits and their geological implications: A case study of Devonian ‘Donghe Sandstones’ in Tarim Basin, China. Mar. Pet. Geol. 2021, 134, 105334. [Google Scholar] [CrossRef]
  38. Li, W.L.; Xu, H.M.; Yang, J.K.; Gao, S.Y.; Ning, C.Z.; Yu, Y.C.; Jiang, T.W.; Wan, F.F. Different depositional models of wave-dominated shoreface deposits: An integrated process-oriented analysis (“Donghe Sandstones” in Tarim Basin, China). Mar. Pet. Geol. 2023, 153, 106288. [Google Scholar] [CrossRef]
Figure 1. Study area and materials of the Donghetang Formation in the Hade Oilfield. (a) Tectonic background of the Hade Oilfield in the Tarim Basin. (b) Stratigraphic composite chart of the Donghetang Formation and sampling locations in the HD113 Well. (c) Sampling wells in thickness distribution of the Donghe Sandstone in the Hade Oilfield. Digits in brackets denote sampling numbers in each well.
Fractalfract 09 00364 g001
Figure 2. Frequency curves of 265 littoral sandstone PSDs in the Donghetang Formation.
Fractalfract 09 00364 g002
Figure 3. Sand–silt–clay triangular diagram of 265 littoral sandstone PSDs in the Donghetang Formation.
Fractalfract 09 00364 g003
Figure 4. Boxplots of traditional statistical parameters of littoral sandstones in the Donghetang Formation. (a) Mean values of fine sandstones and silty sandstones; (b) Sorting values of fine sandstones and silty sandstones; (c) Skewness values of fine sandstones and silty sandstones; (d) Kurtosis values of fine sandstones and silty sandstones.
Fractalfract 09 00364 g004
Figure 5. Two typical PSDs and their corresponding fractal dimension results. (a) Two typical PSDs of fine sandstone and silty sandstone; (b) corresponding fractal dimension results of (a).
Fractalfract 09 00364 g005
Figure 6. Boxplots of fractal dimensions and fitting R2 of littoral sandstones in the Donghetang Formation. (a) Fractal dimensions of fine sandstones and silty sandstones; (b) fitting R2 of fine sandstones and silty sandstones.
Fractalfract 09 00364 g006
Figure 7. Pearson’s correlation plot of all PSDs relevant parameters of littoral sandstones in the Donghetang Formation.
Fractalfract 09 00364 g007
Figure 8. Regression equations between fractal dimension and particle size compositions of fine sandstones and silty sandstones. (a) Relation between fractal dimension and sandy content; (b) Relation between fractal dimension and silty content; (c) Relation between fractal dimension and clayey content.
Fractalfract 09 00364 g008
Figure 9. Regression equations between fractal dimension and traditional statistical parameters of fine sandstones and silty sandstones. (a) Relation between fractal dimension and mean values; (b) Relation between fractal dimension and sorting values; (c) Relation between fractal dimension and skewness values; (d) Relations between fractal dimension and kurtosis values.
Fractalfract 09 00364 g009
Figure 10. PSD parameters, fractal dimension, and facies results in the HD119 Well.
Fractalfract 09 00364 g010
Figure 11. Pearson’s correlation plot of all relevant PSDs parameters in the HD119 Well.
Fractalfract 09 00364 g011
Disclaimer/Publisher’s Note: The statements, opinions and data contained in all publications are solely those of the individual author(s) and contributor(s) and not of MDPI and/or the editor(s). MDPI and/or the editor(s) disclaim responsibility for any injury to people or property resulting from any ideas, methods, instructions or products referred to in the content.

