Article

Evolution of Pore Structure and Fractal Characteristics in Transitional Shale Reservoirs: Case Study of Shanxi Formation, Eastern Ordos Basin

1
School of Geoscience and Technology, Southwest Petroleum University, Chengdu 610500, China
2
Collaborative Innovation Center of Shale Gas Resources and Environment, Chengdu 610500, China
3
College of Energy (College of Modern Shale Gas Industry), Chengdu University of Technology, Chengdu 610059, China
4
PetroChina Research Institute of Petroleum Exploration and Development, Beijing 100083, China
*
Author to whom correspondence should be addressed.
Fractal Fract. 2025, 9(6), 335; https://doi.org/10.3390/fractalfract9060335
Submission received: 29 April 2025 / Revised: 18 May 2025 / Accepted: 19 May 2025 / Published: 23 May 2025

Abstract

The fractal dimension quantitatively describes the complexity of the shale pore structure and serves as a powerful tool for characterizing the evolution of shale reservoirs. Thermal simulation experiments were conducted on the low-maturity transitional shale from the Shanxi Formation in the Ordos Basin. The initial samples consisted mainly of quartz (39.9%) and clay minerals (49.9%) with moderate-to-good hydrocarbon generation potential. Samples from different thermal maturation stages were analyzed through geochemical, mineralogical, and pore structure experiments to reveal the evolution of mineral compositions and pore structure parameters. The fractal dimensions of the pore structure were calculated using both the FHH and capillary bundle models. Correlation coefficients and principal component analysis (PCA) were employed to explore the factors influencing the fractal dimension and its evolutionary patterns during reservoir development. The results indicate that (1) with increasing thermal maturity, the quartz content gradually increases while the contents of clay minerals, carbonate minerals, pyrite, and feldspar decrease. (2) The evolution of porosity follows five stages: a slow decrease (0.78 < Ro < 1.0%), a rapid increase (1.0% < Ro < 2.0%), a relatively stable phase (2.0% < Ro < 2.7%), a rapid rise (2.7% < Ro < 3.2%), and a slow decline (Ro > 3.2%). The evolution of the pore volume (PV) and specific surface area (SSA) indicates that the proportion of pores in the 5–20 nm and 20–60 nm ranges gradually increases while the proportion of pores smaller than 5 nm decreases. (3) The fractal dimension of shale pores (D1, average value 2.61) derived from the FHH model is higher than D2 (average value 2.56). This suggests that the roughness of pore surfaces is greater than the complexity of the internal pore structure at various maturities. The DM distribution range calculated from the capillary bundle model was broad (between 2.47 and 2.94), with an average value of 2.84, higher than D1 and D2. This likely indicates that larger pores have more complex structures. (4) D1 shows a strong correlation with porosity, PV, and SSA and can be used to reflect pore development. D2 correlates well with geochemical parameters (TOC, HI, etc.) and minerals prone to diagenetic alteration (carbonates, feldspar, and pyrite), making it useful for characterizing the changes in components consumed during pore structure evolution. (5) Based on the thermal maturation process of organic matter, mineral composition, diagenesis, and pore structure evolution, an evolutionary model of the fractal dimension for transitional shale was established.

1. Introduction

Fractal theory was introduced by Mandelbrot in 1967 [1,2]. Unlike traditional Euclidean geometry, this theory is commonly used to analyze materials or patterns that exhibit self-similarity [1,2]. In recent years, fractal theory has been widely applied in the study of unconventional oil and gas reservoirs (such as shale, coalbeds, and tight sandstones), enabling the quantitative assessment of micro-reservoir heterogeneity [3,4,5,6]. Previous studies had utilized methods such as SEM imaging, nitrogen adsorption (LTNA), mercury intrusion (MICP), small-angle scattering (SANS), and nuclear magnetic resonance (NMR) to conduct fractal analysis [7,8,9]. Additionally, many researchers have attempted to apply models such as the Frenkel–Halsey–Hill (FHH), Neimark, Brunauer–Emmett–Teller (BET), and Menger sponge models to study fractal properties of the reservoir space in different types of shale [10,11,12,13,14]. Currently, the most popular approach involves combining multiple experimental techniques to obtain the full pore size distribution of the pore structure [6,15,16]. CO2 adsorption experiments and LTNA data are commonly used for the fractal characterization of micropores and mesopores [6,17,18]. MICP experiments and NMR data are used to characterize the fractal features of larger pores and microfractures, as well as of other large-scale spaces [8,9,19,20]. Furthermore, conducting mathematical analysis using the fractal dimensions of different pore types, along with pore structures and shale compositions, helps identify the main controlling factors of fractal dimensions. This approach also supports the development of models to evaluate pore heterogeneity [21,22,23].
The transitional shale in the Ordos Basin holds significant resource potential and is considered a key contributor to the future growth of shale gas production in China due to its suitability for large-scale exploration and development [24,25]. Compared to marine shale, transitional shale typically contains a higher clay content and exhibits greater variation in thickness, stronger reservoir heterogeneity, and more pronounced differences in gas content, making the development strategy more complex [26,27,28]. As hydrocarbon generation progresses, the pore structure of shale and its controlling factors undergo significant changes. These variations pose major challenges for predicting sweet spots and guiding efficient reservoir development [29,30]. The fractal dimension provides a quantitative measure of the heterogeneity and complexity of shale pore structures. It also serves as a bridge linking microscopic pore characteristics (such as the pore size distribution and connectivity) with reservoir properties, lithology, and geochemical parameters [4,5,19,20]. A higher fractal dimension indicates greater pore heterogeneity. This often corresponds to larger internal surface areas and higher surface energy, which can hinder hydrocarbon flow and reduce recovery efficiency [16]. Therefore, studying the pore structure and fractal characteristics of transitional shale is essential for accurately evaluating reservoir quality, predicting productive zones, and enhancing hydrocarbon recovery.
To investigate the pore structure characteristics, fractal features, and controlling factors of shale at different stages of evolution, this study selected low-maturity transitional shale from the Permian Shanxi Formation in the Eastern Ordos Basin for thermal simulation experiments. Shale samples of varying maturities were subjected to fractal analysis, enabling a comprehensive quantitative evaluation of heterogeneity throughout the micro-evolution process. Initially, experiments such as mineral composition analysis, geochemical parameter assessment, scanning electron microscopy (SEM), and nitrogen adsorption were used to analyze the pore structure characteristics of the transitional shale. Next, the fractal dimension of the shale was calculated using the FHH model based on LTNA and the mercury intrusion capillary bundle model. Finally, through correlation analysis and principal component analysis, the relationship between the pore structure and fractal dimension of the transitional shale was revealed, and the factors influencing the fractal dimension were discussed. The variations in fractal dimension across different evolutionary stages and their underlying mechanisms were explained.

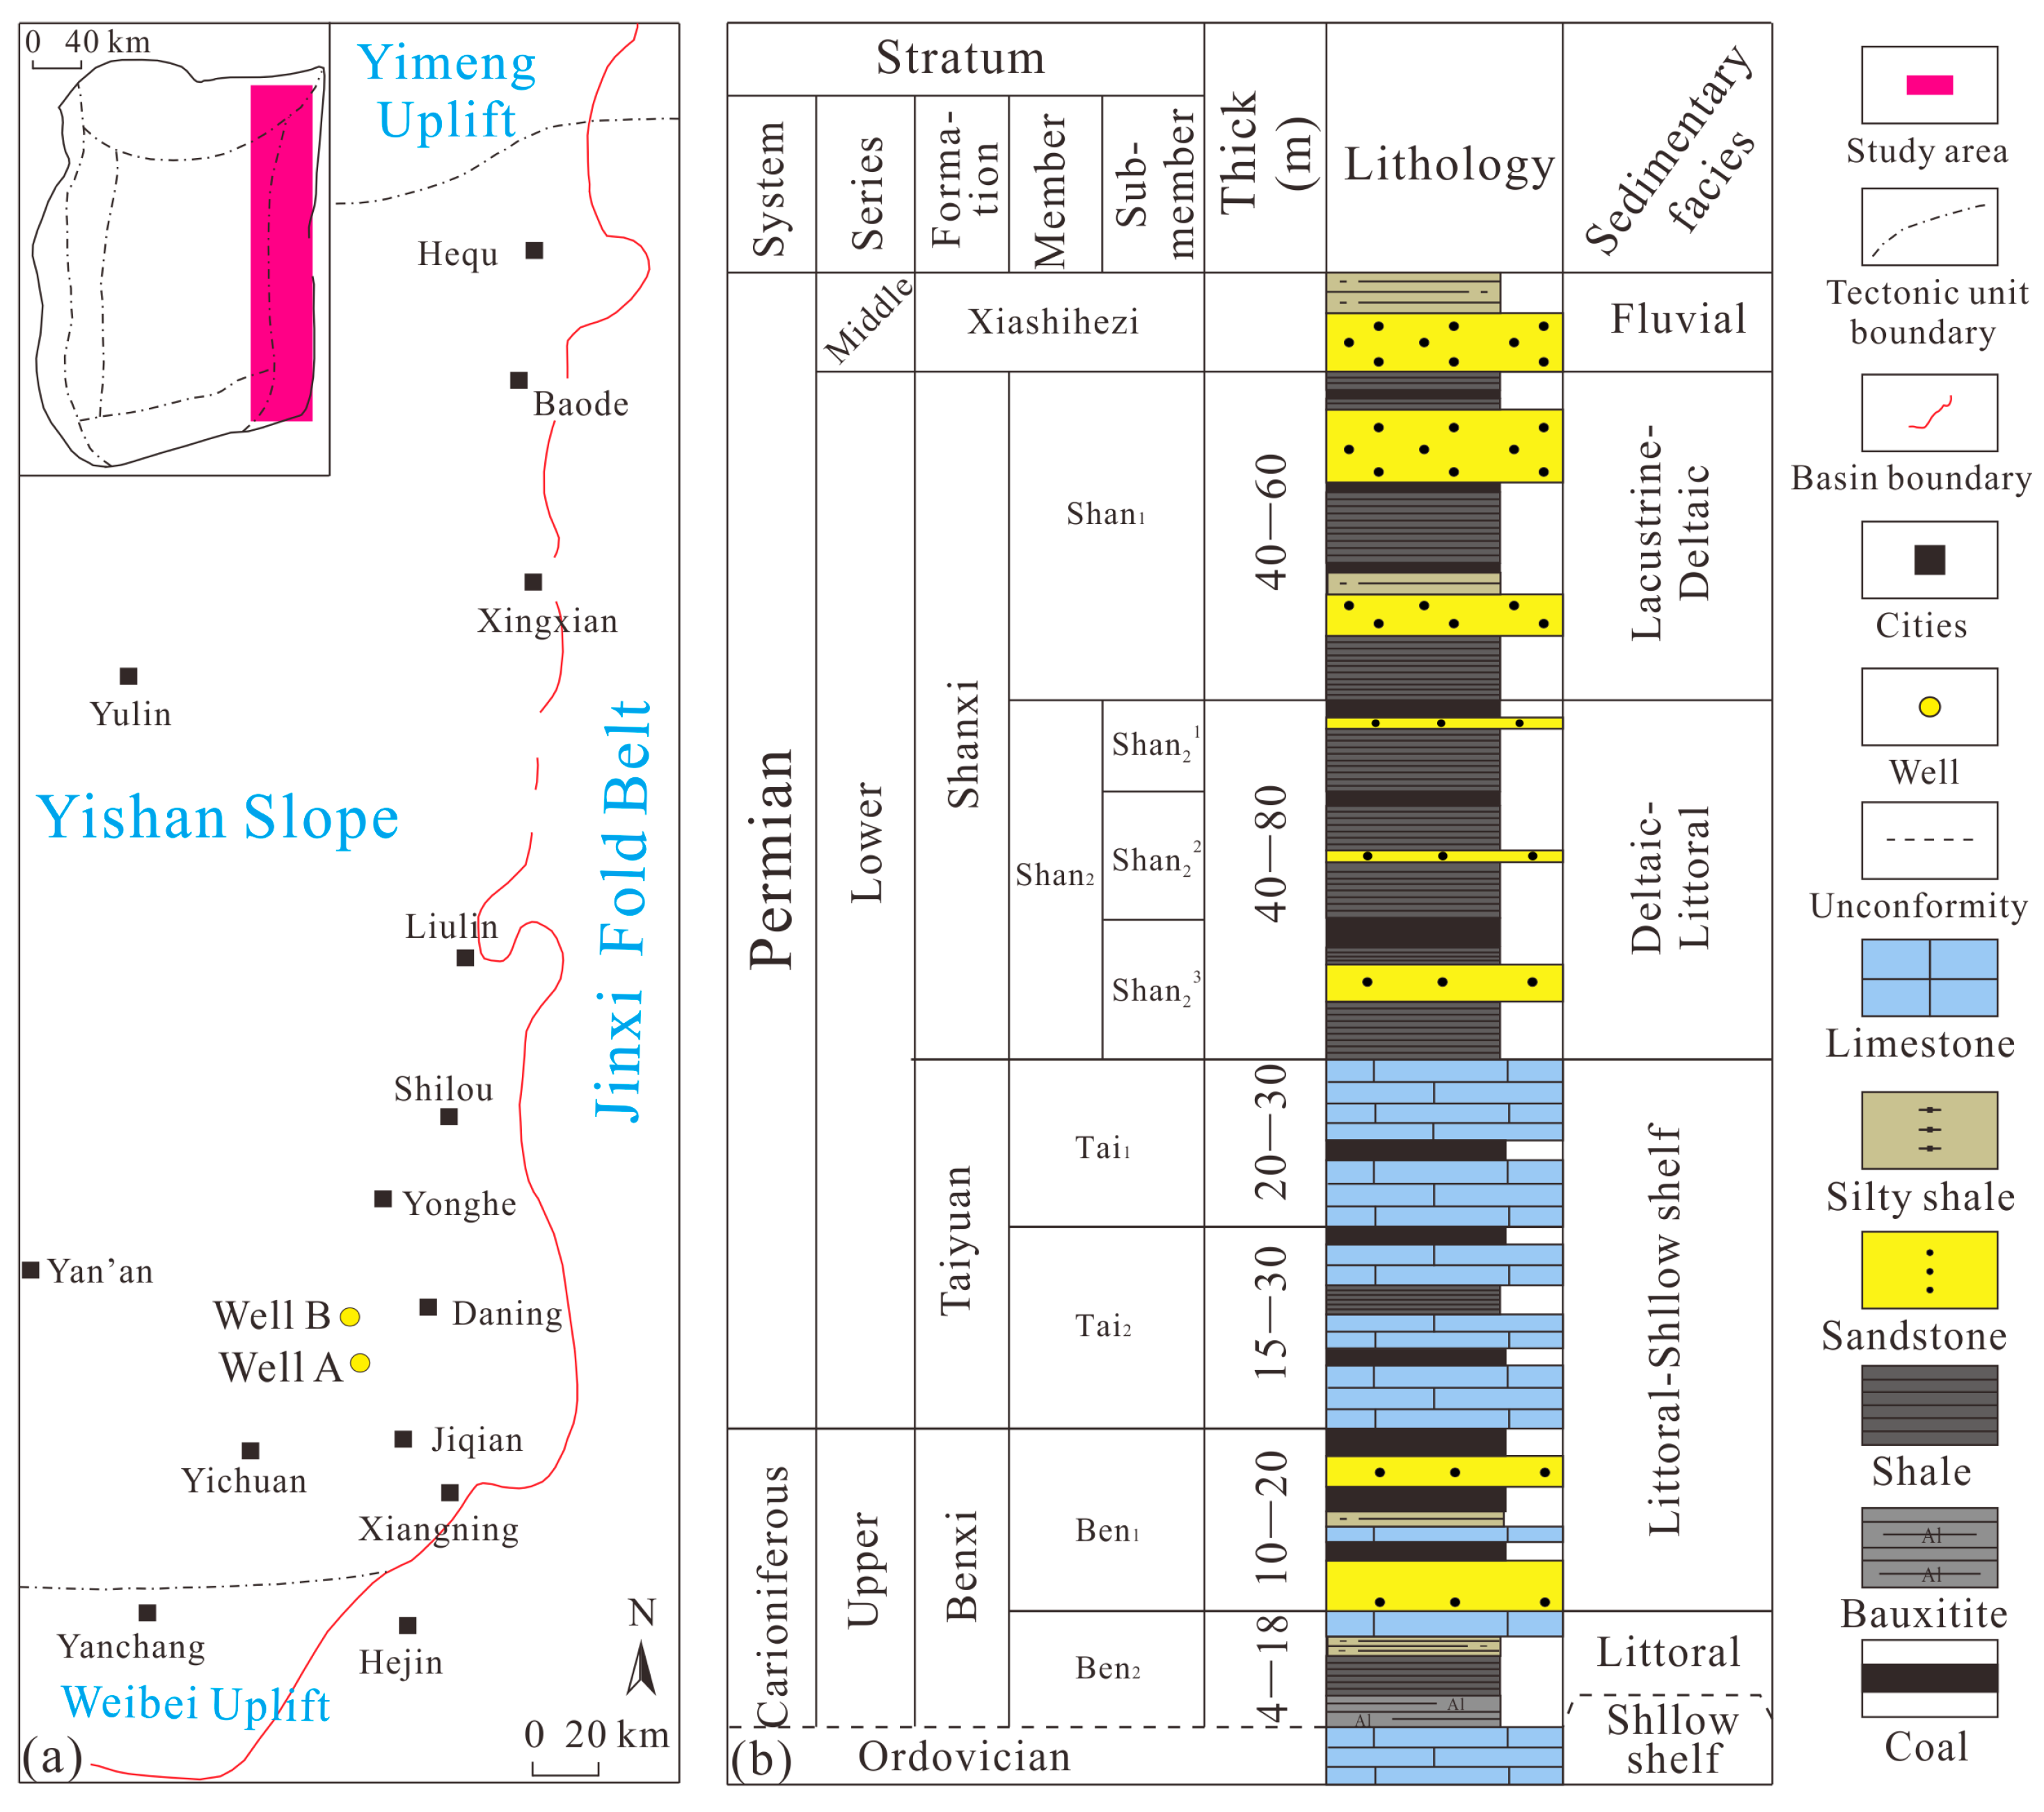
2. Geological Setting

The Ordos Basin is a typical cratonic basin in northern China (Figure 1a), consisting of six tectonic units [24]. The Ordovician-to-Early-Carboniferous depositional processes are absent in the Ordos Basin due to the effects of the Caledonian orogeny. During the Benxi-Formation-to-Taiyuan-Formation deposition, the Ordos Basin underwent continuous subsidence and experienced multiple marine transgressions. Under an epicontinental sea setting, thick coal-bearing transitional marine-continental strata were formed. Transitional strata are the primary targets for coalbed methane and shale gas exploration in the Ordos Basin [27]. During the deposition of the Shanxi Formation, seawater gradually receded from both the eastern and western sides of the Ordos Basin, transitioning from a marine to a terrestrial environment (Figure 1b). The Shanxi Formation is in conformable contact with both the underlying Taiyuan Formation and the overlying Lower Shihezi Formation. The upper lithology of the Taiyuan Formation consists of bioclastic limestone or microcrystalline limestone, which is indicative of an open platform environment in a shallow water continental shelf setting. The lower part of the Xiashihezi Formation primarily consists of medium sandstone, characteristic of a terrestrial braided river sedimentary system. This study focused on the transitional shale of the Permian Shanxi Formation [24].

3. Materials, Experiments and Theories

3.1. Sample

To thoroughly investigate the impact of thermal evolution on pore structure and its fractal characteristics, a low-maturity transitional shale from a field outcrop in the Eastern Ordos Basin was selected as the sample for this simulation experiment (Figure 1a). The low-maturity transitional shale belongs to the Shanxi Formation and was formed in a lagoonal environment. The initial sample has a vitrinite reflectance (Ro) of 0.78% and a total organic carbon (TOC) content of 2.87%.
In this study, a closed system was used for the thermal simulation experiments. The experimental equipment was the DK-II type strata–porosity–thermal press hydrocarbon simulation instrument, independently developed by the Wuxi Research Institute of Sinopec. Detailed experimental procedures and specific equipment parameters can be found in previous study reports [31]. This study involved seven sets of parallel experiments, with the specific experimental parameters provided in Table 1.

3.2. Experiments

After the thermal simulation experiments, seven solid products (S1–S7) were obtained. The seven solid products, along with the initial sample (So), underwent a series of tests, including TOC analysis, vitrinite reflectance (Ro), rock pyrolysis, gas adsorption (LTNA), and mercury intrusion porosimetry (MICP). TOC content was measured using the CS744-MHPC carbon–sulfur analyzer. Ro was determined using a vitrinite reflectance meter and a Zeiss ScopeA1 polarizing microscope. These experiments were conducted at the China Sichuan Keyuan Testing Center of Engineering Technology Co., Ltd. (Chengdu, China). The Rock-Eval pyrolysis instrument from Aitch company (Paris, France) was used to measure the free hydrocarbons (S1), kerogen cracking hydrocarbons (S2), and the temperature of maximum pyrolysis product yield (Tmax) of the initial samples. The calculation method for the Hydrogen Index (HI) followed the approach proposed by Espitalié [32]. Mineral composition analysis was conducted at the China Petroleum Exploration and Development Research Institute using a Rigaku X-ray diffractometer from Tokyo, Japan. The NMR T2 spectra were obtained using the NMRC12-010V low-temperature nanopore analyzer, manufactured by Numa in Suzhou, China. The plunger samples in dry, deionized water-saturated, dodecane-saturated, and Mn2+-saturated states were subjected to signal measurement. Detailed operational procedures and experimental theories can be found in Wang et al. (2022) [33]. Nitrogen adsorption (LTNA) experiments were carried out using the Autosorb-IQ3 fully automated surface area and pore distribution analyzer, produced by Contech (Goddard, KS, USA). Under a vacuum at 110 °C, the samples were degassed for 12 h before undergoing LTNA experiments. The density functional theory (DFT) model was used to calculate the micropore and meso/macropore surface areas, volumes, and pore size distributions. Mercury intrusion capillary pressure (MICP) tests were conducted using the AutoPore IV 9520 fully automated mercury intrusion instrument, produced by Contech (USA). This experiment was carried out at China University of Geosciences. Argon ion polishing and FE-SEM observations were performed at Southwest Petroleum University. Each shale sample was first cut into small cubes measuring 1 cm × 1 cm × 1 cm. Next, the argon ion polishing system was used to flatten and smooth the surfaces of the samples. After processing, the samples were examined using the FEI Quanta 650 FEG field emission scanning electron microscope (using SEM).

3.3. Fractal Dimension Calculation

3.3.1. Fractal Dimension Calculation Based on LTNA Data

Based on LTNA data, the modified FHH (Frenkel–Halsey–Hill) theory by Pfeifer [12] effectively characterizes the fractal features of pores in shale at different scales. There are two methods for calculating the fractal dimension using the FHH model. The first method is based on the van der Waals force mechanism. The second method is based on the capillary condensation mechanism [34]. The fractal dimension calculation method based on capillary condensation is more suitable for studying the heterogeneity of porous media. The specific calculation formula is as follows:
l n V = C + D 3 l n l n p 0 p
In this formula, V represents the volume of gas adsorbed at an absolute pressure P (unit: mL/g). p0 represents the saturation vapor pressure (unit: MPa). D represents the fractal dimension. C is a constant. During the calculation, a scatter plot is created with ln (lnp0/p) on the x-axis and lnV on the y-axis. The fitted slope is then converted into the desired value of D. Based on the FHH model, the calculated fractal dimension ranges from 2 to 3. A higher fractal dimension indicates a more complex and irregular pore system.
The double logarithmic curve typically exhibits a distinct inflection point. Using this inflection point as a boundary, the fractal dimensions for different adsorption stages can be calculated. Most researchers choose the point where the relative pressure (p/p0) is between 0.45 and 0.5 as the inflection point [6,17]. This paper adopts the same inflection point, dividing D into two ranges: D1 (p/p0 < 0.45) and D2 (p/p0 > 0.45).

3.3.2. Fractal Dimension Calculation Based on MICP Data

The fractal dimension derived from the capillary bundle model shows a stronger correlation with shale porosity and pore structure parameters. Therefore, the capillary bundle model is often used in single fractal studies of MICP pore size distributions [15,20]. The specific calculation formula is as follows:
log 1 S H g = D 3 × l o g P c D 3 × l o g P m i n
In the formula, SHg represents the proportion of mercury volume entering the pores (unit: %), which is equivalent to the pore volume fraction. p0 represents the capillary pressure (unit: MPa), which is equivalent to pore diameter. Therefore, the above formula is often converted into the following equation [35]:
l o g S = 3 D × l o g r + D 3 × l o g r m a x
In this formula, r represents the pore radius (unit: nm). rmax represents the maximum pore radius (unit: nm). s represents the cumulative pore volume fraction corresponding to the pore radius (r). D represents the fractal dimension of the porous medium. Therefore, the fractal dimension (D) can be calculated from the slope of the lg (dV/dp) vs. lgp curve.
To differentiate the fractal dimension calculated from LTNA data, the fractal dimension based on MICP data will be labeled as DM. Additionally, considering the lower accuracy of MICP in measuring small pores and taking into account the pore size range of the study subject [8,16,20], this paper focuses on fitting the fractal dimension of pores within the 50 nm to 1000 nm range.

4. Results

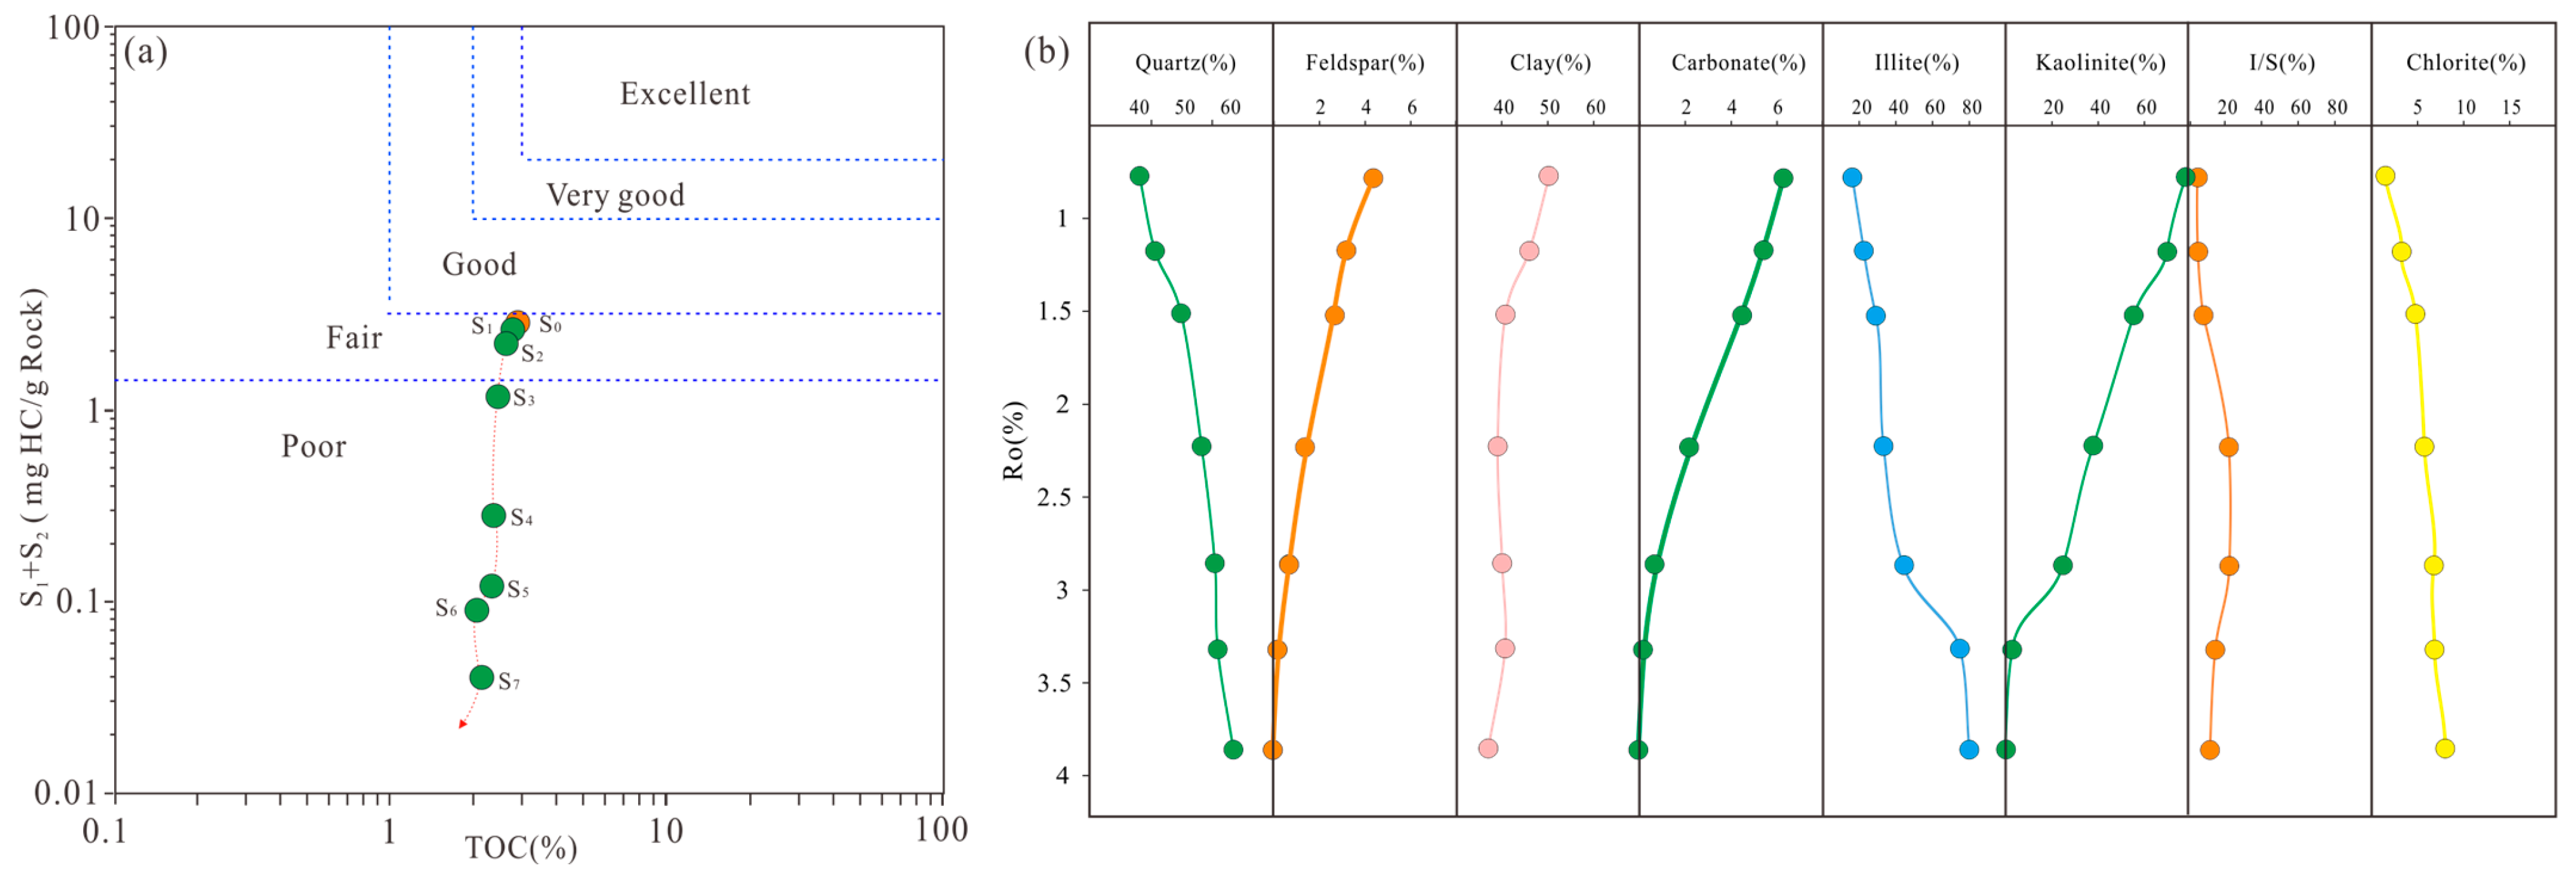
4.1. Mineralogy and Geochemical Characteristics of Shale

The geochemical parameters of the initial sample and the post-thermal simulation samples are shown in Table 2. The TOC values ranged from 2.07 to 2.87, with an average of 2.44 (Figure 2a). The cross-plot of TOC and (S1 + S2) confirms that the initial sample (S0) had moderate-to-good hydrocarbon generation potential [36].
Table 2 presents the mineral composition of the initial sample and the post-simulation samples. The initial sample was primarily composed of quartz (39.9%) and clay minerals (49.9%). The carbonate mineral content was low (6.3%), mainly consisting of siderite (4.7%) and dolomite (1.6%). The clay minerals in the initial sample were mainly kaolinite, with no smectite present. As thermal evolution increased, the quartz content gradually rose. The contents of clay minerals, carbonate minerals, pyrite, and feldspar all gradually decreased (Figure 2b). The illite content gradually increased while the kaolinite content decreased until it reached zero. The contents of I/S and chlorite both slightly decreased after reaching their peak values (Figure 2b).

4.2. Porosity and Pore Structure Characteristics

4.2.1. Porosity Characterization

Although the solid samples after simulation were crushed, the NMR signal intensity of the product of unit mass and TOC could be used to characterize porosity [37]. The NMR signal intensity after saturation with water is shown in Figure 3a. The NMR signal intensity showed a progressive change at different thermal evolution stages. As thermal evolution increased, porosity changes occurred in five stages: slow decrease (0.78 < Ro < 1.0%), rapid increase (1.0% < Ro < 2.0%), relative stability (2.0% < Ro < 2.7%), rapid increase (2.7% < Ro < 3.2%), and slow decrease (Ro > 3.2%). Using SEM and Image-J software (v1.8.0), the total pixel area of organic pores, organic-matter-related microcracks, inorganic pores, and microcracks within a 200 um × 200 um range was extracted. The proportions of different types of spaces were characterized (Figure 3b). The results indicate that the proportion of organic pores reaches its maximum early in the over-mature stage and then gradually decreases.

4.2.2. LTNA and MICP Curves

The mercury intrusion–extrusion curves for samples S0, S1, and S2 show no distinct inflection points, and the total mercury intrusion was low (Figure 4a). This suggests that these samples were relatively dense, primarily consisted of small pores, and had poor connectivity. For other samples, once the mercury intrusion pressure exceeded 10 MPa, the rate and volume of mercury intrusion significantly increased. This indicates that these samples had good connectivity and larger average pore diameters. The total mercury intrusion, inflection points, and rising rates differed significantly across samples, indicating variations in the pore size distribution and total pore volume [30,38].
The LTNA curves of the post-simulation samples exhibit inverted “S” shapes. However, the adsorption curve shapes differed significantly between samples of different maturity, suggesting that both diagenesis and hydrocarbon generation processes jointly control changes in the pore structure during evolution. The LTNA isotherm hysteresis loop shapes of the post-simulation samples are classified into two types according to IUPAC: H3 and H4 (Figure 4b). The H4 type corresponds to the S0 and S1 samples. A narrow hysteresis loop indicates that narrow fissure pores dominate in the shale, favoring the adsorption and accumulation of shale gas but hindering flow. The H3 type corresponds to the S3, S4, and S5 samples, with wider hysteresis loops than in S0 and S1. This indicates that slit pores dominated by layered structures prevail, resulting in poor pore connectivity, although the average pore diameter is relatively large [30,38,39].

4.2.3. Pore Size Distribution and Pore Structure Parameters

The pore volume (PV) and specific surface area (SSA) distributions of shale samples were derived from the integration of the MICP and LTNA curves. MICP was used to characterize the pore size distribution in the range of 50–1000 nm. LTNA was used to characterize the pore size distribution in the range of 1–50 nm. To minimize the effect of TOC on pore structure, the PV and SSA values of different samples were normalized based on their TOC values. The PV distribution ranged from 0.0027 to 0.0263 cm3/g (with an average of 0.0115 cm3/g), and the SSA distribution ranged from 1.097 to 5.309 m2/g (with an average of 2.718 m2/g). Figure 4c,d show that as the thermal evolution increased, both the PV of 10–100 nm pores and the SSA of 10–80 nm pores significantly increased.
To characterize changes in the PV and SSA across different pores, the pore size distribution was divided into six intervals: <5 nm, 5–20 nm, 20–60 nm, 60–120 nm, 120–500 nm, and 500–1000 nm. The PV and SSA distributions for different pore sizes are shown in Table 3. The PV and SSA of the initial samples were primarily contributed by pores smaller than 5 nm. As the simulation temperature increased, the PV and SSA of 5–20 nm and 20–60 nm pores gradually increased (Figure 5a,b).

4.3. SEM Image Analysis

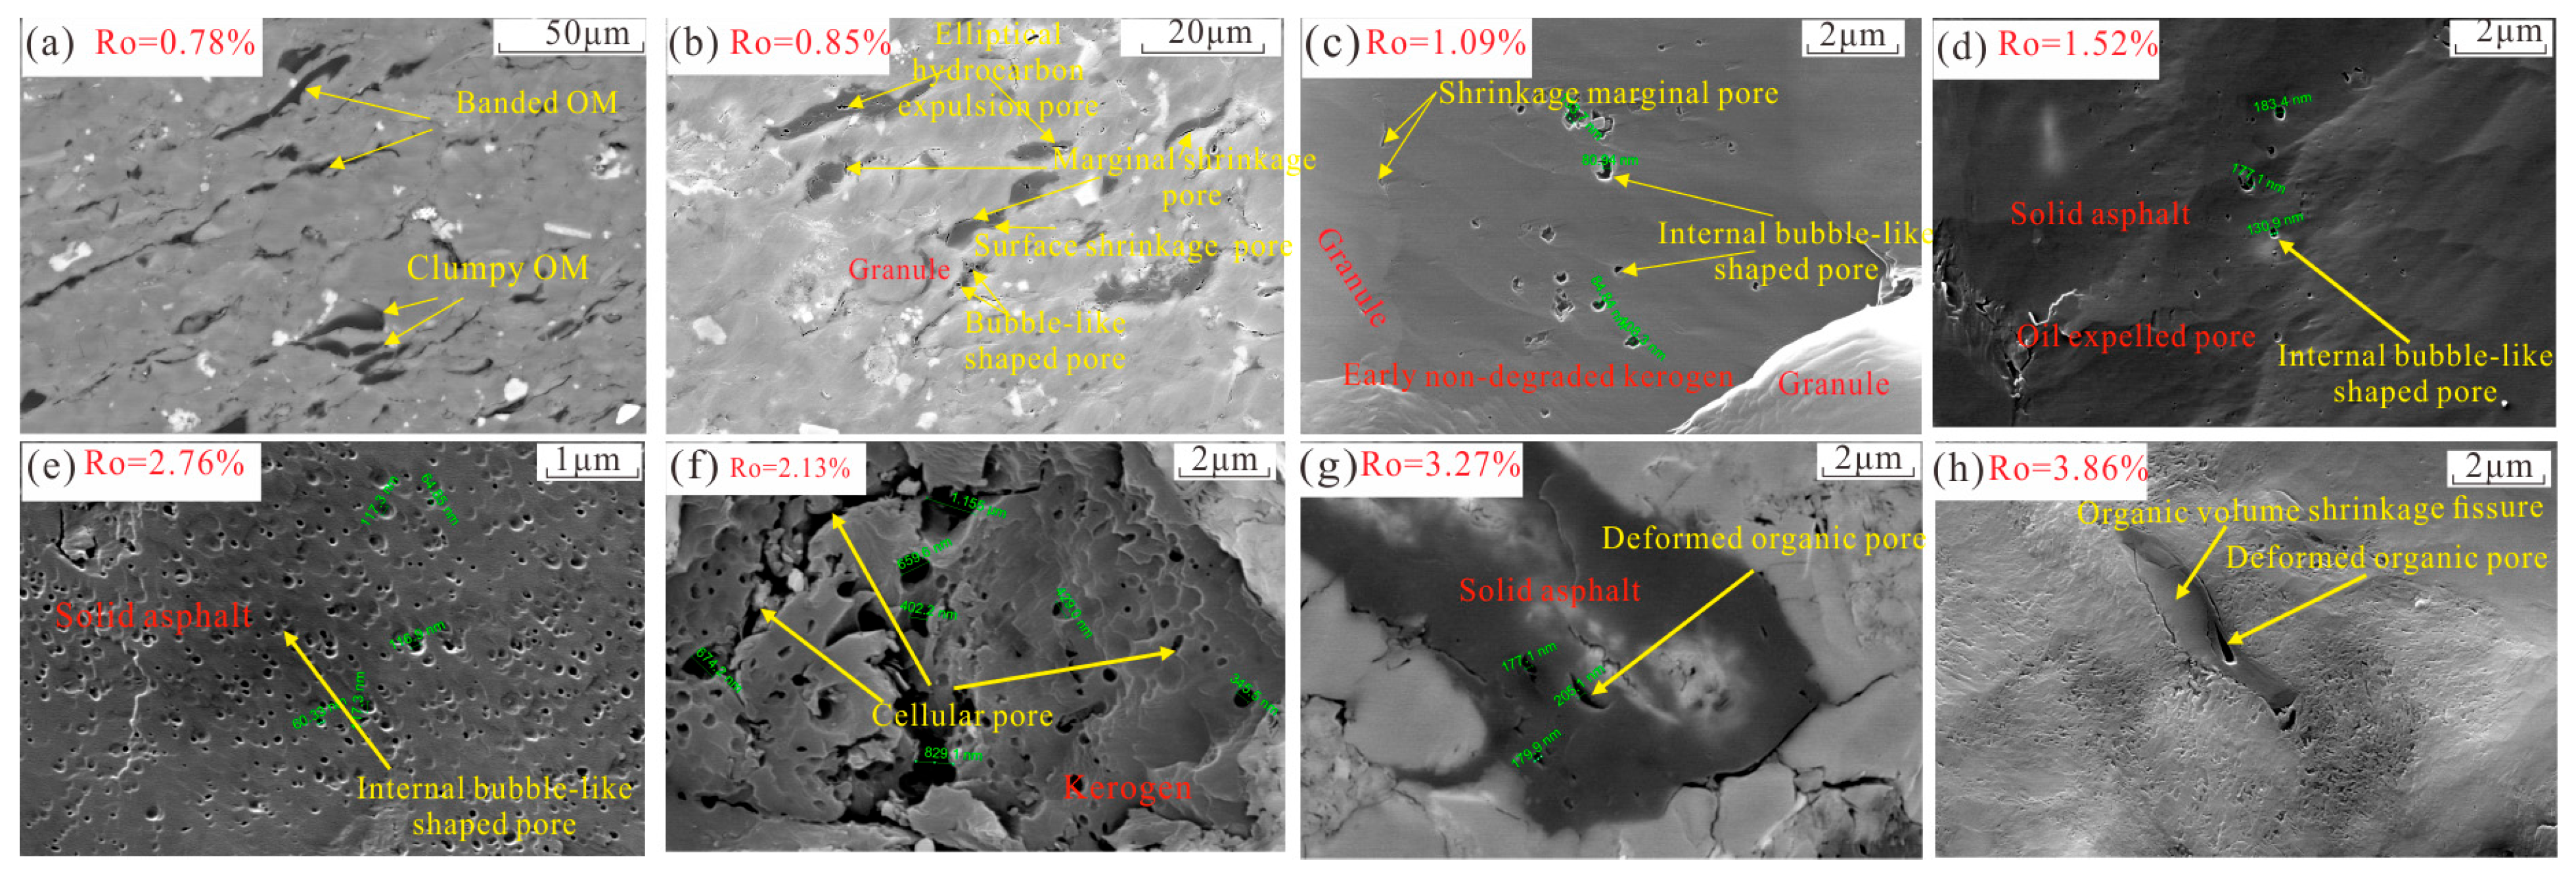
4.3.1. Organic Pores and Organic-Matter-Related Microfractures

The morphology and development of organic pores in transition shale vary significantly at different stages of thermal evolution, being influenced by the organic matter content, type, and thermal maturity [40,41]. At the low-maturity stage (Figure 6a), organic matter is distributed in striped and lumped forms within the shale. Organic pores on the surface of the organic matter are not observed. In the early maturity stage (Figure 6b), kerogen degradation produces oil, which causes the release of a small amount of retained oil from the kerogen surface, forming large elliptical organic pores. However, these organic pores are isolated from one another [42]. Additionally, after the degradation of the kerogen surface components, volume shrinkage occurs. Narrow microfractures form at the edges and within the kerogen (Figure 6b) [41,43]. In the late-maturity stage (Figure 6c), retained hydrocarbons on the kerogen surface are released, forming a large number of small organic pores [44]. In the early high-maturity stage (Figure 6d), retained hydrocarbons and kerogen, filled in inorganic pores, continue to undergo cracking. On one hand, the inorganic pores that were filled earlier are released [44,45], while organic pores ranging from 50 to 200 nm form within the solid bitumen [41,42]. In the late high-maturity stage (Figure 6e), the sizes of the organic pores continue to increase, reaching 100–400 nm. These organic pores form a honeycomb-like internal structure. Microfractures smaller than 80 nm in width form at the edges of the organic matter [46]. In the over-mature stage (Figure 6f), retained hydrocarbons are gradually consumed [42]. Organic pores cease to form after a vitrinite reflectance (Ro) of 2.7%. Organic pores formed in the early stages are protected and supported by the adsorption of retained oil and wet gas. As a result, organic pores formed in the early stages are not significantly affected by strong compaction. In contrast, after Ro reaches 3.2% (Figure 6g), wet gas and retained oil have been fully converted into methane. Intense compaction causes circular organic pores and organic-matter-related microfractures to be squeezed and reduced in size [45,46].

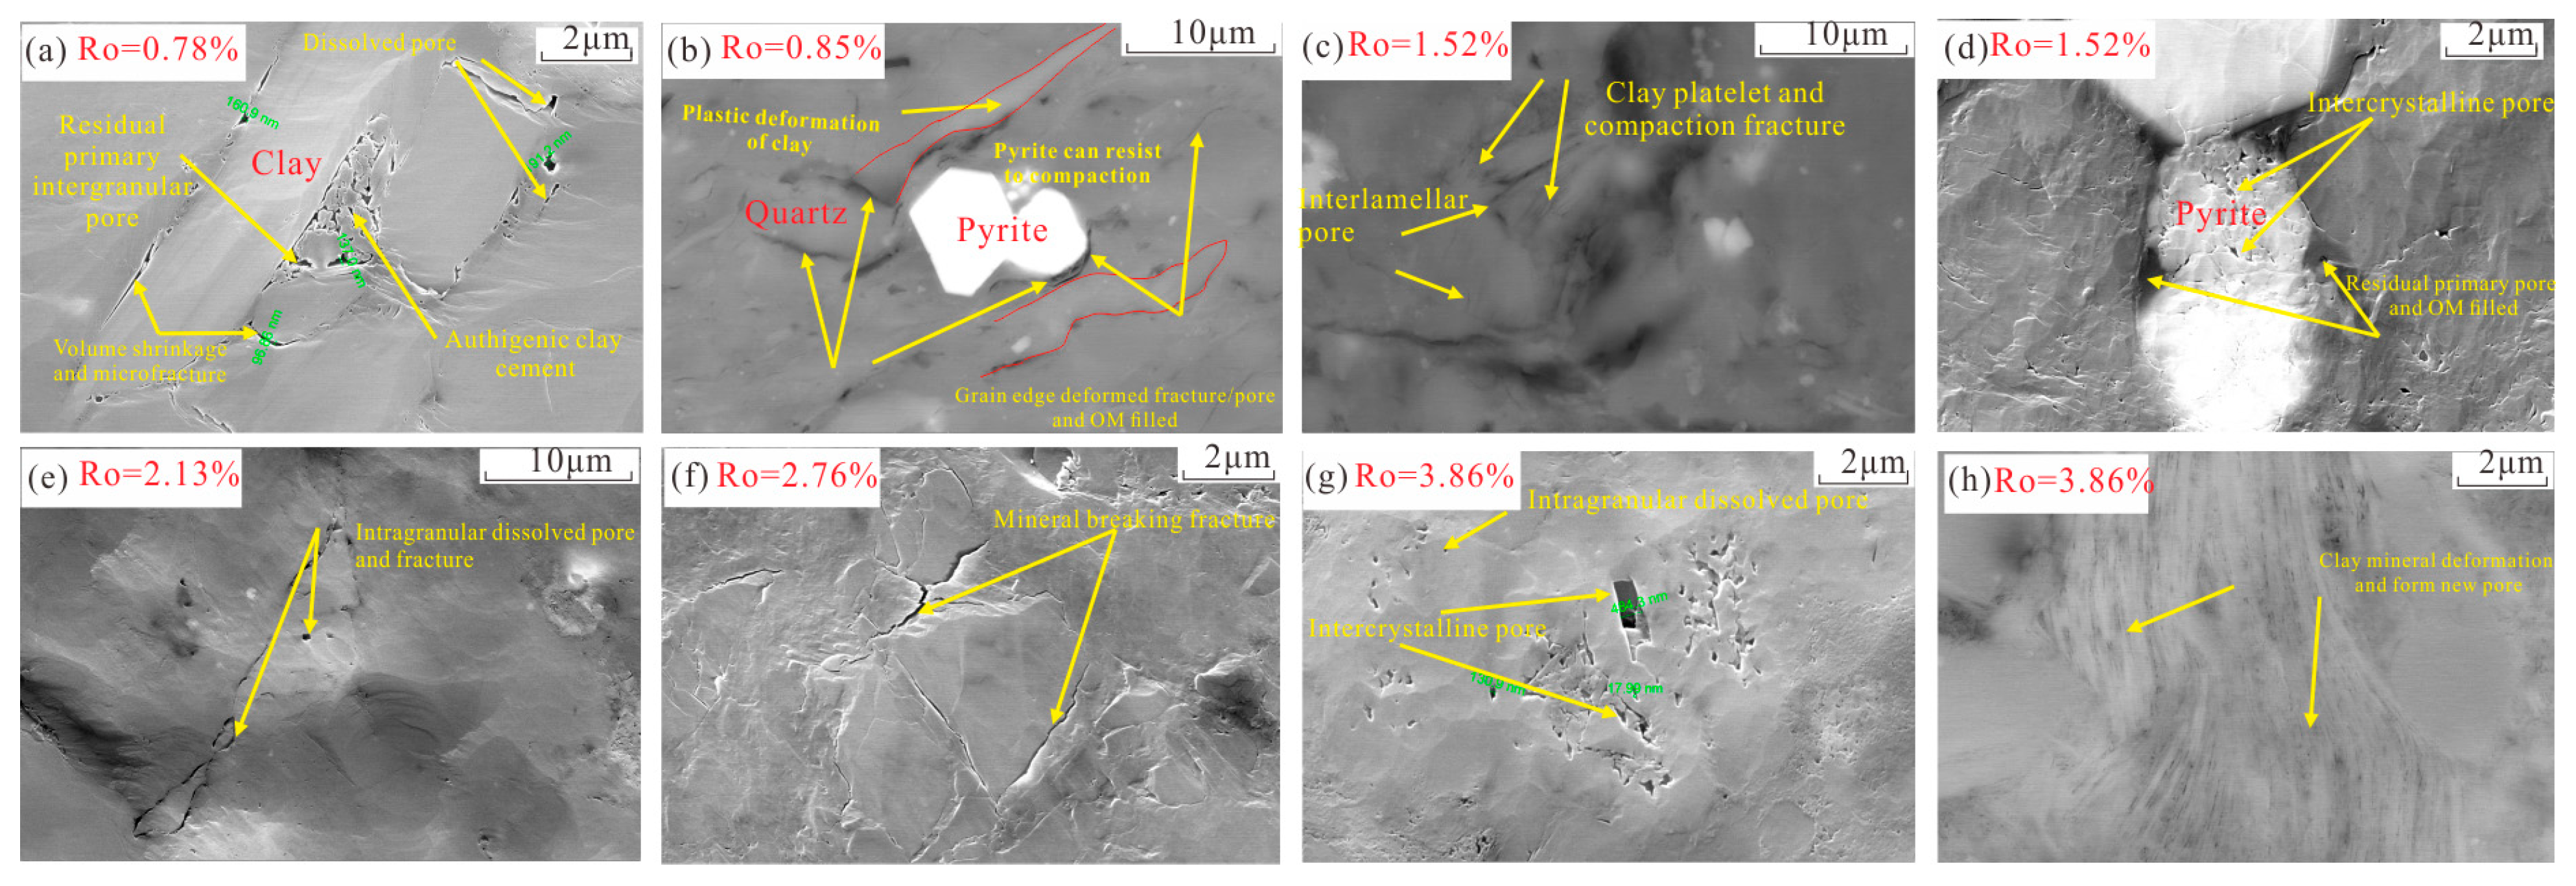
4.3.2. Inorganic Pores and Microfractures

From the low-maturity to the early maturity stages, compaction significantly impacts pore development, leading to the close packing of grains (or particles). The number of residual primary intergranular pores rapidly decreases [41] (Figure 7a). Compaction is mainly reflected in the deformation of inorganic minerals and the formation of microfractures within them (Figure 7b,c,h). Additionally, intense compaction causes the deformation of organic matter, organic pores, and organic-matter-related microfractures (Figure 6h). In the mature-to-high-maturity stages, after kerogen is cracked, it releases a large quantity of organic acids, which leads to the dissolution of minerals such as feldspar, carbonate minerals, and pyrite. A large number of intraparticle and intergranular dissolution pores are formed (Figure 7d,e). In the over-mature stage, the pH of the diagenetic environment increases significantly, and early-formed quartz is also dissolved, forming narrow-shaped pores. However, these pores are limited in size and number [47] (Figure 7f). Replacement processes are primarily seen in the mutual transformation of clay minerals, accompanied by the formation of many secondary pores. The transformation of clay minerals occurs at various thermal evolution stages. Under relatively acidic conditions during the low-to-high-maturity stages, feldspar transforms into kaolinite and montmorillonite (I/S) and kaolinite transform into illite (Figure 7a). During the transformation, siliceous cement is precipitated [48]. In the over-mature stage, under relatively alkaline and high-temperature conditions, kaolinite is largely transformed into illite, I/S, and chlorite (Figure 7f,g). Additionally, during the transformation of clay minerals, a widespread contraction of mineral volume occurs, and microfractures form at the mineral edges (Figure 7a,g) [38,48].

4.4. Multifractal Characteristics

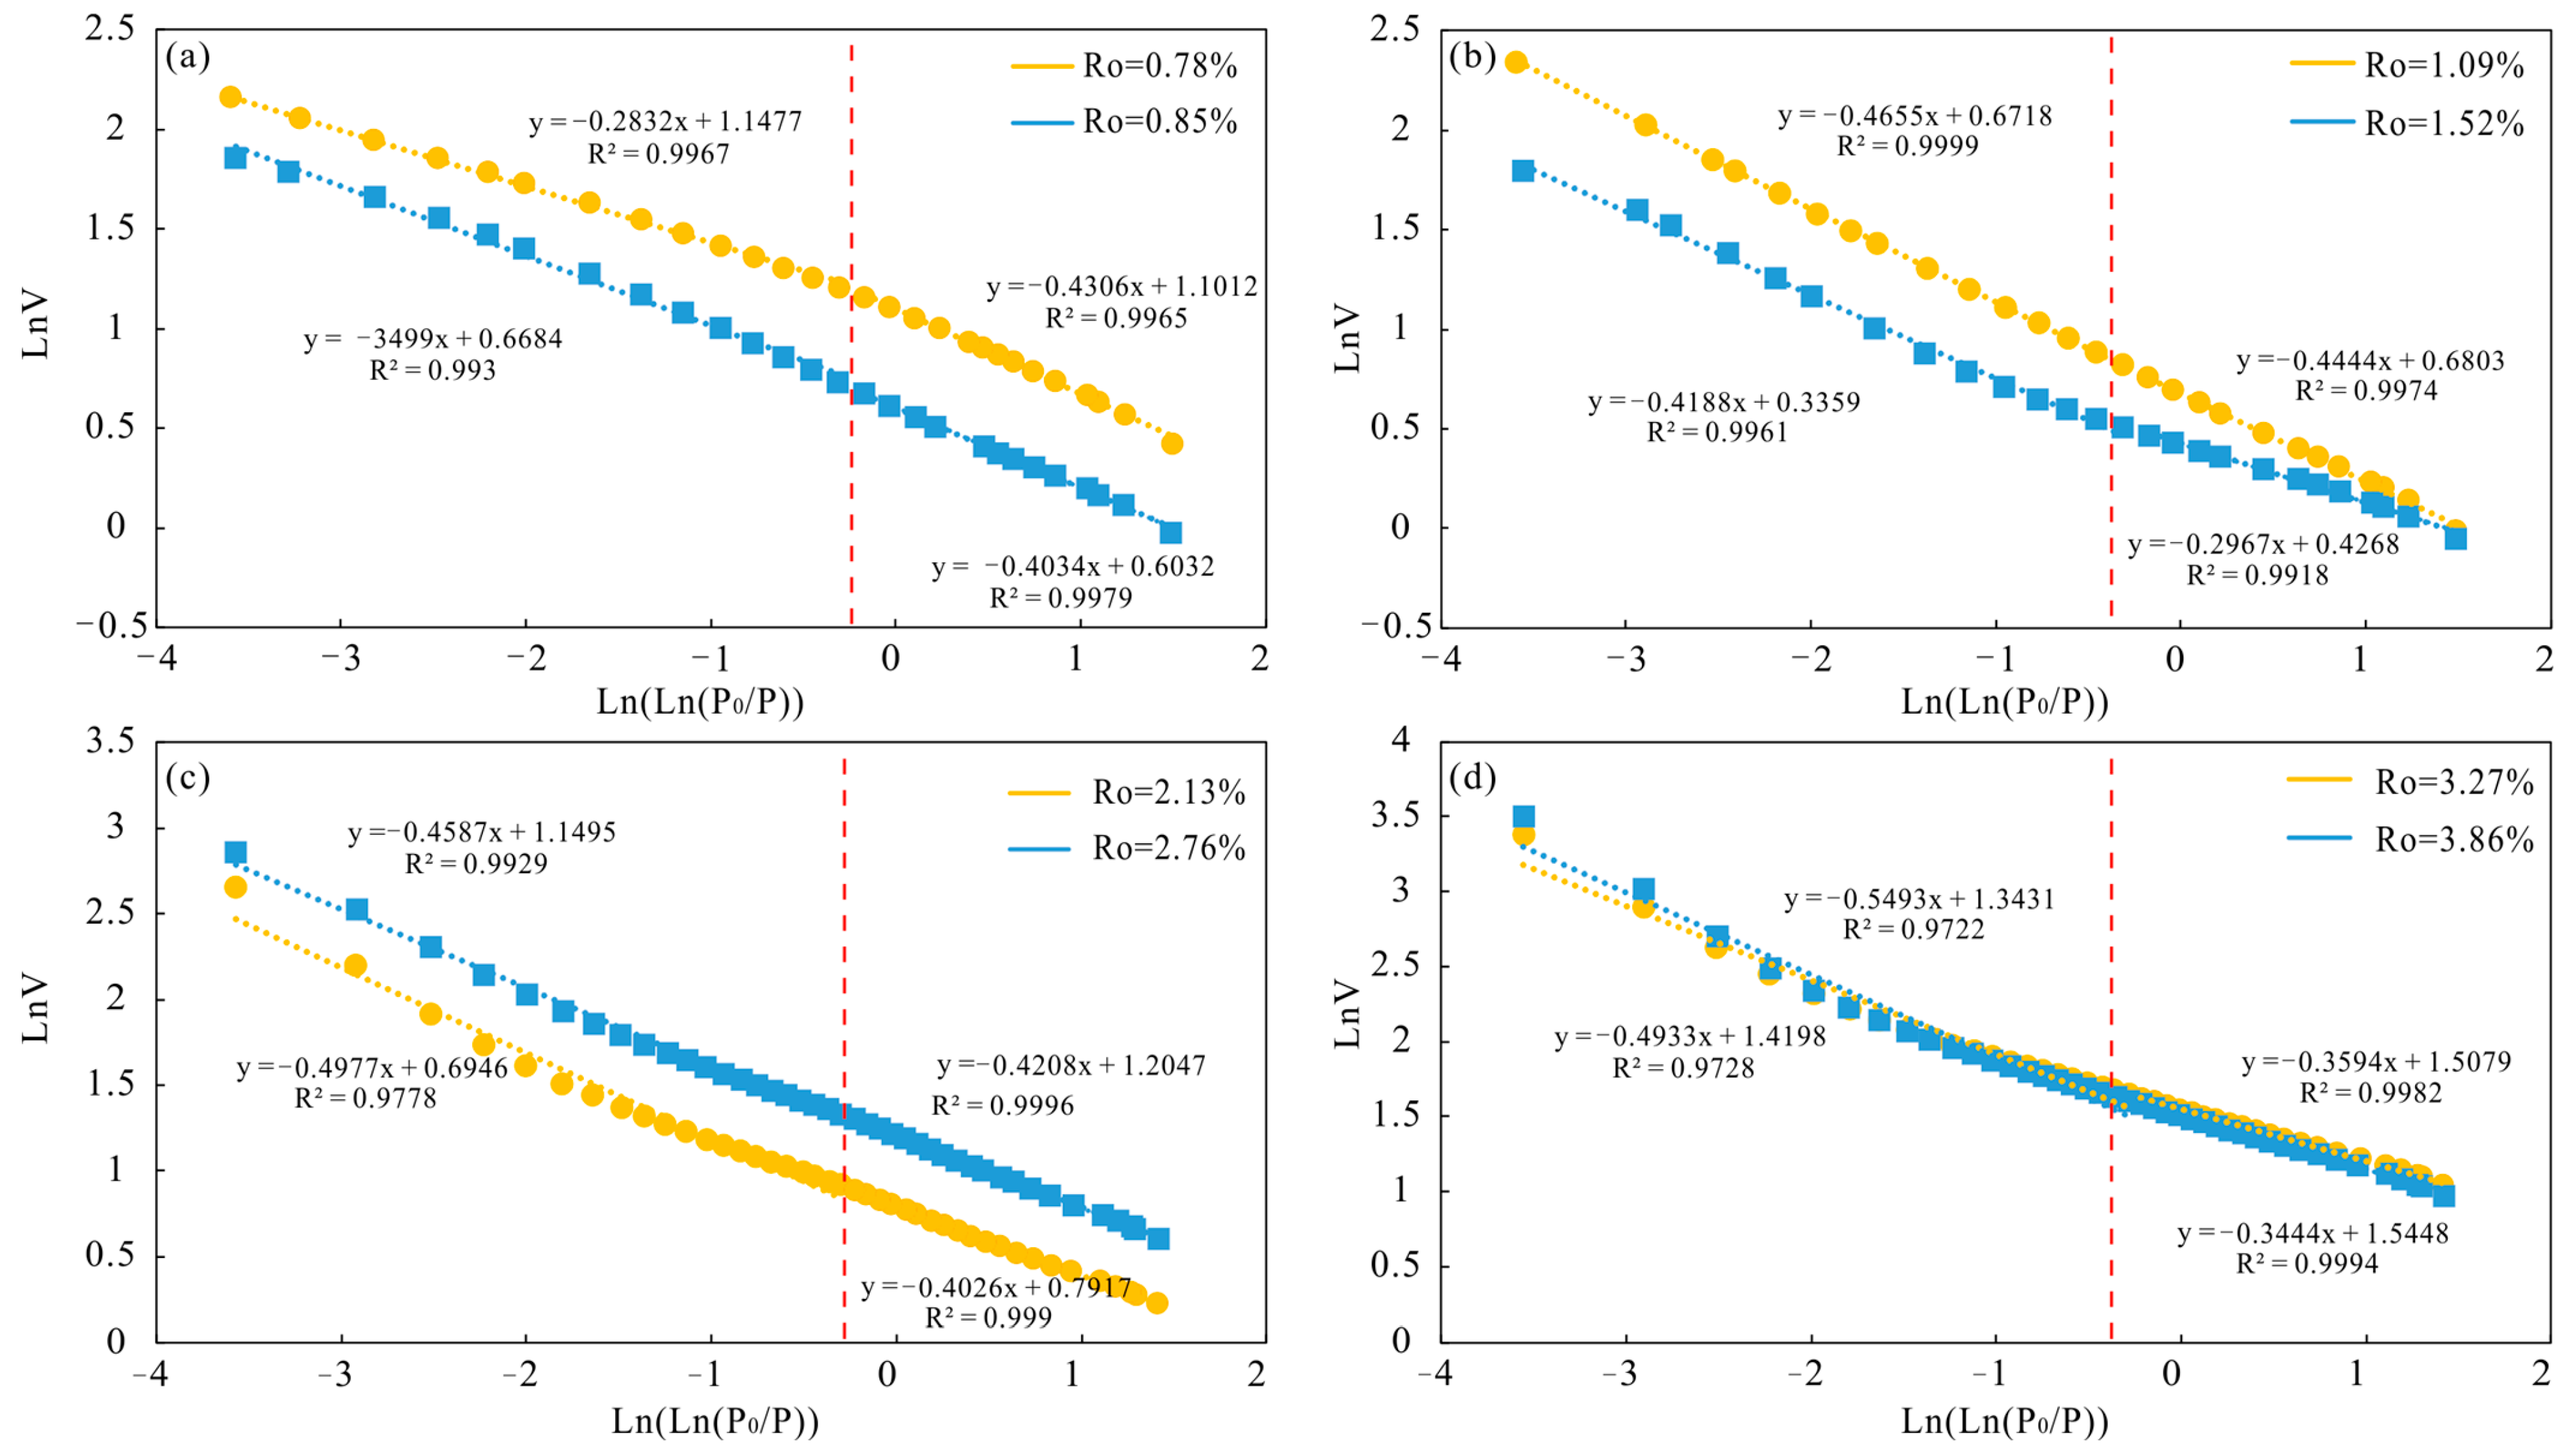
4.4.1. Fractal Dimension Based on LTNA

The FHH fractal analysis showed that the adsorption volume of the shale samples had a logarithmic relationship with relative pressure. Two distinct adsorption behaviors were observed within the pressure ranges of P/Po = 0.01–0.45 and 0.45–0.98, indicating the dual fractal nature of the shale pore system, the slope of curves (a)–(d) in Figure 8 changes when passing through the same position, which proves this point. D1 represents the fractal dimension in the low-pressure region (P/Po < 0.45), which corresponds to monolayer and multilayer adsorption and filling in micropores [16]. It is used to describe the irregularity, roughness, and complexity of the pore surface [17,20]. D2 denotes the fractal dimension in the high-pressure range (P/Po > 0.45). As pressure increases, capillary condensation occurs within the pores. Thus, D2 reflects the complexity and heterogeneity of the pore volume and structure.
The results show that D1 values for all shale samples ranged from 2.56 to 2.70, with an average of 2.61 (Table 4). D2 values ranged from 2.45 to 2.72, with an average of 2.56. The correlation coefficients for both D1 and D2 models exceeded 0.97, indicating a strong fractal behavior in the pore structures across all samples. The higher average value of D1 compared to D2 suggests that, across different maturity levels, the pore surface was more irregular and complex than the internal pore structure.

4.4.2. Fractal Dimension Based on MICP

MICP is primarily used to characterize macropores (pore diameter > 50 nm). The fitting results from the MICP model indicate that the pore diameter of shale samples follows a logarithmic relationship with cumulative pore volume. Two distinct adsorption behaviors are observed when the pore diameter (r) ranges from 40 to 80 nm and 80 to 1000 nm. This phenomenon demonstrates that the shale samples possess dual fractal characteristics in their pore structures, similarly the slope of curves (a)–(d) in Figure 9 changes when passing through the same position, which proves this point. DM1 represents the fractal dimension in the small pore diameter range (r < 80 nm) while DM2 represents the fractal dimension in the large pore diameter range (r > 80 nm). The method for calculating DM is based on the approach proposed by Li et al. (2017) [20]. In this study, the DM values ranged widely, from 2.47 to 2.94, with an average of 2.84. The average DM value was higher than both D1 and D2, indicating that the larger pores had a more complex pore structure. The fractal dimension of sample S5 was the smallest while S0 and S2 exhibited higher fractal dimensions.

5. Discussion

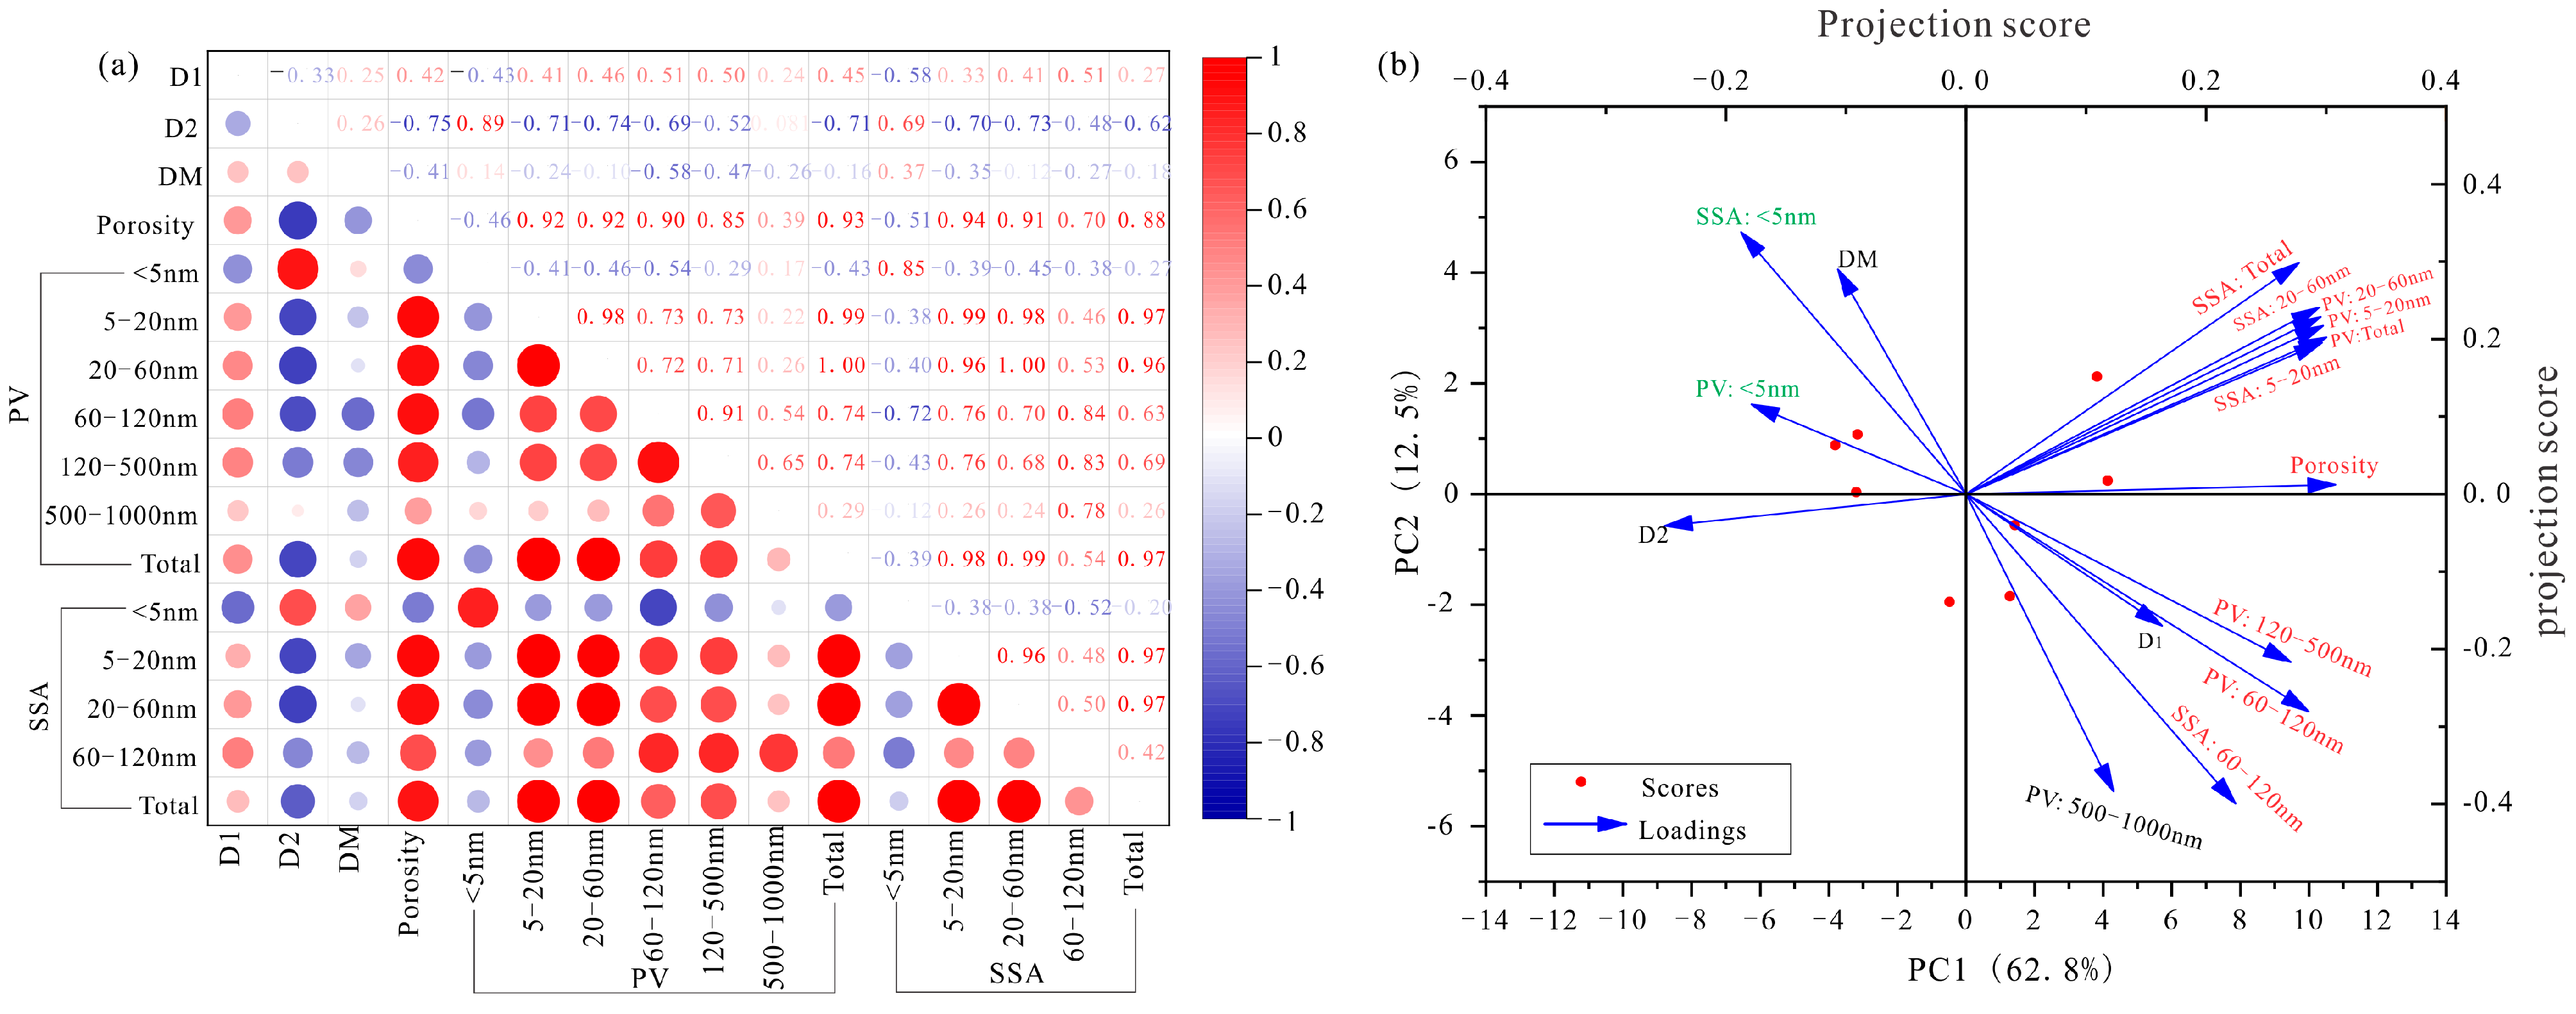
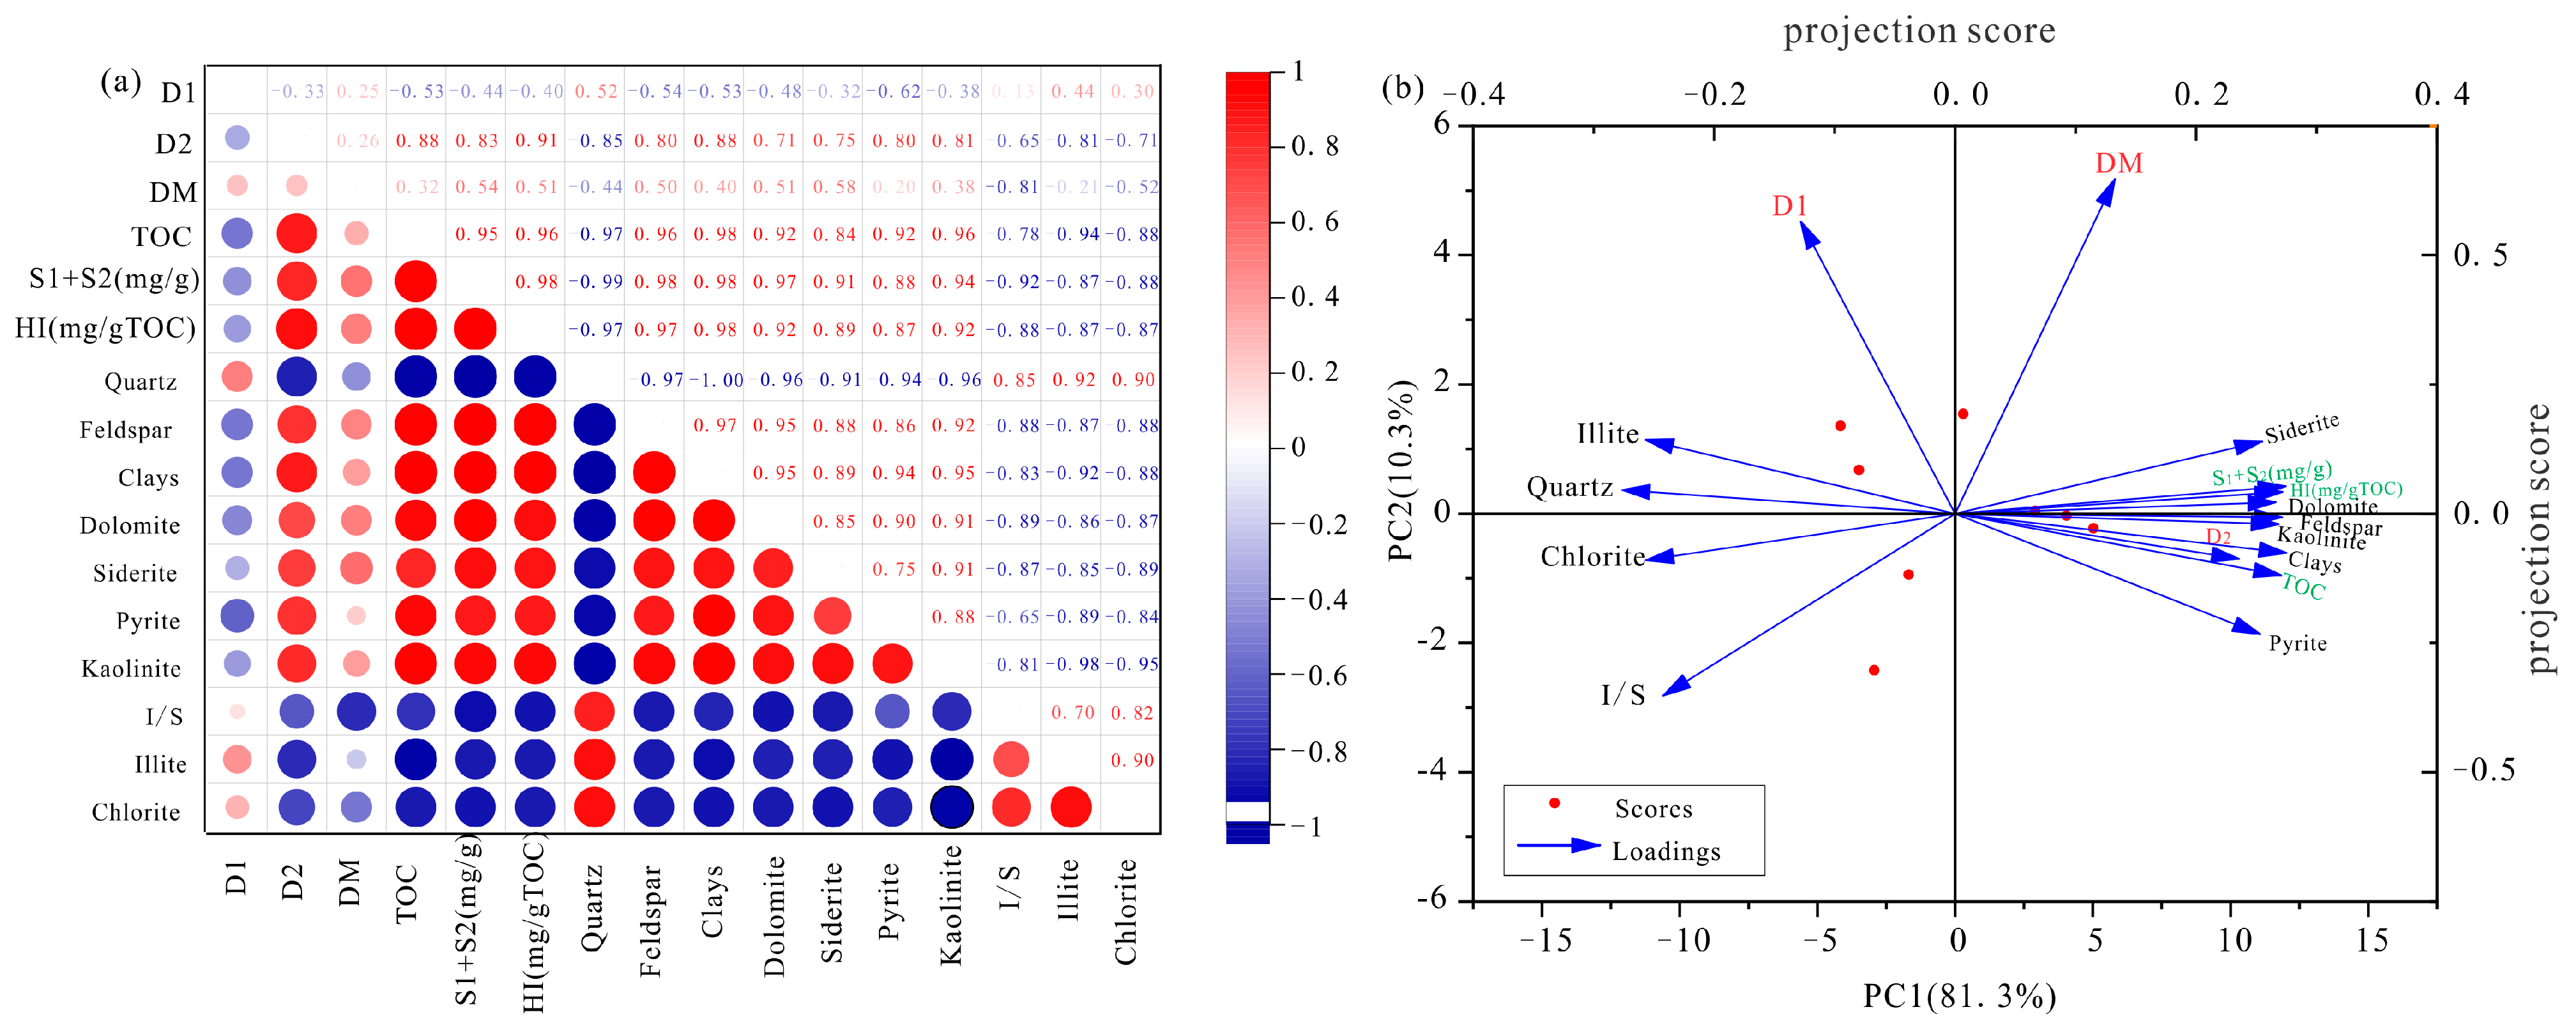
5.1. Relationship Between Fractal Dimension and Porosity and Pore Structure

Porosity and pore structure differences are key indicators of reservoir heterogeneity. There are variations in the relationships between the SSA, PV, and fractal dimensions across shale samples of different maturities (Figure 10a). This article has explored the influence of fractal dimensions D1 and D2 as representative parameters of the pore surface and pore internal complexity, porosity, or thermal evolution degree on the complexity of shale internal pores. A weak negative correlation was observed between D1 and D2 for all samples, indicating an inverse relationship between the complexity and irregularity of pore surfaces and pore spaces across different thermal evolution stages. Except for pores smaller than 5 nm, porosity showed a positive correlation with the SSA and PV. Porosity was positively correlated with D1 and negatively correlated with D2, suggesting that higher porosity was associated with greater roughness and complexity in the pore surface. This was accompanied by a decrease in the complexity of the internal pore space and an increase in pore development. Additionally, a positive correlation was found between the PV and SA for all pores, indicating consistent trends in the variation of PV and SSA. However, the PV and SSA values for pores smaller than 5 nm were negatively correlated with those for pores larger than 5 nm. This indicates that the development of pores smaller than 5 nm decreases with increasing maturity (Figure 5).
There was a positive correlation between the pore volume (PV) and specific surface area (SSA) of >5 nm pores and total pores with D1, particularly for pores in the 20–500 nm range. However, D2 showed a positive correlation only with the PV and SSA of <5 nm pores. The PV and SSA of <5 nm pores were negatively correlated with D1 while they showed a positive correlation with D2. In the mature-to-highly-mature stage, the proportion of <5 nm pores was high (Figure 5). The retained hydrocarbons released from the kerogen during pyrolysis acted to fill the pores. Additionally, compaction led to a reduction in pore size and a decrease in the number of pores, particularly for <5 nm pores (Figure 6 and Figure 7). These factors resulted in a decrease in surface roughness and complexity for <5 nm pores. The number of <5 nm pores was also reduced. However, the spatial distribution of <5 nm pores was more complex. As thermal evolution progressed, the number of >5 nm pores increased, especially for pores in the 20–60 nm range. This also resulted in an increase in surface roughness and complexity for >5 nm pores. The spatial distribution complexity of >5 nm pores decreased. The strong correlation between the 20–60 nm pores and D1 and D2 further supports this view (Figure 10a). Notably, DM showed a weak positive correlation only with D1, D2, and the SSA of >5 nm pores (Figure 10a).
Principal component analysis (PCA) was used to explore the relationship between porosity, pore structure, and fractal parameters (D1, D2, DM) with the methodology outlined in [49]. The loadings were determined based on the projection lengths of the arrows on the principal components (PCs). This indicated the relationship between the original variables and the principal components, describing the extent of each variable’s influence on the components. The relationship between the original variables was determined through the angle between the arrows or the projection lengths of the arrows on the principal components [49,50]. PC1 explained 62.8% of the variance while PC2 explained only 12.5%, indicating that PC1 represented the most significant features of the sample (Figure 10b). The porosity, along with the PV and SSA values of >5 nm pores (variables in red), had long and closely related projection lengths on the PC1 axis, suggesting that these variables represented the majority of the features in PC1. Therefore, PC1 could be defined as the degree of pore development. D1 had a positive projection on PC1, but its projection length was small. This suggests that D1 (roughness and irregularity of pore surfaces) had a general positive correlation with pore development. In contrast, D2 and DM had negative projections on PC1, with D2 having a larger projection length. This indicates a stronger negative correlation between D2 (complexity of pore space) and pore development. However, the projection length of DM was smaller, indicating its limited ability to characterize pore development.

5.2. Controlling Factors of Fractal Dimension

During the thermal evolution of shale, both organic matter evolution and the diagenetic transformation of inorganic minerals alter the pore structure [38,40], thereby affecting the fractal dimension. Both D2 and DM showed positive correlations with geochemical parameters and the mineral content (Figure 11a). However, D2 had a higher correlation coefficient, suggesting it was more suitable for explaining the impact of organic–inorganic diagenesis on pore structure. In contrast, D1 showed a weak negative correlation with geochemical parameters and mineral content. There was a highly significant correlation between geochemical parameters and the mineral content, which could be attributed to their complementary changes during pore structure evolution (Figure 11a).
The PCA method was also used to explore the relationship between geochemical parameters, mineral composition, and fractal dimensions. The variance explained by PC1 was 81.3% while PC2 accounted for only 10.3% (Figure 11b), indicating that PC1 represented the most significant features of the samples. Figure 11b shows that both mineral composition (black text) and geochemical parameters (green text) had long projections along the PC1 axis, indicating that these variables accounted for most of the characteristics of PC1. Additionally, variables on the right half of the PC1 axis corresponded to the “depleted” components, which gradually decreased in content during pore structure evolution. The variables on the left half of the PC1 axis represented the “generated” components (Figure 2). D2 had a large projection on the right half of the PC1 axis and a very small angle with the “depleted” component variables. Therefore, the positive direction of PC1 could be defined as the consumption of unstable components during pore structure evolution or as an increase in the complexity and irregularity of the pore structure. Similarly, the negative direction of PC1 could represent the generated components (including illite, quartz, etc.) during pore structure evolution, indicating a decrease in the complexity and irregularity of the pore structure. However, D1 and DM had much larger projections on the PC2 axis (Figure 11b), suggesting that they were less effective in indicating the impacts of mineral composition and geochemical parameters on fractal dimensions.

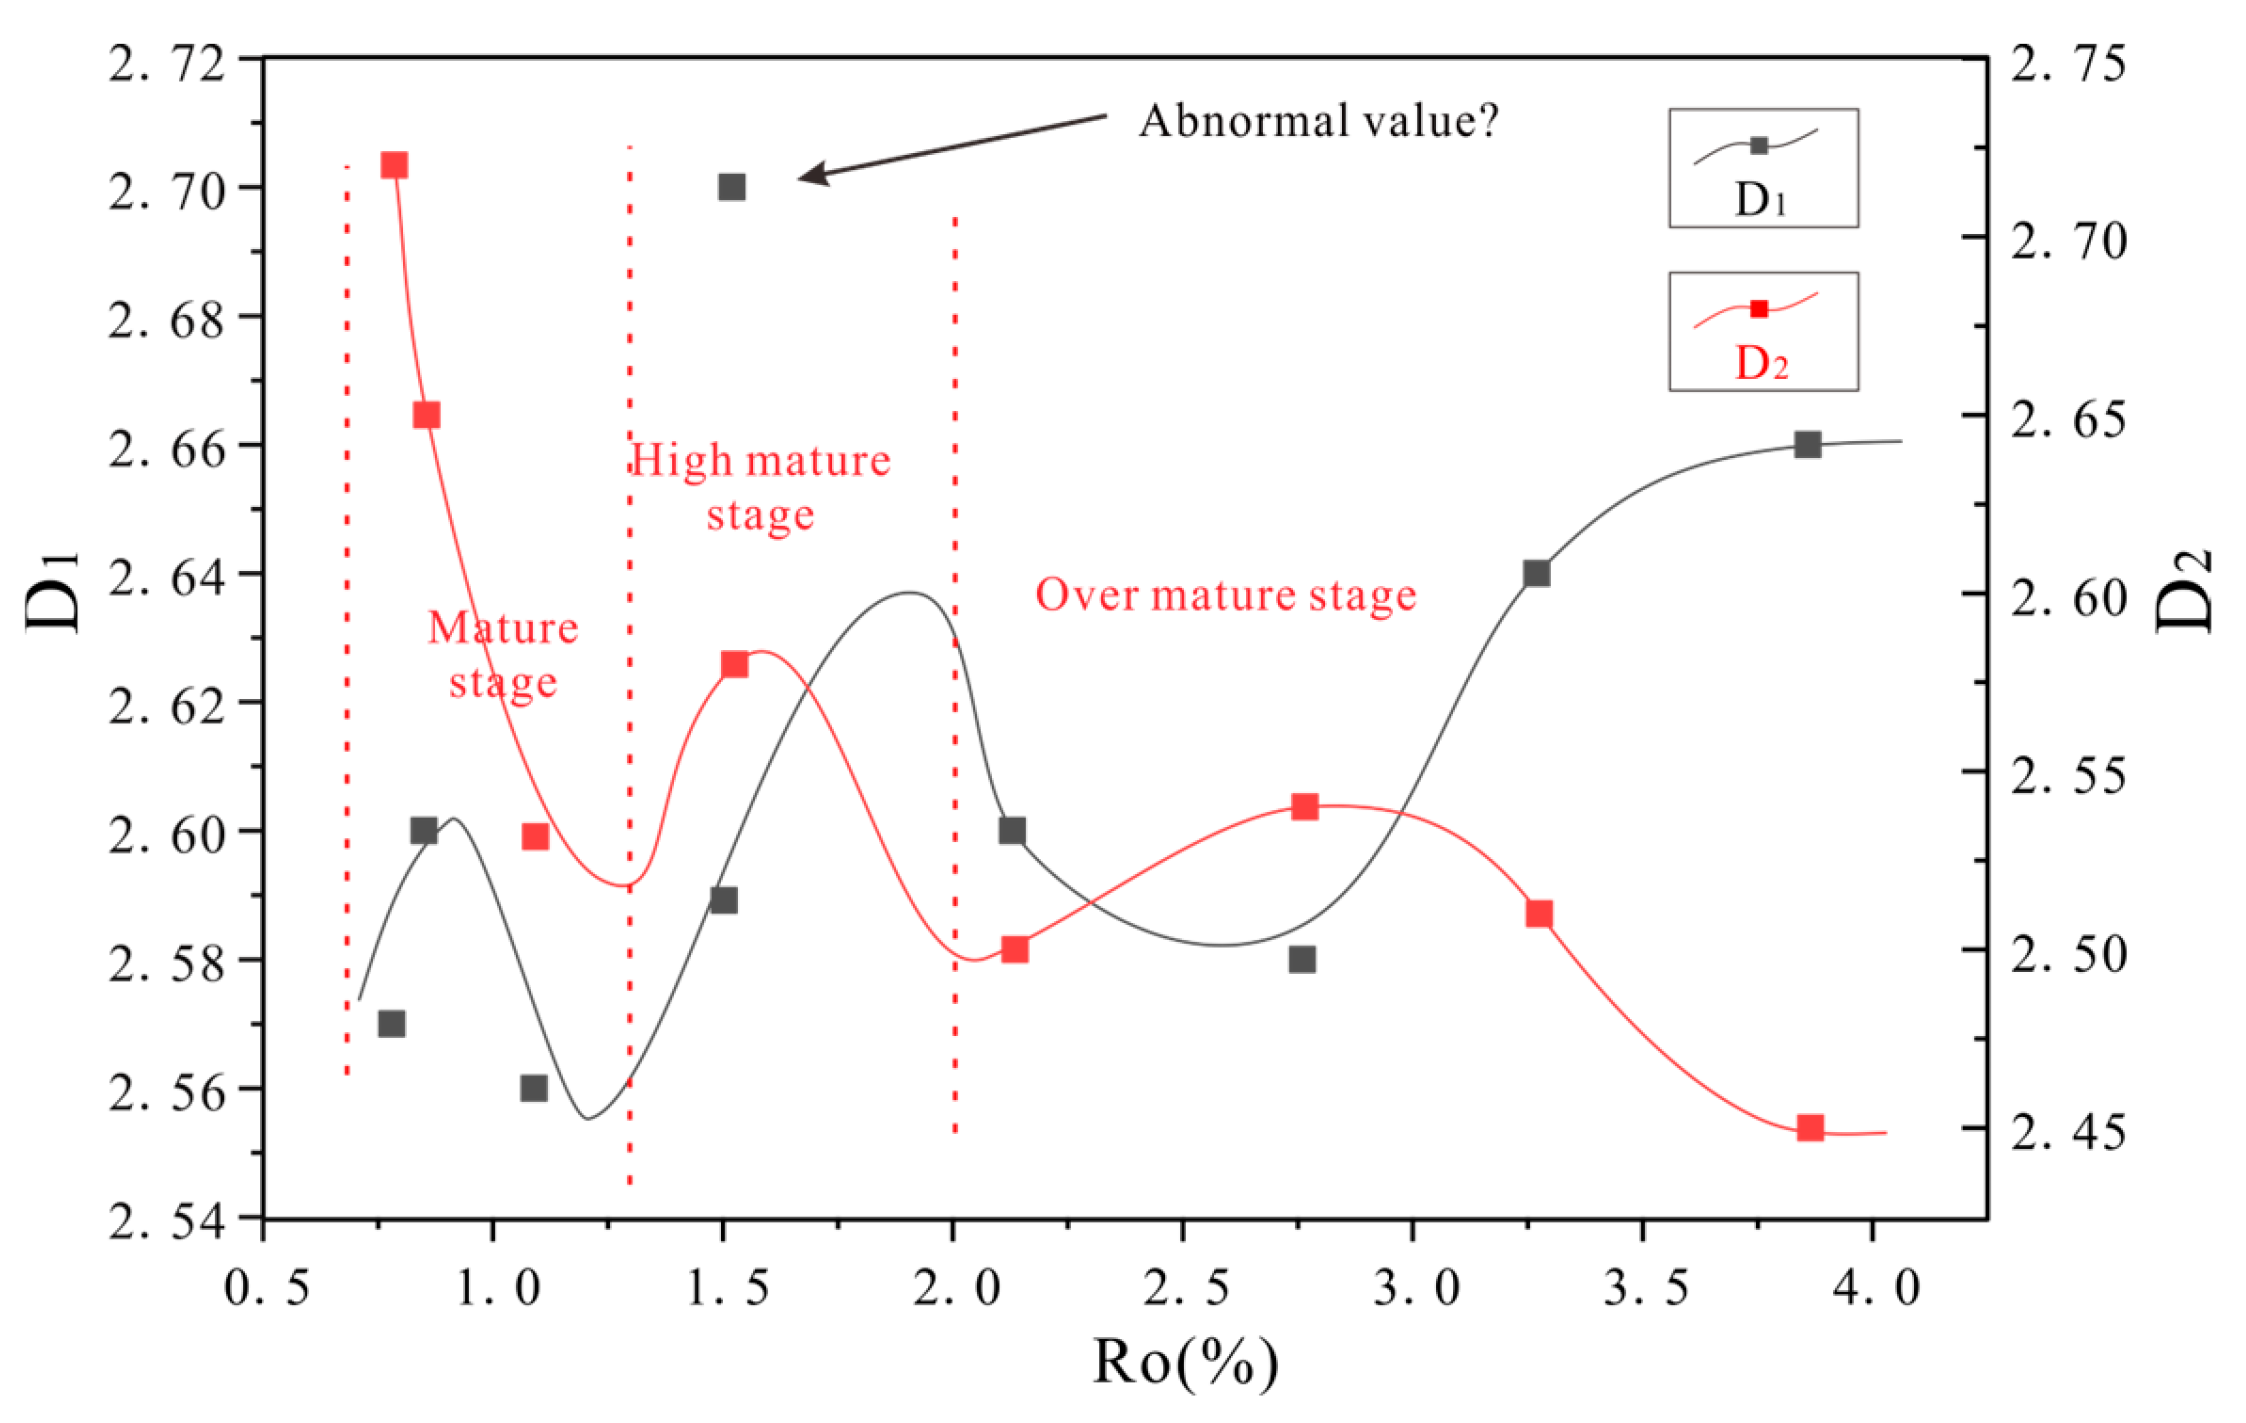
5.3. Evolution Model of Fractal Dimension

The above results indicate that the degree of pore development can be represented by D1, followed by D2. During pore structure evolution, the “depleted” components (such as the TOC, carbonates, feldspars, etc.) are represented by D2. By combining organic matter evolution, mineral composition, and diagenetic processes [30,39], the fractal dimension evolution of the pore structure in transitional shale is revealed (Figure 12).
(1)
Immature-to-low-mature stage (Ro < 0.7%): Compaction causes inorganic minerals and organic matter to become tightly packed. The pore system is dominated by residual primary intergranular pores. Pore development gradually declines. As a result, D1 exhibits low values, indicating smooth pore surfaces with low complexity and high self-similarity. In the early stage of pore structure evolution, the “depleted” components in shale have not yet undergone mineral transformation. D2 shows relatively high values, reflecting the irregular development of various pore types and greater internal pore complexity.
(2)
Mature stage (0.7% < Ro < 1.3%): In the early part of the mature stage, the pyrolysis of kerogen releases hydrocarbons, causing a shrinkage in the kerogen volume. At the same time, complex organic pores and microfractures form on the surface and edges of the kerogen. The complexity of the pore surface increases, and D1 shows a slight rise. As hydrocarbon generation intensifies, the residual inorganic and organic pores become filled with adsorbed and retained oil, leading to a significant decrease in pore quantity during this stage. As the pore volume (PV) and specific surface area (SSA) of most pores decrease, D1 also declines overall. In the later part of the mature stage, the cracking and expulsion of retained oil releases some inorganic pores, while solid bitumen forms, enriched with nanoscale organic pores. The number of pores significantly increases, likely due to the transformation of 1–5 nm pores into pores greater than 5 nm in size. The proportion of organic pores continues to rise. A significant number of different pore types are formed, resulting in a marked increase in D1. Organic acids released during organic matter cracking promote dissolution and the transformation of clay minerals. As organic matter, feldspar, carbonate minerals, and clay minerals are progressively consumed, the complexity of the pore structure gradually decreases, and D2 continues to decline.
(3)
Highly mature stage (1.3% < Ro < 2.0%): Kerogen and retained oil are gradually cracked into light oil and wet gas. A significant number of organic pores form on the surface of organic matter, leading to a marked increase in D1. Inorganic pores filled with retained oil are released, which may result in a more complex internal pore structure, causing a notable increase in D2. As the oil generation capacity of kerogen gradually ceases, organic acids are no longer released, and the diagenetic environment shifts to an alkaline one. Although dissolution is weakened, the transformation of kaolinite significantly intensifies. Inorganic pores related to clay minerals (especially those in the 5–60 nm range) increase significantly, and pore development continues to advance. As a result, D1 continues to rise while D2 gradually declines.
(4)
Over-mature stage (Ro > 2.0%): Alkyl side chains of kerogen are cracked to form light hydrocarbons (C1–C4). The residual oil and wet gas are cracked into methane. The cracking of oil generates large amounts of methane, which helps maintain pore pressure. As a result, the number and size of organic pores reach their maximum values at Ro = 2.7% and then stabilize. In the early part of the over-mature stage, the scale of inorganic pores slightly decreases due to compaction. Due to the weak thermal evolution of organic matter and limited inorganic diagenesis, the complexity of pore surfaces gradually decreases, with D1 reaching its minimum value at this stage. In the later part of the over-mature stage, as kaolinite fully transforms into illite, the proportion of inorganic pores and microfractures increases. As a result, D1 significantly increases while D2 decreases.

6. Conclusions

In this study, transitional shale samples at various stages of thermal maturity were analyzed to investigate their geochemical characteristics, mineral composition, and pore structure. The evolution of the pore structure and its fractal dimensions was determined using the FHH (Frenkel–Halsey–Hill) and capillary bundle models. Correlation analysis and principal component analysis were employed to identify the controlling factors and evolutionary patterns of pore structure fractal dimensions.
(1)
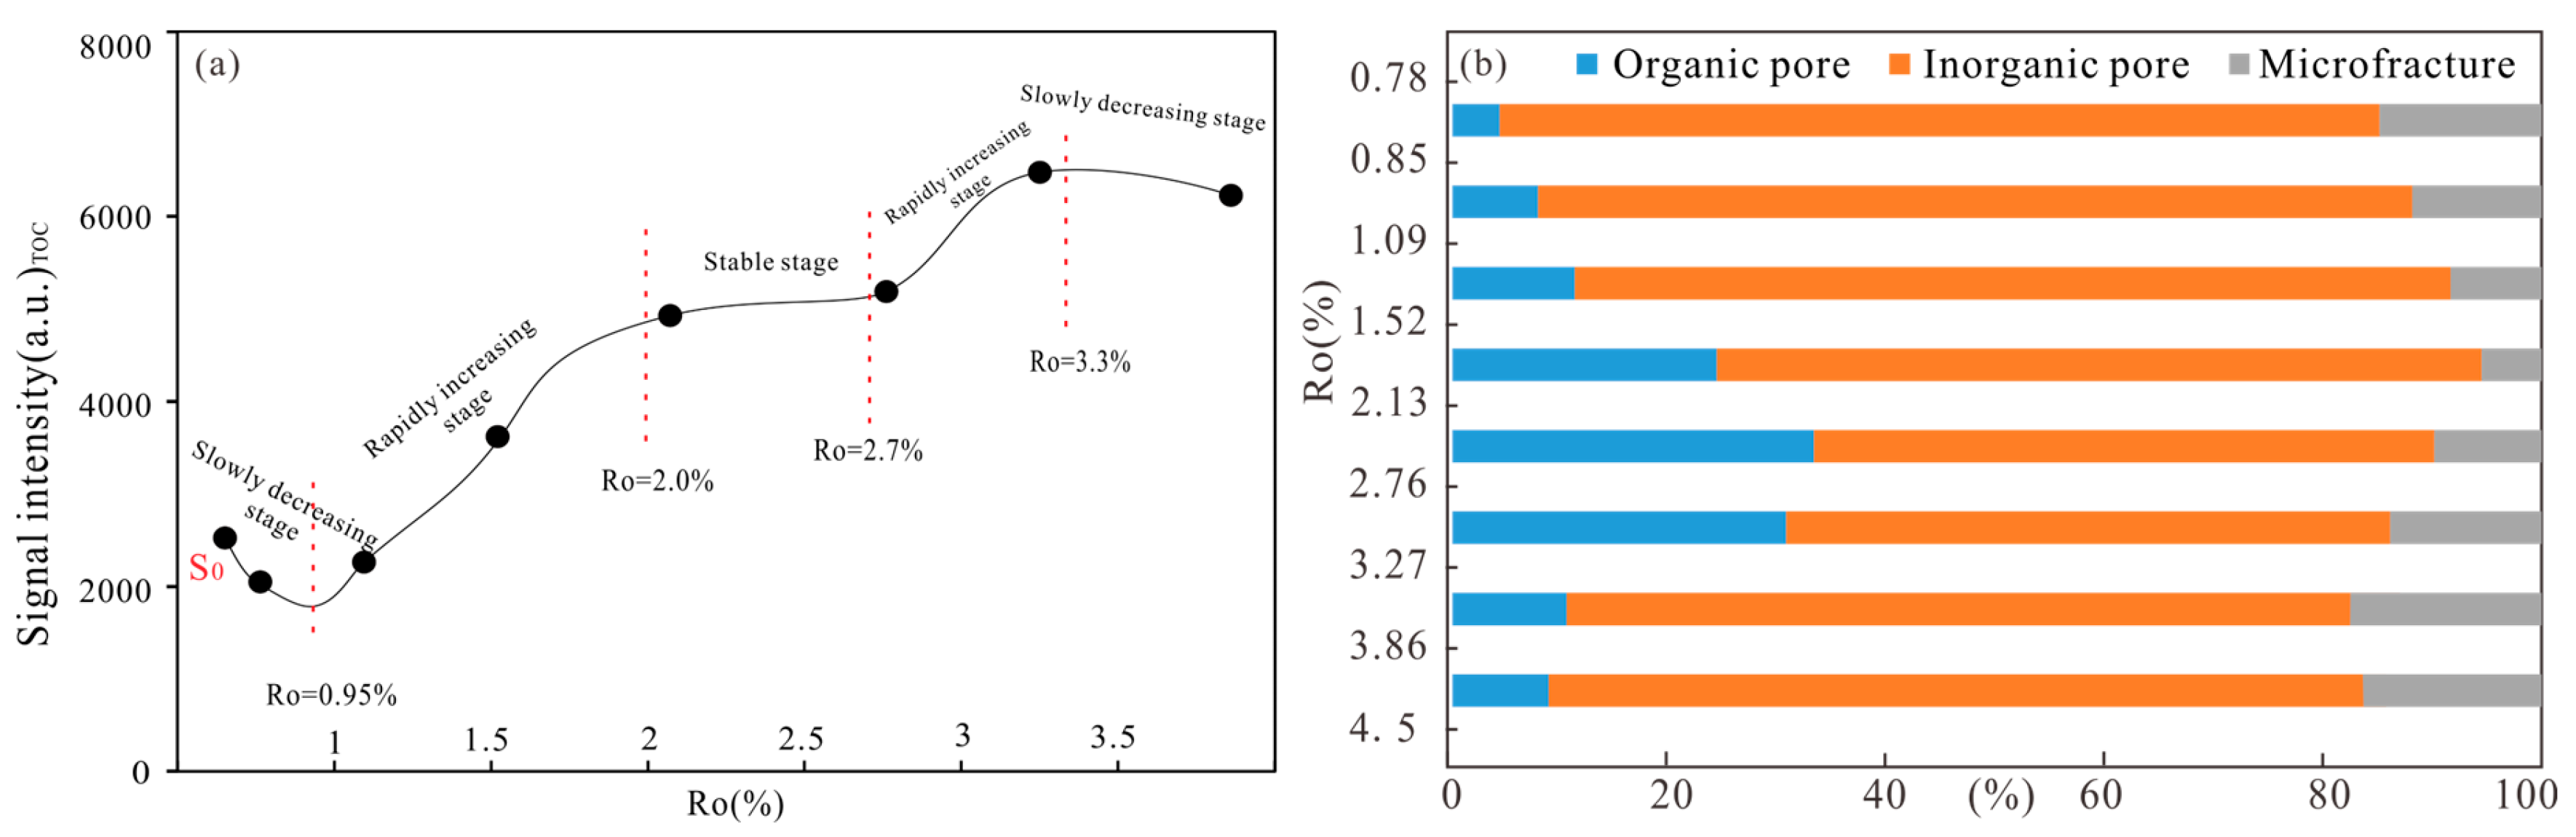
The initial samples used for thermal simulation were primarily composed of quartz (39.9%) and clay minerals (49.9%), with moderate-to-good hydrocarbon generation potential. As thermal maturity increased, the quartz content gradually rose while the amounts of clay minerals, carbonate minerals, pyrite, and feldspar decreased. The pore evolution process consists of five stages: a slow decrease phase (0.78 < Ro < 1.0%), a rapid increase phase (1.0% < Ro < 2.0%), a relatively stable phase (2.0% < Ro < 2.7%), a rapid increase phase (2.7% < Ro < 3.2%), and a slow decrease phase (Ro > 3.2%).
(2)
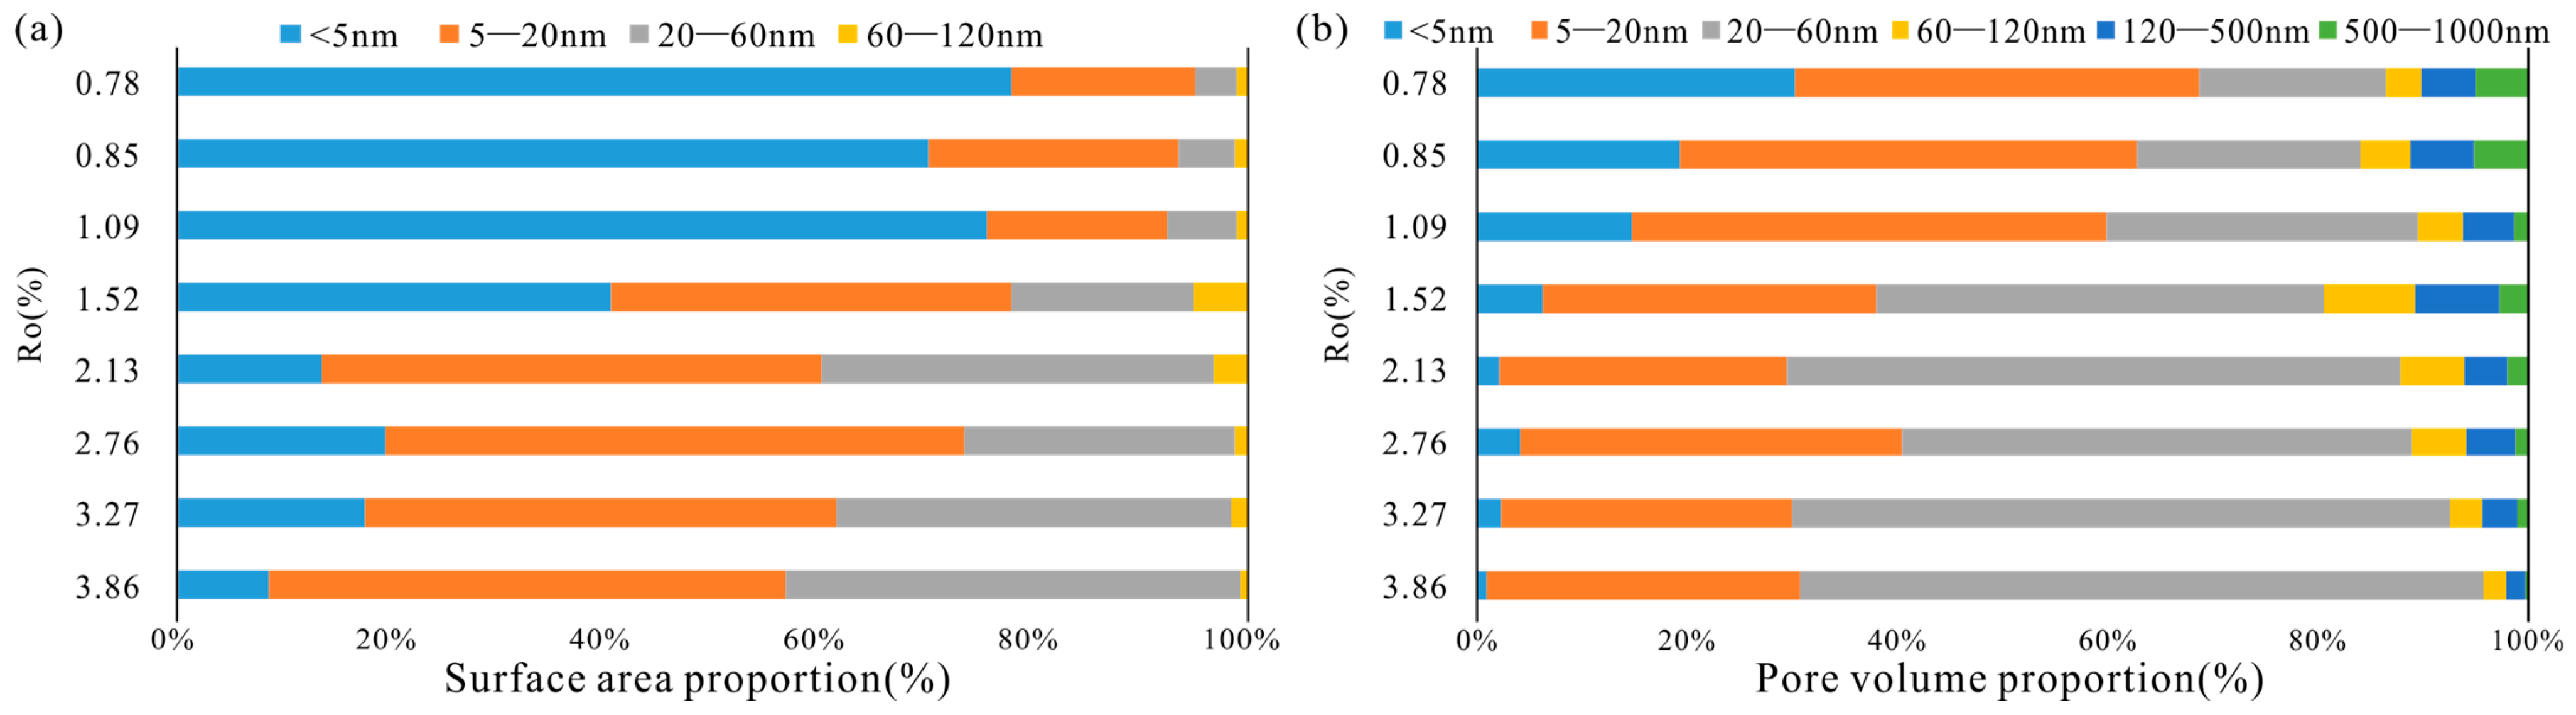
The evolution of the pore volume (PV) and specific surface area (SSA) indicated a gradual increase in the proportion of pores in the 5–20 nm and 20–60 nm ranges while the proportion of pores smaller than 5 nm decreased. The D1 value obtained using the FHH model (average = 2.61) was higher than the D2 value (average = 2.56). This suggests that, at various stages of maturity, the roughness of pore surfaces is greater than the complexity of the internal pore structure. The DM distribution calculated using the capillary bundle model had a broad range (2.47 to 2.94), with an average value (2.84) higher than both D1 and D2, possibly indicating that larger pores exhibit more complex pore structures.
(3)
D1 can be used to indicate the extent of pore development. D2 can be used to characterize the changes in consumed components during the pore development process. Based on the thermal evolution of organic matter, mineral composition, diagenesis, and pore structure evolution, an evolutionary model of the fractal dimensions for transitional shales has been established.

Author Contributions

Conceptualization, X.W. and Y.G.; methodology, Y.J.; validation, Q.G.; formal analysis, Y.G.; investigation, H.Z.; data curation, Q.G.; writing—original draft preparation, X.W. and Y.G.; writing—review and editing, Y.J. and D.D.; visualization, H.Z.; supervision, D.D. and Y.J.; project administration, D.D. and Y.J. All authors have read and agreed to the published version of the manuscript.

Funding

This research was funded by the National Natural Science Foundation of China, grant number 42202192, and supported by Sichuan Science and Technology Program, grant number 2024NSFSC0811.

Institutional Review Board Statement

Not applicable.

Informed Consent Statement

Not applicable.

Data Availability Statement

Data are contained within the article.

Conflicts of Interest

Author Dazhong Dong was employed by PetroChina Research Institute of Petroleum Exploration and Development. The remaining authors declare that the research was conducted in the absence of any commercial or financial relationships that could be construed as a potential conflict of interest.

References

  1. Mandelbrot, B. How long is the coast of Britain? Statistical self-similarity and fractional dimension. Science 1967, 156, 636–638. [Google Scholar] [CrossRef] [PubMed]
  2. Mandelbrot, B. Fractals: Form, Chance and Dimension; Freeman: San Francisco, CA, USA, 1977. [Google Scholar]
  3. Li, J.; Zheng, B. A new method for fractal characterization of microscopic pores and its application in shale reservoirs. Nat. Gas Ind. 2016, 35, 52–59, (In Chinese with English abstract). [Google Scholar]
  4. Peng, N.; He, S.; Hu, Q.; Zhang, B.; He, X.; Zhai, G.; He, C.; Yang, R. Organic nanopore structure and fractal characteristics of Wufeng and lower member of Longmaxi shales in southeastern Sichuan, China. Mar. Pet. Geol. 2019, 103, 456–472. [Google Scholar] [CrossRef]
  5. Huang, W.; Lu, S.; Hersi, O.; Wang, M.; Deng, S.; Lu, R. Reservoir spaces in tight sandstones: Classification, fractal characters, and heterogeneity. J. Nat. Gas Sci. Eng. 2017, 46, 80–92. [Google Scholar] [CrossRef]
  6. Guan, Q.; Dong, D.; Sun, S.S.; Hu, L.; Qi, L.; Li, C.; Chen, C.; Chen, X. Fractal characteristics of organic-rich shale pore structure and its geological implications: A case study of the Lower Silurian Longmaxi Formation in the Weiyuan block, Sichuan Basin. Nat. Gas Ind. 2024, 44, 108–118, (In Chinese with English abstract). [Google Scholar]
  7. Guo, X.; Huang, Z.; Zhao, L.; Han, W.; Ding, C.; Sun, X.; Yan, R.; Zhang, T.; Yang, X.; Wang, R. Pore structure and multi-fractal analysis of tight sandstone using MIP, NMR and NMRC methods: A case study from the Kuqa depression, China. J. Pet. Sci. Eng. 2019, 178, 544–558. [Google Scholar] [CrossRef]
  8. Ma, X.; Guo, S.; Shi, D.; Zhou, Z.; Liu, G. Investigation of pore structure and fractal characteristics of marine continental transitional shales from Longtan Formation using MICP, gas adsorption, and NMR (Guizhou, China). Mar. Pet. Geol. 2019, 107, 555–571. [Google Scholar] [CrossRef]
  9. Sun, W.; Zuo, Y.; Wu, Z.; Liu, H.; Xi, S.; Shui, Y.; Wang, J.; Liu, R.; Lin, J. Fractal analysis of pores and the pore structure of the Lower Cambrian Niutitang shale in northern Guizhou province: Investigations using NMR, SEM and image analyses. Mar. Pet. Geol. 2019, 99, 416–428. [Google Scholar] [CrossRef]
  10. Avnir, D.; Jaroniec, M. An isotherm equation for adsorption on fractal surfaces of heterogeneous porous materials. Langmuir 1989, 5, 1431–1433. [Google Scholar] [CrossRef]
  11. Neimark, A.V.; Unger, K.K. Method of discrimination of surface fractality. J. Colloid Interface Sci. 1993, 158, 412–419. [Google Scholar] [CrossRef]
  12. Pfeifer, P.; Wu, Y.; Cole, M.W.; Krim, J. Multilayer adsorption on a fractally rough surface. Phys. Rev. Lett. 1989, 62, 1997–2000. [Google Scholar] [CrossRef] [PubMed]
  13. Washburn, E.W. The dynamics of capillary flow. Phys. Rev. 1921, 2, 273–283. [Google Scholar] [CrossRef]
  14. Zhang, B.; Li, S. Determination of the surface fractal dimension for porous media by mercury porosimetry. Ind. Eng. Chem. Res. 1995, 34, 1383–1386. [Google Scholar] [CrossRef]
  15. He, T.; Zhou, Y.; Chen, Z.; Zhang, Z.; Xie, H.; Shang, Y.; Cui, G. Fractal Characterization of the Pore-Throat Structure in Tight Sandstone Based on Low-Temperature Nitrogen Gas Adsorption and High-Pressure Mercury Injection. Fractal Fract. 2024, 8, 356. [Google Scholar] [CrossRef]
  16. Zhang, C.; Guan, P.; Zhang, J.; Liang, X.; Ding, X.; You, Y. A Review of the Progress on Fractal Theory to Characterize the Pore Structure of Unconventional Oil and Gas Reservoirs. Acta Sci. Nat. Univ. Pekin. 2023, 59, 897–908, (In Chinese with English abstract). [Google Scholar]
  17. Qian, C.; Li, X.; Shen, W.; Zhang, Q.; Guo, W.; Hu, Y.; Yue, C.; Jia, Y. Study on the Pore Structure and Fractal Characteristics of Different Lithofacies of Wufeng−Longmaxi Formation Shale in Southern Sichuan Basin, China. ACS Omega 2022, 7, 8724–8738. [Google Scholar] [CrossRef]
  18. Liu, R.; Wei, Z.; Jia, A.; He, S.; Hou, Y.; He, Q.; Wang, T.; Zeng, Y.; Yang, R. Fractal Characteristics of Pore Structure in Deep Over pressured Organic Rich Shale in Wufeng-Longmaxi Formation in Southeast Sichuan and Its Geological Significance. Earth sci. 2023, 48, 1496–1516, (In Chinese with English abstract). [Google Scholar]
  19. Zheng, S.; Yao, Y.; Liu, D.; Cai, Y.; Liu, Y. Characterizations of full-scale pore size distribution, porosity and permeability of coals: A novel methodology by nuclear magnetic resonance and fractal analysis theory. Int. J. Coal Geol. 2018, 196, 148–158. [Google Scholar] [CrossRef]
  20. Li, P.; Zheng, M.; Bi, H.; Wu, S.; Wang, X. Pore throat structure and fractal characteristics of tight oil sandstone: A case study in the Ordos Basin, China. J. Pet. Sci. Eng. 2017, 149, 665–674. [Google Scholar] [CrossRef]
  21. Chang, J.; Fan, X.; Jiang, Z.; Wang, X.; Chen, L.; Li, J.; Zhu, L.; Wan, C.; Chen, Z. Differential impact of clay minerals and organic matter on pore structure and its fractal characteristics of marine and continental shales in China. Appl. Clay Sci. 2022, 216, 106334. [Google Scholar] [CrossRef]
  22. Li, X.; Jiang, Z.; Jiang, S.; Li, Z.; Song, Y.; Jiang, H.; Qiu, H.; Cao, X.; Miao, Y. Various controlling factors of matrix-related pores from differing depositional shales of the Yangtze Block in south China: Insight from organic matter isolation and fractal analysis. Mar. Pet. Geol. 2020, 111, 720–734. [Google Scholar] [CrossRef]
  23. Li, Y.; Liu, D.; Feng, X.; Zhao, F.; Chen, Y.; Wang, Y.; Lin, R.; Du, W.; Fan, Q.; Song, Y.; et al. Heterogeneity characteristics and its controlling factors of marine shale reservoirs from the Wufeng−Longmaxi Formation in the Northern Guizhou area. Geol. China 2024, 51, 780–798, (In Chinese with English abstract). [Google Scholar]
  24. Kuang, L.C.; Dong, D.Z.; He, W.Y.; Wen, S.M.; Sun, S.S.; Li, S.X.; Qiu, Z.; Liao, X.W.; Li, Y.; Wu, J.; et al. Geological characteristics and development potential of transitional shale gas in the east margin of the Ordos Basin, NW China. Pet. Explor. Dev. 2020, 47, 471–482. [Google Scholar] [CrossRef]
  25. Dong, D.Z.; Wang, Y.M.; Li, X.J.; Zou, C.N.; Guan, Q.Z.; Zhang, C.C.; Huang, J.L.; Wang, S.F.; Wang, H.Y.; Liu, H.L.; et al. Breakthrough and prospect of shale gas exploration and development in China. Nat. Gas Ind. B 2016, 3, 43825. [Google Scholar] [CrossRef]
  26. Wu, J.; Wang, H.; Shi, Z.; Wang, Q.; Zhao, Q.; Li, S.; Liu, D.; Sun, S.; Qiu, Z. Favorable lithofacies types and genesis of marine-continental transitional black shale: A case study of Permian Shanxi Formation in the eastern margin of Ordos Basin, NW China. Pet. Explor. Dev. 2021, 48, 1137–1149. [Google Scholar] [CrossRef]
  27. Zhang, Q.; Zhang, L.F.; Wang, Y.M.; Xiao, Y.F.; Liu, D.; Liu, W.; Li, S.X.; Li, X.T. Characteristics and controlling factors of transitional shale gas reservoirs: An example from Permian Shanxi Formation, Daning-Jixian block, Ordos Basin, China. J. Nat. Gas Geosci. 2022, 7, 147–157. [Google Scholar] [CrossRef]
  28. Li, X.; Jiang, Z.X.; Wang, S.; Wu, F.; Miao, Y.N.; Wang, X.M.; Wang, H.X.; Liu, X.B. Differences of marine and transitional shales in the case of dominant pore types and exploration strategies, in China. J. Nat. Gas Sci. Eng. 2022, 103, 104628. [Google Scholar] [CrossRef]
  29. Guo, S.B.; Mao, W.J. Division of diagenesis and pore evolution of a Permian Shanxi shale in the Ordos Basin, China. J. Pet. Sci. Eng. 2019, 182, 106351. [Google Scholar] [CrossRef]
  30. Lu, C.G.; Xiao, X.M.; Gai, H.F.; Feng, Y.; Li, G.; Meng, G.M.; Gao, P. Nanopore structure characteristics and evolution of type III kerogen in marine-continental transitional shales from the Qinshui basin, northern China. Geoenergy Sci. Eng. 2023, 221, 211413. [Google Scholar] [CrossRef]
  31. Ma, Z.L.; Zheng, L.J.; Li, Z.M. The Thermocompression Simulation Experiment of Source Rock Hydrocarbon Generation and Expulsion in Formation Porosity. Acta Sedimentol. Sin. 2012, 30, 955–963, (In Chinese with English abstract). [Google Scholar]
  32. Espitalié, J.; Laporte, J.L.; Madec, M.; Marquis, F.; Leplat, P.; Paulet, J.; Boutefeu, A. Rapid method for source rocks characterization and for determination of petroleum potential and degree of evolution. Rev. Inst. Fr. Pet. 1977, 32, 23–42. [Google Scholar] [CrossRef]
  33. Wang, Z.; Jiang, Y.; Fu, Y.; Lei, Z.; Xu, C.; Yuan, J.; Wen, R.; Wang, Z.; Gu, Y.; Yin, X. Characterization of Pore Structure and Heterogeneity of Shale Reservoir from Wufeng Formation-Sublayers Long-11 in Western Chongqing Based on Nuclear Magnetic Resonance. Earth Sci. 2022, 47, 490–504, (In Chinese with English abstract). [Google Scholar]
  34. Jiang, F.; Chen, D.; Chen, J.; Li, Q.; Liu, Y.; Shao, X.; Hu, T.; Dai, X. Fractal analysis of shale pore structure of continental gas shale reservoir in the Ordos Basin, NW China. Energy Fuels 2016, 30, 4676–4689. [Google Scholar] [CrossRef]
  35. He, C.; Zhao, Y.; Yu, L.; Lu, L.; Liu, X.; Pan, A.; Li, C. Pore structure and fractal characteristics of deep shale gas reservoirs in the Permian Dalong Formation, northeastern Sichuan Basin. Pet. Geol. Exp. 2024, 46, 263–277, (In Chinese with English abstract). [Google Scholar]
  36. El Nady, M.M.; Ramadan, F.S.; Hammad, M.M.; Lotfy, N.M. Evaluation of organic matters, hydrocarbon potential and thermal maturity of source rocks based on geochemical and statistical methods: Case study of source rocks in Ras Gharib oilfield, central Gulf of Suez, Egypt. Egypt. J. Pet. 2015, 24, 203–211. [Google Scholar] [CrossRef]
  37. Zhou, B. The Applications of NMR Relaxometry, NMR Cryoporometry, and FFC NMR to Nanoporous Structures and Dynamics in Shale at Low Magnetic Fields. Energy Fuels 2018, 32, 8897–8904. [Google Scholar] [CrossRef]
  38. Xu, L.W.; Yang, K.J.; Wei, H.; Liu, L.F.; Li, X.; Chen, L.; Xu, T.; Wang, X.M. Diagenetic evolution sequence and pore evolution model of Mesoproterozoic Xiamaling organic-rich shale in Zhangjiakou, Hebei, based on pyrolysis simulation experiments. Mar. Pet. Geol. 2021, 132, 105233. [Google Scholar] [CrossRef]
  39. Wang, G.P.; Jin, Z.J.; Zhang, Q.; Zhu, R.K.; Tang, X.; Liu, K.Q.; Dong, L. Effects of clay minerals and organic matter on pore evolution of the early mature lacustrine shale in the Ordos Basin, China. J. Asian Earth Sci. 2023, 246, 105516. [Google Scholar] [CrossRef]
  40. Milliken, K.L.; Rudnicki, M.; Awwiller, D.N.; Zhang, T. Organic matter-hosted pore system, Marcellus Formation (Devonian), Pennsylvania. AAPG Bull. 2013, 97, 177–200. [Google Scholar] [CrossRef]
  41. Loucks, R.G.; Reed, R.M. Scanning-Electron-Microscope Petrographic Evidence for Distinguishing Organic-Matter Pores Associated with Depositional Organic Matter versus Migrated Organic Matter in Mudrocks. Presented at the Convention of the Gulf Coast Association of Geological Societies American Association of Petroleum Geologists Sectional Meeting, Lafayette, Louisiana, 5–7 October 2014. [Google Scholar]
  42. Loucks, R.G.; Reed, R.M.; Ruppel, S.C.; Jarvie, D.M. Morphology, genesis, and distribution of nanometer-scale pores in siliceous mudstones of the Mississippian Barnett shale. J. Sediment. Res. 2009, 79, 848–861. [Google Scholar] [CrossRef]
  43. Bernard, S.; Wirth, R.; Schreiber, A.; Schulz, H.M.; Horsfield, B. Formation of nanoporous pyrobitumen residues during maturation of the Barnett Shale (Fort Worth Basin). Int. J. Coal Geo. 2014, 127, 114–115. [Google Scholar] [CrossRef]
  44. Gao, Z.Y.; Xuan, Q.X.; Hu, Q.H.; Jiang, Z.X.; Liu, X.X. Pore structure evolution characteristics of continental shale in China as indicated from thermal simulation experiments. AAPG Bull. 2021, 105, 2159–2180. [Google Scholar] [CrossRef]
  45. Zhao, Y.M.; Gao, P.; Zhou, Q.; Xiao, X.M.; Xing, Y.J.; Liu, W. A Review of the Heterogeneity of Organic-Matter-Hosted Pores in Shale Reservoirs. Energies 2022, 15, 8805. [Google Scholar] [CrossRef]
  46. Pommer, M.; Milliken, K. Pore types and pore-size distributions across thermal maturity, Eagle Ford Formation, southern Texas(Review). AAPG Bull. 2015, 99, 1713–1744. [Google Scholar] [CrossRef]
  47. Xu, L.W.; Yang, K.J.; Zhang, L.F.; Liu, L.F.; Jiang, Z.X.; Li, X. Organic-induced nanoscale pore structure and adsorption capacity variability during artificial thermal maturation: Pyrolysis study of the Mesoproterozoic Xiamaling marine shale from Zhangjiakou, Hebei, China. J. Pet. Sci. Eng. 2021, 202, 108502. [Google Scholar] [CrossRef]
  48. Peltonen, C.; Marcussen, Ø.; Bjørlykke, K.; Jahren, J. Clay mineral diagenesis and quartz cementation in mudstones: The effects of smectite to illite reaction on rock properties. Mar. Petrol. Geol. 2009, 26, 887–898. [Google Scholar] [CrossRef]
  49. Xue, J.; Lee, C.; Wakeham, S.G.; Armstrong, R. Using principal components analysis (PCA) with cluster analysis to study the organic geochemistry of sinking particles in the ocean. Org. Geochem. 2011, 42, 356–367. [Google Scholar] [CrossRef]
  50. Gotelli, N.J.; Ellison, A.M. A Primer of Ecological Statistics; Sinauer Associates: Sunderland, MA, USA, 2004. [Google Scholar]
  51. He, Q.B.; Chen, S.J.; Li, S.X.; Guo, B.Z.; Lu, J.G.; Li, Y.; Li, X.G.; Zhao, L.P.; Ma, Z.W. Organic geochemical characteristics and hydrocarbon generation mechanism of marine-continental transitional organic-rich shale: A case study from the Shanxi formation in the eastern margin of the Ordos Basin. J. Pet. Sci. Eng. 2022, 219, 111116. [Google Scholar] [CrossRef]
Figure 1. (a) The study area in the southeastern Ordos Basin. (b) Generalized stratigraphy of Formation in the eastern Ordos Basin (modified from Kuang et al., 2020 [24]).
Fractalfract 09 00335 g001
Figure 2. (a) TOC versus (S1 + S2) cross-plot showing that the quality of samples (the evaluation criterion is from EI Nady et al., 2015 [36]). (b) Mineral composition and content variation data of the simulated samples.
Fractalfract 09 00335 g002
Figure 3. (a) Porosity evolution characteristics and (b) proportions of different types of pores of simulated samples.
Fractalfract 09 00335 g003
Figure 4. (a) Mercury curve, (b) adsorption–desorption curve, (c) pore volume, and (d) specific surface area distribution of simulated samples.
Fractalfract 09 00335 g004
Figure 5. (a) Specific surface area and (b) pore volume proportion of simulated samples.
Fractalfract 09 00335 g005
Figure 6. SEM characteristics of organic pores of simulated samples.
Fractalfract 09 00335 g006
Figure 7. SEM characteristics of inorganic pores of simulated samples.
Fractalfract 09 00335 g007
Figure 8. Fractal characteristics of pore structures of shale samples based on nitrogen adsorption (LTNA).
Fractalfract 09 00335 g008
Figure 9. Fractal characteristics of shale pores based on high-pressure mercury injection data.
Fractalfract 09 00335 g009
Figure 10. (a) Correlation coefficient matrix of fractal dimension and pore structure parameters. (b) Principal component analysis (PCA) of fractal dimension and pore structure variables of simulated samples; arrows represent variables.
Fractalfract 09 00335 g010
Figure 11. (a) Correlation coefficient matrix of fractal dimension, geochemical parameters, and mineral compositions. (b) PCA of fractal dimension, geochemical parameters, and mineral compositions variables of simulated samples; arrows represent variables.
Fractalfract 09 00335 g011
Figure 12. Cross-plot of fractal dimension D1 and D2 with maturity. The division of evolutionary stages is shown with references to He et al., 2022 [51].
Fractalfract 09 00335 g012
Table 1. Simulation parameter information of samples.
SampleTemperature (°C)Static Rock Pressure (MPa)Formation Pressure (MPa)Holding Time (h)
S1325502148
S2350682548
S3400753048
S4450853448
S5500903648
S6550953848
S75751004048
Table 2. Geochemical and mineral composition parameter variations in the simulated samples.
SampleTemperature (°C)Ro
(%)
TOC
(%)
S1 + S2 (mg/g)HI (mg/g TOC)Quartz
(%)
Feldspar
(%)
Clay
(%)
Dolomite
(%)
Siderite (%)Pyrite
(%)
Kaolinite (%)I/S (%)Illite
(%)
Chlorite
(%)
S0Initial0.782.872.8212239.91.449.92.14.72.085393
S13500.852.752.649840.61.249.42.44.22.2773164
S23751.092.62.226642.31.247.92.24.61.8734194
S34001.522.431.174846.50.845.61.54.21.4638245
S44502.132.340.281448.50.744.51.33.41.63518416
S55002.762.310.12649.50.644.21.13.21.423224411
S65503.272.070.09450.40.543.31.03.61.23167110
S75753.862.120.04152.00.642.41.13.00.90137611
Table 3. Pore structure parameters of simulated samples.
Sample IDRoPore Volume (cm3/g)Specific Surface Area (m2/g)
<5 nm5–20 nm20–60 nm60–120 nm120–500 nm500–1000 nmTotal<5 nm5–20 nm20–60 nm60–120 nmTotal
S00.780.001110.001400.000650.000120.000190.000180.00371.4150.3110.0720.0171.814
S10.850.000610.001380.000670.000150.000190.000170.00320.9080.3030.0670.0161.294
S21.090.000400.001230.000810.000120.000130.000040.00271.0400.2310.0870.0141.373
S31.520.000400.002070.002770.000560.000520.000180.00650.4450.4110.1860.0551.097
S42.130.000240.003090.006610.000690.000460.000240.01130.3111.0730.8440.0692.298
S52.760.000540.004920.006570.000700.000640.000170.01350.6531.8110.8450.0373.346
S63.270.000540.006890.015580.000730.000840.000280.02490.9352.3361.9600.0785.309
S73.860.000200.007870.017110.000590.000450.000100.02630.4462.5222.2150.0315.214
Table 4. Fractal parameters of simulated sample. DM calculation method was used with reference to Li et al., 2017 [20].
Sample IDRo0.01 < P/P0 < 0.450.45 < P/P0 < 0.98HPMI (50 nm< r <1000 nm)
D1R2D2R2DM1R2DM2R2DM
S00.782.570.9972.720.9982.920.9902.960.9952.94
S10.852.600.9982.650.9932.900.9932.940.9972.92
S21.092.560.9972.531.002.910.9962.960.9962.94
S31.522.700.9922.580.9962.870.9982.950.9892.91
S42.132.601.002.500.9782.610.9872.960.9892.72
S52.762.581.002.540.9932.250.9952.960.8942.47
S63.272.640.9982.510.9732.770.9992.940.9892.87
S73.862.661.002.450.9722.861.002.970.9792.92
Disclaimer/Publisher’s Note: The statements, opinions and data contained in all publications are solely those of the individual author(s) and contributor(s) and not of MDPI and/or the editor(s). MDPI and/or the editor(s) disclaim responsibility for any injury to people or property resulting from any ideas, methods, instructions or products referred to in the content.

