Article

Exploring Multifractal Asymmetric Detrended Cross-Correlation Behavior in Semiconductor Stocks

by
Werner Kristjanpoller
Departamento de Industrias, Universidad Técnica Federico Santa María, Valparaíso 2580816, Chile
Fractal Fract. 2025, 9(5), 292; https://doi.org/10.3390/fractalfract9050292
Submission received: 28 February 2025 / Revised: 26 April 2025 / Accepted: 27 April 2025 / Published: 1 May 2025

Abstract

This study investigates the multifractal behavior of four leading semiconductor stocks—Intel (INTC), Advanced Micro Devices (AMD), Nvidia (NVDA), and Broadcom (AVGO)—in relation to key financial assets, including the Dow Jones Industrial Average (DJI), the Euro–U.S. Dollar exchange rate (EUR), gold (XAU), crude oil (WTI), and Bitcoin (BTC), using Multifractal Asymmetric Detrended Cross-Correlation Analysis (MF-ADCCA). The analysis is based on daily price return time series from January 2015 to January 2025. Results reveal consistent evidence of multifractality across all asset pairs, with the generalized Hurst exponent exhibiting significant variability, indicative of complex and nonlinear stock price dynamics. Among the semiconductor stocks, NVDA and AVGO exhibit the highest levels of multifractal cross-correlation, particularly with DJI, WTI, and BTC, while AMD consistently shows the lowest, suggesting comparatively more stable behavior. Notably, cross-correlation Hurst exponents with BTC are the highest, reaching approximately 0.54 for NVDA and AMD. Conversely, pairs with EUR display long-term negative correlations, with exponents around 0.46 across all semiconductor stocks. Multifractal spectrum analysis highlights that NVDA and AVGO exhibit broader and more pronounced multifractal characteristics, largely driven by higher fluctuation intensities. Asymmetric cross-correlation analysis reveals that stocks paired with DJI show greater persistence during market downturns, whereas those paired with XAU demonstrate stronger persistence during upward trends. Analysis of multifractality sources using surrogate time series confirms the influence of fat-tailed distributions and temporal linear correlations in most asset pairs, with the exception of WTI, which shows less complex behavior. Overall, the findings underscore the utility of multifractal asymmetric cross-correlation analysis in capturing the intricate dynamics of semiconductor stocks. This approach provides valuable insights for investors and portfolio managers by accounting for the multifaceted and asset-dependent nature of stock behavior under varying market conditions.

1. Introduction

The semiconductor industry plays a pivotal role in driving technological innovation, underpinning a wide range of applications from consumer electronics to high-performance computing. Over recent decades, demand for semiconductors has expanded substantially, fueled by advancements in artificial intelligence (AI), the Internet of Things (IoT), and cloud computing [1,2,3]. This growing reliance on semiconductor technologies has not only enhanced computational capabilities but also contributed significantly to the sector’s market capitalization (https://www.semiconductors.org/2023-state-of-the-u-s-semiconductor-industry/ accessed on 27 February 2025). According to the Semiconductor Industry Association (SIA), global semiconductor sales increased by 19.1% in 2024, with double-digit growth projections extending into 2025 (https://www.semiconductors.org/global-semiconductor-sales-increase-19-1-in-2024-double-digit-growth-projected-in-2025/ accessed on 27 February 2025).
This expansion is further supported by rising semiconductor adoption across key sectors such as automotive, telecommunications, and industrial automation (https://www.pwc.com/gx/en/issues/c-suite-insights/the-leadership-agenda/semiconductors-future-big-growth-global-risks.html accessed on 27 February 2025) (https://www.pwc.com/gx/en/industries/technology/state-of-the-semiconductor-industry-report.pdf accessed on 27 February 2025). Additionally, the rapid digital transformation and the increasing complexity of AI applications have compelled leading firms to invest heavily in advanced chip architectures and next-generation manufacturing processes to sustain their competitive edge (https://www.mckinsey.com/industries/semiconductors/our-insights/the-semiconductor-decade-a-trillion-dollar-industry accessed on 27 February 2025).
Semiconductors have been instrumental in enabling the evolution of AI. High-performance computing components, such as graphics processing units (GPUs), tensor processing units (TPUs), and neuromorphic chips, have dramatically enhanced machine learning and deep learning capabilities. These specialized components facilitate faster and more efficient AI computations, driving progress in fields such as natural language processing, computer vision, and autonomous systems. As AI continues to transform industries, the semiconductor sector remains at the core of this technological revolution (https://www.semiconductors.org/2023-state-of-the-u-s-semiconductor-industry/ accessed on 27 February 2025) (https://www.pwc.com/gx/en/industries/tmt/publications/global-tmt-semiconductor-report-2019.html accessed on 27 February 2025).
Beyond its technological importance, the semiconductor sector also offers compelling investment opportunities. Its sustained growth, critical role in digital innovation, and promising long-term outlook position it as an attractive target for investors (https://www.mckinsey.com/industries/semiconductors/our-insights/the-semiconductor-decade-a-trillion-dollar-industry accessed on 27 February 2025). Companies in this sector continue to expand through extensive research and development efforts, as well as strategic acquisitions. As the global economy becomes increasingly reliant on semiconductor-based technologies—particularly those linked to AI and automation—the financial performance of semiconductor firms is expected to remain robust (https://www.semiconductors.org/2023-state-of-the-u-s-semiconductor-industry/) (https://www.pwc.com/gx/en/industries/technology/state-of-the-semiconductor-industry-report.pdf accessed on 27 February 2025).
Given the sector’s significance, understanding the financial dynamics of semiconductor stocks is of growing importance. This study applies multifractal analysis to examine the complexity, persistence, and interconnections of semiconductor stock price behavior with major financial assets. Such analysis offers valuable insights into market stability, efficiency, and investment strategy.
Traditional financial models, notably the Efficient Market Hypothesis (EMH) [4], assume market efficiency and normally distributed returns. However, empirical research has demonstrated that real-world financial markets often exhibit features such as volatility clustering, long-range dependence, and nonlinear dynamics. For instance, an analysis of S&P 100 stocks from 2004 to 2018 revealed a nonlinear relationship between returns and trends, where small positive trends enhanced returns, whereas larger trends reduced them—an effect likely linked to diverse trader motivations [5].
Multifractal analysis has emerged as a powerful framework for capturing such complex behaviors. Unlike traditional linear models, multifractal approaches account for heterogeneous scaling laws, allowing researchers to uncover nonlinear dependencies and quantify varying degrees of market complexity. Multifractal analysis has been successfully applied to identify market inefficiencies, forecast volatility, and enhance financial risk management.
The width of the multifractal spectrum is often employed as a proxy for market complexity. A broader spectrum indicates stronger deviations from random walk behavior and highlights inefficiencies or arbitrage opportunities [6,7,8,9]. This feature has also been linked to calendar anomalies [10,11,12,13]. Empirical evidence shows that emerging markets typically display more pronounced multifractality than developed markets, reflecting greater vulnerability to external shocks and lower efficiency levels [8,14,15,16].
Beyond equities, multifractal behavior has been documented across a diverse range of asset classes. Commodities such as gold, crude oil, and agricultural products often exhibit strong multifractality due to their sensitivity to supply shocks, geopolitical risks, and speculative activity [17,18,19,20]. Bond markets also demonstrate multifractal properties, as interest rate movements and macroeconomic factors introduce persistent long-range correlations across yield curves [21,22,23,24,25].
Cryptocurrencies, particularly Bitcoin, have likewise been analyzed through a multifractal lens. Their extreme volatility, liquidity constraints, and sentiment-driven trading contribute to significant multifractal characteristics [26,27,28,29,30,31].
Moreover, multifractal techniques have proven valuable in uncovering market microstructure inefficiencies and identifying short-term price anomalies, thus supporting the development of more effective trading algorithms [32,33,34].
Recent research has demonstrated the potential of multifractal models to enhance investment strategies and improve portfolio performance [35,36,37,38,39]. Specifically, multifractal frameworks have improved risk estimation metrics such as Value-at-Risk (VaR) by providing more accurate assessments of extreme market events [40,41,42,43]. Additionally, asymmetric Hurst exponents have been incorporated into Deep Learning models for volatility forecasting [44], and multifactor volatility forecasts have shown promise in enhancing portfolio management [39,45,46,47]. Furthermore, recent advances have integrated asymmetric fractality into the Black–Litterman model, enhancing portfolio profitability relative to traditional methods [48]. Multifractal models have also been successfully employed in forecasting daily stock index return variations [49].
Applications of Multifractal Detrended Cross-Correlation Analysis (MF-DCCA) have further expanded into studying the interrelationships among assets. For example, recent research has used MF-DCCA to investigate the cross-correlations between gold and representative green and sustainable stocks in the U.S. and Europe, revealing significant multifractal properties and nonlinear dependencies [50].
In sum, multifractal analysis provides a robust and flexible framework for investigating the complex dynamics of financial markets across diverse asset classes. By applying this methodology to semiconductor stocks and their interactions with major financial assets, this study contributes to a deeper understanding of market complexity, cross-asset relationships, and the implications for investors and policymakers.
The novelty of this research lies in several aspects. First, it represents one of the pioneering efforts to apply Multifractal Asymmetric Detrended Cross-Correlation Analysis (MF-ADCCA) to semiconductor stocks, providing new insights into their inter-asset dynamics with key financial instruments. Second, it explores the multifractal interactions between semiconductor stocks and other major financial assets, shedding light on critical inter-market dependencies and potential contagion channels. Third, it employs the width of the multifractal spectrum as an indicator of market inefficiency and complexity within the semiconductor sector—a perspective scarcely addressed in the existing literature. Finally, the findings offer valuable evidence for investors and policymakers regarding the risk characteristics and investment potential of semiconductor stocks in increasingly complex and volatile market environments.
The remainder of this paper is organized as follows: Section 2 outlines the Materials and Methods, describing the theoretical foundations of the MF-ADCCA methodology. Section 3 presents the Data Selection and Description, summarizing the selected semiconductor stocks and major financial assets along with their main statistical features. Section 4 offers a comprehensive analysis of the multifractal cross-correlations between the selected assets and discusses the key empirical findings. Finally, Section 5 concludes with a discussion of the main results and their implications.

2. Materials and Methods

This study utilizes the Multifractal Asymmetric Detrended Cross-Correlation Analysis (MF-ADCCA), a robust method for examining the multifractal cross-correlation properties between semiconductor stocks and major financial assets, considering both upward and downward price trends. The Multifractal Detrended Cross-Correlation Analysis (MF-DCCA), introduced by Zhou [51], builds on two foundational techniques: Multifractal Detrended Fluctuation Analysis (MF-DFA), developed by Kantelhardt et al. [52], and Detrended Cross-Correlation Analysis (DCCA), proposed by Podobnik and Stanley [53]. MF-DCCA is designed to capture long-range dependencies and shared multifractal structures between pairs of datasets, making it particularly suited for investigating interactions between financial assets or economic variables. Further advancements were made by Cao et al., who integrated MF-DCCA with Asymmetric Detrended Fluctuation Analysis (A-DFA), originally introduced by Alvarez-Ramirez et al. [54], resulting in the development of MF-ADCCA. This enhanced framework enables the examination of cross-correlations in nonstationary time series, while also accounting for asymmetric behaviors that emerge under different market trends.
The Multifractal Asymmetric Detrended Cross-Correlation Analysis methodology involves seven key steps:
1.
Profile Construction
Given a time series x i and y i , both of length N, the profiles are computed as:
X ( i ) = t = 1 i ( x t x ¯ ) , i = 1 , , N
Y ( i ) = t = 1 i ( y t y ¯ ) , i = 1 , , N
where x ¯ and y ¯ represent the mean of each time series.
2.
Segmentation of the Profiles
The profiles X ( i ) and Y ( i ) are divided into N s = [ N / s ] non-overlapping segments of equal length s. To ensure that all data points are included—since N is not necessarily an exact multiple of s—the same segmentation procedure is repeated from the end of each series. As a result, a total of 2 N s segments are obtained for each time series.
3.
Local Trend Removal
For each segment, the local trend X v ( i ) or Y v ( i ) , depending on the time series, is estimated using a least-squares polynomial fit. The detrended variance is then calculated as: for v = 1 , , N s
f 2 ( v , s ) = 1 s i = 1 s [ X ( ( v 1 ) s + i ) X v ( I ) ] [ Y ( ( v 1 ) s + i ) Y v ( i ) ]
and for v = N s + 1 , , 2 N s
f 2 ( v , s ) = 1 s i = 1 s [ X ( N ( v N s ) s + i ) X v ( I ) ] [ Y ( N ( v N s ) s + i ) Y v ( i ) ]
4.
Computation of the Fluctuation Function
The fluctuation function of order q is computed as:
F q ( s ) = 1 2 N s v = 1 2 N s [ f 2 ( v , s ) ] q / 2 1 / q , q 0
F 0 ( s ) = e x p 1 4 N s v = 1 2 N s l n [ f 2 ( v , s ) ] , q = 0
5.
Determination of Scaling Behavior
The fluctuation function follows a power-law relationship:
F q ( s ) s H x y ( q )
where H x y ( q ) is the generalized Hurst exponent. The series exhibits multifractal properties if H x y ( q ) varies with q.
6.
Determination of asymmetric multifractal behavior
Furthermore, the asymmetric multifractal behavior is analyzed by comparing scaling properties for the positive and negative trends of the main financial assets separately. This approach helps identify whether trends behave differently in upward versus downward market conditions. The trend is adjusted for each segment I v ( i ) = a i v + b i v i ( 1 , , s ) . The direction or trend is the sign of the slope b i v , indicating an upward or downward price trend.
F q + ( s ) = 1 M + v = 1 2 N s 1 + s g n ( b i v ) 2 [ f 2 ( v , s ) ] q / 2 1 / q , q 0
F q ( s ) = 1 M v = 1 2 N s 1 s g n ( b i v ) 2 [ f 2 ( v , s ) ] q / 2 1 / q , q 0
and
F 0 + ( s ) = e x p 1 2 M + v = 1 2 N s 1 + s g n ( b i v ) 2 l n [ f 2 ( v , s ) ] , q = 0
F 0 ( s ) = e x p 1 2 M v = 1 2 N s 1 s g n ( b i v ) 2 l n [ f 2 ( v , s ) ] , q = 0
where M + and M denote the total number of segments with positive and negative trends, respectively.
7.
Determination of Multifractal spectra and singularity exponent
The singularity exponent ( α ) is determined using Equation (12) in conjunction with the Legendre transformation (Equation (13)). This transformation plays a crucial role in characterizing the local scaling properties of a time series by relating the multifractal spectrum to the generalized Hurst exponent. Once the singularity exponent is obtained, the Rényi exponent ( τ ( q ) ) and the multifractal spectrum can be computed using Equation (14). The multifractal spectrum provides a comprehensive representation of the complexity and heterogeneity of the analyzed financial time series.
Furthermore, the formulation of the multifractal spectrum can be rewritten in an equivalent form, as shown in Equation (15), which facilitates a more intuitive interpretation of the results.
τ ( q ) = q H x y ( q ) 1
α = d τ / d q
f ( α ) = q α τ ( q )
f ( α ) = q ( α H x y ( q ) ) + 1
The degree of multifractality ( Δ H ) is defined as the difference between H x y ( q min ) and H x y ( q max ) , providing a quantitative measure of the strength of multifractality. Here, q min and q max represent the minimum and maximum values of the q range considered in the analysis. A higher multifractal degree indicates a greater degree of multifractality, suggesting a more complex and heterogeneous structure in the underlying time series, where multiple scaling behaviors coexist. The degree of multifractality in a time series can also be quantified using the singularity spectrum width ( Δ α ), which provides insight into the complexity and heterogeneity of the system’s scaling properties. The singularity spectrum width is defined as the difference between the maximum and minimum values of the singularity exponent, given by Δ α = α max α min , where α max and α min correspond to the values of α at the maximum and minimum support of the multifractal spectrum, respectively.
The α 0 is the maximum of the multifractal spectrum f ( α ) . This value corresponds to the most probable singularity strength in the analyzed time series and is associated with the dominant scaling behavior of the system. In other words, α 0 characterizes the typical Hölder regularity of the time series, reflecting its most frequent local scaling exponent. In financial time series analysis, α 0 provides valuable insight into the degree of correlation and complexity of price movements.
By applying the MF-ADCCA method to semiconductor stock prices, this study seeks to uncover complex price dynamics, evaluate the degree of market efficiency, and offer deeper insights into risk management and investment strategies within this high-growth sector. Figure 1 outlines the methodological framework employed in this study.

3. Data Selection and Description

For this study, four major semiconductor stocks were selected based on their market relevance and expert recommendations. Specifically, the three top-performing semiconductor stocks recommended by Forbes on December 2024 (https://www.forbes.com/sites/investor-hub/article/best-semiconductor-stocks/ accessed on 27 February 2025), along with the traditionally significant Intel Corporation, were included. The selected stocks are Nvidia (NVDA), Advanced Micro Devices (AMD), Broadcom Inc. (AVGO), and Intel (INTC).
To analyze the multifractal cross-correlation behavior of these semiconductor stocks in a broader financial context, a diverse set of financial assets was selected. The selection aimed to capture interactions with various asset classes, including stock indices, exchange rates, commodities, and cryptocurrencies. The Dow Jones Industrial Average (DJIA) was chosen to represent the overall U.S. stock market. Gold was included as a traditional safe-haven asset. The EUR/USD exchange rate was selected to reflect currency market dynamics, while crude oil was considered to capture the behavior of energy-related commodities. Finally, Bitcoin (BTC) was included due to its growing relevance in financial markets and its technological association with the semiconductor sector. Thus, the key financial assets are:
1.
Dow Jones Industrial Average (DJI)—representing the main stock index.
2.
Gold (XAU)—a low-risk, safe-haven commodity.
3.
EUR/USD (EUR)—the primary exchange rate.
4.
Crude oil (WTI)—a key energy commodity.
5.
Bitcoin (BTC)—the dominant cryptocurrency.
The analysis covers the period from 2 January 2015 to 29 January 2025, comprising 2535 daily observations. All data were sourced from www.investing.com.
At the beginning of the analysis period (Figure 2), Intel (INTC) was the most expensive stock, maintaining a relatively stable price until mid-2020, after which it entered a downward trend, ultimately becoming the lowest-valued stock among the four by the end of the period. Advanced Micro Devices (AMD) experienced significant price growth from mid-2018, peaking at approximately USD 100 by the end of 2021, followed by a decline to around USD 50 by late 2022. It then resumed an upward trajectory, reaching USD 220 in early 2024, before declining to USD 120 at the close of the analysis period. Nvidia (NVDA) exhibited strong growth starting in early 2020, culminating in a peak above USD 240 by late 2024. Broadcom (AVGO) remained relatively stable for most of the period, only initiating a sustained upward trend in late 2022, closing the analysis period above USD 120.
About the main financial assets (Figure 3), the Dow Jones Industrial Average (DJI) remained relatively stable during the first two years of the analysis period. It then entered an upward trend, which was abruptly interrupted by the COVID-19 pandemic in March 2020, causing a sharp decline. Following this drop, the index began a steady recovery until the end of 2021, after which it stabilized through 2023. A new upward trend emerged in 2024, ultimately pushing the index above 14,000 points.
The gold market (XAU) exhibited a pattern similar to the DJI in the early years of the analysis. However, during the COVID-19 crisis, gold was immediately sought as a safe-haven asset, leading to a pronounced upward trend that surpassed USD 2700 per ounce.
The EUR/USD exchange rate remained relatively stable at the beginning of the analysis period. In 2017, it began an upward trend, reaching 1.30 USD/EUR in early 2018. This was followed by a decline until the onset of COVID-19 in March 2020. Afterward, the euro appreciated, exceeding 1.21 USD/EUR by mid-2021, before declining again until the end of 2022, briefly reaching parity (1.00 USD/EUR). Subsequently, it fluctuated between 1.00 and 1.12 USD/EUR.
Crude oil (WTI) exhibited substantial price fluctuations during the study period. A significant drop occurred in the second quarter of 2020 due to COVID-19, reaching historically low levels. This was followed by a recovery, peaking in Q2 2022, after which prices stabilized within a USD 60 to USD 100 range.
Bitcoin (BTC) experienced a sharp peak at the end of 2017, followed by stabilization around USD 10,000 per BTC. At the end of 2020, BTC entered a strong upward trend, reaching a new peak in Q2 2021, before declining and partially recovering with another peak toward the end of 2021. A subsequent downward trend brought its price below USD 20,000, but it later rebounded, surpassing the USD 100,000 mark by the end of 2024.
These distinct price behaviors among the selected financial assets justify their inclusion in the multifractal analysis. If all assets had exhibited similar patterns, a single representative asset would have sufficed for the study. By analyzing a diverse set of financial instruments, this research ensures a comprehensive assessment of multifractal dynamics across different market sectors.
This comparative analysis provides insight into the evolving financial dynamics of the semiconductor sector in relation to key global financials. The daily return or price variation r t was calculated according to Equation (16).
r t = ln ( P t / P t 1 )
where P t is the price on day t and P t 1 is the price of the previous day.
A statistical analysis of the price returns for all time series over the full study period is presented in Table 1. All semiconductor stocks reported positive mean returns, except for Intel (INTC). Among them, Nvidia (NVDA) achieved the highest average return, significantly outperforming both Advanced Micro Devices (AMD) and Broadcom Inc. (AVGO). However, NVDA also exhibited the highest standard deviation, reflecting its elevated volatility alongside substantial price appreciation.
For the main financial assets, all exhibited a positive mean return over the analysis period, except for the EUR/USD exchange rate (EUR). However, the average returns for these assets were generally lower than those of NVDA, AMD, and AVGO, with the exception of Bitcoin (BTC), whose mean return was comparable to that of NVDA.
Regarding the correlation among all price return time series over the full study period (Table 2), the highest correlation among semiconductor stocks was observed between AMD and AVGO (0.37). Among the semiconductor stocks and major financial assets, AMD exhibited the strongest correlations, particularly with Bitcoin (BTC), crude oil (WTI), and gold (XAU). The correlation between AMD and BTC may be attributed to the interconnection between the cryptocurrency market and semiconductor technology, given the reliance on high-performance processors for cryptocurrency mining. Similarly, the observed correlation between AMD and gold could reflect investors’ perception of cryptocurrencies as an alternative hedge against market risks—traditionally a role held by gold.

4. Analysis of Results

The initial analysis applied the Qcc test to assess the presence of cross-correlation between the time series of each semiconductor stock and those of the major financial assets [55,56]. Figure 4 presents the Qcc results for a degrees of freedom (m) range up to 250.
The findings indicate that all semiconductor stocks exhibit cross-correlation with DJI, XAU, and BTC across the entire m range. In the case of EUR, cross-correlation was observed for all semiconductor stocks except AVGO, which exhibited no cross-correlation for m greater than 80.
For WTI, both AVGO and INTC displayed cross-correlation across the entire m range. AMD exhibited cross-correlation only for m values below 200, while NVDA showed cross-correlation for m values below 40 and within the range of 85 to 160.
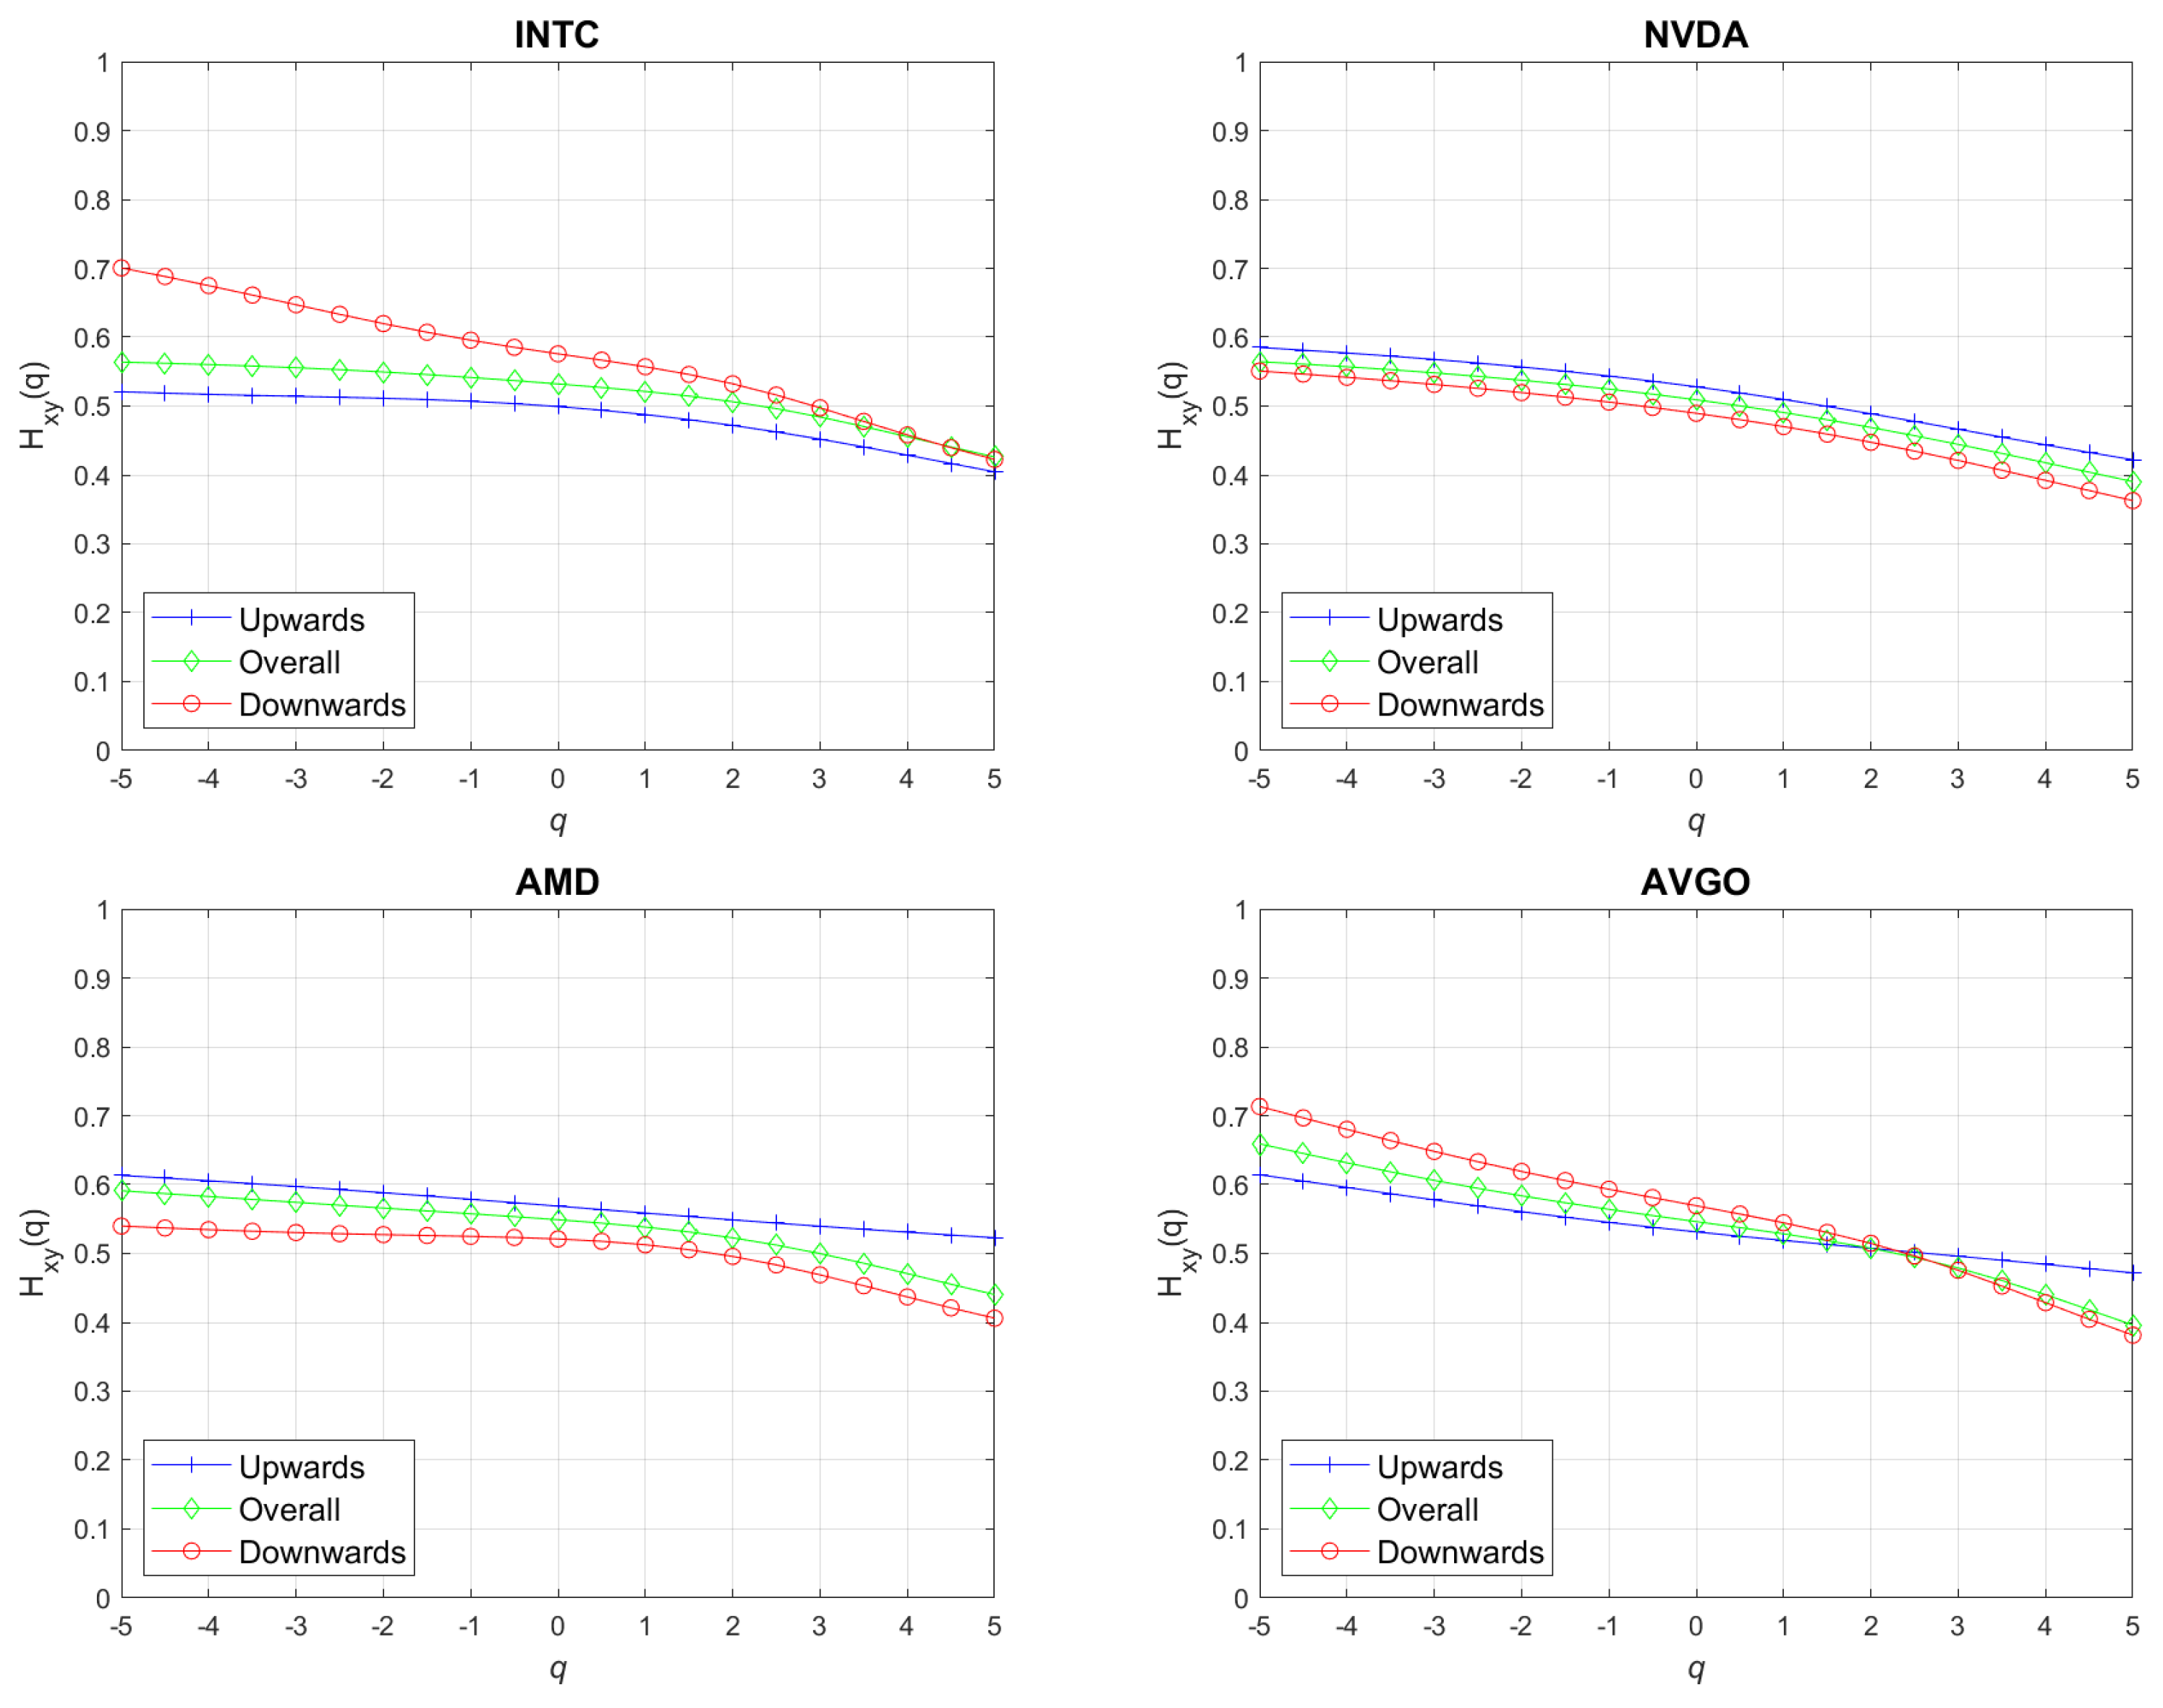
The generalized cross-correlation Hurst exponent and multifractal spectrum were analyzed to evaluate the presence of multifractal behavior in the series. A third-order polynomial was used for the detrending process. The existence of multifractality is indicated by variability in the generalized Hurst exponent across the analyzed range of q. The analysis was conducted over a q range from –5 to 5, in accordance with the number of observations available. As illustrated in Figure 5, all time series exhibit clear variation across this range, confirming the presence of multifractality. Moreover, the generalized Hurst exponents display a monotonically decreasing trend with increasing q values, suggesting long-term positive correlation in periods of smaller fluctuations and diminished persistence as fluctuations grow larger.
Table 3 highlights differences in the multifractal degree across semiconductor stocks and key financial assets. Among all stocks, the highest multifractality was observed in pairs involving BTC. Specifically, NVDA exhibited the highest multifractality when paired with DJI, WTI, and BTC, whereas AVGO showed the highest degree of multifractality in relation to XAU and EUR. In contrast, AMD consistently displayed the lowest multifractality across all financial asset pairs.
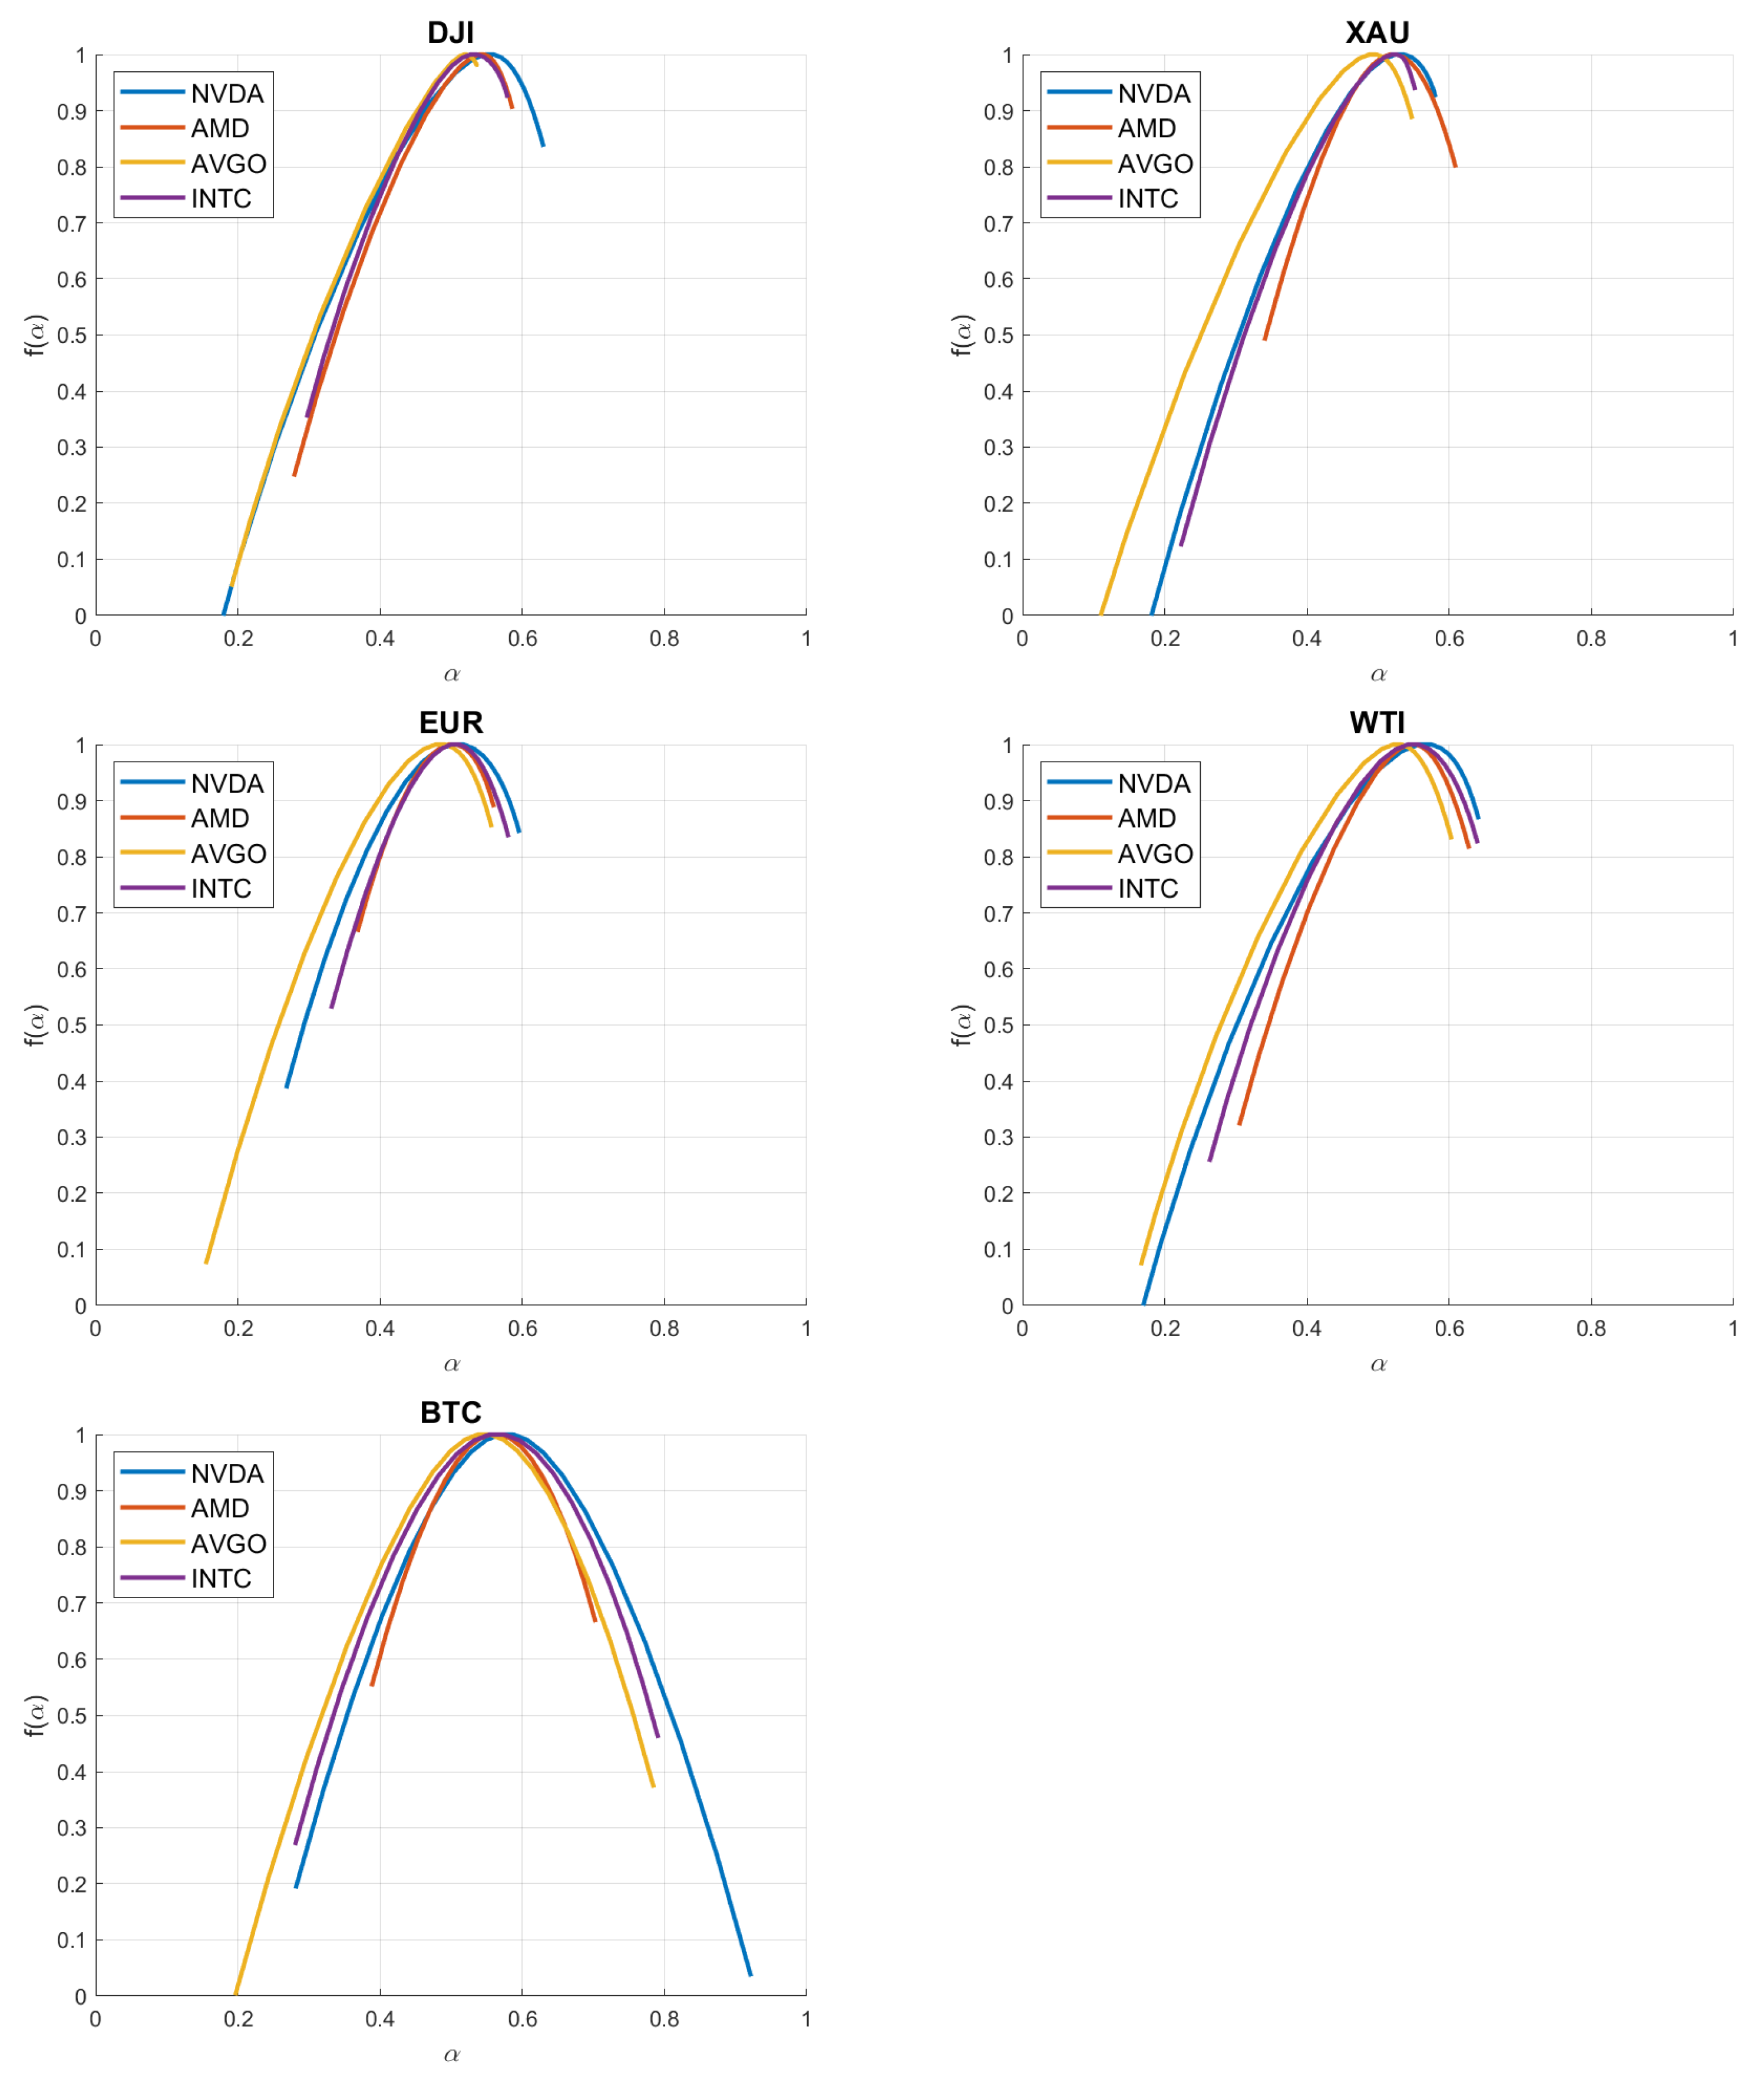
This analysis of the multifractal spectra, presented in Figure 6 and Table 4, reveals a consistent inverse parabolic shape across all examined asset pairs, confirming the presence of multifractality. The results indicate that NVDA and AVGO exhibit larger multifractal spectra in relation to DJI, XAU, WTI, and BTC, suggesting a more pronounced multifractal behavior. When considering EUR, this pattern is observed only for AVGO.
A notable asymmetry is present in the spectra of semiconductor stock pairs with DJI, XAU, EUR, and WTI, where the left side of the curve extends significantly further than the right. This suggests that high fluctuation values predominantly contribute to multifractality in these cases. In contrast, semiconductor stocks paired with BTC display more symmetric spectra, indicating that multifractality arises from a broader range of fluctuation intensities rather than being driven solely by extreme events. These findings highlight the varying influences of different market conditions on the complexity of semiconductor stocks, with certain assets amplifying multifractal behavior more than others.
The analysis of α 0 (Table 4) across all pairs reveals a consistent range between 0.50 and 0.55, suggesting a relatively stable multifractal structure. Among these, EUR-related pairs exhibit the lowest α 0 values, indicating a more correlated and less complex structure, whereas BTC-related pairs display the highest values, reflecting a finer structure with weaker correlations.
Notably, AVGO-related pairs consistently register the lowest α 0 values across all cases. This suggests that AVGO exhibits stronger correlations and a less intricate multifractal composition compared to the other semiconductor stocks. These findings imply that the degree of correlation and structural complexity in multifractal behavior varies depending on the reference asset, with BTC-related pairs showing greater independence and EUR-related pairs being more structurally constrained.
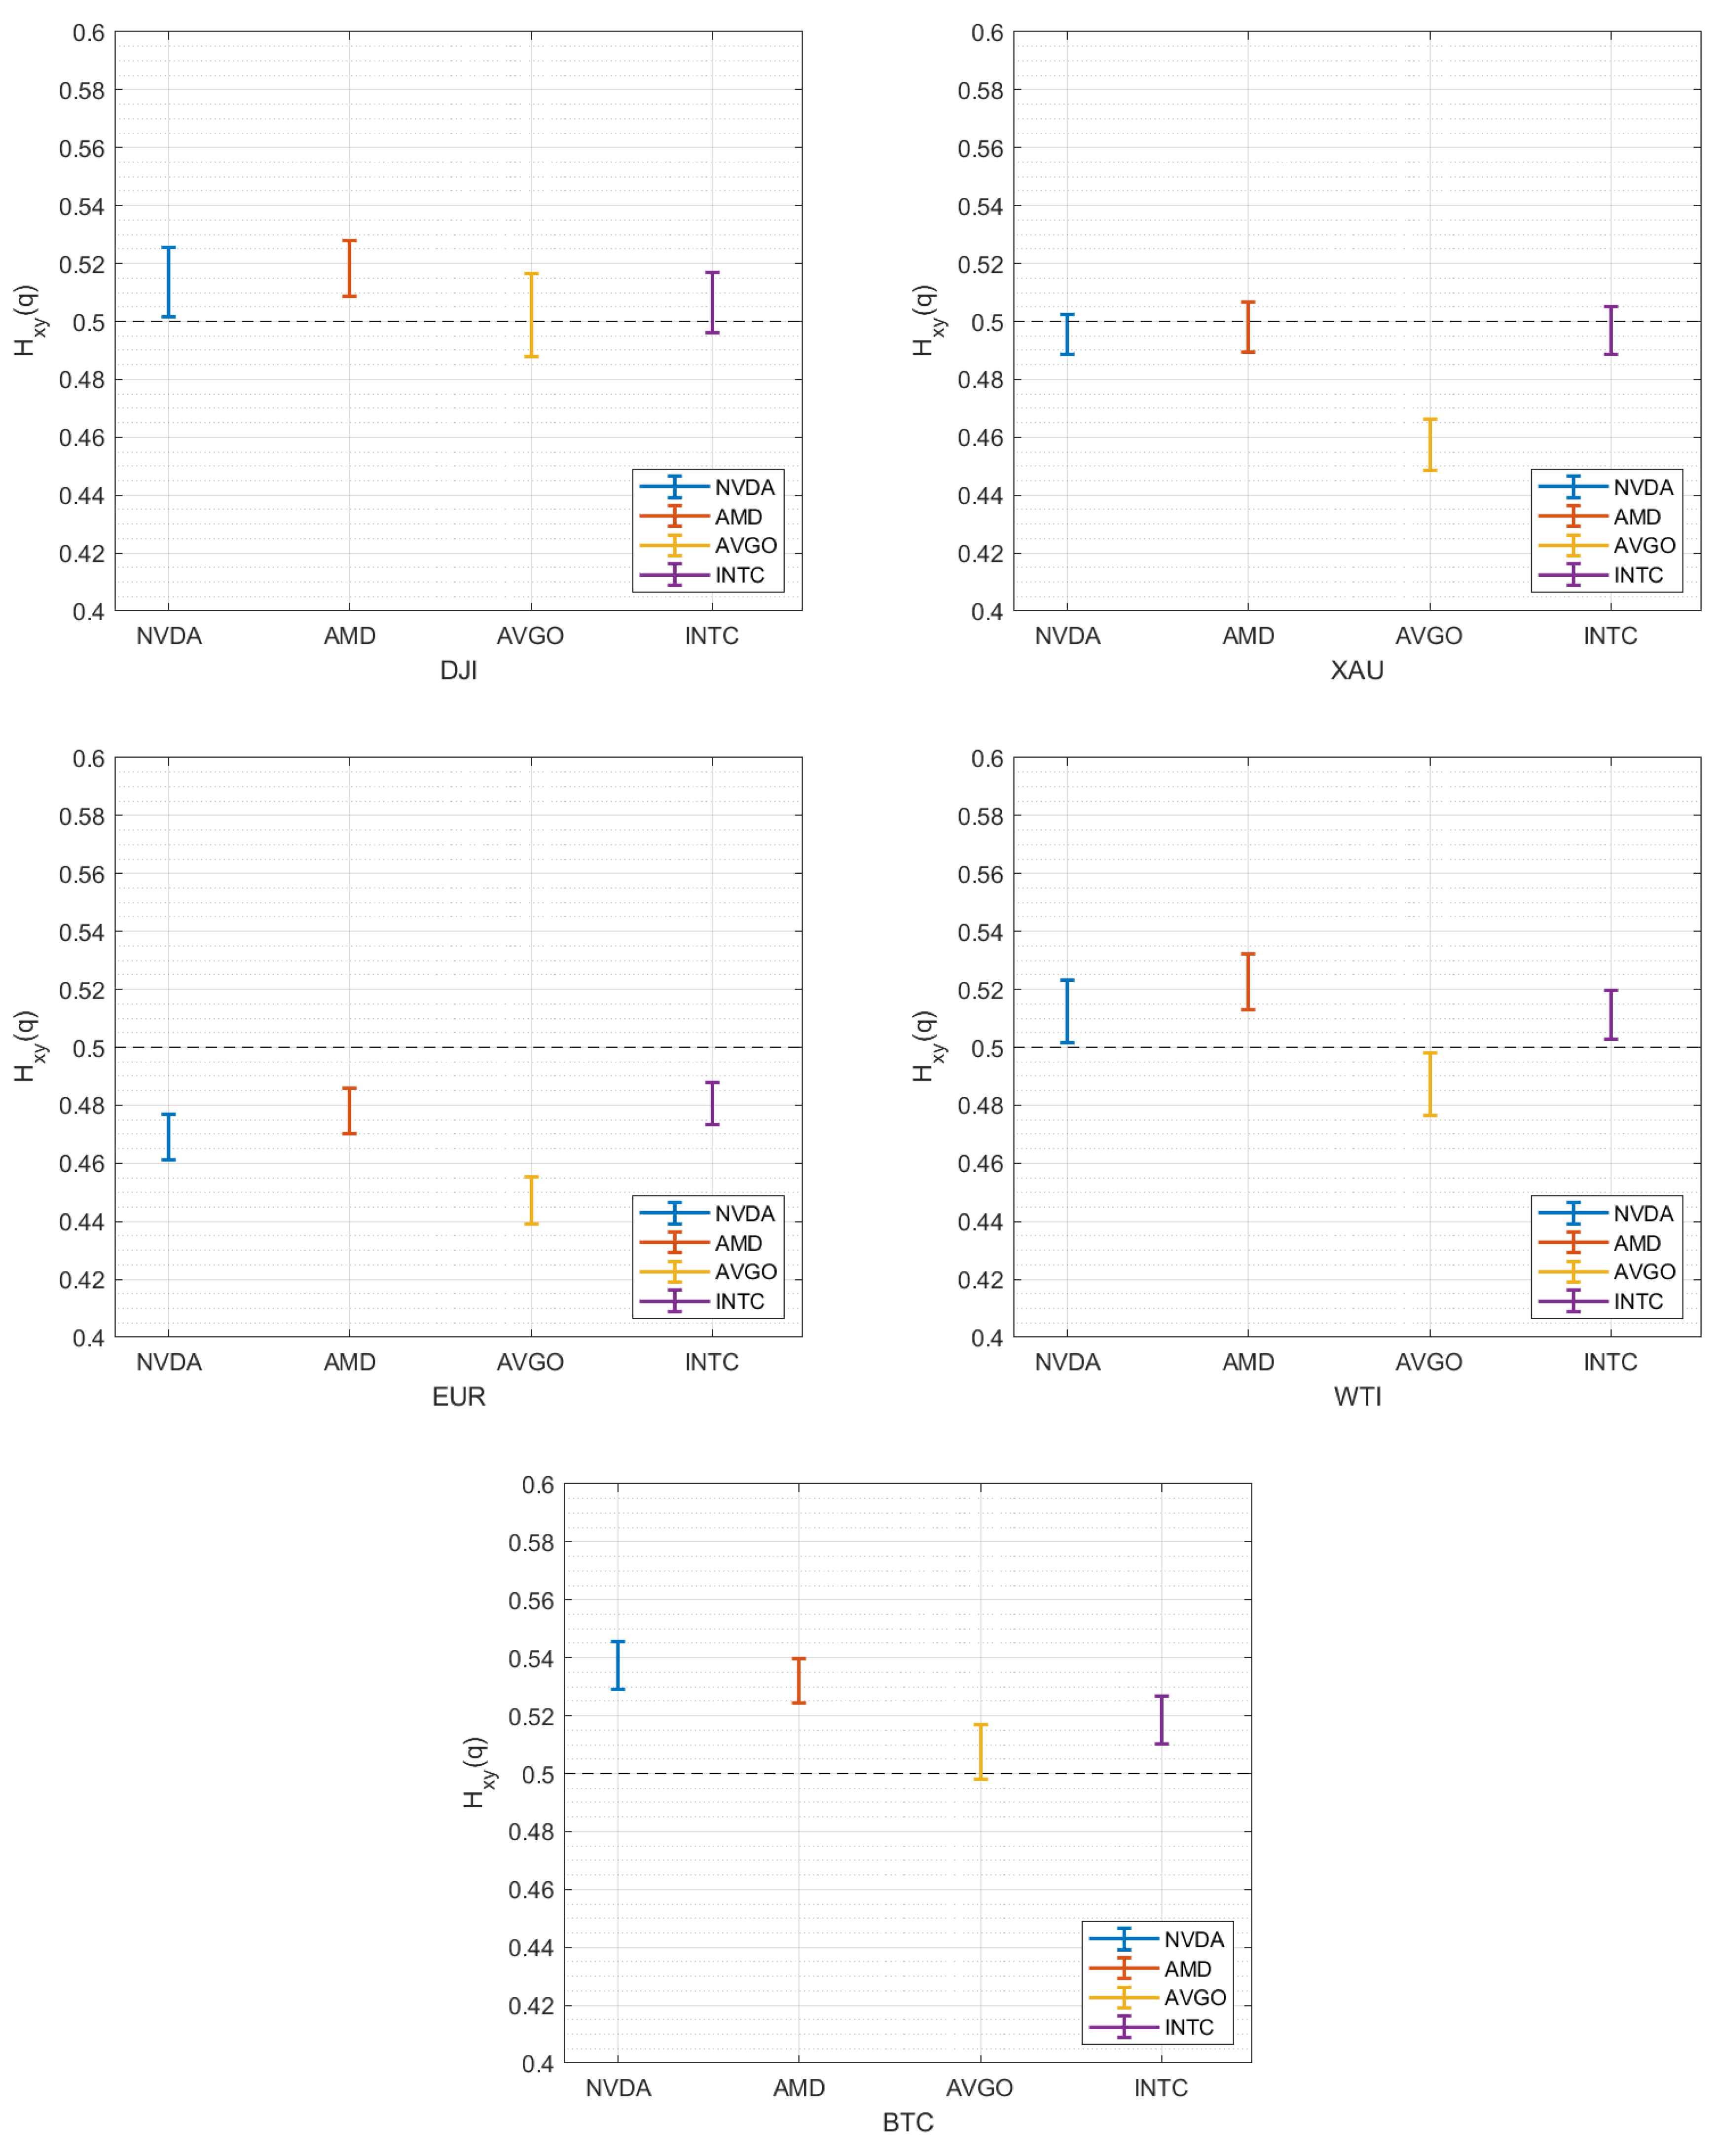
A deeper analysis of the Hurst exponent, along with its 95% confidence intervals, is presented in Figure 7, which outlines the Hurst exponent values for each pair. An analysis of the Hurst exponent and its confidence interval for pairs associated with the DJI reveals notable patterns. NVDA and AMD exhibit persistent behavior, indicating that these stocks follow trends over time. In contrast, AVGO and INTC demonstrate characteristics consistent with a random walk, suggesting that past prices have little influence on future price movements, thereby indicating a lack of long-term memory or trends.
Regarding the semiconductor stocks and their relationship with the price of XAU, a predominantly random behavior was observed across all stocks. However, AVGO stands out with an anti-persistent behavior, meaning that price changes tend to reverse over time, reflecting a tendency for prices to alternate in a back-and-forth manner rather than continue in the same direction.
An intriguing trend is seen in the EUR-related pairs, where all the semiconductor stocks analyzed show a Hurst exponent value of less than zero. This indicates that these stocks exhibit anti-persistent behavior in relation to the Euro, suggesting that upward price movements are often followed by downward movements and vice versa, in contrast to persistent trends.
When considering the relationship between semiconductor stocks and WTI, persistent behavior is predominantly observed across the board. This indicates a tendency for prices to maintain trends over time, except for AVGO, which again displays an anti-persistent behavior. Similarly, in the case of BTC, all stocks except for AVGO exhibit persistent behavior. However, AVGO in this context demonstrates a Brownian motion-like behavior, characterized by random, unpredictable price movements without a clear directional trend.
In summary, AVGO consistently exhibits the lowest Hurst exponents across all the stocks analyzed, indicating a tendency toward anti-persistent behavior in three of the five cases (XAU, EUR, WTI). This suggests that Broadcom’s stock price movements are more prone to reversals rather than continuation. On the other hand, NVDA and AMD show persistent behavior in three out of the five cases (DJI, WTI, and BTC), indicating a stronger tendency for trend-following dynamics in their respective price movements.
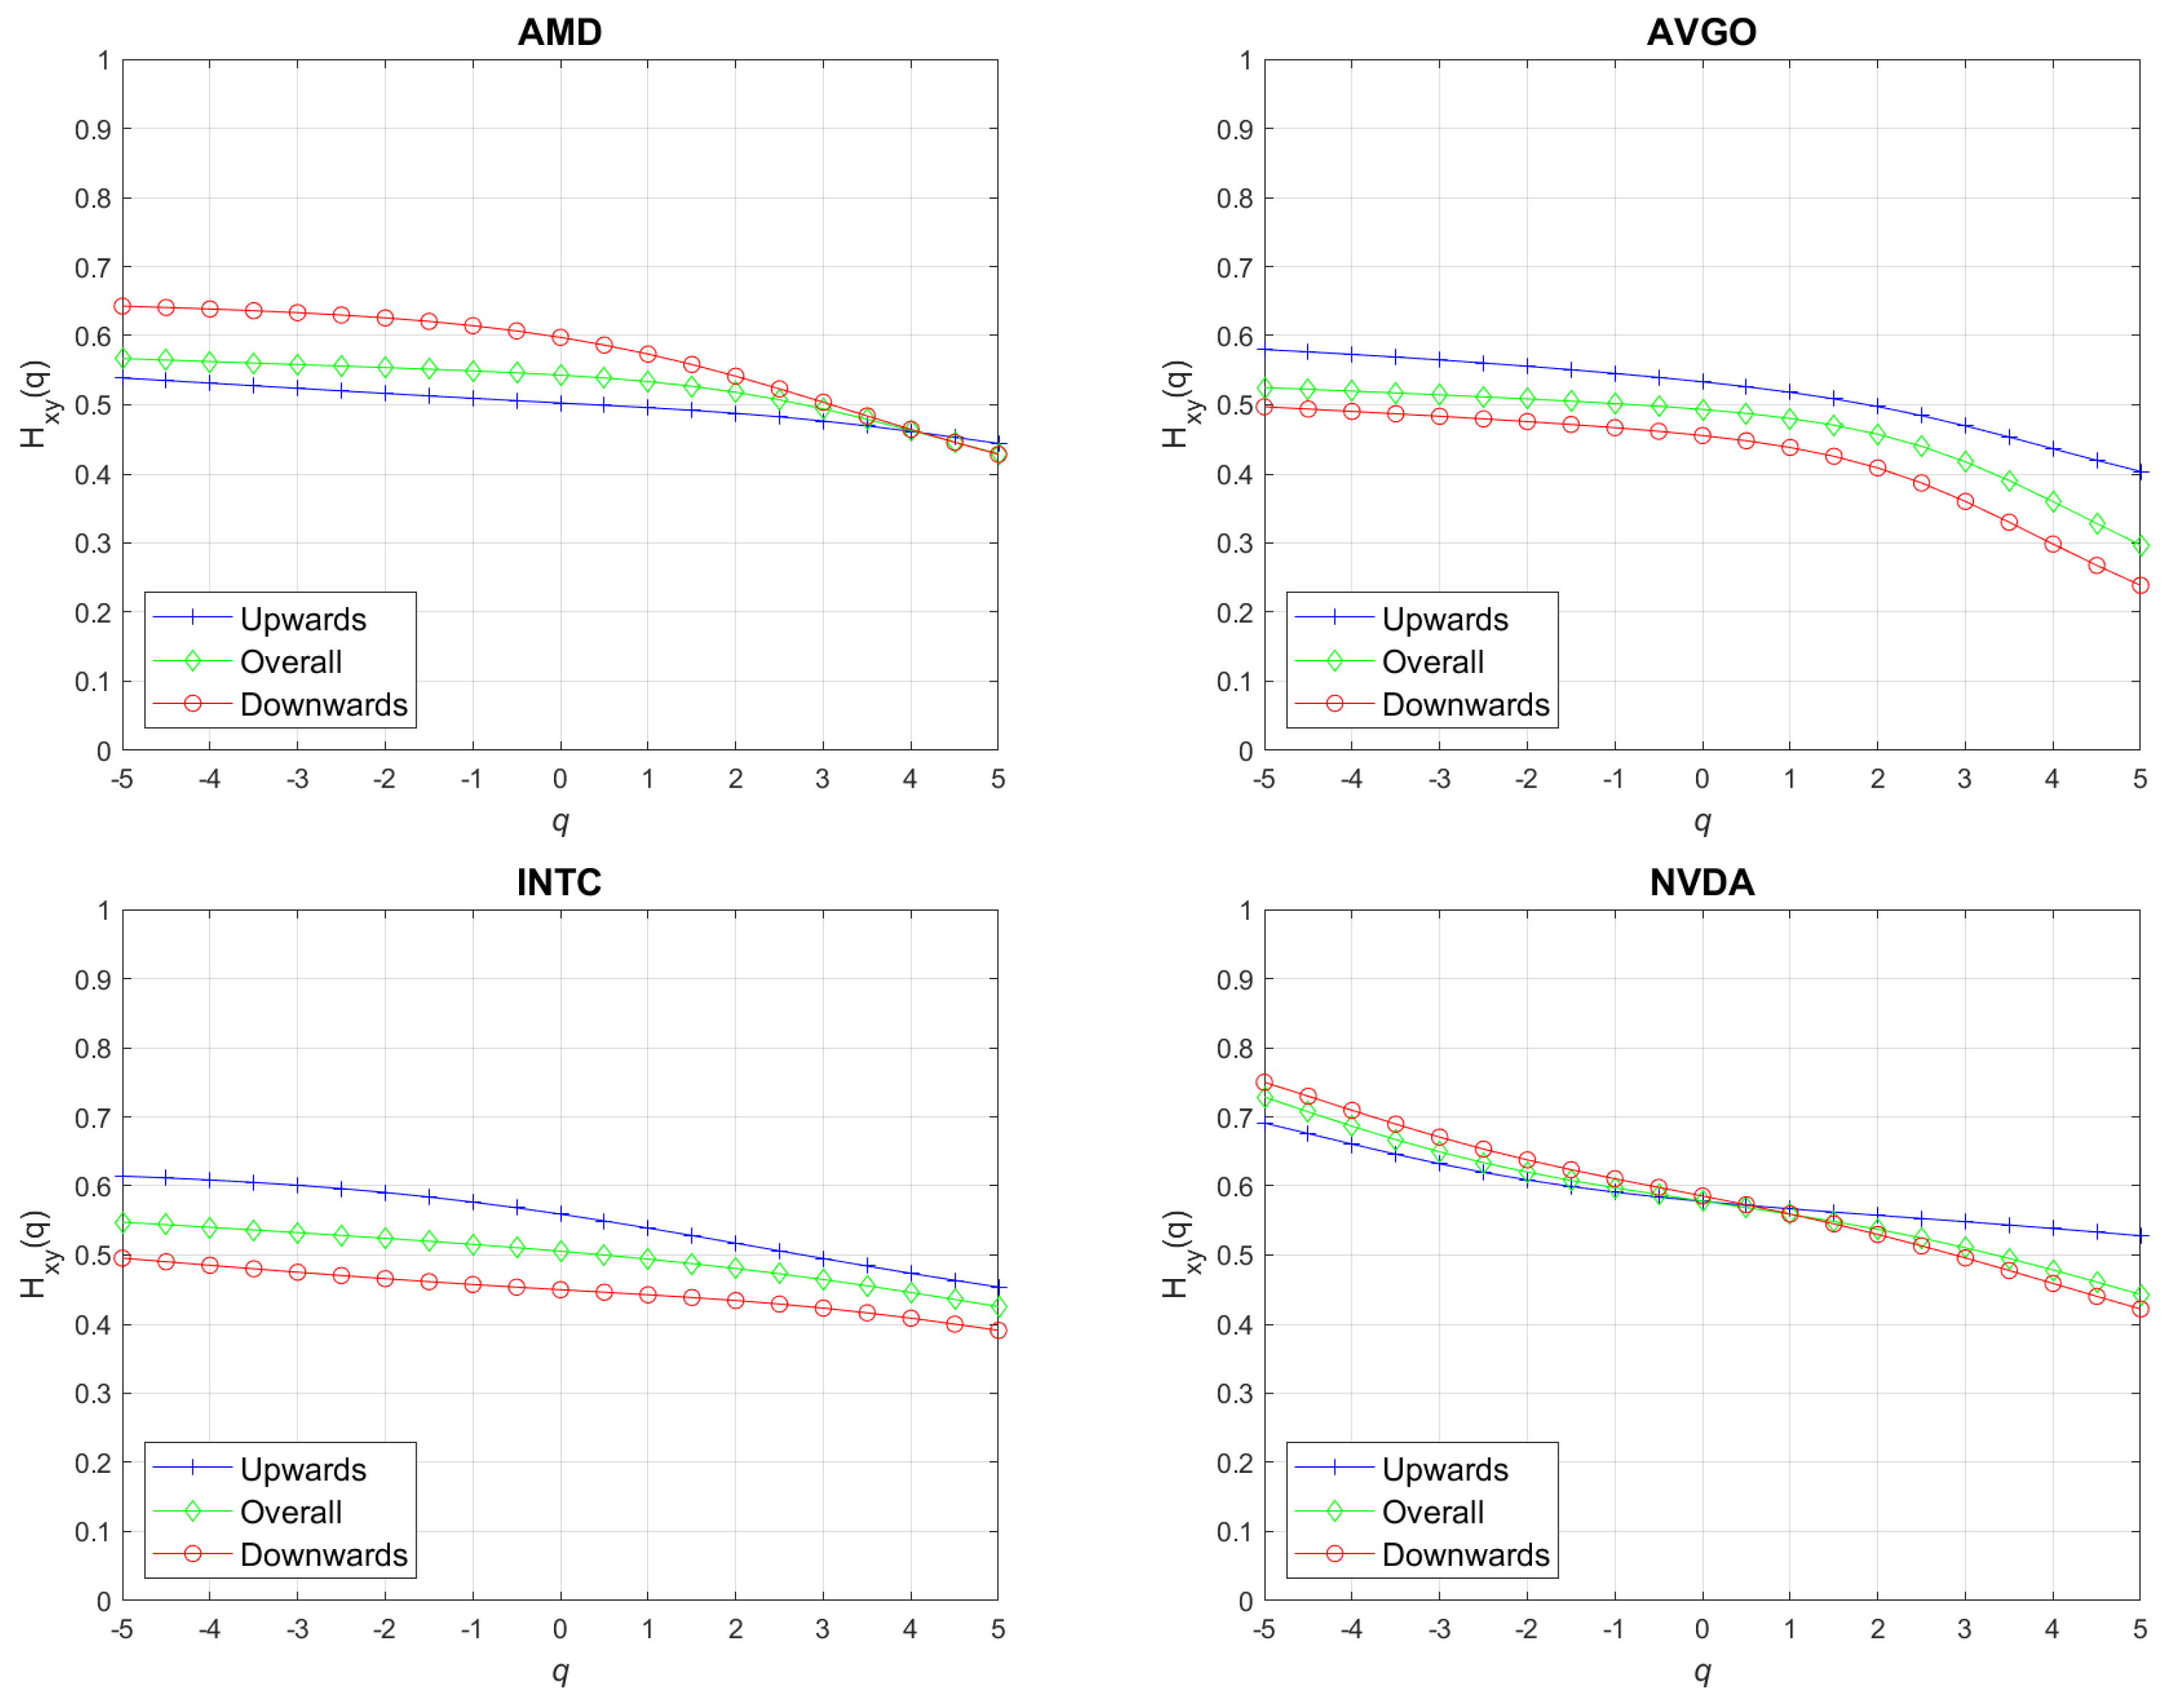
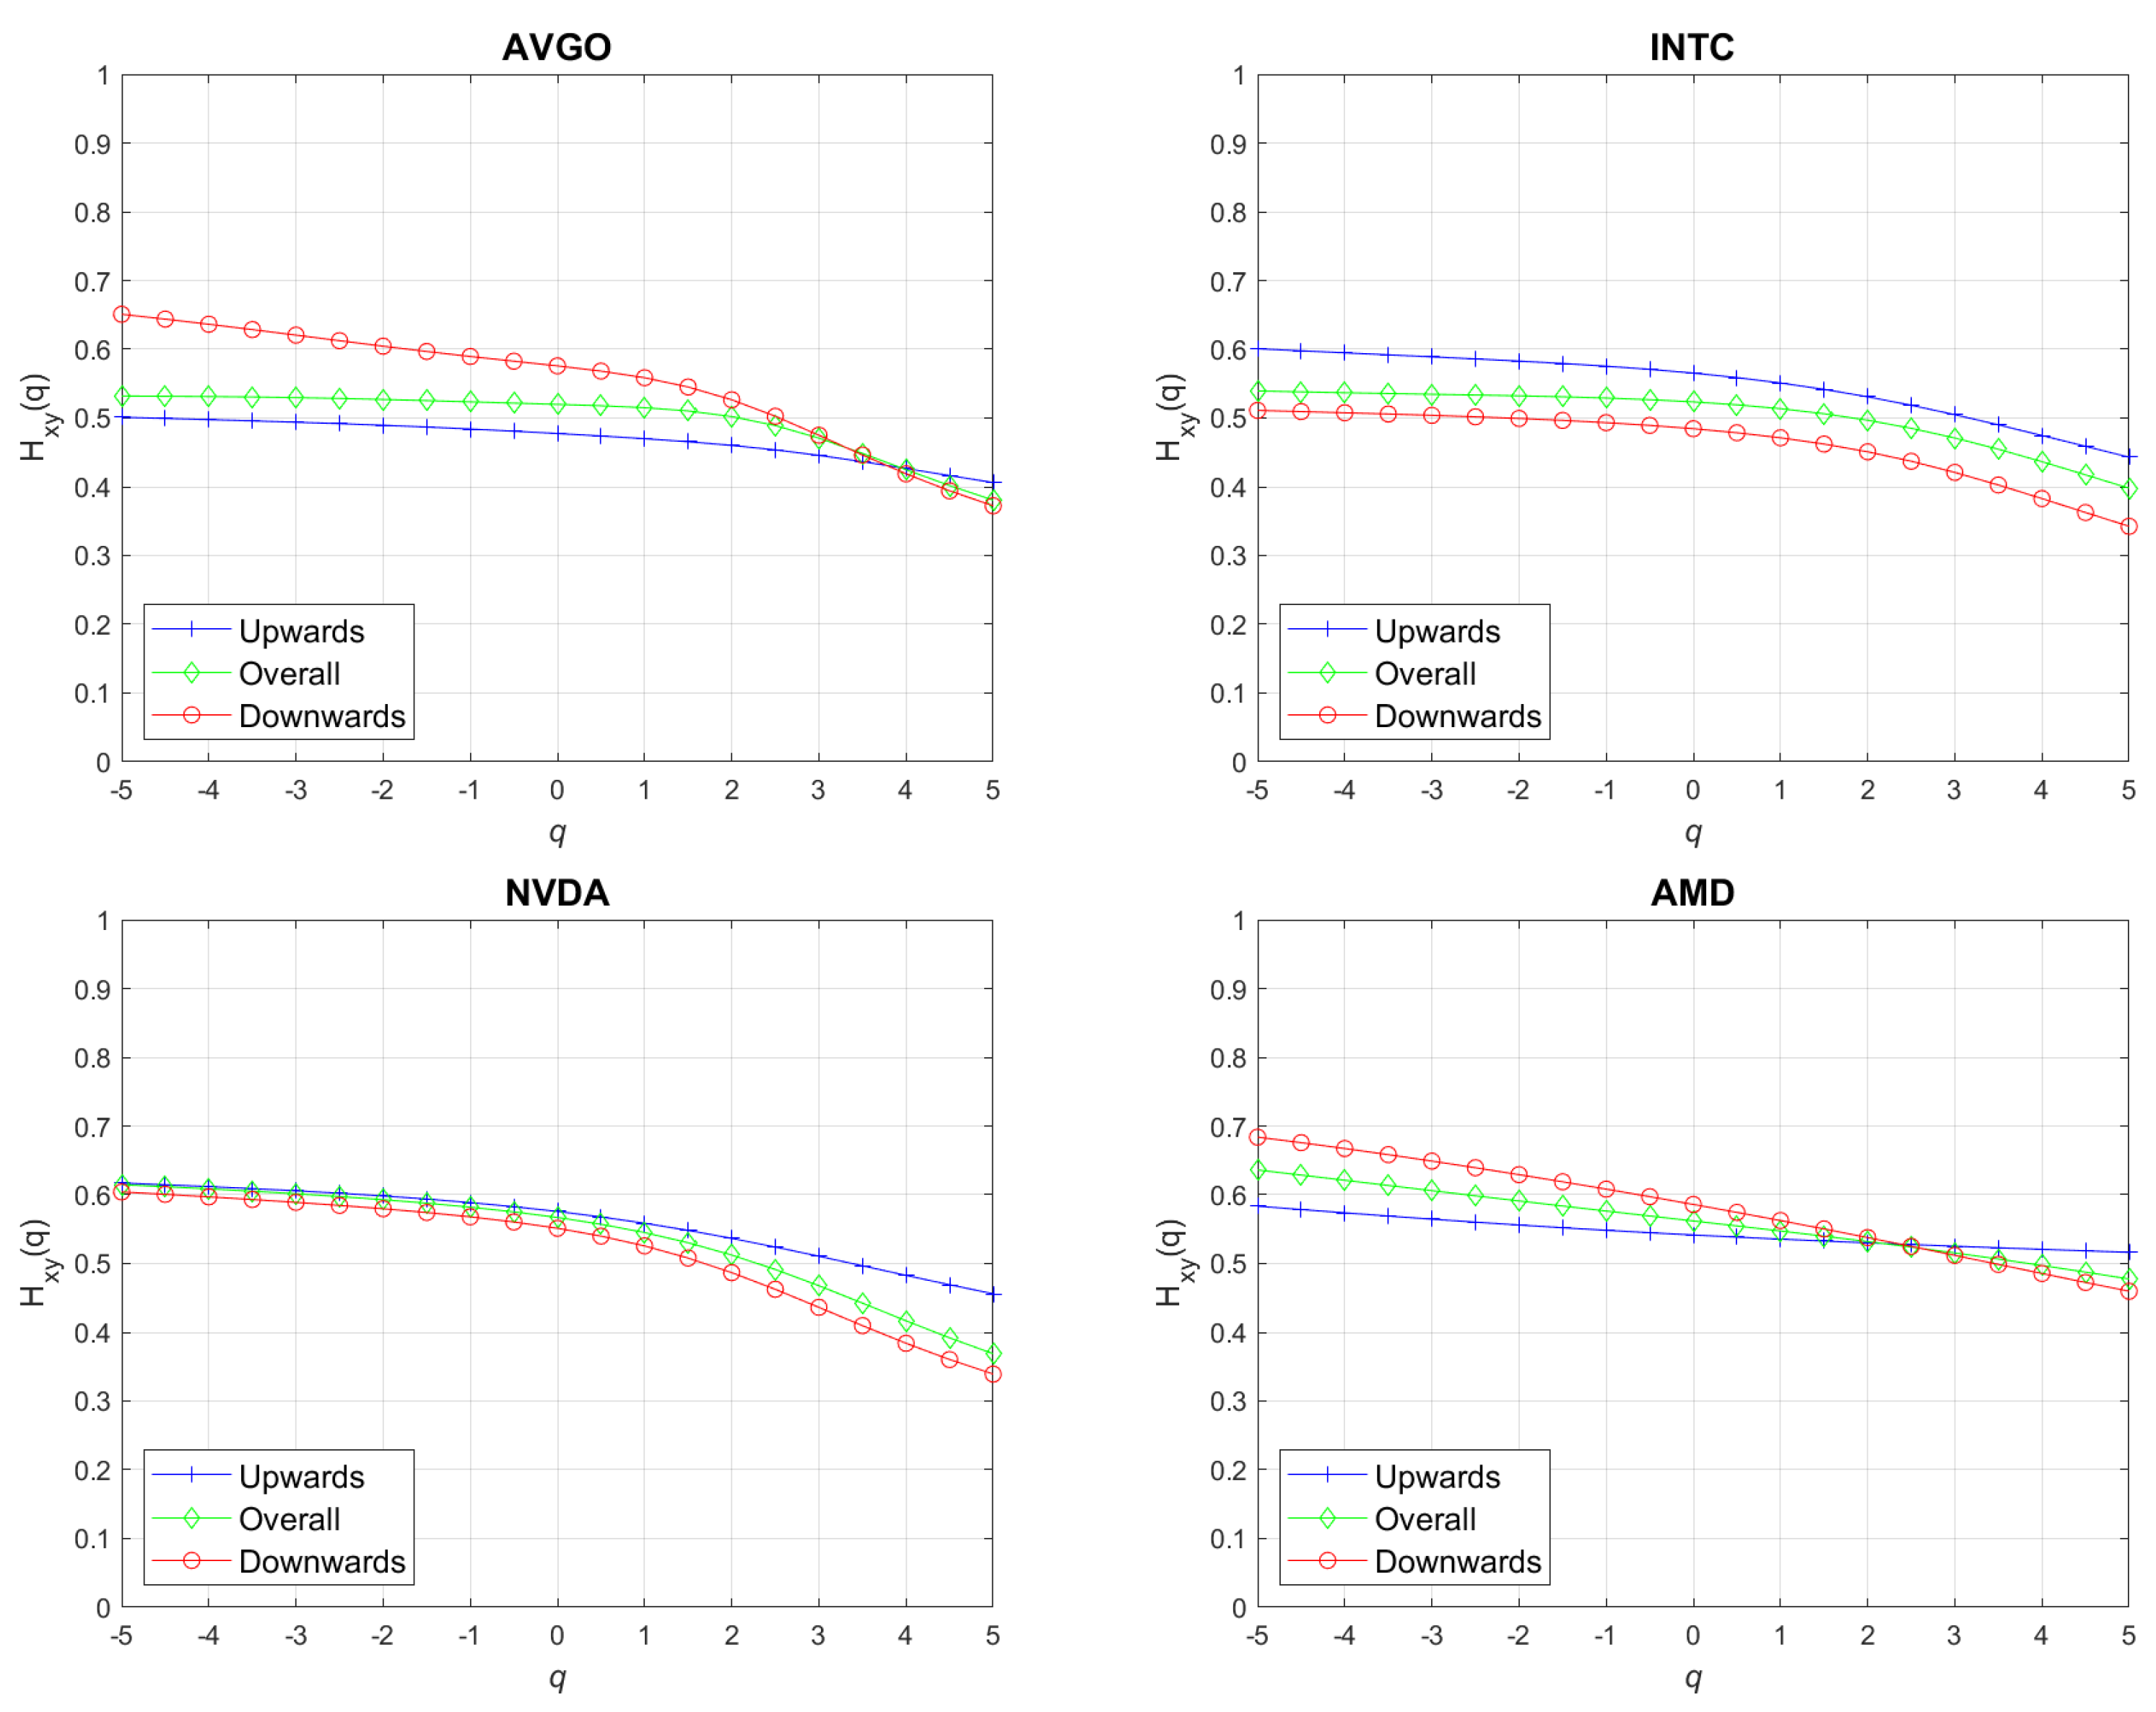
An insightful perspective from an investor’s viewpoint involves determining the multifractal behavior of stocks under different trends in the major financial assets. Figure 8, Figure 9, Figure 10, Figure 11 and Figure 12 present the analysis of asymmetric cross-correlation under both upward and downward trends of these key financial assets. This approach highlights how the behavior of individual stocks may vary in relation to market dynamics, particularly in response to changes in the broader market trends.
In the context of DJI (Figure 8), the analysis reveals a significant pattern. For all the stocks related to DJI, a stronger persistence was observed under the downward trend of the index. This suggests that, during market downturns, these stocks tend to exhibit more consistent trends over time. However, for larger fluctuations, this asymmetry between upward and downward trends diminishes, indicating that, under more extreme market conditions, the persistence in stock behavior weakens, and price movements become more unpredictable.
Conversely, for XAU (Figure 9), the relationship with stock performance follows an inverse pattern. A higher persistence is evident under the upward trend of XAU, suggesting that during periods of rising gold prices, these stocks tend to follow more pronounced trends. This behavior is observed across most of the stocks, except for Advanced Micro Devices (AMD), which showed no significant asymmetry, implying that AMD’s stock movements did not strongly correlate with gold price fluctuations in an upward trend.
For EUR-related pairs (Figure 10), the observed asymmetry is generally small. Stocks such as NVDA, AMD, and AVGO exhibit minimal asymmetry, while INTC shows a more pronounced asymmetry, particularly under varying market conditions. Despite the relatively small asymmetries in most cases, greater persistence was noted under the upward trend of the EUR, suggesting that these stocks tend to follow stronger trends during periods of EUR appreciation.
In relation to WTI (Figure 11), the asymmetry behavior is particularly notable for smaller fluctuations ( q < 0 ). For NVDA, AVGO, and INTC, no clear asymmetry was observed during minor fluctuations, indicating a more neutral correlation with WTI’s price changes at smaller scales. However, for larger fluctuations, a stronger persistence was observed during the upward trend of WTI, signaling that these stocks follow more persistent trends during significant oil price increases. AMD, on the other hand, displayed greater persistence during the upward trend of WTI, further emphasizing its tendency to follow upward movements in the oil market.
Finally, when analyzing BTC (Figure 12), the persistence patterns reveal some intriguing dynamics. For small fluctuations, all stocks demonstrated greater persistence under the downward trend of BTC, suggesting a tendency to move in a more synchronized manner with the broader cryptocurrency market when prices are falling. However, for larger fluctuations, the greatest persistence was observed under the upward trend of BTC, indicating that these stocks are more likely to follow sustained positive trends during periods of BTC price increases.
Regarding the degree of multifractality under the upward and downward trends of the main financial assets, Table 5 presents the results. Overall, a consistent pattern emerges across the majority of cases: the multifractal degree tends to be higher during downward trends compared to upward trends. This suggests that periods of declining prices are associated with greater complexity and stronger multifractal behavior in the cross-correlations between semiconductor stocks and key financial assets. This suggests that the stocks exhibit more complex, self-similar behavior during market downturns. Specifically, for the DJI, all stocks exhibit a noticeable increase in multifractality during downward trends. The difference is particularly pronounced for AVGO and INTC, where the multifractal degree more than doubles compared to the upward trend (from 0.0950 to 0.2785 for AVGO and from 0.1162 to 0.2780 for INTC). In the case of XAU, a similar pattern is observed. AVGO shows the most significant increase (from 0.1763 to 0.2583), while NVDA’s multifractal degree remains relatively stable between trends, indicating a lesser sensitivity of NVDA-XAU interactions to market direction.
For EUR-related pairs, the results are more mixed. While AVGO and NVDA show an increase in multifractality under downward trends, AMD and INTC present a slight reduction, suggesting that the influence of EUR on semiconductor stocks may differ depending on the stock-specific characteristics.
Regarding WTI, all four stocks display a clear increase in multifractality during downward trends. The jump is especially notable for NVDA (from 0.1610 to 0.2649), implying that oil price dynamics might have a stronger nonlinear and multifractal impact on semiconductor stocks during bearish phases.
Finally, BTC-related pairs exhibit the highest multifractal degrees among all assets during downward trends. NVDA, AVGO, and INTC, in particular, reach values above 0.32, highlighting a strong multifractal interdependence with Bitcoin during periods of market decline. This may reflect heightened systemic risk or speculative behavior linked to both cryptocurrencies and technology stocks during adverse market conditions.
In summary, the findings indicate that downward market trends amplify the multifractal characteristics of the relationships between semiconductor stocks and major financial assets, particularly with BTC, DJI, and WTI.
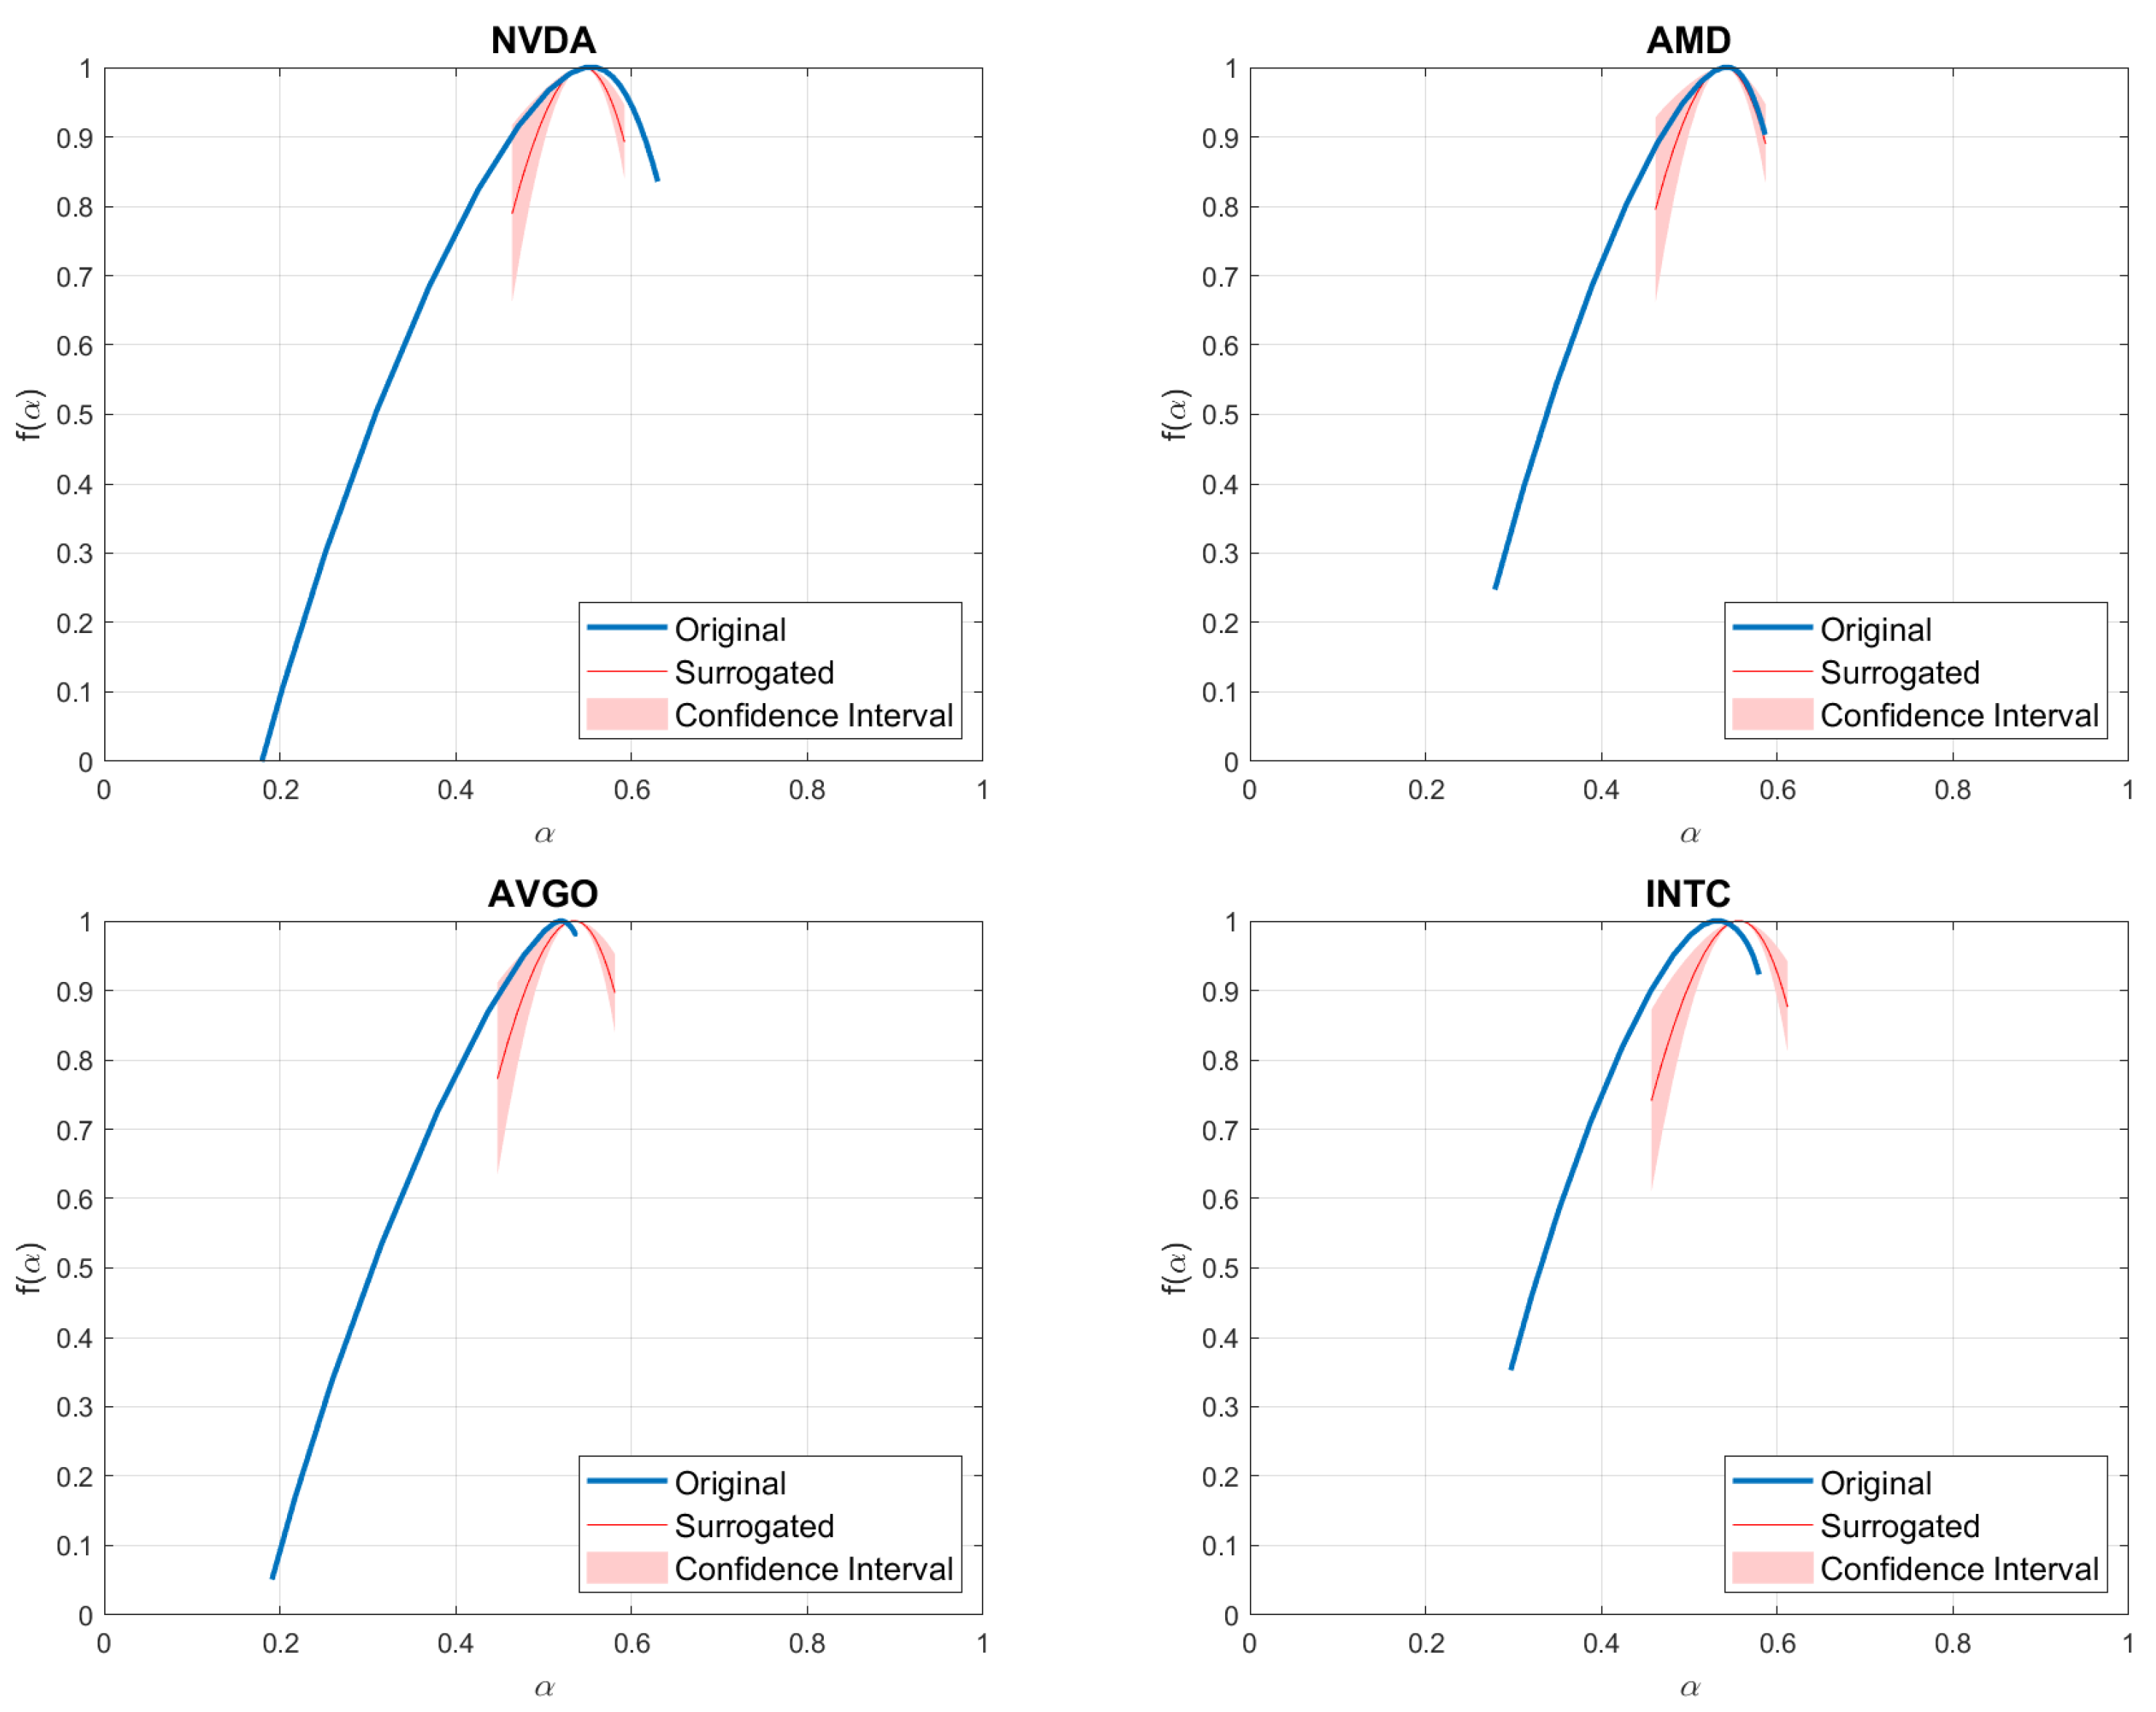
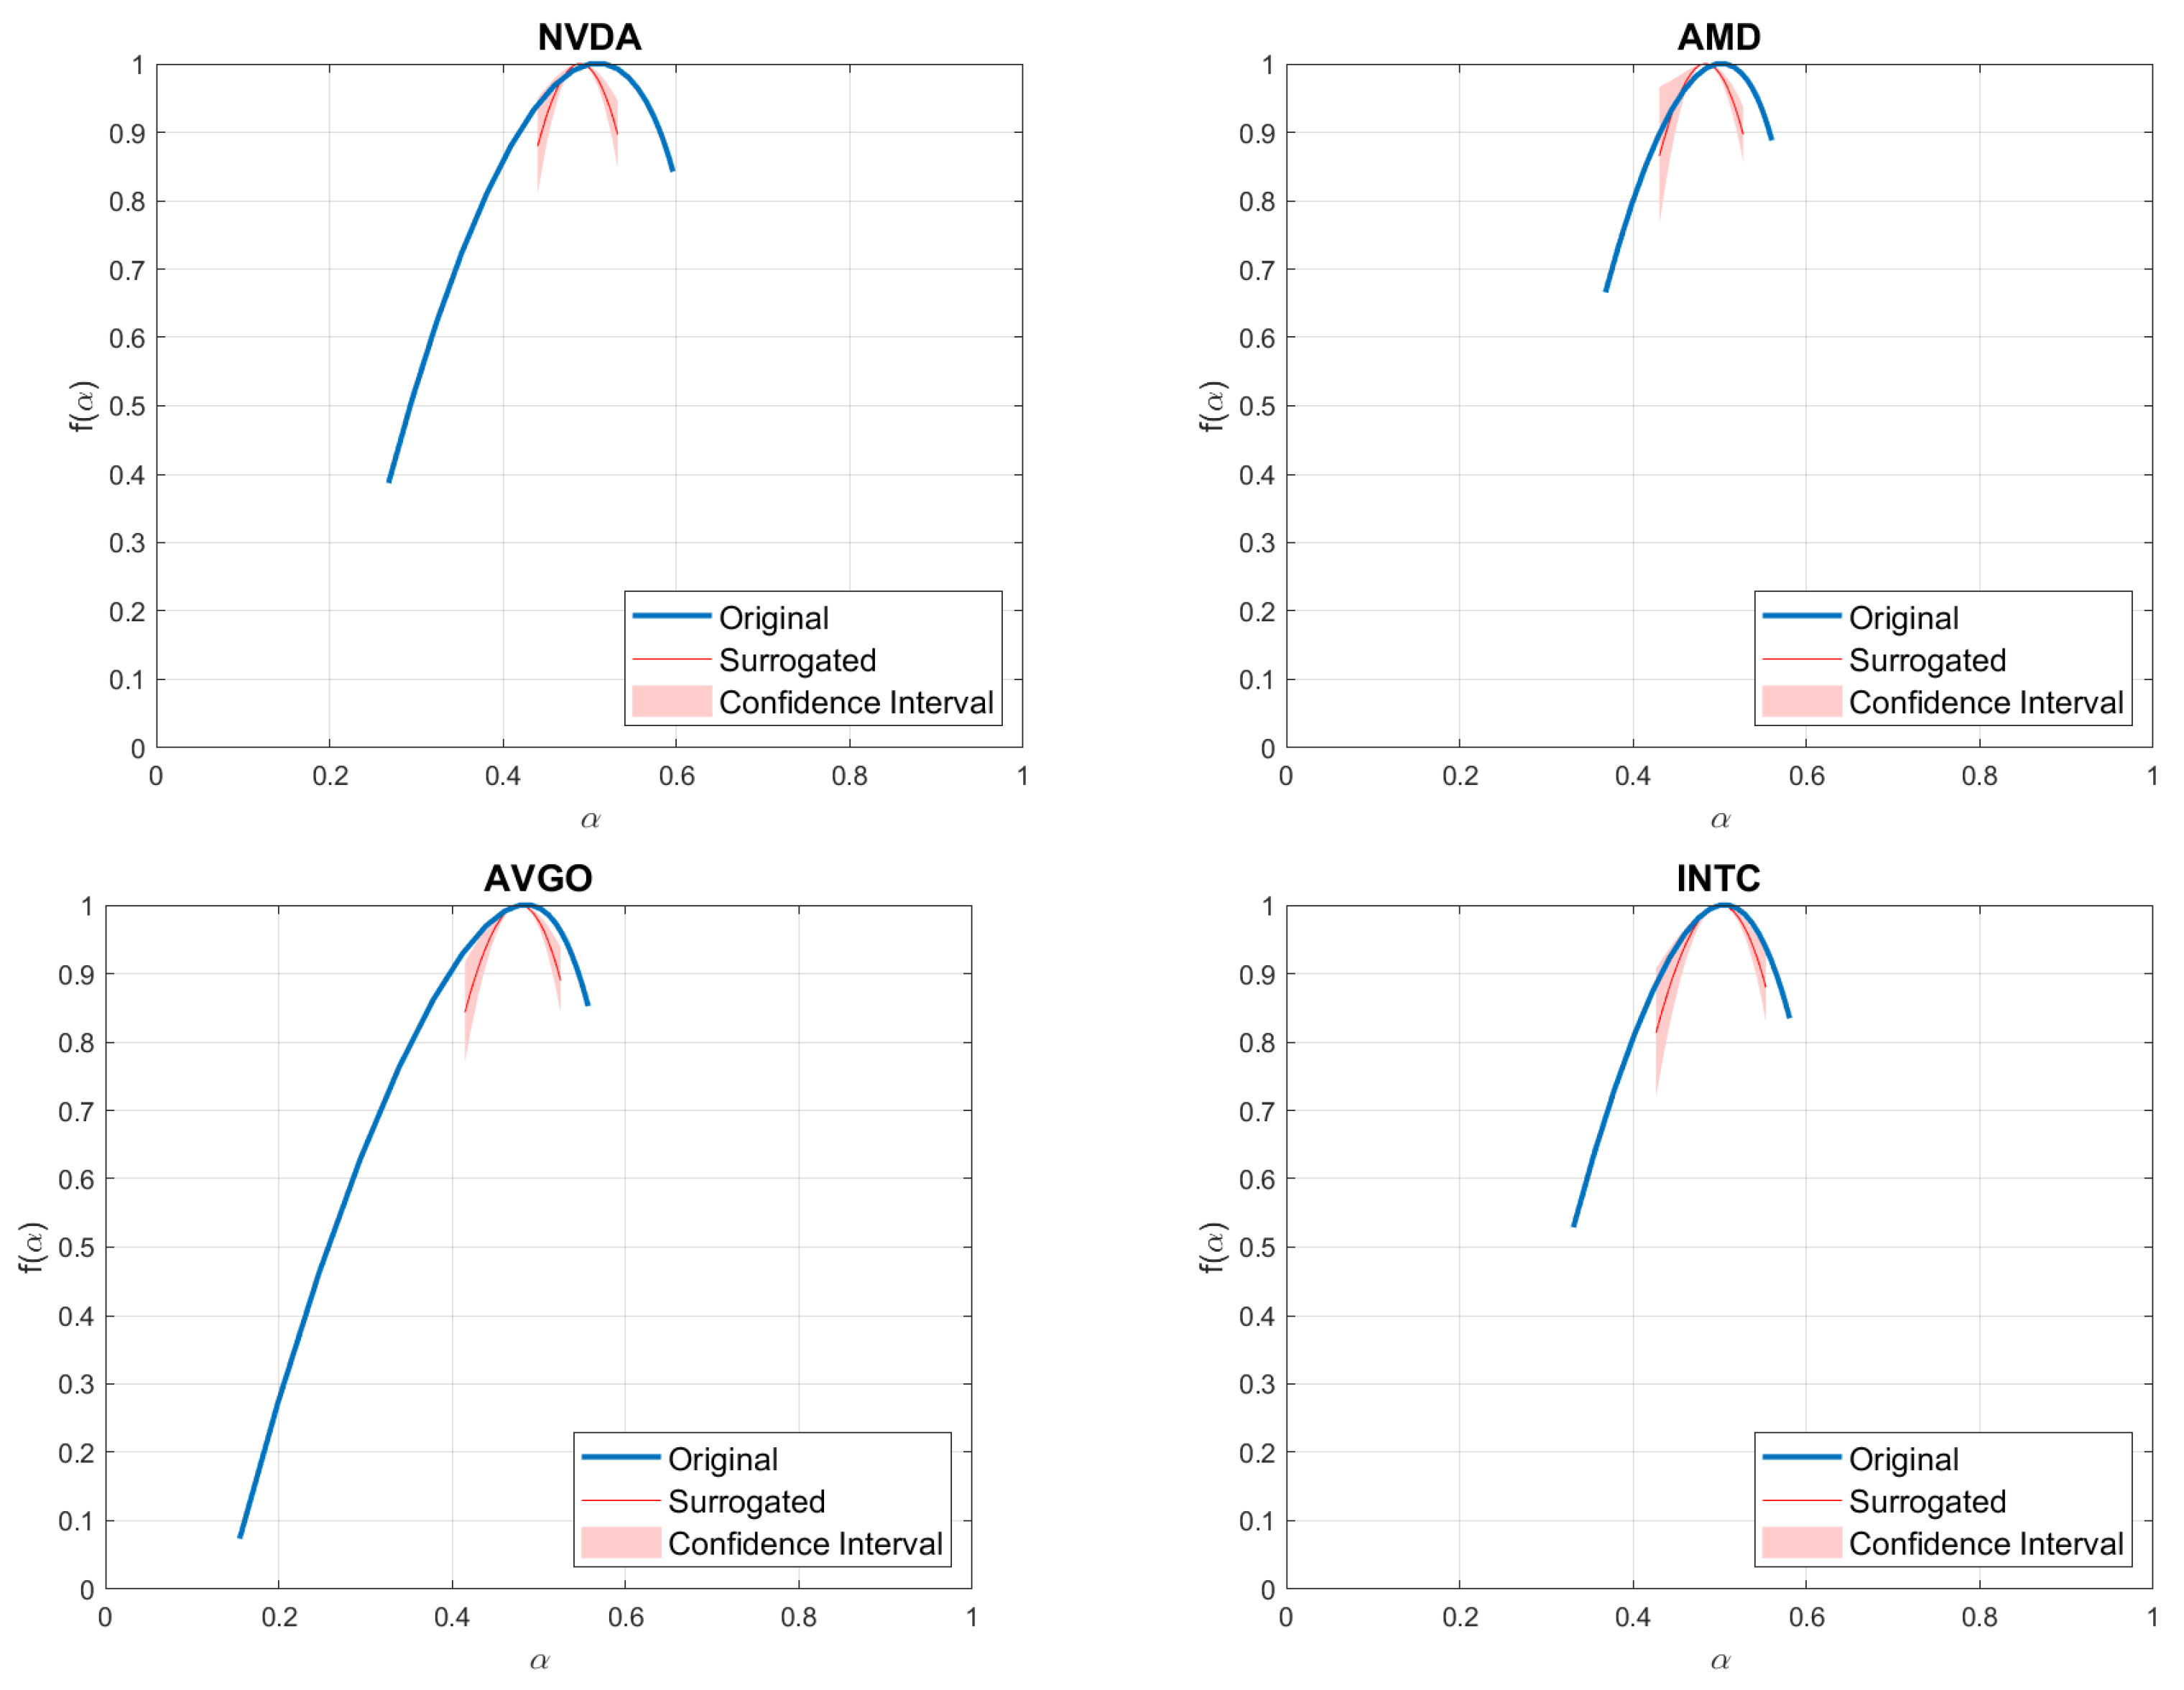
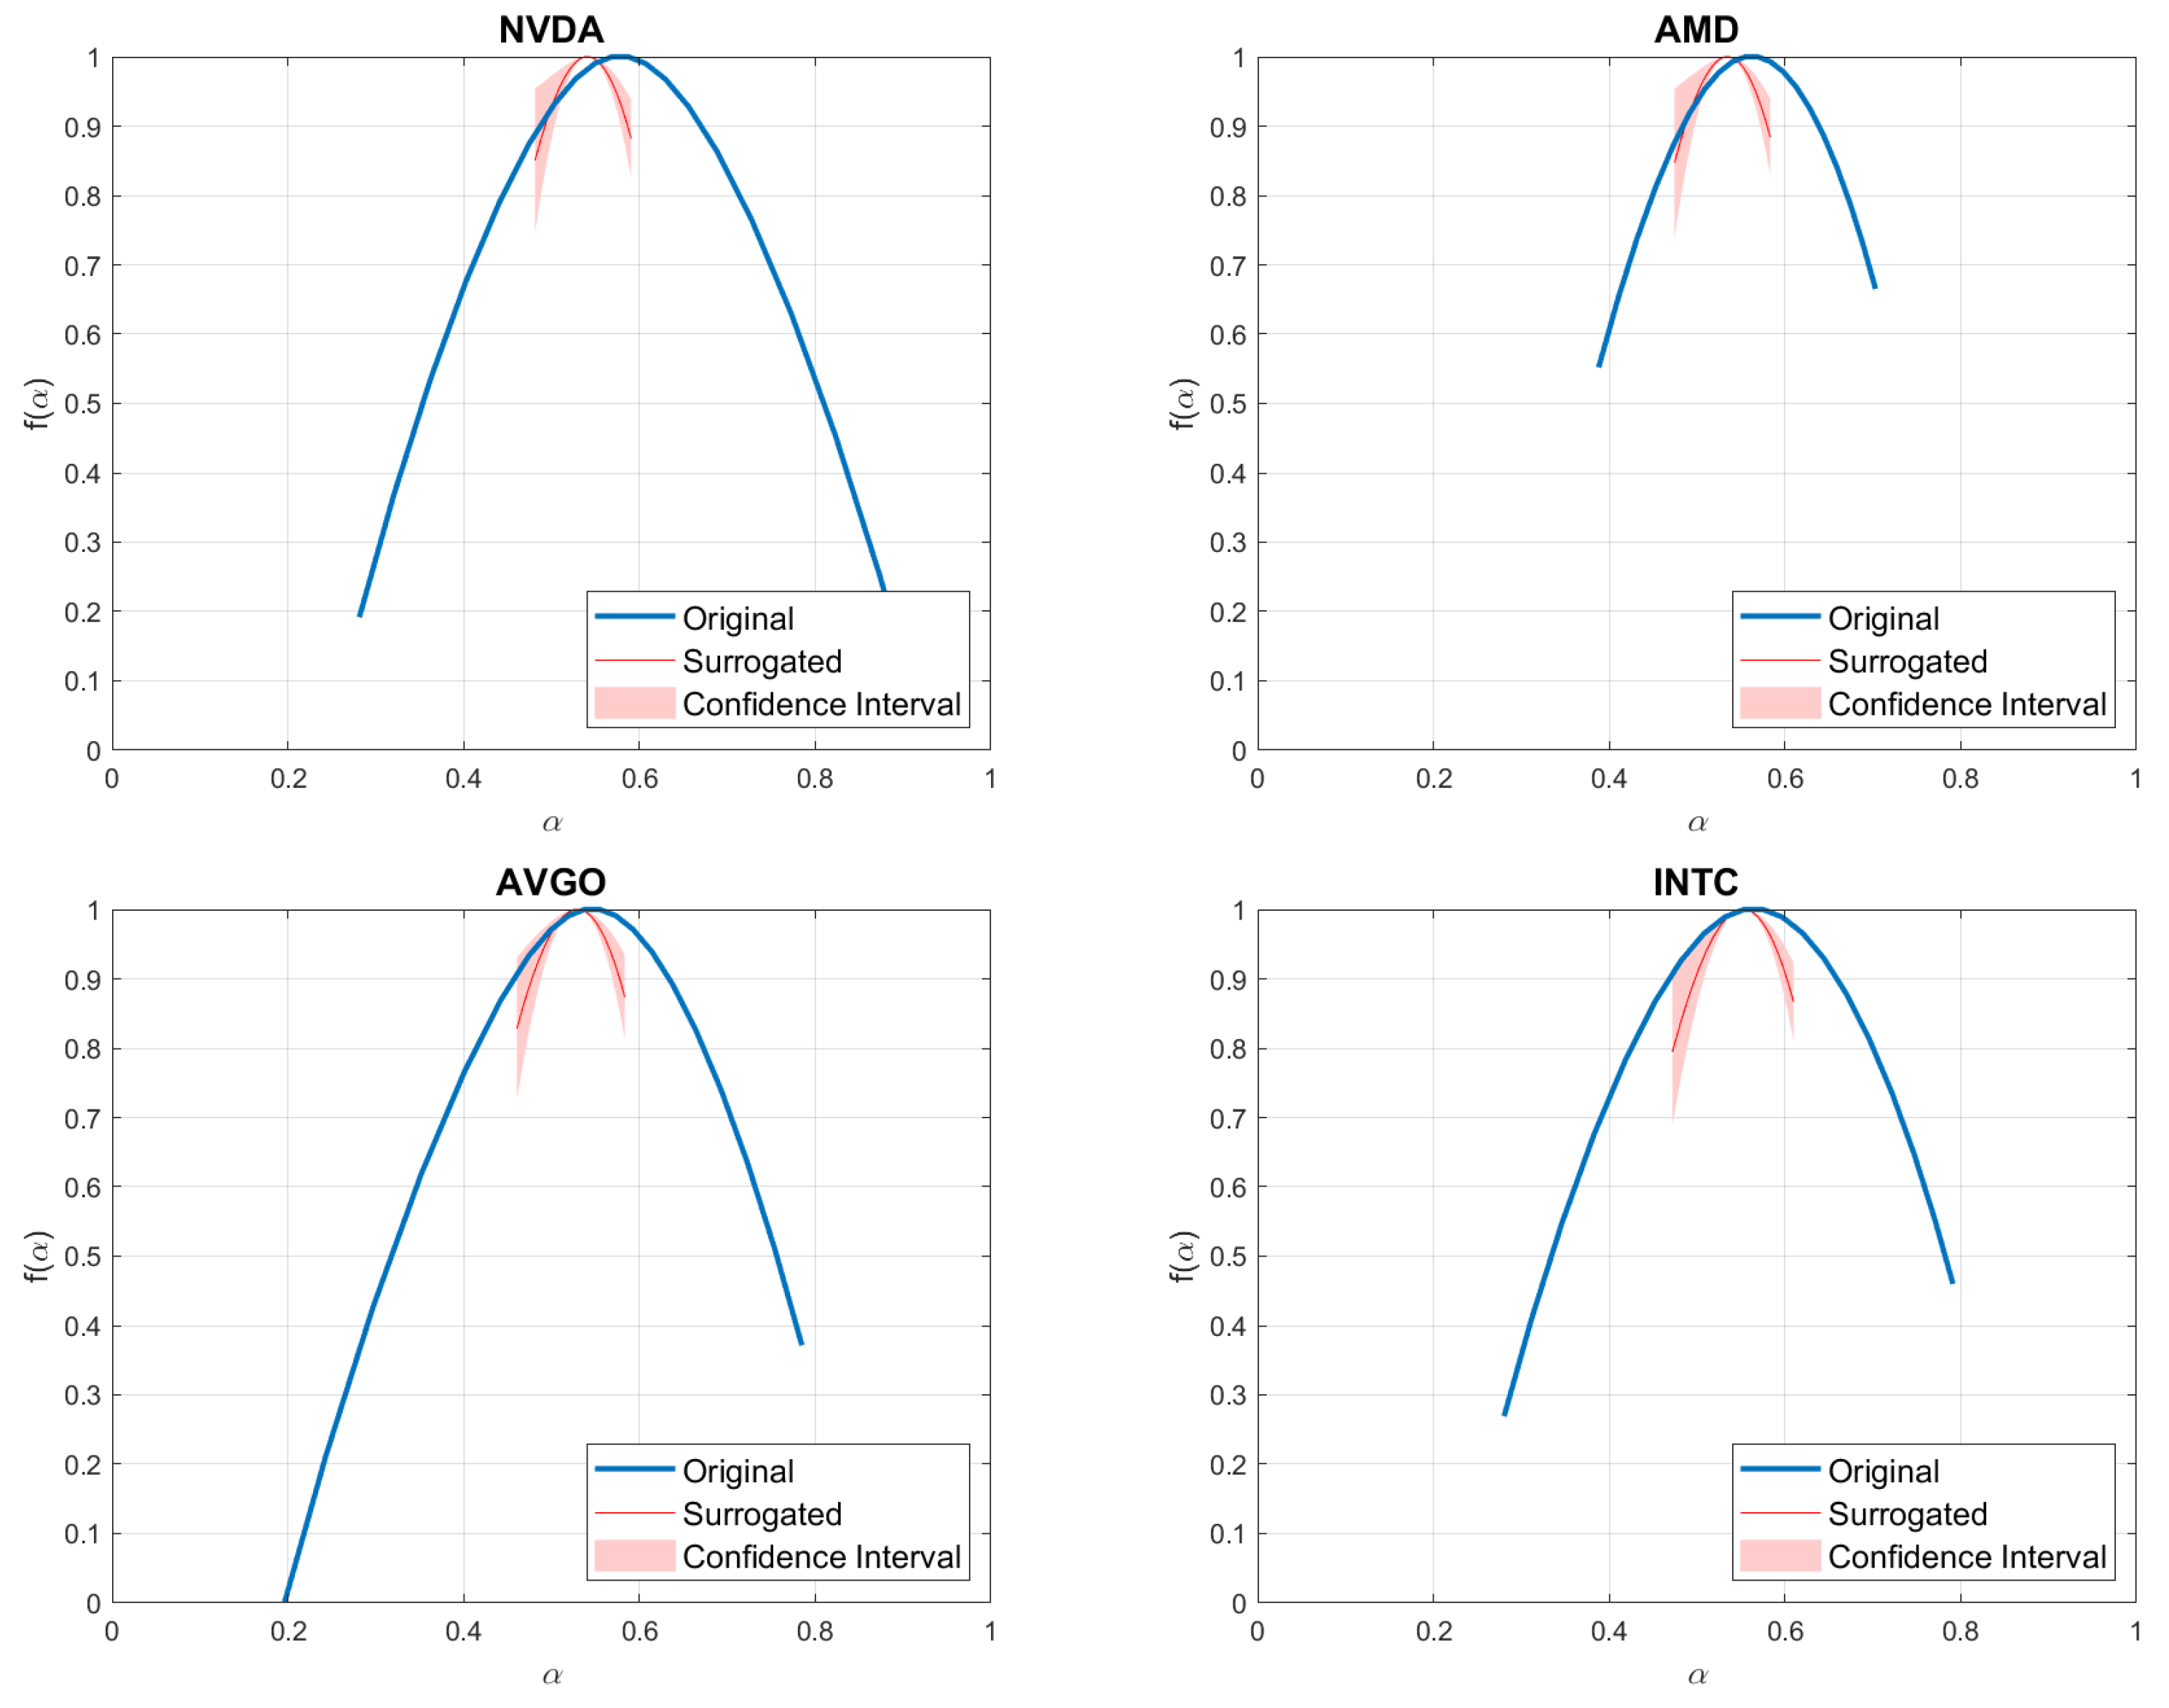
To further extend the multifractal analysis, we conducted a multifractality source analysis. Specifically, 200 surrogate time series were generated using the Iterative Amplitude Adjusted Fourier Transform (IAAFT) method [57,58,59,60]. As illustrated in Figure 13, Figure 14, Figure 15, Figure 16 and Figure 17, the surrogate curves consistently lie significantly below the original curve in all cases, indicating the presence of fat-tailed effects and temporal linear correlations in the original data. This suggests that the original time series exhibit greater complexity, with extreme events occurring more frequently than expected under a Gaussian distribution.
In the case of the pairs related to the DJI (Figure 13), all surrogate curves exhibit a similar pattern, with a slight leftward skew, and their α 0 values closely match that of the original curve, except for the INTC-DJI pair, where α 0 is slightly shifted to the right. Figure 14 presents the pairs associated with XAU, where the surrogate curves for NVDA-XAU and AMD-XAU appear symmetric, whereas those for AVGO-XAU and INTC-XAU show a slight leftward bias. For the pairs related to the EUR (Figure 15), all surrogate curves are relatively symmetric; however, small leftward shifts are observed for NVDA-EUR and AMD-EUR.
Regarding the pairs associated with WTI (Figure 16), the surrogate curves are positioned higher, indicating a reduced influence of fat-tailed effects and temporal linear correlations. This suggests that, for WTI, the original time series exhibits less complexity in terms of extreme events and serial dependencies, as reflected by the elevated position of the surrogate curves. Finally, Figure 17 shows that the behavior of the surrogate curves related to BTC closely resembles that observed for the EUR-related pairs.

5. Conclusions

This study investigates the multifractal cross-correlation behavior of semiconductor stocks in relation to key financial assets by applying the generalized Hurst exponent, multifractal spectrum analysis, and multifractality source decomposition. The results consistently reveal multifractal characteristics across all asset pairs, confirming the presence of complex, nonlinear dynamics in stock price movements.
The cross-correlation Hurst exponent exhibited notable variability across the range of q values, affirming the multifractal nature of the time series. This variability was especially evident in the trend where smaller fluctuations were associated with higher cross-correlation Hurst exponents, whereas larger fluctuations corresponded with a decrease. Among the stocks analyzed, NVDA displayed the highest degree of multifractality when paired with DJI, WTI, and BTC, while AVGO exhibited the highest multifractality in relation to XAU and EUR. In contrast, AMD consistently showed the lowest multifractality across all asset pairings, suggesting a more stable and less complex dynamic profile.
The multifractal spectrum analysis produced inverse parabolic shapes for all asset pairs. NVDA and AVGO exhibited broader spectra, particularly when paired with DJI, XAU, WTI, and BTC, indicating stronger multifractal behavior likely driven by high fluctuation intensities. Notably, the spectra of semiconductor stocks paired with BTC were more symmetric, implying that multifractality in these combinations arises from a broad range of fluctuation magnitudes rather than extreme events alone.
Analysis of the α 0 values across all pairs revealed a relatively stable multifractal structure, with values consistently ranging from 0.50 to 0.55. However, EUR-related pairs showed lower α 0 values, indicating more correlated and less complex structures. Conversely, BTC-related pairs demonstrated higher α 0 values, reflecting finer multifractal structures with weaker correlations. Among the stocks, AVGO-related pairs exhibited the lowest α 0 values, suggesting stronger correlations and less intricate multifractal profiles.
Cross-correlation Hurst exponent analysis also indicated that semiconductor stocks paired with DJI generally exhibited persistent behavior, particularly NVDA and AMD, whereas AVGO and INTC displayed random walk characteristics. AVGO further exhibited anti-persistent behavior when paired with XAU and WTI. Most stocks demonstrated persistent behavior when paired with BTC, with the exception of AVGO, which showed Brownian motion-like dynamics. These results suggest that different financial assets exert varying influences on the persistence and trend-following behavior of semiconductor stocks.
Asymmetric cross-correlation analysis revealed that semiconductor stocks paired with DJI showed greater persistence during downward market trends, implying more predictable behavior during market downturns. In contrast, stocks paired with XAU exhibited stronger persistence during upward trends, with the exception of AMD. EUR-related pairs also displayed greater persistence under upward trends, while WTI-related pairs demonstrated higher persistence during larger fluctuations, particularly in upward movements. For BTC, persistence was greater under downward trends for small fluctuations and under upward trends for larger ones.
In the multifractality source analysis, surrogate time series were employed to isolate the effects of fat tails and temporal linear correlations. Most of the asset pairs exhibited lower surrogate curves compared to the original, confirming the presence of extreme events and complex temporal dynamics. An exception was observed in the WTI-related pairs, where surrogate curves exceeded the original, suggesting reduced complexity.
The multifractal correlation structure observed in this study provides valuable insights into the complexity and performance dynamics of semiconductor stocks under varying market conditions. The presence of significant multifractal cross-correlations across all asset pairs implies that stock returns are influenced by a broad spectrum of fluctuations, ranging from minor price changes to extreme market events. This complex behavior reflects the nonlinear interactions between semiconductor stocks and macroeconomic variables such as commodity prices, foreign exchange rates, and market indices.
Similar to the study examining the relationship between gold and representative green and sustainable stocks in the U.S. and EU [50], our findings reveal significant multifractal properties and nonlinear cross-correlations across all time series pairs.
In summary, the semiconductor stocks analyzed exhibit heterogeneous multifractal behavior, strongly influenced by the financial asset with which they are paired. These findings underscore the importance of accounting for multifractality in financial time series analysis, as it offers deeper insights into asset interactions, market dynamics, and risk assessment, factors that are critical for informed investment strategies and portfolio management.

Funding

This research received no external funding.

Data Availability Statement

Data available on request from author.

Conflicts of Interest

The author declares no conflicts of interest.

References

  1. Rasheed, M.Q.; Zhao, Y.; Nazir, M.; Ahmed, Z.; Yu, X. How do semiconductors, artificial intelligence, geopolitical risk, and their moderating effects shape renewable energy production in leading semiconductor manufacturing countries? Technol. Soc. 2025, 80, 102761. [Google Scholar] [CrossRef]
  2. Zhang, K. 1.1 semiconductor industry: Present & future. In Proceedings of the 2024 IEEE International Solid-State Circuits Conference (ISSCC), San Francisco, CA, USA, 18–22 February 2024; Volume 67, pp. 10–15. [Google Scholar]
  3. Richard, C. The Semiconductor Industry—Past, Present, and Future. In Understanding Semiconductors: A Technical Guide for Non-Technical People; Apress: Berkeley, CA, USA, 2022; pp. 175–210. [Google Scholar]
  4. Fama, E.F. Efficient capital markets. J. Financ. 1970, 25, 383–417. [Google Scholar] [CrossRef]
  5. Caginalp, G.; DeSantis, M. Nonlinear price dynamics of S&P 100 stocks. Phys. A Stat. Mech. Appl. 2020, 547, 122067. [Google Scholar]
  6. Bucur, C.; Tudorică, B.G.; Bâra, A.; Oprea, S.V. Multifractal analysis of Bitcoin price dynamics. J. Bus. Econ. Manag. 2025, 26, 21–48. [Google Scholar] [CrossRef]
  7. Zhuang, X.; Wei, D. Asymmetric multifractality, comparative efficiency analysis of green finance markets: A dynamic study by index-based model. Phys. Stat. Mech. Appl. 2022, 604, 127949. [Google Scholar] [CrossRef]
  8. Mensi, W.; Vo, X.V.; Kang, S.H. Upward/downward multifractality and efficiency in metals futures markets: The impacts of financial and oil crises. Resour. Policy 2022, 76, 102645. [Google Scholar] [CrossRef]
  9. Lee, M.; Song, J.W.; Park, J.H.; Chang, W. Asymmetric multi-fractality in the US stock indices using index-based model of A-MFDFA. Chaos Solitons Fractals 2017, 97, 28–38. [Google Scholar] [CrossRef]
  10. Stosic, D.; Stosic, D.; Vodenska, I.; Stanley, H.E.; Stosic, T. A New Look at Calendar Anomalies: Multifractality and Day-of-the-Week Effect. Entropy 2022, 24, 562. [Google Scholar] [CrossRef]
  11. Kristjanpoller, W.; Tabak, B.M. Day of the week effect on the cryptomarket: A high-frequency asymmetric multifractal analysis. Phys. A Stat. Mech. Appl. 2025, 658, 130306. [Google Scholar] [CrossRef]
  12. Zhang, S.; Fang, W. Multifractal behaviors of stock indices and their ability to improve forecasting in a volatility clustering period. Entropy 2021, 23, 1018. [Google Scholar] [CrossRef]
  13. Kristjanpoller, W.; Miranda Tabak, B. Day of the Week Effect on the World Exchange Rates through Fractal Analysis. Fractal Fract. 2024, 8, 340. [Google Scholar] [CrossRef]
  14. Wang, F.; Chang, J.; Zuo, W.; Zhou, W. Research on Efficiency and Multifractality of Gold Market under Major Events. Fractal Fract. 2024, 8, 488. [Google Scholar] [CrossRef]
  15. Orlando, G.; Lampart, M. Expecting the unexpected: Entropy and multifractal systems in finance. Entropy 2023, 25, 1527. [Google Scholar] [CrossRef]
  16. Fernandes, L.H.; Silva, J.W.; de Araujo, F.H. Multifractal risk measures by macroeconophysics perspective: The case of brazilian inflation dynamics. Chaos Solitons Fractals 2022, 158, 112052. [Google Scholar] [CrossRef]
  17. Kristjanpoller, W.; Minutolo, M.C. Asymmetric multi-fractal cross-correlations of the price of electricity in the US with crude oil and the natural gas. Phys. A Stat. Mech. Appl. 2021, 572, 125830. [Google Scholar] [CrossRef]
  18. Gajardo, G.; Kristjanpoller, W. Asymmetric multifractal cross-correlations and time varying features between Latin-American stock market indices and crude oil market. Chaos Solitons Fractals 2017, 104, 121–128. [Google Scholar] [CrossRef]
  19. Gao, X.L.; Shao, Y.H.; Yang, Y.H.; Zhou, W.X. Do the global grain spot markets exhibit multifractal nature? Chaos Solitons Fractals 2022, 164, 112663. [Google Scholar] [CrossRef]
  20. Gaio, L.E.; Capitani, D.H.D. Multifractal cross-correlation analysis between crude oil and agricultural futures markets: Evidence from Russia–Ukraine conflict. J. Agribus. Dev. Emerg. Econ. 2025, 15, 19–42. [Google Scholar] [CrossRef]
  21. Wang, H.Y.; Wang, T.T. Multifractal analysis of the Chinese stock, bond and fund markets. Phys. A Stat. Mech. Appl. 2018, 512, 280–292. [Google Scholar] [CrossRef]
  22. Wang, Z.; Yan, Y.; Chen, X. Multifractal properties of interest rates in bond market. Procedia Comput. Sci. 2016, 91, 432–441. [Google Scholar] [CrossRef]
  23. Naeem, M.A.; Farid, S.; Ferrer, R.; Shahzad, S.J.H. Comparative efficiency of green and conventional bonds pre-and during COVID-19: An asymmetric multifractal detrended fluctuation analysis. Energy Policy 2021, 153, 112285. [Google Scholar] [CrossRef]
  24. Fernandes, L.H.; Silva, J.W.; de Araujo, F.H.; Tabak, B.M. Multifractal cross-correlations between green bonds and financial assets. Financ. Res. Lett. 2023, 53, 103603. [Google Scholar] [CrossRef]
  25. Kristjanpoller, W.; Tabak, B.M. Comparison of the asymmetric multifractal behavior of green and US bonds against benchmark financial assets. Financ. Innov. 2025, 11, 57. [Google Scholar] [CrossRef]
  26. Stosic, D.; Stosic, D.; Ludermir, T.B.; Stosic, T. Multifractal behavior of price and volume changes in the cryptocurrency market. Phys. A Stat. Mech. Appl. 2019, 520, 54–61. [Google Scholar] [CrossRef]
  27. Derbentsev, V.; Kibalnyk, L.; Radzihovska, Y. Modelling multifractal properties of cryptocurrency market. Period. Eng. Nat. Sci. (PEN) 2019, 7, 690–701. [Google Scholar] [CrossRef]
  28. Bariviera, A.F. One model is not enough: Heterogeneity in cryptocurrencies’ multifractal profiles. Financ. Res. Lett. 2021, 39, 101649. [Google Scholar] [CrossRef]
  29. da Silva Filho, A.C.; Maganini, N.D.; de Almeida, E.F. Multifractal analysis of Bitcoin market. Phys. A Stat. Mech. Appl. 2018, 512, 954–967. [Google Scholar] [CrossRef]
  30. Kristjanpoller, W.; Bouri, E. Asymmetric multifractal cross-correlations between the main world currencies and the main cryptocurrencies. Phys. A Stat. Mech. Appl. 2019, 523, 1057–1071. [Google Scholar] [CrossRef]
  31. Kristjanpoller, W.; Bouri, E.; Takaishi, T. Cryptocurrencies and equity funds: Evidence from an asymmetric multifractal analysis. Phys. A Stat. Mech. Appl. 2020, 545, 123711. [Google Scholar] [CrossRef]
  32. Stavroyiannis, S.; Babalos, V.; Bekiros, S.; Lahmiri, S.; Uddin, G.S. The high frequency multifractal properties of Bitcoin. Phys. A Stat. Mech. Appl. 2019, 520, 62–71. [Google Scholar] [CrossRef]
  33. Lahmiri, S.; Bekiros, S. Big data analytics using multi-fractal wavelet leaders in high-frequency Bitcoin markets. Chaos Solitons Fractals 2020, 131, 109472. [Google Scholar] [CrossRef]
  34. Yuan, Y.; Zhuang, X.-t.; Jin, X. Measuring multifractality of stock price fluctuation using multifractal detrended fluctuation analysis. Phys. A Stat. Mech. Appl. 2009, 388, 2189–2197. [Google Scholar] [CrossRef]
  35. Dewandaru, G.; Masih, R.; Bacha, O.I.; Masih, A.M.M. Developing trading strategies based on fractal finance: An application of MF-DFA in the context of Islamic equities. Phys. A Stat. Mech. Appl. 2015, 438, 223–235. [Google Scholar] [CrossRef]
  36. de Oliveira, A.S.; Ceretta, P.S.; Albrecht, P. Performance comparison of multifractal techniques and artificial neural networks in the construction of investment portfolios. Financ. Res. Lett. 2023, 55, 103814. [Google Scholar] [CrossRef]
  37. Wang, F.; Ye, X.; Chen, H.; Wu, C. A portfolio strategy of stock market based on mean-MF-X-DMA model. Chaos Solitons Fractals 2021, 143, 110645. [Google Scholar] [CrossRef]
  38. Muzy, J.F.; Sornette, D.; Delour, J.; Arneodo, A. Multifractal returns and hierarchical portfolio theory. Quant. Financ. 2001, 1, 131. [Google Scholar] [CrossRef]
  39. Wu, X.; Wang, P.; Yang, C.; Xiao, Y. A Study of Fractal Dual Momentum Investment Strategy Under the Constraint of Multi-Fractal Characteristics of Stock Market. Fractals 2024, 32, 2450041. [Google Scholar] [CrossRef]
  40. Wang, Y.; Sun, Q.; Zhang, Z.; Chen, L. A risk measure of the stock market that is based on multifractality. Phys. A Stat. Mech. Appl. 2022, 596, 127203. [Google Scholar] [CrossRef]
  41. Batten, J.A.; Kinateder, H.; Wagner, N. Multifractality and value-at-risk forecasting of exchange rates. Phys. A Stat. Mech. Appl. 2014, 401, 71–81. [Google Scholar] [CrossRef]
  42. Brandi, G.; Di Matteo, T. On the statistics of scaling exponents and the multiscaling value at risk. Eur. J. Financ. 2022, 28, 1361–1382. [Google Scholar] [CrossRef]
  43. Wei, Y.; Chen, W.; Lin, Y. Measuring daily Value-at-Risk of SSEC index: A new approach based on multifractal analysis and extreme value theory. Phys. A Stat. Mech. Appl. 2013, 392, 2163–2174. [Google Scholar] [CrossRef]
  44. Cho, P.; Lee, M. Forecasting the volatility of the stock index with deep learning using asymmetric Hurst exponents. Fractal Fract. 2022, 6, 394. [Google Scholar] [CrossRef]
  45. Li, H.; Chun, W.; Wu, X.; Luo, L. Multi-asset portfolio model optimization based on mean multifractal detrended cross correlation analysis. Math. Comput. Model. Dyn. Syst. 2024, 30, 736–757. [Google Scholar] [CrossRef]
  46. Zhang, X.; Wu, X.; Zhang, L.; Chen, Z. The evaluation of mean-detrended cross-correlation analysis portfolio strategy for multiple risk assets. Eval. Rev. 2022, 46, 138–164. [Google Scholar] [CrossRef]
  47. Chun, W.; Li, H.; Wu, X. Portfolio model under fractal market based on mean-DCCA. Fractals 2020, 28, 2050142. [Google Scholar] [CrossRef]
  48. Cho, P.; Lee, M. Dynamic Black–Litterman Portfolios Incorporating Asymmetric Fractal Uncertainty. Fractal Fract. 2024, 8, 642. [Google Scholar] [CrossRef]
  49. Lux, T.; Morales-Arias, L.; Sattarhoff, C. Forecasting daily variations of stock index returns with a multifractal model of realized volatility. J. Forecast. 2014, 33, 532–541. [Google Scholar] [CrossRef]
  50. Kojić, M.; Mitić, P.; Minović, J. Gold and Sustainable stocks in the US and EU: Nonlinear analysis based on multifractal detrended Cross-Correlation analysis and Granger Causality. Fractal Fract. 2023, 7, 738. [Google Scholar] [CrossRef]
  51. Zhou, W.X. Multifractal detrended cross-correlation analysis for two nonstationary signals. Phys. Rev. E—Stat. Nonlinear Soft Matter Phys. 2008, 77, 066211. [Google Scholar] [CrossRef]
  52. Kantelhardt, J.W.; Zschiegner, S.A.; Koscielny-Bunde, E.; Havlin, S.; Bunde, A.; Stanley, H.E. Multifractal detrended fluctuation analysis of nonstationary time series. Phys. A Stat. Mech. Appl. 2002, 316, 87–114. [Google Scholar] [CrossRef]
  53. Podobnik, B.; Stanley, H.E. Detrended Cross-Correlation Analysis: A New Method for Analyzing Two Nonstationary Time Series. Phys. Rev. Lett. 2008, 100, 084102. [Google Scholar] [CrossRef] [PubMed]
  54. Alvarez-Ramirez, J.; Rodriguez, E.; Echeverria, J.C. A DFA approach for assessing asymmetric correlations. Phys. A Stat. Mech. Its Appl. 2009, 388, 2263–2270. [Google Scholar] [CrossRef]
  55. Podobnik, B.; Grosse, I.; Horvatić, D.; Ilic, S.; Ivanov, P.C.; Stanley, H.E. Quantifying cross-correlations using local and global detrending approaches. Eur. Phys. J. B 2009, 71, 243–250. [Google Scholar] [CrossRef]
  56. Zebende, G.F. DCCA cross-correlation coefficient: Quantifying level of cross-correlation. Phys. A Stat. Mech. Its Appl. 2011, 390, 614–618. [Google Scholar] [CrossRef]
  57. Theiler, J.; Eubank, S.; Longtin, A.; Galdrikian, B.; Farmer, J.D. Testing for nonlinearity in time series: The method of surrogate data. Phys. D Nonlinear Phenom. 1992, 58, 77–94. [Google Scholar] [CrossRef]
  58. Schreiber, T.; Schmitz, A. Improved surrogate data for nonlinearity tests. Phys. Rev. Lett. 1996, 77, 635. [Google Scholar] [CrossRef]
  59. Barunik, J.; Aste, T.; Di Matteo, T.; Liu, R. Understanding the source of multifractality in financial markets. Phys. A Stat. Mech. Appl. 2012, 391, 4234–4251. [Google Scholar] [CrossRef]
  60. Podobnik, B.; Fu, D.; Stanley, H.E.; Ivanov, P.C. Power-law autocorrelated stochastic processes with long-range cross-correlations. Eur. Phys. J. B 2007, 56, 47–52. [Google Scholar] [CrossRef]
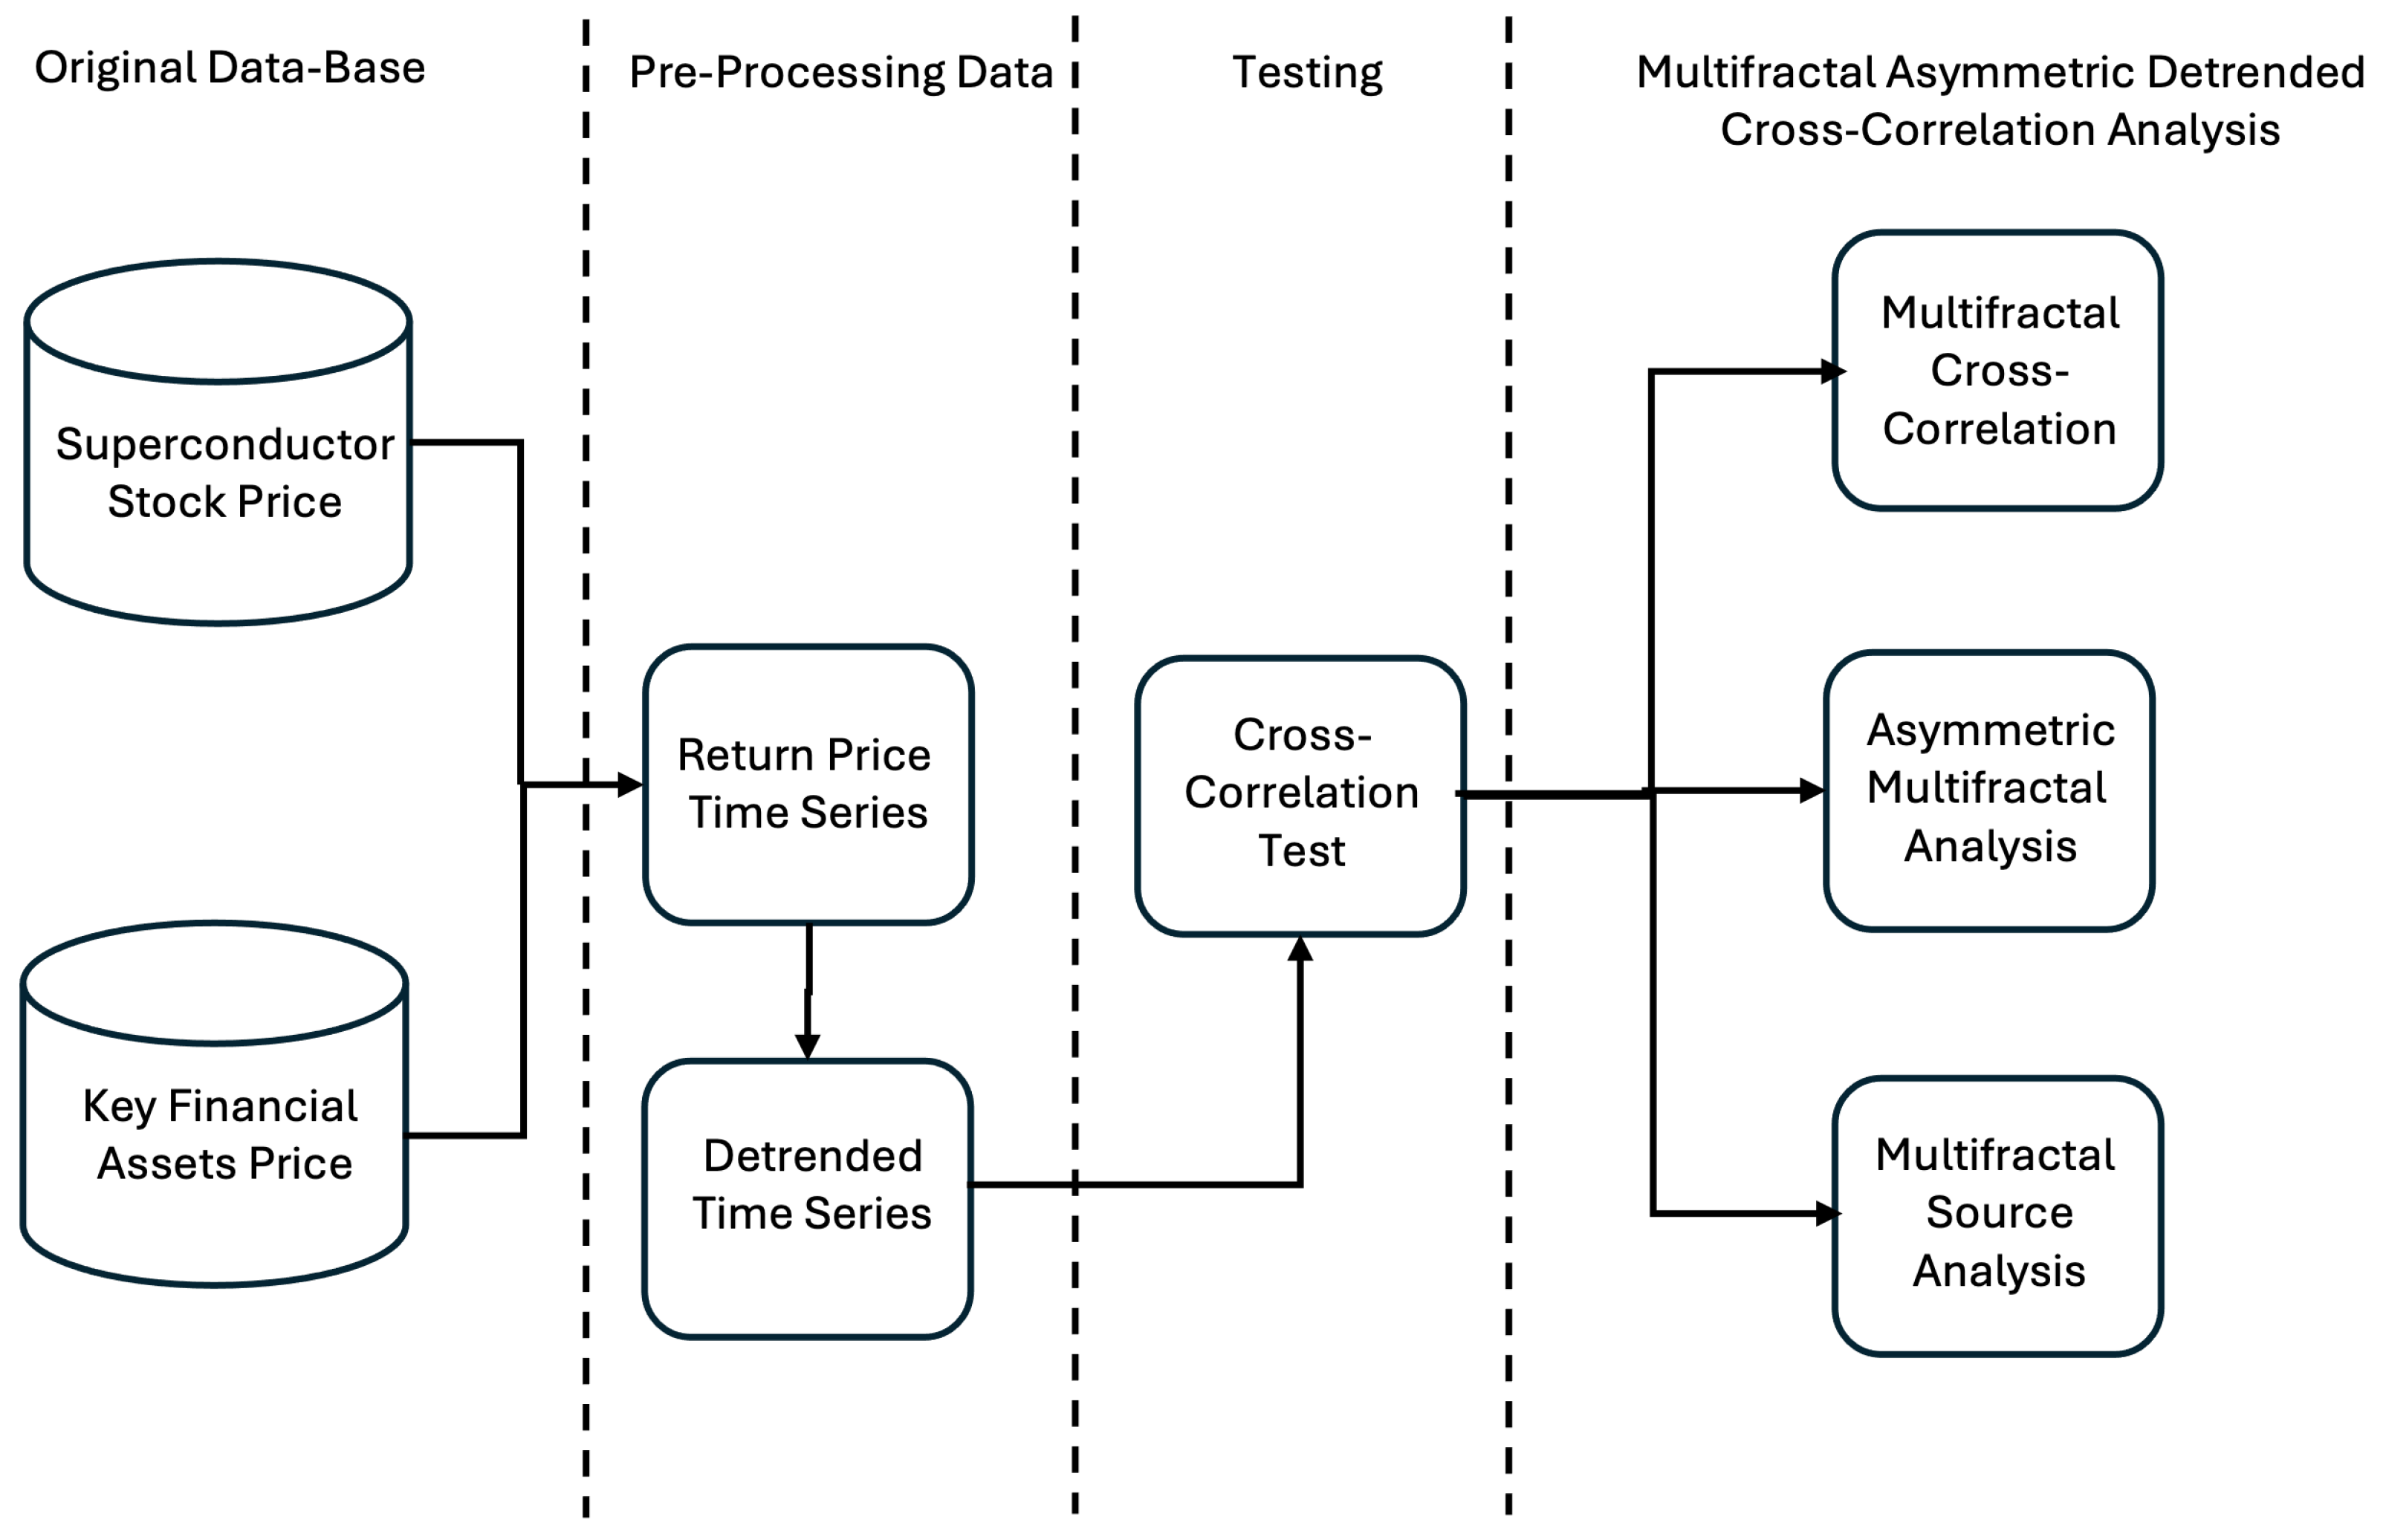
Figure 1. Methodological framework.
Fractalfract 09 00292 g001
Figure 2. Price evolution of semiconductor stocks in the studied period.
Fractalfract 09 00292 g002
Figure 3. Price and value evolution of main financial assets in the studied period.
Fractalfract 09 00292 g003
Figure 4. Cross-correlation statistics Q c c ( m ) for semiconductor stock return series and main financial asset return series. Note: Q c c ( m ) was calculated over the degree of freedom (m) range [0, 250]. The threshold line (green line) represents the critical value of the χ 2 ( m ) distribution.
Fractalfract 09 00292 g004
Figure 5. Cross-correlation Hurst exponent H x y ( q ) for all the studied pairs.
Fractalfract 09 00292 g005aFractalfract 09 00292 g005b
Figure 6. Multifractal spectra for semiconductor stocks and the main financial assets. Note: Multifractal spectrum computed for the q range [−5, 5] for each original time series.
Fractalfract 09 00292 g006
Figure 7. Cross-correlation Hurst exponent H x y ( 2 ) vs. q for each day for the cryptocurrencies analyzed. Note: Confidence interval of the cross-correlation exponent for q = 2 for each original time series. The confidence interval corresponds to a 95% probability level.
Fractalfract 09 00292 g007
Figure 8. Asymmetric cross-correlation exponent for semiconductor stocks under upward and downward DJI trends. Note: Multifractal spectrum computed for the q range [−5, 5] for each original time series.
Fractalfract 09 00292 g008
Figure 9. Asymmetric cross-correlation exponent for semiconductor stocks under upward and downward XAU trends. Note: Multifractal spectrum computed for the q range [−5, 5] for each original time series.
Fractalfract 09 00292 g009
Figure 10. Asymmetric cross-correlation exponent for semiconductor stocks under upward and downward EUR trends. Note: Multifractal spectrum computed for the q range [−5, 5] for each original time series.
Fractalfract 09 00292 g010
Figure 11. Asymmetric cross-correlation exponent for semiconductor stocks under upward and downward WTI trends. Note: Multifractal spectrum computed for the q range [−5, 5] for each original time series.
Fractalfract 09 00292 g011
Figure 12. Asymmetric cross-correlation exponent for semiconductor stocks under upward and downward BTC trends. Note: Multifractal spectrum computed for the q range [−5, 5] for each original time series.
Fractalfract 09 00292 g012
Figure 13. Multifractal source analysis for each Superconductor stock and DJI.
Fractalfract 09 00292 g013
Figure 14. Multifractal source analysis for each Superconductor stock and XAU.
Fractalfract 09 00292 g014
Figure 15. Multifractal source analysis for each Superconductor stock and EUR.
Fractalfract 09 00292 g015
Figure 16. Multifractal source analysis for each Superconductor stock and WTI.
Fractalfract 09 00292 g016
Figure 17. Multifractal source analysis for each Superconductor stock and BTC.
Fractalfract 09 00292 g017
Table 1. Descriptive statistics of semiconductor stocks and main financial assets.
NVDAAMDAVGOINTCDJIXAUEURWTIBTC
Mean0.22%0.15%0.12%−0.02%0.03%0.03%−0.01%0.01%0.23
St. Dev.3.08%3.63%2.38%2.28%1.10%0.89%0.50%2.89%4.39
Min−20.79%−27.75%−22.19%−30.19%−13.09%−5.90%−2.40%−41.77%−49.73
Max26.37%42.06%21.86%17.83%10.83%4.69%3.04%40.35%24.08
Table 2. Correlation of semiconductor stock returns and main financial asset returns.
NVDAAMDAVGOINTCDJIXAUEURWTIBTC
NVDA1.00
AMD0.031.00
AVGO0.090.371.00
INTC0.270.080.041.00
DJI0.200.080.060.061.00
XAU0.500.010.040.120.201.00
EUR0.410.030.070.120.140.591.00
WTI0.560.030.050.180.160.600.451.00
BTC0.570.050.030.160.160.470.380.501.00
Table 3. Multifractal degree ( Δ H) of semiconductor stocks and main financial assets.
StockDJIXAUEURWTIBTC
NVDA0.21900.18600.17400.24590.2857
AMD0.13760.12680.10270.15070.1585
AVGO0.15130.22790.18730.21760.2630
INTC0.13760.14160.12230.19310.2565
Table 4. Multifractal spectrum of semiconductor stocks and the main financial assets under different trends.
StockDJIXAUEURWTIBTC
Δ α α 0 Δ α α 0 Δ α α 0 Δ α α 0 Δ α α 0
NVDA0.46460.55360.41500.53070.32810.50880.48030.56610.64030.5781
AMD0.30750.54260.26910.52120.19190.50180.32370.54870.31510.5619
AVGO0.34510.51980.53060.49270.40200.48460.43710.52710.58840.5463
INTC0.28250.53200.32960.52290.24950.50540.37710.54940.51060.5642
Table 5. Multifractal degree of semiconductor stocks and main financial assets under different trends.
StockDJIXAUEURWTIBTC
UpwardDownwardUpwardDownwardUpwardDownwardUpwardDownwardUpwardDownward
NVDA0.17900.24410.17910.17270.16290.18810.16100.26490.16310.3279
AMD0.09470.21460.10190.13830.13050.09060.09050.13370.06710.2241
AVGO0.09500.27850.17630.25830.16800.19780.11350.22540.14240.3320
INTC0.11620.27800.15770.16850.16050.10450.11420.21600.13490.3494
Disclaimer/Publisher’s Note: The statements, opinions and data contained in all publications are solely those of the individual author(s) and contributor(s) and not of MDPI and/or the editor(s). MDPI and/or the editor(s) disclaim responsibility for any injury to people or property resulting from any ideas, methods, instructions or products referred to in the content.