Article

Evolution Characteristics of Pore–Fractures and Mechanical Response of Dehydrated Lignite Based on In Situ Computed Tomography (CT) Scanning

1
State Key Laboratory of Intelligent Construction and Healthy Operation and Maintenance of Deep Underground Engineering, China University of Mining and Technology, Xuzhou 221116, China
2
College of Safety Science and Engineering, Henan Polytechnic University, Jiaozuo 454003, China
3
School of Architectural Engineering, Neijiang Normal University, Neijiang 641112, China
4
School of Civil Engineering, Jiangsu College of Engineering and Technology, Nantong 226007, China
*
Author to whom correspondence should be addressed.
Fractal Fract. 2025, 9(4), 220; https://doi.org/10.3390/fractalfract9040220
Submission received: 23 February 2025 / Revised: 19 March 2025 / Accepted: 24 March 2025 / Published: 31 March 2025

Abstract

Based on the uniaxial compression tests and in situ CT scanning experiments of lignite with different dehydration times and the fractal theory, this paper qualitatively and quantitatively investigated the influence of the dehydration effect on the evolution of pore–fractures and the mechanical behavior of lignite under uniaxial compression conditions. The results show that the dehydration effect significantly affects the pre-peak deformation and post-peak failure behavior of lignite but has no significant impact on its peak strength. The pore–fracture parameters, such as the fractal dimension, surface porosity, and fracture volume, of three samples all exhibit an evolutionary pattern of “continuous decrease in the compaction and elastic stages–gradual increase in the plastic stage–sharp growth in the post-peak stage” with the dynamic evolution of the pore–fractures. However, the dehydration effect leads to an increase in the intensity of pore–crack evolution and a nonlinear rise in all the parameters characterizing the pore–crack complexity during uniaxial compression, which, in turn, leads to an increment in the fluctuation of the above evolutionary trends. The mechanism underlying the differential influence of the dehydration effect on the macroscopic mechanical behavior of lignite is follows: The dehydration effect non-linearly and positively affects the initial pore–fracture structure of lignite, thereby non-linearly and positively promoting the evolution of pore–fractures during the loading process. Nevertheless, since it fails to weaken the micro-mechanical properties of lignite and cannot form effective through-going fractures, it has no significant impact on the uniaxial compressive strength of the coal samples. The findings of this study can provide some references for the support design and deformation control of underground lignite roadways.

1. Introduction

Lignite is widely distributed in China, accounting for about 13% of its total coal reserves [1,2]. Because of its low mining cost and wide range of applications, lignite’s reliable supply is important for ensuring the security of China’s energy system [3,4]. However, due to its high water content and poor thermal stability in its natural state, it may rapidly dehydrate and crack even at ambient temperatures, leading to significant deterioration in its microporous structure and physical–mechanical properties [5,6,7]. Under the disturbance of coal mining stress, new fractures will develop and interconnect along the desiccation cracks, causing serious problems like excessive deformation, failure of the support system, or even complete collapse of the lignite roadways, which will seriously impede normal lignite mining activities [8,9,10]. Therefore, it is of great practical significance to investigate the dynamic evolution of microscopic pore–fractures and the macroscopic mechanical behaviors of lignite with different dehydration times after loading to gain a deeper understanding of lignite roadway failure mechanisms and safe mining in coal mines.
The macro-mechanical behavior of lignite is crucial for the stability control of underground structures. Therefore, some scholars have systematically investigated the macro-mechanical properties of lignite under different loading conditions, e.g., uniaxial compression [11,12], cyclic compression and shear [13], the Split Hopkinson pressure bar (SHPB) compression test [14], and so on, which greatly deepened the understanding of the macroscopic response of lignite under various loading conditions. Since the microscopic mechanical properties of lignite are also important for its macroscopic cracking characteristics, several scholars tested microscopic parameters such as the elastic modulus and hardness of lignite using nanoindentation techniques and analyzed their effects on its fracture compressibility [15]. In addition, some studies have revealed the evolution of pore–fractures of lignite under the coupling of stress and microwaves, providing favorable theoretical guidance for coalbed methane (CBM) mining [16]. However, the above studies all neglected the influence of the lignite dehydration effect, which may lead to some bias in their experimental results. Fortunately, some findings on the impact of the lignite dehydration effect are beginning to be publicly reported. Some scholars revealed the evolution of pore–fractures and changes in the mechanical properties of lignite with different lithotypes during wet–dry cycling based on CT scanning experiments and atomic force microscopy tests [17], while other researchers investigated the deterioration of physical and mechanical properties and the response characteristics of microscopic cracks in lignite under two dehydration conditions by means of uniaxial compression experiments and acoustic emission, respectively [18,19]. However, up to now, studies in this field are still scarce.
Compared to other testing techniques, CT scanning allows for non-destructive detection and accurate quantitative characterization of the pores, cracks and other components in materials [20,21,22,23,24,25]. Therefore, more and more scholars began to research the macroscopic mechanical behavior of rocks from the perspective of pore–crack evolution [26,27]. They discussed in depth the effect of the coal rank [28], true triaxial stress path [29], fluid pressure [30], temperature [31,32], and pH value [33] on the coal samples in terms of pore–fracture structure and macroscopic mechanical properties, respectively, and many valuable research results have been obtained in the correlation between the mesoscopic structure and its macroscopic mechanical properties and failure modes. However, the evolution of pore–cracks of coal samples during the loading process has not been further investigated.
To obtain data regarding the detailed evolution of pore–cracks during stress loading, numerous scholars have started to utilize in situ CT scanning to perform studies on the macroscopic–microscopic mechanical response of loaded coal samples [34,35]. Based on the analysis of the fractal dimension and fracture volume, investigations have been carried out to quantify the evolution trend of the pore–fracture structure of coal samples at different deformation stages. It has been found that the fractal dimension can effectively characterize the evolution of the pore–fracture structure [36,37]. This finding is in high accordance with those on coal with a strong bursting liability [38]. Furthermore, through advanced digital volume correlation (DVC) analysis, quantitative analysis of fracture extension has been conducted, providing detailed comprehension of the damage mechanisms from a microscopic perspective [39]. Unfortunately, the above-mentioned studies do not provide an adequate quantitative analysis of the mechanism of the effect of the evolution of microscopic fractures in coal samples on their macroscopic mechanical behavior.
Based on the above research status, we conducted in situ CT scanning and uniaxial compression tests on lignite with different dehydration times and obtained their full stress–strain curves and pore–fracture structures at various deformation stages. To avoid the interference of low-density fusain inside the lignite on the segmentation of pore–fractures [40], we proposed a novel method that enables the accurate and rapid extraction of pore–fracture networks. Based on the stress–strain curves and pore–fractures at different deformation stages and combined with the fractal theory, we performed qualitative and quantitative analyses of the influence of the dehydration effect on the pore–fracture evolution and mechanical behavior of lignite under uniaxial compression conditions and explained the impact of the dehydration effect on the macroscopic mechanical behavior of lignite from the perspective of pore–fracture evolution. To better understand the influence mechanism of the dehydration effect on the macroscopic and microscopic mechanical responses of lignite during the uniaxial compression process, the differential influence of the initial pore–fractures of lignite with different dehydration times on the pore–fracture evolution and macroscopic mechanical behavior during uniaxial compression is finally discussed in detail. This study can provide some theoretical basis for the prevention and control of large deformation in lignite roadways in coal mines.

2. Experiments and Methods

2.1. Sample Preparation

The lignite used in this study was collected from the Xiyi Coal Mine in Wujianfang Coalfield in the eastern part of Inner Mongolia. Fresh and intact bulk coal samples were chosen from the active working face, wrapped tightly, and then immediately sent to the laboratory to be drilled and polished in the direction perpendicular to the bedding surface. Then, two different sizes of coal samples were obtained: cuboid samples with a side length of 25 mm and a height of 50 mm and cylindrical samples with a diameter of 25 mm and a height of 50 mm. According to their designed dehydration time, the coal samples were divided into 3 groups: S-0h, S-8h, and S-72h. Each group consisted of 5 rectangular coal samples and 2 cylindrical coal samples. All the samples were wrapped tightly with fresh-keeping film to prevent dehydration and cracking in the open-air environment. Some of the prepared cylindrical coal samples are shown in Figure 1, and the proximate analysis results and maceral identification results are shown in Table 1.

2.2. Experimental Procedure

The experimental procedure consisted of the following parts:

2.2.1. Dehydration Treatment

After removing the fresh-keeping film, the S-8h and S-72h samples were placed into the Espec SETH-2-021L constant climate cabinet (ESPEC Corporation, Japan, Osaka) for drying (Figure 2(b1,b2)). To better reflect the effect of an in situ open-air environment on dehydration and cracking, the temperature and relative humidity of the cabinet were set to 23.5° and 31.3%, respectively. As indicated by their group names, the drying times for the 2 group samples were set to 8 h and 72 h, respectively. After reaching the designated drying time, the samples were taken out of the cabinet and wrapped tightly with fresh-keeping film again to prevent further dehydration in the ambient environment. Note that the S-0h samples, representing the natural state of the lignite samples, were not dehydrated and were used as a comparison group in the subsequent experiments.

2.2.2. Uniaxial Compression Tests

For the purpose of obtaining the basic mechanical parameters of lignite with different dehydration times, a uniaxial compression test was conducted using the MTS 810 test system (MTS Systems Corporation, Eden Prairie, MN, USA) in accordance with the Standard for Test Methods of Engineering Rock Mass (GB/T 50266-2013 [41]) and the methods suggested by the International Society of Rock Mechanics (ISRM) (Figure 2(c1)). A total of 18 rectangular samples were tested in a room-temperature env (24 ± 2 °C and relative humidity of 50–60%) (Figure 2(c2)). During the tests, axial stress is applied using the strain control mode at a loading rate of 0.1 mm/min until the sample is broken. Simultaneously, the axial displacement and load of the sample is recorded in real time via a high-precision data acquisition system. Based on the test data, the uniaxial compressive strength (UCS) and elastic modulus (E) were computed using the method suggested by GB/T 50266-2013.

2.2.3. In Situ CT Scanning Experiments

To investigate the pore–fracture evolution of loaded lignite with different dehydration times, an in situ X-ray imaging study of three samples of cylindrical dehydrated lignite under uniaxial compression was carried out using the easytom 230 CT scanning system (RX Solution Corporation, Chavanod, France) (Figure 2(d1)). The system consists of an industrial CT scanning unit and a uniaxial loading apparatus (Figure 2(d2)). The former is capable of clearly, accurately, and intuitively displaying the internal structure of the object being measured in a non-destructive manner, while the latter can apply an axial load of up to 10 kN to the sample during the three-dimensional (3D) CT scanning process. Before the formal test, the scanning voltage, scanning current, exposure time, and projection number were set to 95 kV, 210 μA, 1000 ms, and 1440, respectively, in order to obtain the highest quality of digital images.
Based on the full stress–strain curves obtained in the uniaxial compression tests, we determined the in situ CT scanning points for each deformation stage of the three groups of lignite samples. To ensure good contact between the sample and the loading platform, an axial force of 200 N was pre-loaded onto the coal sample, followed by the first CT scan to obtain the initial distribution of internal pore–fracture structures. Subsequently, using displacement control mode, the sample was loaded at a rate of 0.1 mm/min until reaching the first preset axial stress value of 2 MPa, at which point loading was halted (with the indenter remaining stationary), and a second CT scan was performed. Subsequent scans were performed every time the axial force increased by 2.5 MPa, and the last scan was performed when the coal sample was completely crushed. In this way, we could obtain a series of 2D grayscale images with a resolution of 19.99 μm characterizing the evolution of pore–cracks in coal samples under different dehydration conditions at different deformation stages. The whole scans of three lignite samples are listed in Table 2.

2.3. Methods

2.3.1. Image Processing

Minerals, pores and fractures, and coal matrices with varying densities are uniformly distributed in lignite, and the ability of X-rays to penetrate the components is inversely proportional to their densities [42]. The lower the density of a component, the lower the gray value and the darker it appears in CT images. Thus, in a CT image, low-density areas, such as pores and fractures, appear black due to their lower gray values, whereas high-density areas, such as minerals, are rendered white because of their higher gray values. The components with densities in between are colored with different degrees of gray, as shown in Figure 3a. Based on this feature, we could extract the 3D pore–fracture structures of lignite samples from the CT data using Avizo’s built-in image processing method.
The standard flow of image processing is shown in Figure 3. In order to eliminate the influence of the edge-broken regions during sample preparation and the image artifacts at both ends during CT scanning, we cropped the original images prior to pore–fracture extraction under the premise of retaining the effective information as much as possible. The cropped dataset is a standard cylinder with a diameter of 23 mm and a height of 23 mm, and its two-dimensional (2D) view is shown in Figure 3b. Compared to other threshold segmentation methods, the Interactive Top-Hat module has significant advantages in extracting microfractures in rock samples. However, when using this method to segment the pore–fracture structures, we found that the fractures were only partially identified (Figure 3c). Conversely, when all fractures were successfully identified, some low-density macerals were incorrectly classified as pores (Figure 3d).
For this scenario, we propose a novel method, named Yan’s (YS) segmentation method, based on the built-in modules in Avizo: Firstly, the pores of the sample are extracted normally based on Interactive Top-Hat (Black Hat), which, of course, contains some of the cracks. Then, the Membrane Enhancement Filter module was utilized on the image to enhance the visibility of the cracks, which were then extracted using the Interactive Top-Hat (White Hat) (Figure 3d). Subsequently, the cracks were manually marked using the brush tool in the “Segmentation” panel (pink dots in Figure 3e), and the cracks in Figure 3d were accurately screened based on the “Reconstruction from Markers” command, so that all the crack structures of the sample were accurately obtained (Figure 3f). Finally, the aforementioned pore and fracture segmentation results were merged using the “Or Image” command, so that the whole pore–fracture network of the sample could be perfectly obtained, as shown in Figure 3g. By stacking and rendering the processed 2D images, the pore–fractures can be 3D visualized (Figure 3h). In addition, the combined “Label Analysis” and “Volume Rendering” commands can quantify each pore and fracture structure and assign different colors to better distinguish them (Figure 3i).

2.3.2. Quantitative Analysis of Pore–Fracture Volume and Area

The essence of the failure of a coal sample is the result of the expansion and penetration of its new fractures along some primary fractures. Based on the changes in the CT images of the loaded coal samples, the dynamic evolution of the internal pore–cracks can be vividly described. The pore–fracture surface area and volume of the coal samples calculated based on the CT data of different loading steps can accurately and quantitatively characterize this evolution process. Of course, in order to improve the accuracy of the analysis, we combined with the analysis of the corresponding full stress–strain curves. The surface area and volume of each pore and fracture were calculated using the Label Analysis module, and then the results were imported into Excel for summation to obtain the total surface area and volume of the whole pore–fracture network. The principles of calculating the surface area and volume of each pore and fracture in Label Analysis are as follows:
A r e a X = δ X x 2 + y 2 + z 2 d t
where Area(X) is the area of the pore (or fracture) X; and x(t), y(t), and z(t) are the parametric representation of the boundary curve of X.
V o l u m e ( X ) = V o x e l C o u n t × c x × c y × c z
where Volume(X) is the volume of a single pore (or fracture); VoxelCount is the voxel count of a single pore (or fracture); and cx, cy, and cz are the length, width, and height of a single voxel, respectively.
Surface porosity is a 2D expression of porosity on CT slices. It can not only represent the dynamic evolution of pore–fractures during the loading process at a specific location of a coal sample but also represents the heterogeneity of the pore–fracture distribution at different locations of a coal sample at the same loading time point. Based on the “Volume Fraction” (XY planes) command of Avizo, we calculated the surface porosity ϕ2D at different slice positions of the samples at each deformation stage. The calculation principles are as follows:
φ 2 D = S f S s × 100 %
where Sf is the area of pore–fractures in a single 2D slice; and Ss is the total area of the 2D slice.

2.3.3. Quantitative Analysis of Fractal Dimension

The fractal dimension can effectively characterize the complexity of the structure and distribution of pore–fractures in a rock mass [33,43,44]. Its value is positively correlated with the degree of pore–fracture development and the complexity of the surface morphology. The higher the value is, the more complex the pore–fracture network is, and vice versa. Common fractal dimension calculation methods include box dimension, similarity dimension, information dimension, correlation dimension, etc. The box dimension method is widely used for its high computability and better characterization of pore–fractures. Its calculation formula is as follows:
D F = lim α 0 log N α log α = lim α 0 l o g N α log 1 / α
where D F is the fractal dimension, and N α is the number of cubes of side length α required to cover the non-empty subset.
It is calculated by, taking the 2D fractal dimension as an example, covering the curves with fractal features with small square boxes with side length α and counting the number of non-empty small boxes that can partially or completely cover the fractal object. If the side length α of the box is shortened, and the obtained set of α and N(α) data are linearly fitted in double logarithmic coordinates using the least square method, the slope of the resulting straight line is the fractal dimension D F of the fractal object. Its calculation expression is as follows:
log N α = log c + D F log 1 / α
where c is a constant.
The calculation method of the 3D fractal dimension is similar to that of the 2D fractal dimension, except that a cube box is needed to cover the 3D fractal object in the calculation. In this case, α is the side length of the cube, and N(α) is the minimum number of cubes that can cover (or partially cover) the fractal object. Using the fractal dimension algorithm embedded in Avizo, the fractal dimensions of two different dimensions can be automated calculated.
The 2D fractal dimension of fracture structures primarily reflect the changes in pore–fractures at specific cross-sections of loaded coal samples, with values typically ranging between 1 and 2. The 3D fractal dimension compensates for the limitations of the 2D approach by providing a comprehensive description of the entire pore–fracture network evolution from a volumetric perspective, with values ranging between 2 and 3. However, there are a few exceptions in Avizo: when there is no fracture in a CT slice, the 2D fractal dimension will be set to 0; when a fracture structure does not fill the predefined dimensional space, the 2D fractal dimension will be less than 1 or the 3D fractal dimension may be less than 2. Therefore, the fractal dimension calculated based on Avizo can also quantify the extent of the pore–fracture distribution.

3. Results

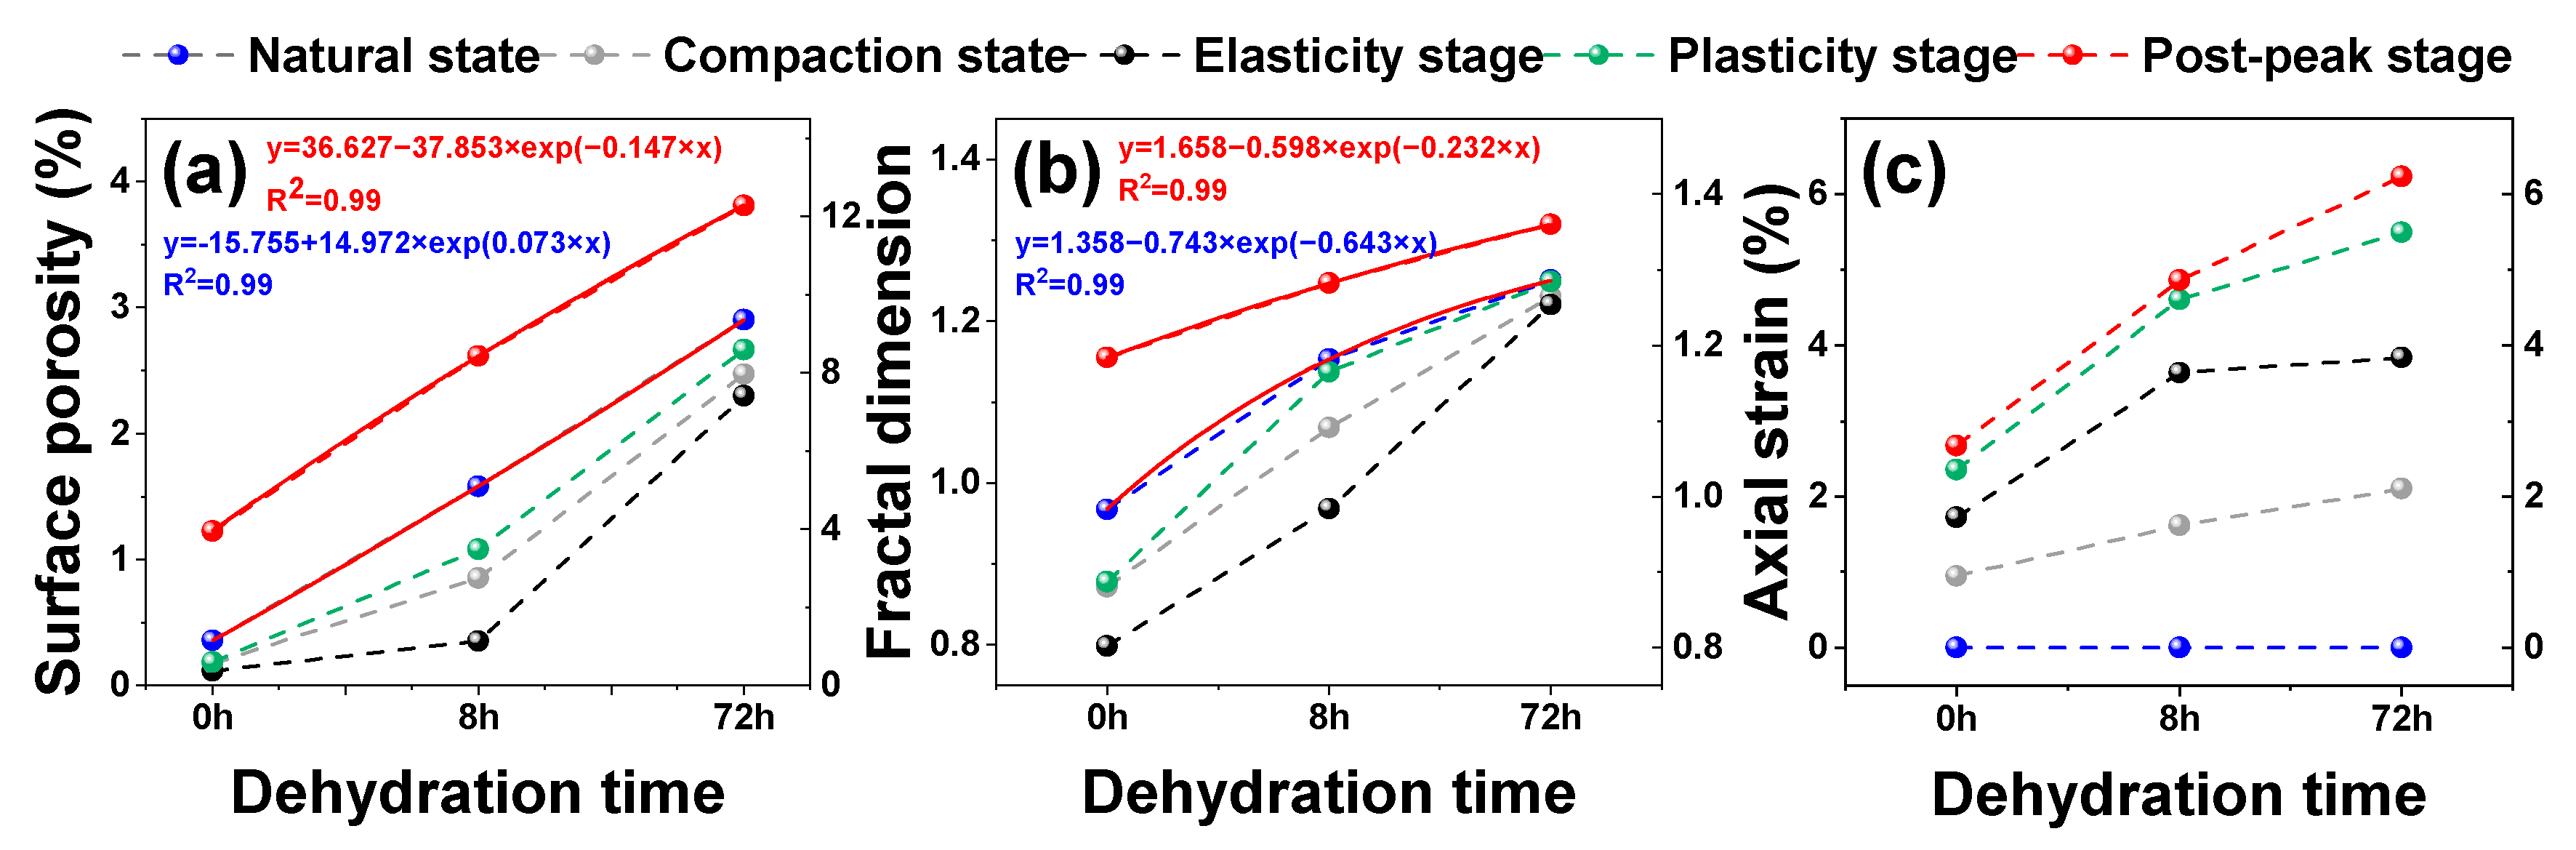
3.1. Macro-Mechanical Property Changes of the Dehydrated Lignite

3.1.1. Overall Mechanical Property Evolution of the Dehydrated Lignite

Figure 4 shows the full stress–strain curves of three groups of lignite samples with different dehydration states. The results show that the evolution of the full stress–strain curves of all lignite samples is generally the same, and all of them have gone through four deformation stages, i.e., initial compaction stage, linear elastic stage, plastic stage, and peak failure stage. A more intuitive classification of the deformation stages and detailed classification criteria can be found in Figure 5(a1–c1) and Section 3.1.3. However, there were obvious deviations in the pre-peak strain characteristics of the three group of samples. With the increase in dehydration time, both the duration of the initial compression stage and the whole pre-peak stage of the lignite samples were obviously prolonged, resulting in a large increase of the corresponding crack closure strain and peak strain, while the duration of the linear stage was obviously shortened, and the slope was significantly reduced. In addition, the post-peak curves of the lignite samples also differed significantly. The S-0h samples fell rapidly after reaching the peak strength and showed strong brittle damage mode with a sudden release of elastic energy. In contrast, the peak stress fall rate of S-8h and S-72h samples decreased gradually, and their brittle damage characteristics were significantly weakened. Particularly for the S-72h samples, the damage characteristic showed obvious plastic behavior. In conclusion, the dehydration effect greatly influenced the pre-peak deformation and post-peak damage behavior of lignite.
A quantitative analysis was conducted on the peak strain, peak strength, and elastic modulus of the three groups of lignite samples under uniaxial compression conditions, as shown in Figure 4(b1–b3). The mean values of the peak strain, peak strength and elastic modulus of the S-0h lignite samples were 2.13%, 9.11 MPa, and 494.82 MPa, respectively. The mean values of the peak strain, peak strength, and elastic modulus of the S-8h lignite samples changed by 108.45% (positive), 7.68% (positive), and 38.32% (negative), respectively, compared with the results of the S-0h group. Furthermore, the three mean values of the S-72h lignite samples varied by 195.77% (positive), 2.75% (positive), and 50.25% (negative), respectively, relative to the results of the tests with the S-0h group. Clearly, the elastic modulus and peak strain of the three groups of lignite samples increased linearly with the increase in dehydration time, while their peak strengths were not affected by the dehydration effect (Figure 4(b1–b3)). In conclusion, the results of the uniaxial compression tests on the dehydrated lignite showed that the dehydration effect had a significant linear weakening effect on the deformation resistance capabilities of the lignite, while it had no significant impact on its peak strength.

3.1.2. Stage-by-Stage Mechanical Property Changes of the Dehydrated Lignite

Figure 5(a1–c1) show the full stress–strain curves of lignite with different dehydration times obtained from in situ CT scanning experiments, respectively. The dots on each curve are the CT scanning points during loading. The background colors with different levels of transparency in the figure represent the various deformation stages of each lignite sample. Taking the S-0h lignite sample as an example, light gray (transparency = 50), light gray (transparency = 20), gray (transparency = 45), and gray (transparency = 30) represent the initial compaction stage I, linear elastic stage II, plastic stage III, and post-peak stage IV of the S-0h lignite sample, respectively. According to this analogy, the coloring standard of each deformation stage of the other two samples can be identified. Obviously, the development characteristics of the full stress–strain curves of the three lignite samples under the influence of dehydration are highly consistent with the conclusions of the previous analysis based on the uniaxial compression experimental curves (see Section 3.1.1).
Figure 5(a1–c1) show that all the scanning points are uniformly distributed at different deformation stages of the three samples, so the stress–strain curve segments between the two neighboring scanning points can be regarded as the macroscopic mechanical responses of the lignite at each deformation stage. Note that the CD section of the stress–strain curve of S-0h lignite spans two different deformation stages, but considering that the overall variation in the CD section is not obvious and exhibits more nonlinear characteristics (about this, we have verified it according to the variation of its pore–fracture structure in Section 3.3, we approximatively regard the mechanical response parameters of the CD section as the parameters of the plastic deformation stage of the S-0h sample. In addition, the BC section is the linear stage of the S-8h lignite, but for the convenience of subsequent comparisons, its elastic stage parameters were set as the average values of the corresponding parameters of the two curve sections BC1 and C1C. After the above adjustments, based on these curve sections, we can obtain the relevant mechanical response parameters of each pre-peak deformation stage for the three samples under the same axial stress, and the results are shown in Figure 5(a2–c2).
In the compaction stage (section AB), after the axial force increased by 2 MPa, the S-0h, S-8h, and S-72h samples exhibited strain increments of 0.94%, 1.62%, and 2.10% and stress increments of 1.67 MPa, 1.73 MPa, and 1.62 MPa, respectively. The calculated secant moduli for the three lignite samples were 177.09 MPa, 107.06 MPa, and 77.19 MPa, respectively. Compared to the results of the S-0h sample, the secant moduli for the S-8h and S-72h samples decreased by 39.54% and 56.41%, respectively. In the elastic stage (section BC), when the axial stress increased by 2.5 MPa, the three samples’ strains increased by 0.77%, 1.16%, and 1.73%, and the stress increased by 2.71 MPa, 2.75 MPa, and 2.70 MPa, respectively, and their calculated secant moduli were 350.42 MPa, 236.62 MPa, and 156.23 MPa, respectively. Compared to the secant moduli of S-0h, the secant moduli of the S-8h and S-72h samples showed reductions of 32.47% and 55.41%, respectively. During the plastic stage (section CD), with the axial stress increasing again by 2.5 MPa, the strain increments of the three lignite samples were 0.64%, 0.91%, and 1.66%, the stress increments were 2.83 MPa, 2.90 MPa, and 2.88 MPa, and the secant moduli were 444.79 MPa, 319.40 MPa, and 173.36 MPa, respectively. Compared with the results for S-0h, the secant moduli of the last two groups decreased by 28.19% and 61.02%, respectively. It is evident that during each pre-peak deformation stage, the strain increment and secant modulus of each lignite sample showed a significant decrease with the extension of the dehydration time. In contrast, the stress increment was not affected by the dehydration effect.

3.1.3. Influence of the Dehydration Effect on the Failure Mode of the Lignite

As mentioned before, the dehydration effect not only significantly affected the pre-peak strain behavior of lignite but also dramatically changed its damage mode. Figure 6(a1–a3) show the typical damage patterns of the three groups of lignite samples in the uniaxial compression experiments, respectively. As shown in the figure, there is only one axial penetration crack with a small opening on the surface of the damaged S-0h lignite sample, and the whole lignite sample is more complete, without noticeable dilatation. After the damage of S-8h, there are three axial cracks with larger openings and more secondary cracks distributed on the surface. Compared to the S-0h sample, the complexity of the pore–fracture network of the S-8h sample was significantly increased, resulting in a more fragmented sample with evident dilation. In contrast to the first two groups, the surface of the failed S-72h lignite sample not only features even wider axial through-cracks but also several large-aperture horizontal through-cracks. These primary cracks connect with a multitude of surrounding secondary cracks, forming an extremely complex crack network that fragments the sample into a greater number of smaller pieces and leading to significant dilation in the S-72h sample. Clearly, the dehydration effect has markedly altered the failure characteristics of lignite under uniaxial compression conditions.
To further analyze the impact of the dehydration effect on the failure behavior of lignite, we plotted the stress–strain curves of unstable fracture expansion stage in plastic stage and post-peak stage (these two stages are defined as the fracture penetration stage) of the three samples in Figure 6(b1–b3), respectively. As shown in Figure 6(b1), under the axial load, the pre-peak stress–strain curve of the S-0h sample is approximately linear, with only a slight nonlinear curvature appearing as it approaches the peak strength. This indicates that fewer new cracks are generated during the unstable fracture expansion stage. After reaching the peak strength, its stress curve rapidly declines, showing clear characteristics of brittle failure. The pre-peak stress–strain curve of the S-8h sample is generally a slightly upward convex nonlinear curve, indicating that new cracks begin to increase during the unstable fracture expansion stage. After reaching its peak strength, although the stress also falls rapidly, the rate of fall has slowed down significantly compared with that of S-0h group, suggesting that its failure mode possesses certain plastic characteristics (Figure 6(b2)). The pre-peak stress–strain curve of the S-72h sample is a markedly upward convex nonlinear curve, indicating that a significant number of new cracks are generated during the unstable fracture expansion stage, leading to noticeable pre-peak strain softening in the lignite sample. After reaching the peak strength, the stress initially declines slowly for a period before suddenly dropping, which suggests that its failure mode exhibits clear plastic characteristics (Figure 6(b3)). From the above analysis, it can be seen that as dehydration time increases, lignite progressively displays more pronounced pre-peak softening behavior and post-peak plastic failure characteristics, demonstrating a shift towards more complex deformation behaviors of lignite samples under the influence of the dehydration effect.
To quantitatively characterize the brittleness–plasticity of lignite samples at different dehydration states after failure, the brittleness index (BI) of each group of samples was calculated based on the initiation stress ( σ c i ) as well as the peak stress ( σ c ) [32,33].The calculated results are shown in Figure 6(c1–c3), and the corresponding formula is shown below:
B I = σ c i σ c
As shown in Figure 6(c1–c3), the crack initiation stress of the S-0h lignite sample is relatively close to its peak stress (Figure 5(a1)), resulting in a high brittleness index of 0.77 (Figure 6(c1)). This indicates that the S-0h sample exhibits significant brittle failure characteristics accompanied by a sudden release of elastic energy at failure. Compared to the S-0h sample, the crack initiation stress of the S-8h sample is slightly further from its peak stress (Figure 5(a2)), leading to a modest reduction in its brittleness index by 5.19% to 0.73 (Figure 6(c2)). This suggests that the brittle failure characteristics of the S-8h sample are slightly weakened, and it shows some plastic failure features. However, its failure mode remains predominantly brittle. Compared to the first two groups of lignite samples, the crack initiation stress of the S-72h sample is significantly further from its peak stress (Figure 5(a3)), resulting in a substantial decrease in its brittleness index by 27.27% to 0.56 (Figure 6(c3)). This indicates that the S-72h sample displays clear plastic failure characteristics at failure, with no sudden release of elastic energy. Instead, there is significant strain-softening behavior observed. Clearly, the dehydration effect has a notable impact on both the pre-peak stress–strain behavior and the post-peak failure mode of lignite, and the brittleness index used in this study can effectively quantify this influence.

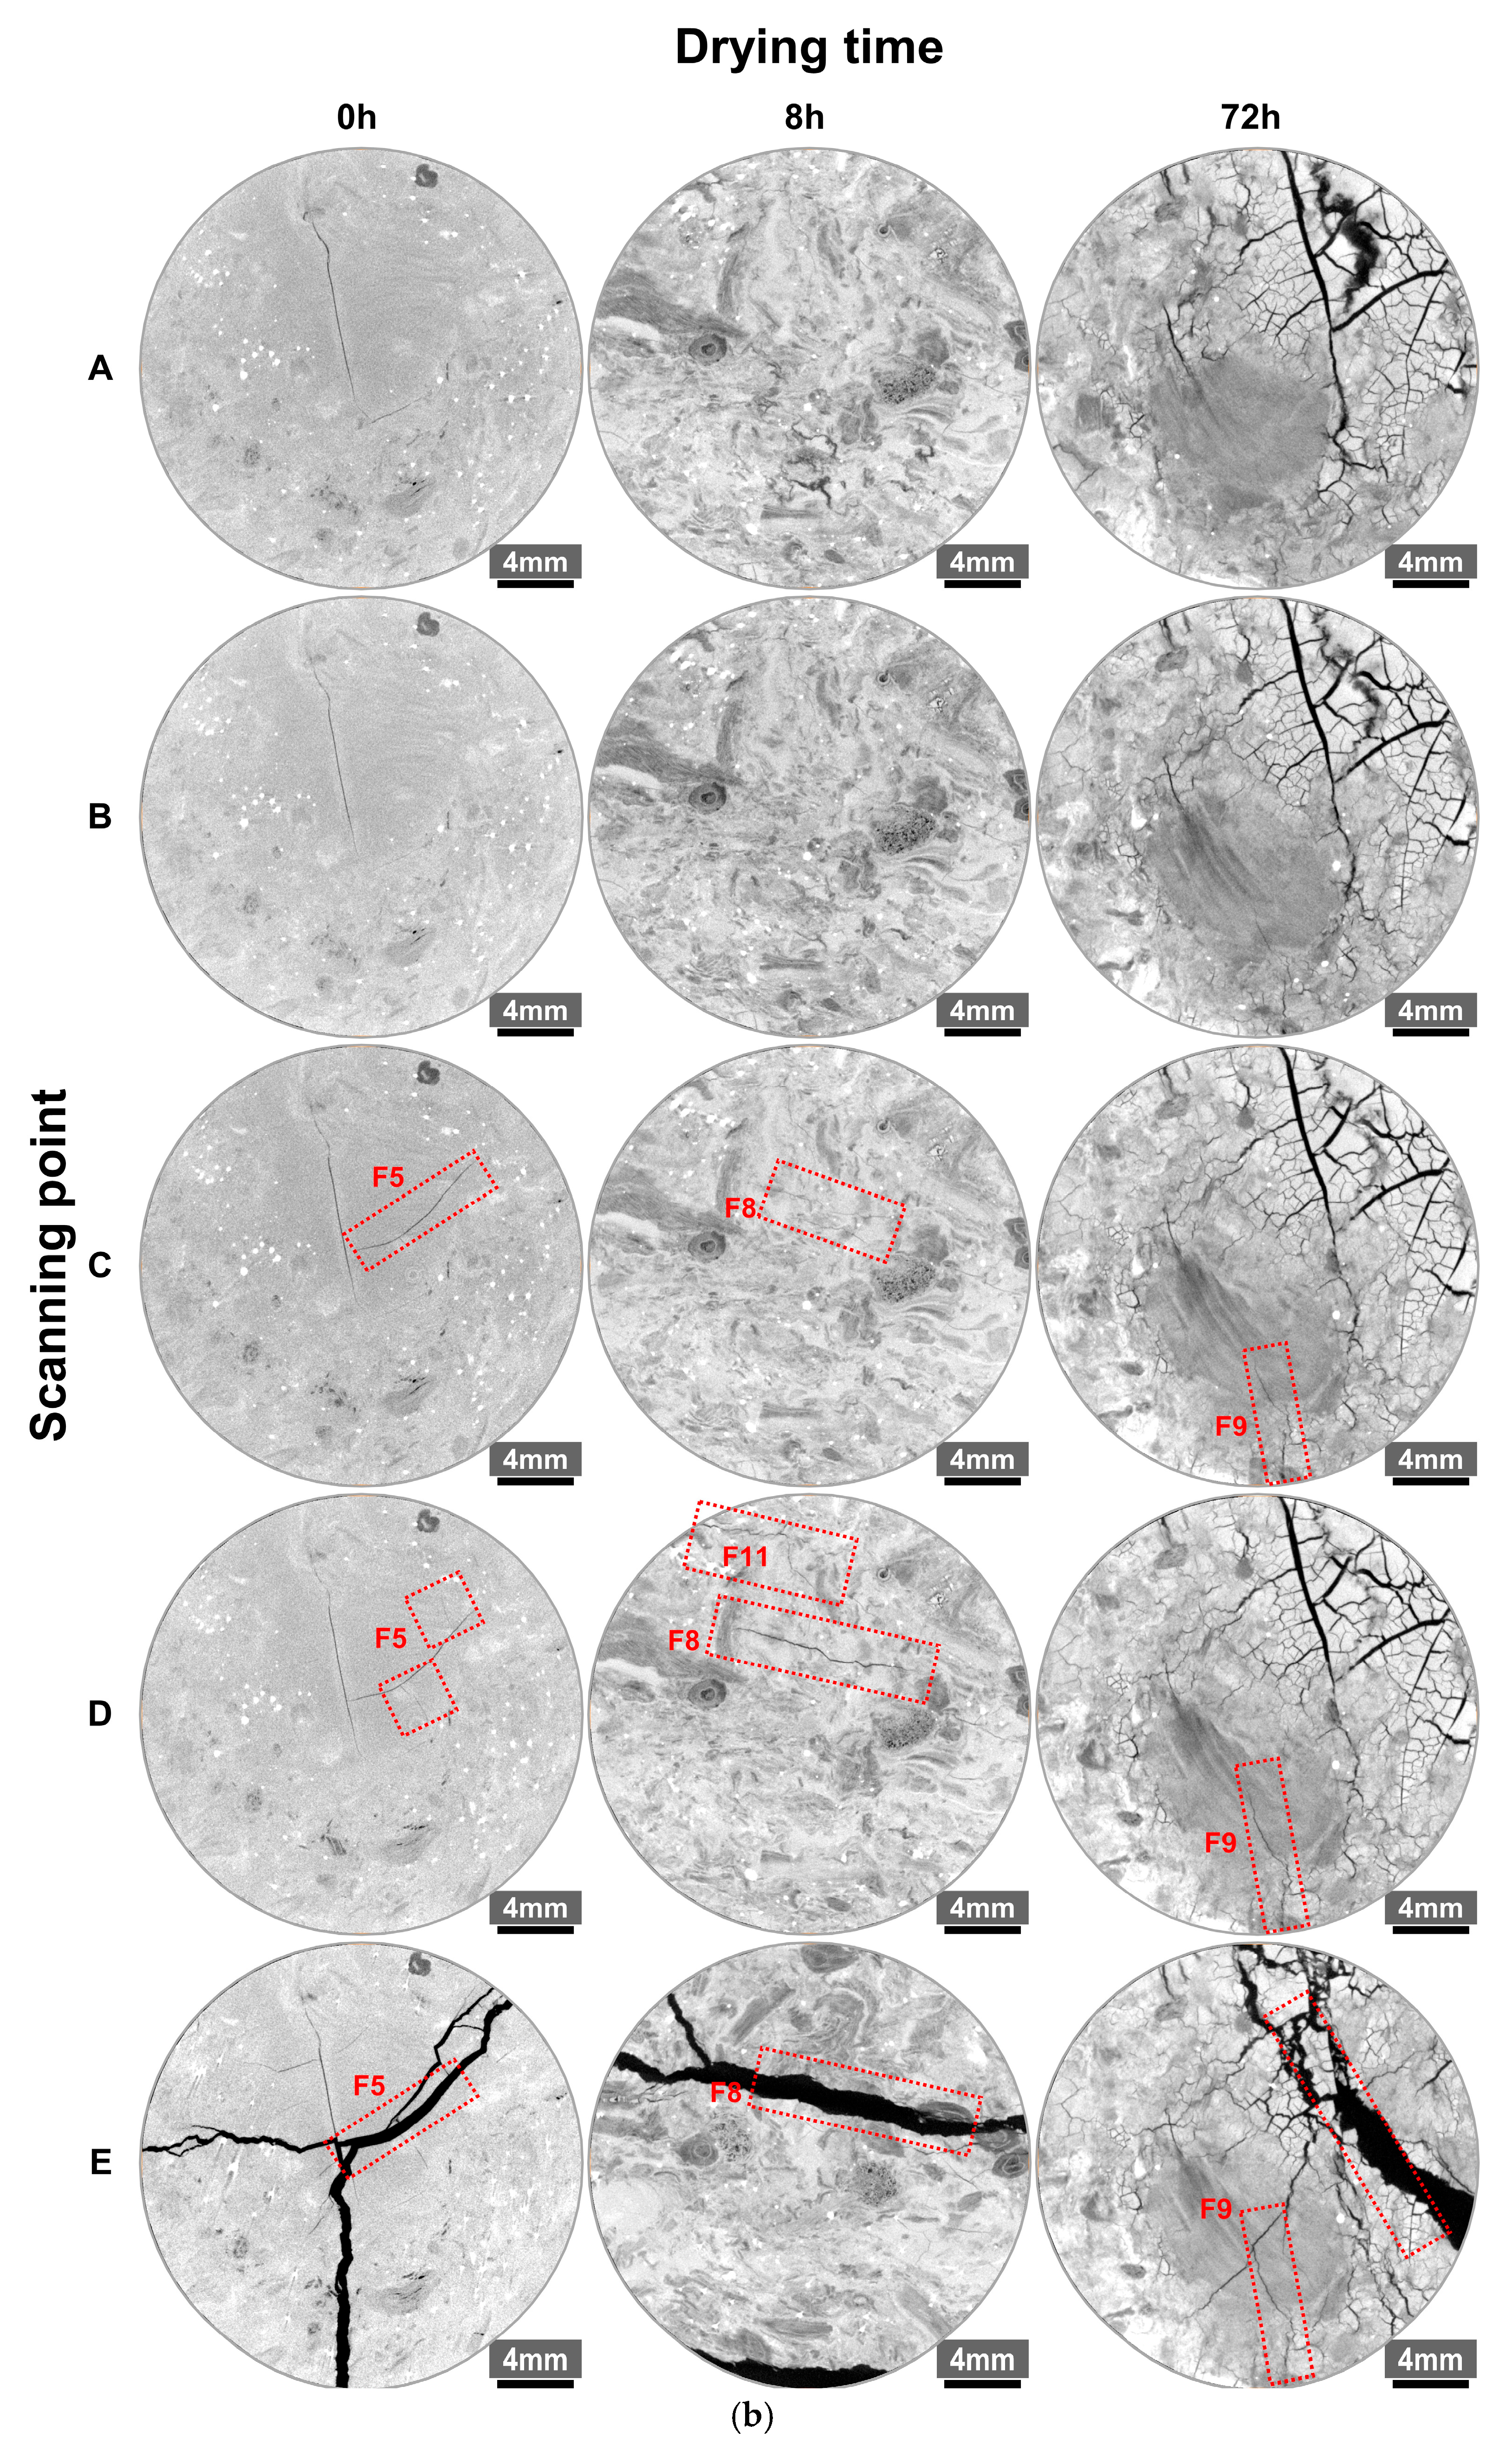
3.2. Dynamic Evolution of 2D Pore–Fractures in Dehydrated Lignite

3.2.1. Qualitative Analysis of 2D Pore–Fracture Dynamic Evolution in Dehydrated Lignite

Tracking the evolution of 2D pore–fractures at specific locations in lignite samples may help us understand, from a microscopic perspective, how dehydration affects the stress–strain response characteristics of lignite under uniaxial compression conditions. Figure 7a,b show the dynamic evolution process of the pore–fractures on specific slices of three groups of lignite samples at various deformation stages in the XZ plane and XY plane, respectively. The XZ plane slices are mainly used to describe the dynamic evolution of horizontal cracks, while the XY plane slices are mainly used to illustrate that of axial cracks.
Initial stage (Scan A): All three groups of samples were non-uniformly distributed, with different numbers of cracks. S-0h group mainly had horizontal primary cracks at bedding planes and vertical cracks within the hard layer. Due to dehydration shrinkage effects, the S-8h group shows wider and longer horizontal cracks along bedding planes and more vertical cracks within harder layers compared to S-0h lignite. In contrast to the first two groups, the S-72h sample exhibits severe cracking due to prolonged dehydration, with numerous larger vertical cracks within harder layers with larger openings, which were connected with horizontal cracks along adjacent bedding planes, forming an extremely complex pore–fracture network. Clearly, dehydration promotes the cracking of lignite samples with larger sizes and a greater number of well-oriented cracks.
Compaction stage (Scan B): Most of the horizontal fractures in the three samples were obviously closed under pressure (the horizontal fractures in the S-0h group were almost invisible), leading to the obvious concavity of the stress–strain curves of each of them. As shown in Figure 5, the longer the dehydration time is, the more horizontal cracks are developed in the lignite samples, the more obvious the concavity of the curve is, and the longer the duration of the compression section is. That is to say, the effect of dehydration aggravates the pressurized closure activity of the pore–crack network of the lignite samples. In addition, most of the vertical cracks in all the samples were not pressed to closure. Instead, a small number of vertical cracks, such as F1 and F2 in S-8h and F3 and F4 in S-72h, even showed slight opening, especially the F3 crack in the S-72h sample, suggesting that the dehydration effect advanced the occurrence of localized damage in the lignite samples. This is attributed to the fact that the dehydration effect promotes the development of pore–cracks in the samples, which leads to a decrease in the bearing capacity of the microstructure in the samples.
Elastic stage (Scan C): Since the horizontal cracks in the S-0h sample fully closed during the compaction stage, its crack evolution primarily involved the initiation and propagation of a few axial cracks. For example, under the action of axial force, the axial crack F5 showed slight opening (XZ plane) and obvious extension (XY plane). In contrast, crack evolution in the S-8h and S-72h groups involved the compression of some unclosed horizontal cracks (F6) and the expansion of more vertical cracks (F3, F7, F8, and F9). Although these behaviors do not fundamentally alter the linear stress–strain relationship during the elastic stage, they lead to a noticeable decrease in its elastic modulus and duration. Overall, during this stage, axial cracks begin to form and propagate, gradually shifting the dominant type of the pore–fracture system from horizontal to vertical cracks. The longer the dehydration time is, the more obvious the vertical crack emergence–expansion and the structural transformation of the pore–crack system are.
Plastic stage (Scan D): The CT slices in Figure 7 and the stress–strain curves in Figure 6 show that the three groups of lignite samples underwent different degrees of micro-plastic cracking. The degree of plastic cracking in the S-0h sample is relatively low, and only two fine bifurcation cracks (XY plane) sprouted around the F5 fissure, so the overall deformation of the samples is still dominated by the elastic behavior. For the S-72h sample, the openness and length of the axial cracks of F3, F7, and F9 increased significantly, and some of the cracks even showed a tendency of interconnection, resulting in more serious plastic cracking in the whole sample. For the S-8h group, although a large number of axial cracks, such as F8, F10, and F11, sprouted and cracked inside the sample, a considerable part of the sample was still in an elastic state, making the degree of plastic damage significantly smaller than that of the S-72h group. Obviously, the dehydration effect promoted the micro-plastic cracking of the lignite samples in the plastic stage, which enhanced the softening characteristics of the pre-peak strain (Figure 6(b1–b3)).
Post-peak stage (Scan E): When the axial stress exceeded the peak strength, all three groups underwent varying degrees of splitting failure. The S-0h group formed a simple pore–fracture network with a small number of main cracks with low openings along crack F5 and no significant secondary cracks, exhibiting clear brittle failure characteristics with large fragment sizes. The S-8h group formed a more complex pore–fracture network with more main cracks with larger openings along crack F8 and crack F10 and more secondary cracks, showing certain plastic failure characteristics with slightly smaller fragments. Compared to the previous two groups, the S-72h group developed an extremely complex fracture network with even more, larger main cracks and numerous secondary cracks along F3 and F3’, resulting in the smallest fragments and clearest plastic failure characteristics. Clearly, the dehydration effect promotes the development of pore–fracture networks, intensifies fragmentation, and significantly alters the failure mode of the coal samples after failure.

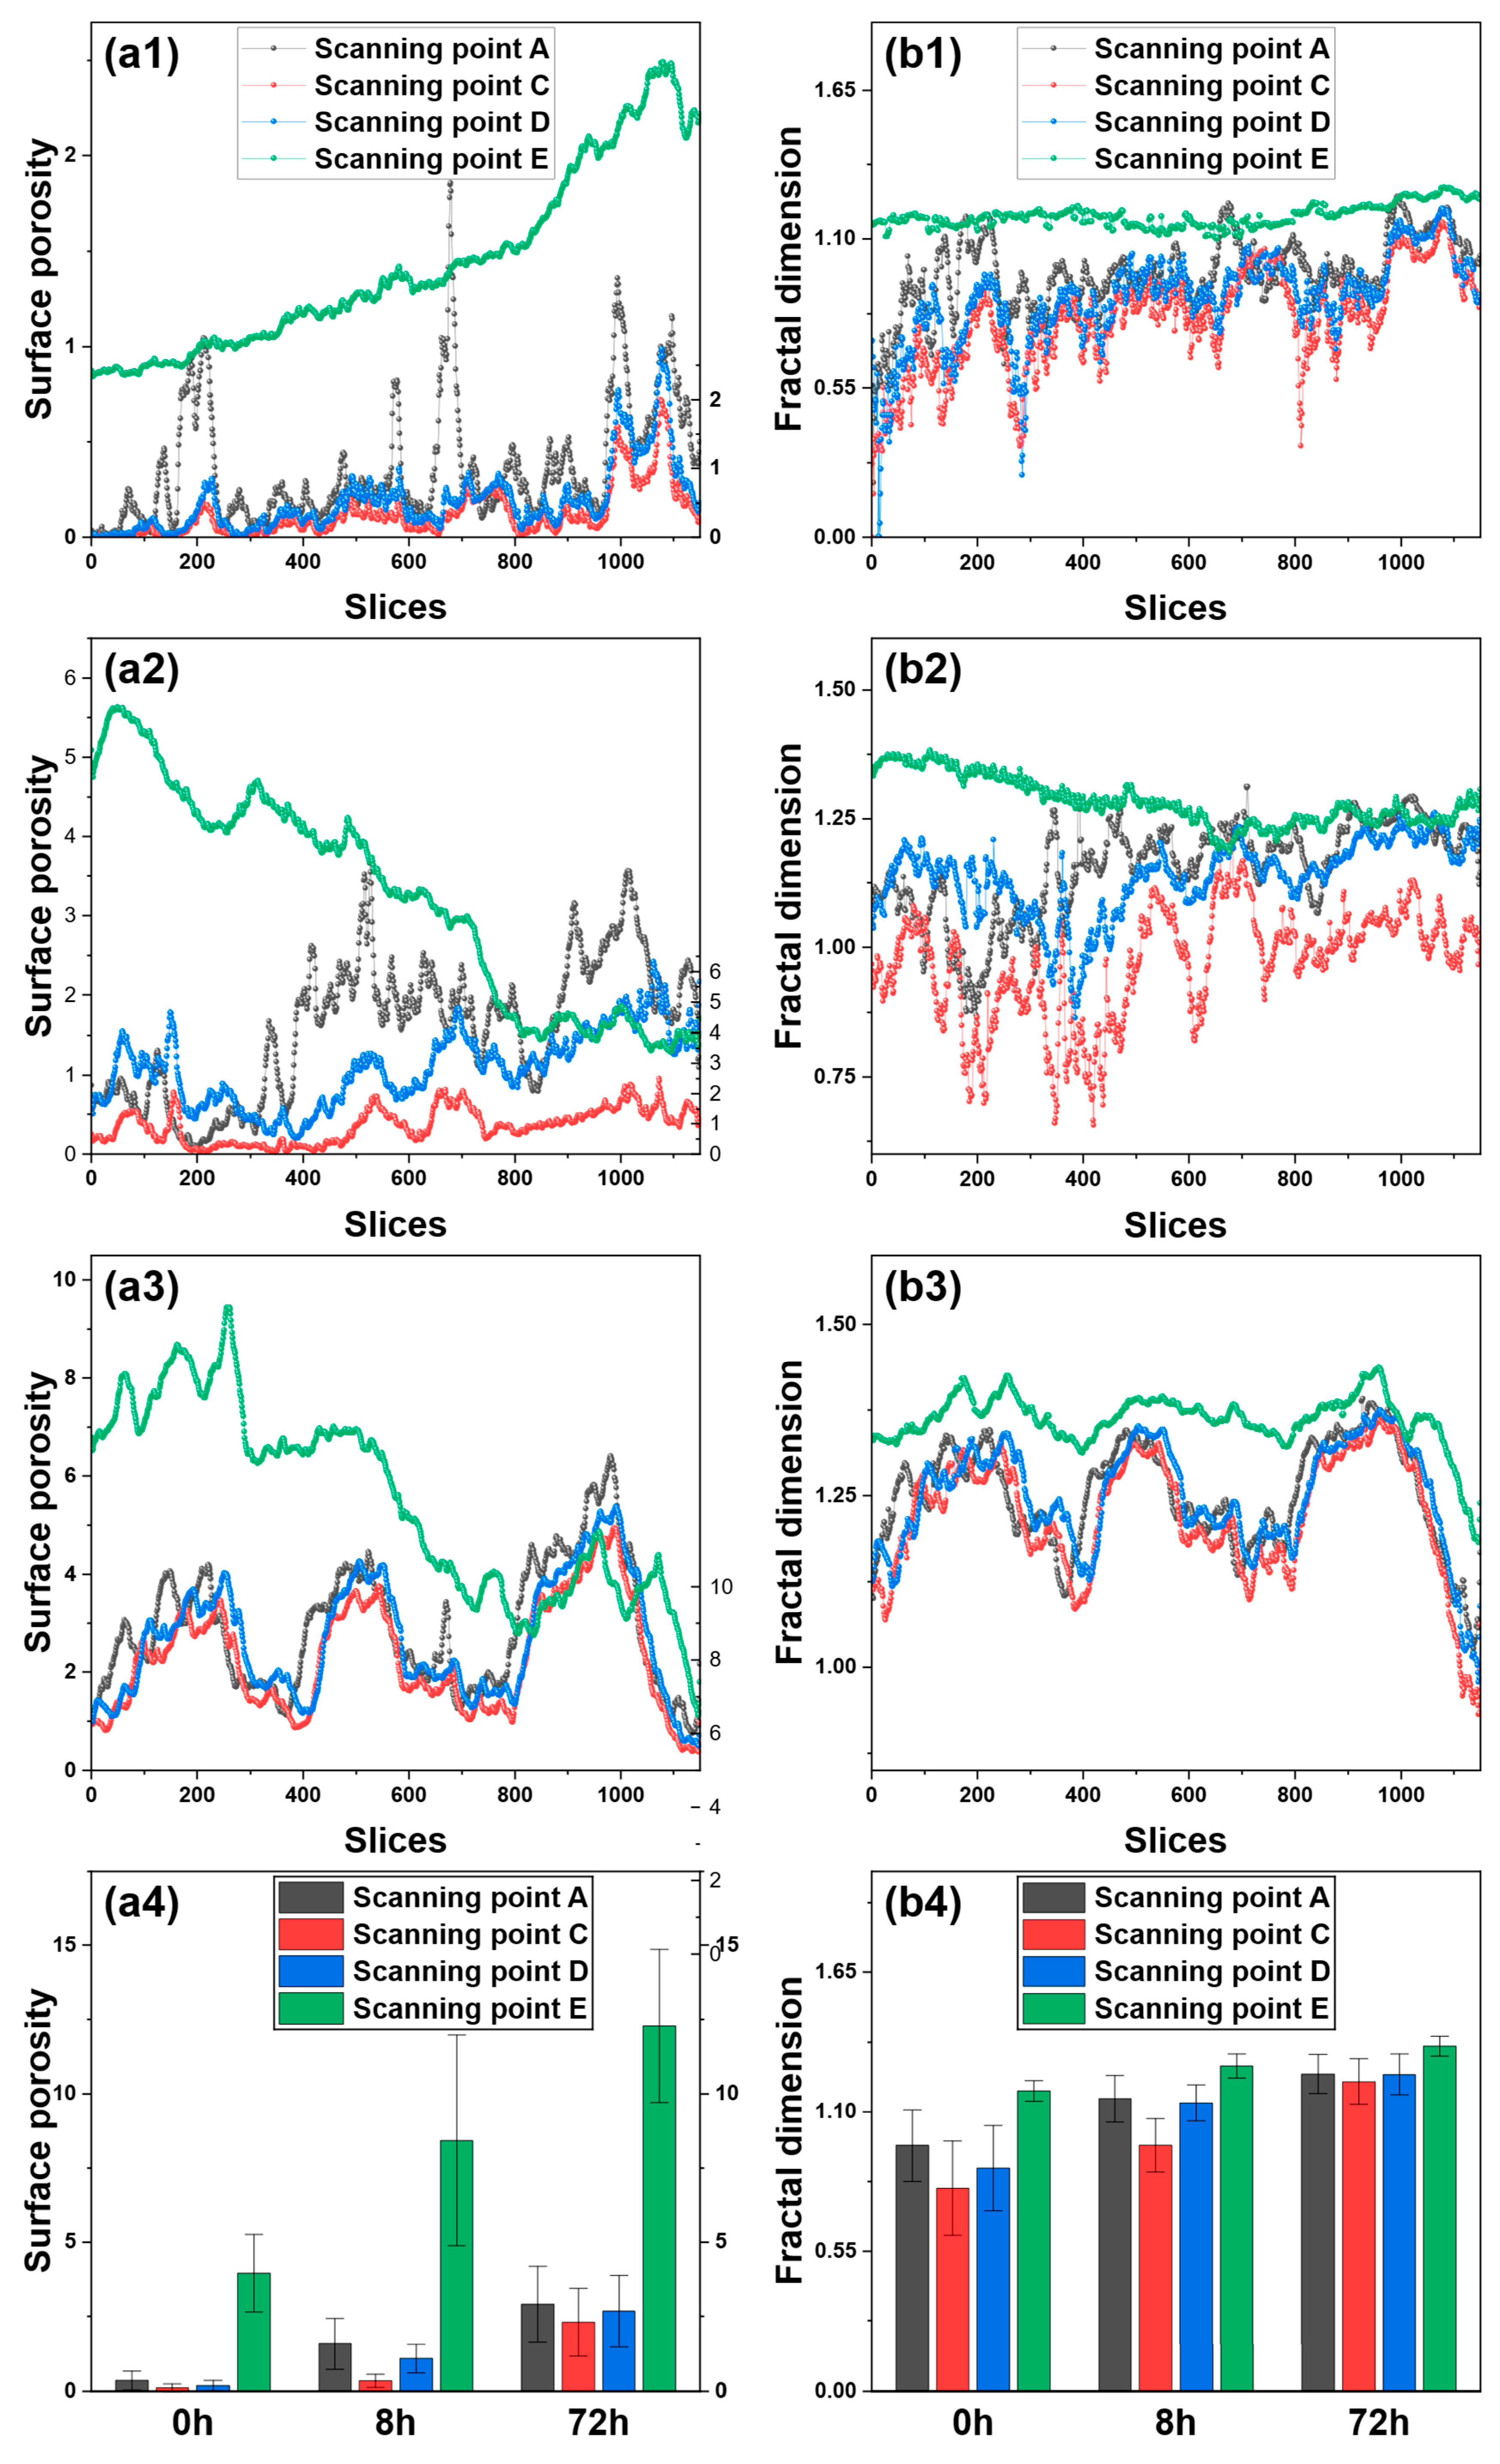
3.2.2. Quantitative Analysis of 2D Pore–Fracture Dynamic Evolution in Dehydrated Lignite

To further clarify the pore–fracture evolution law of lignite with different dehydration times, based on the modules of Volume Fraction (XY plane) and Fractal Dimension (XY plane) in Avizo software, we performed a 2D quantitative analysis of the pore–fractures of three lignite samples at each deformation stage. Meanwhile, we also elaborated the variation of the heterogeneity of the fracture distribution within the material based on the standard deviation of the surface porosity, and the results are shown in Figure 8 and Table 3.
Figure 8(a1–b3) show the variation characteristics of the surface porosity and 2D fractal dimension, hereinafter referred to as PD values, at different positions within the three coal samples at various loading steps, as well as the overall evolution trend of the coal sample’s pore–fracture structure represented by their average values (Figure 8(a4,b4)). As shown in Figure 8(a4,b4), both the average porosity rate P ¯ 2 D and the average 2D fractal dimension D ¯ F , 2 D exhibit the same change pattern characterized by “decreasing in the compaction and elastic stage–increasing in the plastic stage–sharply increasing in the post-peak stage” as the pore–fracture evolves. During the elastic stage, due to the compression of a large number of horizontal cracks, the distribution curves of the PD values for all three groups of coal samples show a noticeable decline, and the three samples’ P ¯ 2 D values decrease from their initial states of 0.36, 1.58, and 2.90 to 0.12, 0.35, and 2.30, respectively. Similarly, their D ¯ F , 2 D values also decrease from their initial states of 0.97, 1.15, and 1.25 to 0.8, 0.97, and 1.22, respectively. Since the fractal dimension is not only related to the pore–fractures’ volume but also to their spatial occupancy and surface roughness, this results in inconsistent decreases between the two values, which is normal. In the plastic stage, different degrees of plastic cracking occurred at different locations within the samples, so the PD values at different locations of the samples increased to different degrees. Naturally, the P ¯ 2 D and D ¯ F , 2 D values of the samples also increased by varying degrees. After the coal samples were crushed, the generation of destructive fracture systems with varying complexities inside the three coal samples caused noticeable increases in their PD curves to different extents. The P ¯ 2 D increased sharply from 0.18, 1.08, and 2.67 during the plastic stage to 3.95, 8.42, and 12.28, respectively. Similarly, the D ¯ F , 2 D of the three coal samples also increased from 0.88, 1.14, and 1.25 during the plastic stage to 1.08, 1.28, and 1.36, respectively. Obviously, the more penetrating cracks there are in a particular CT slice of a coal sample, the higher the PD values for that slice, while the more developed the destructive cracking system is in a coal sample, the higher the P ¯ 2 D and D ¯ F , 2 D values will be in that sample.
As shown in Figure 8(a4) and Table 3, the σp of all three lignite samples shows the same change characteristics as the P ¯ 2 D and D ¯ F , 2 D with the evolution of pore–fractures during uniaxial compression. Since it can quantitatively characterize the heterogeneity of the pore–fracture distribution of the lignite samples [24], the evolution of the heterogeneity of the pore–crack distribution of each group of coal samples during uniaxial compression follows the same trend as that of the P ¯ 2 D and D ¯ F , 2 D , i.e., decreasing in the compaction and elastic stage–increasing in the plastic stage–sharply increasing in the post-peak stage.
As can be seen from Figure 8 and Table 3, the distribution curves of the PD values of the three coal samples at the same deformation stage, as well as the values of P ¯ 2 D , D ¯ F , 2 D , and σp, increased significantly with the extension of the dehydration time. For example, the D ¯ F , 2 D values of S-0h, S-8h, and S-72h in the elastic stage were 0.80, 0.97, and 1.22, respectively, and their σp values in the plastic stage were 0.18, 0.47, and 1.21, respectively. This directly led to an increase in the fluctuation of the trends of P ¯ 2 D , D ¯ F , 2 D , and σp in the uniaxial compression process of each coal sample. That is, the longer the dehydration time, the greater the increase in the values of each parameter, and the higher the fluctuations in their evolutionary trends. From Figure 8(a4) and Table 3, it can also be seen that the higher the complexity of the initial pore–fracture of the coal samples, the larger the above-mentioned three parameters at each deformation stage during the loading process. Apparently, the increase in pore–fracture complexity and heterogeneity with dehydration time at the same deformation stage during uniaxial compression is explained by the fact that the dehydration effect increases the complexity of the initial pore–cracks of the coal samples (Figure 7).
To further investigate the effect of dehydration on the pore–crack complexity of the coal samples, we quantitatively analyzed the correlation between 2D pore–fracture parameters and the dehydration time of the coal samples at each deformation stage, as shown in Figure 9. The results show that the P ¯ 2 D and D ¯ F , 2 D of the coal samples all increase to different degrees with the increase in dehydration time at each deformation stage, which again suggests that the dehydration effect obviously improves the complexity of the pore–crack of the coal samples at each loading stage. By fitting the data in the initial stage and the post-peak damage stage, we found that the relationship between the two parameters and the dehydration time could be expressed using the same positive exponential equation, i.e., y = A + B × exp(C × x). In addition, from the fitting results shown in Figure 9, the correlation coefficients (R2) all equal 0.99, indicating that the two parameters of the coal samples and the dehydration time have a strong nonlinear correlation. Figure 9 also shows that in other deformation stages (compaction, elastic, and plastic stages), P ¯ 2 D and D ¯ F , 2 D show a complex nonlinear positive correlation with the dehydration time. This may be explained by the percentage of cracks with different geometrical parameters in the pore–fracture networks and their different stress responses during loading, but the overall trend remains consistent with that of the axial displacement (Figure 9c).

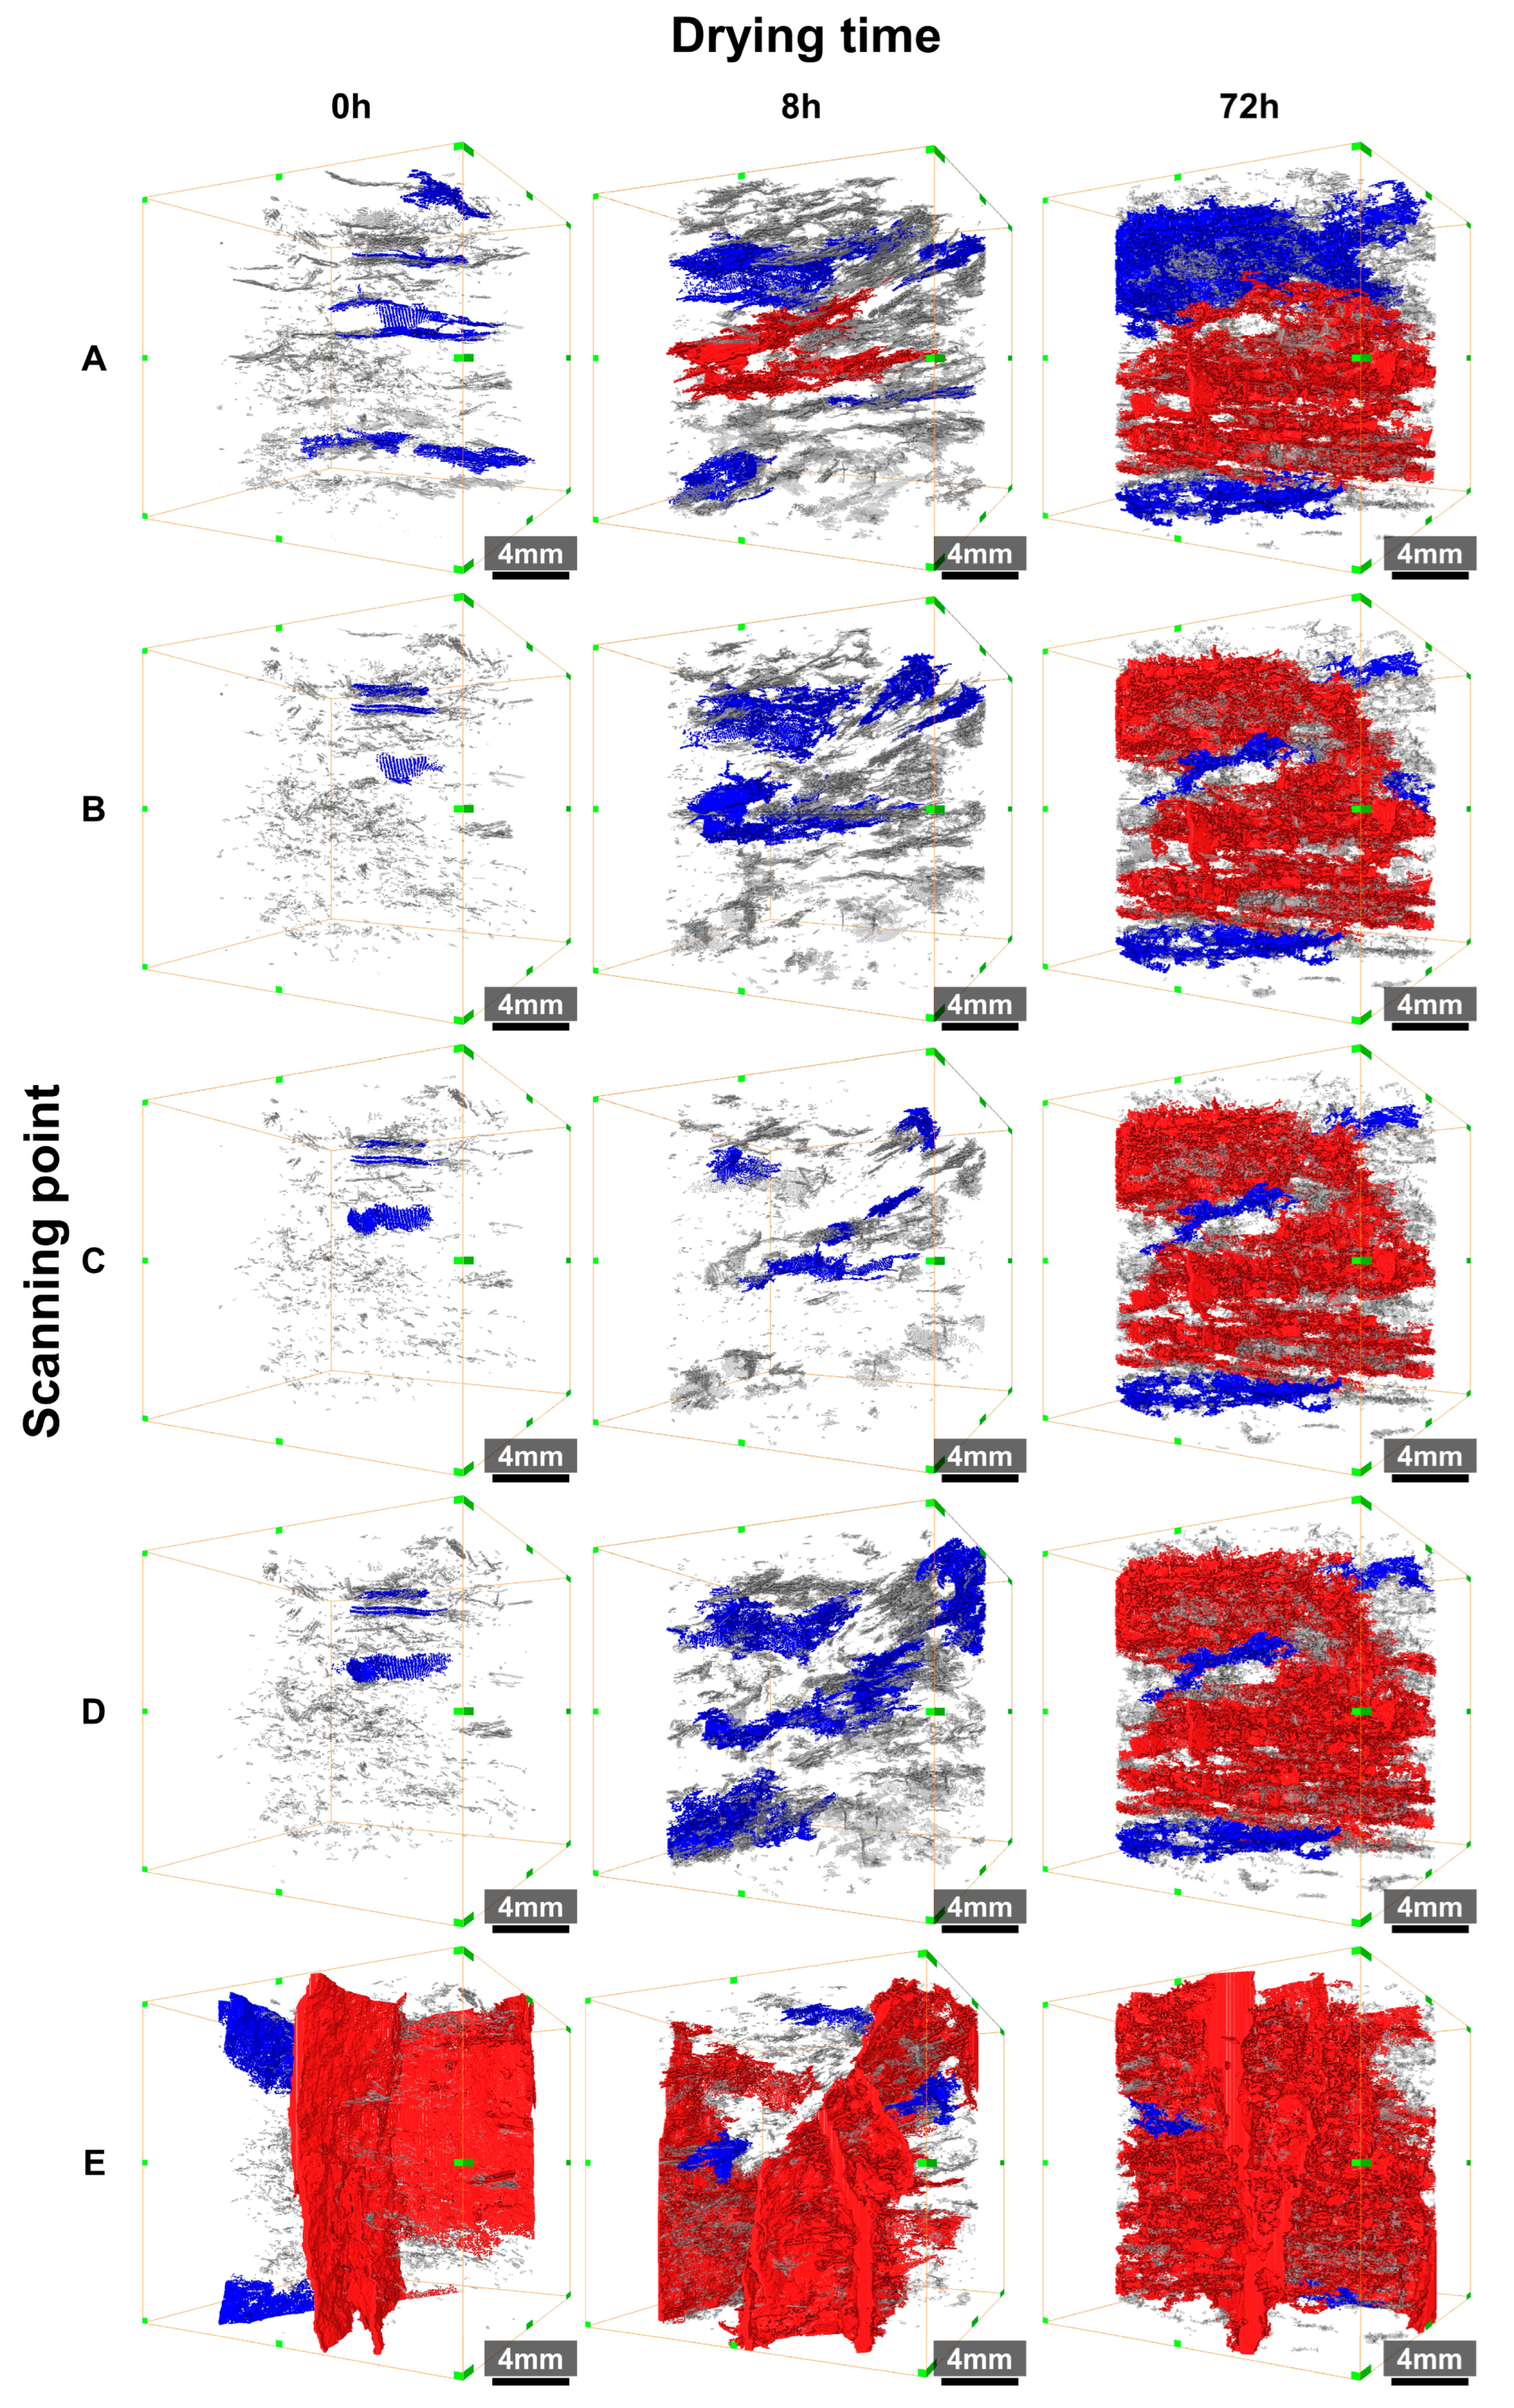
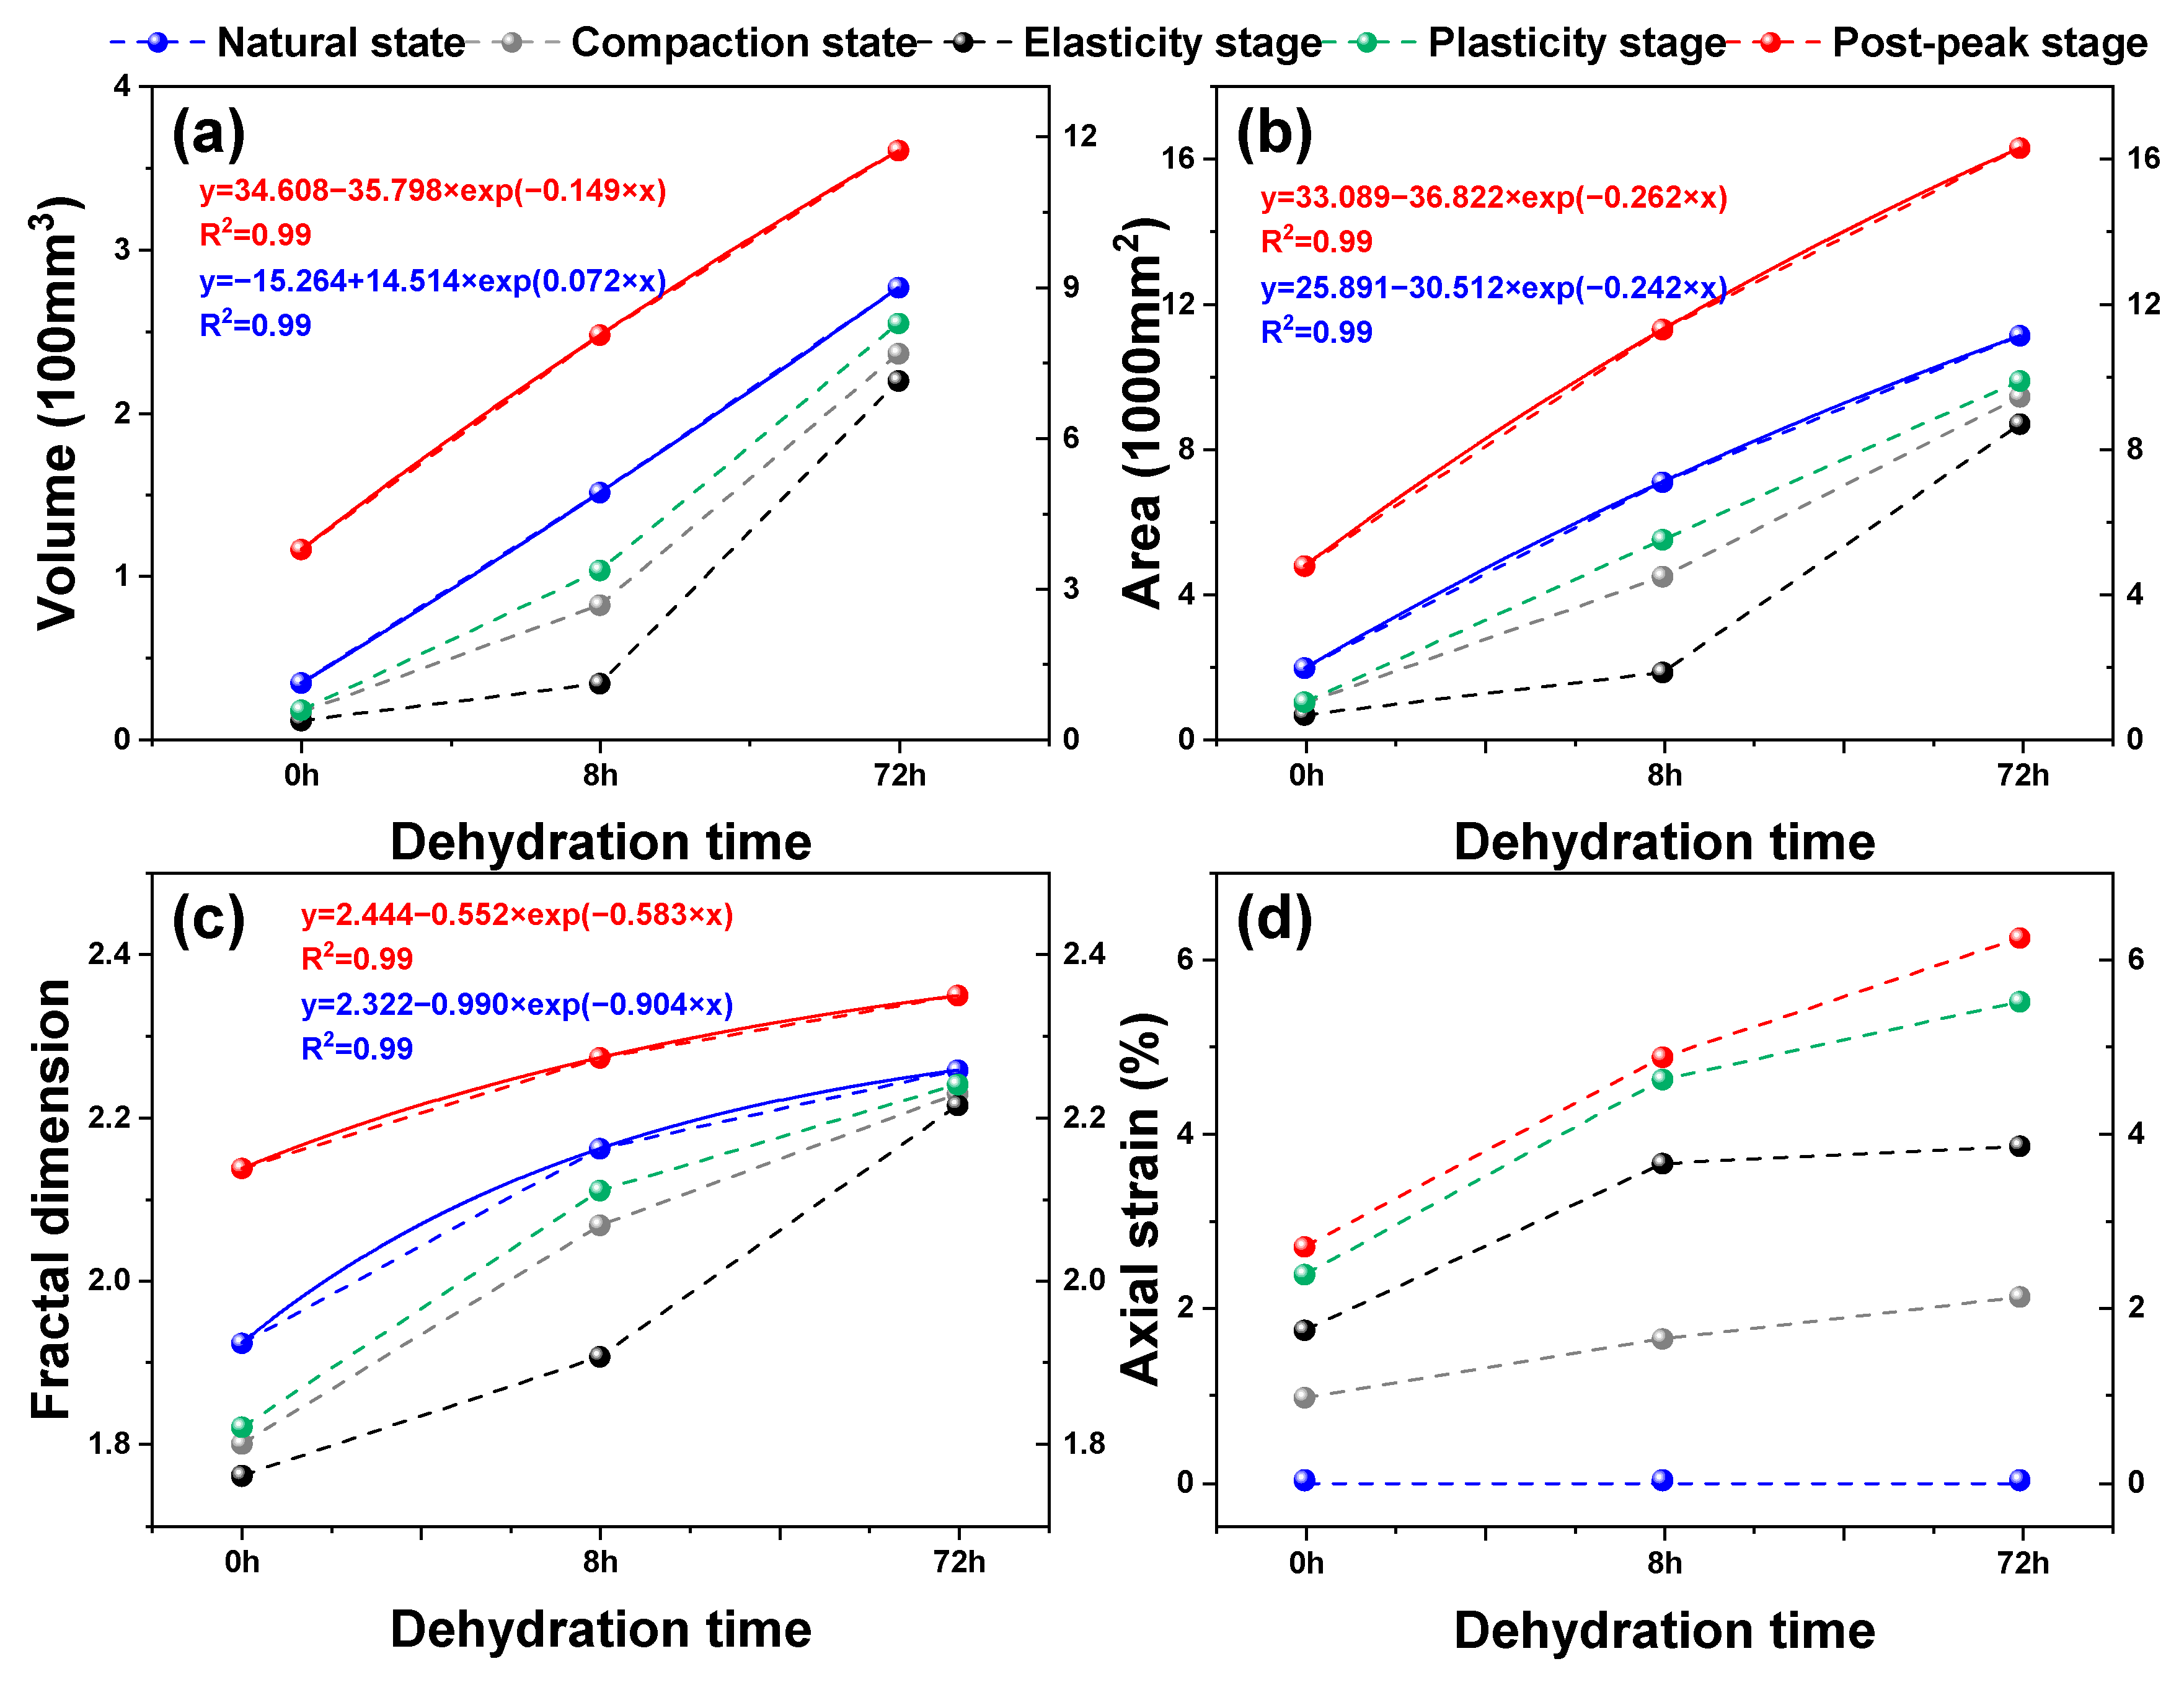
3.3. Dynamic Evolution of 3D Pore–Fractures in Dehydrated Lignite
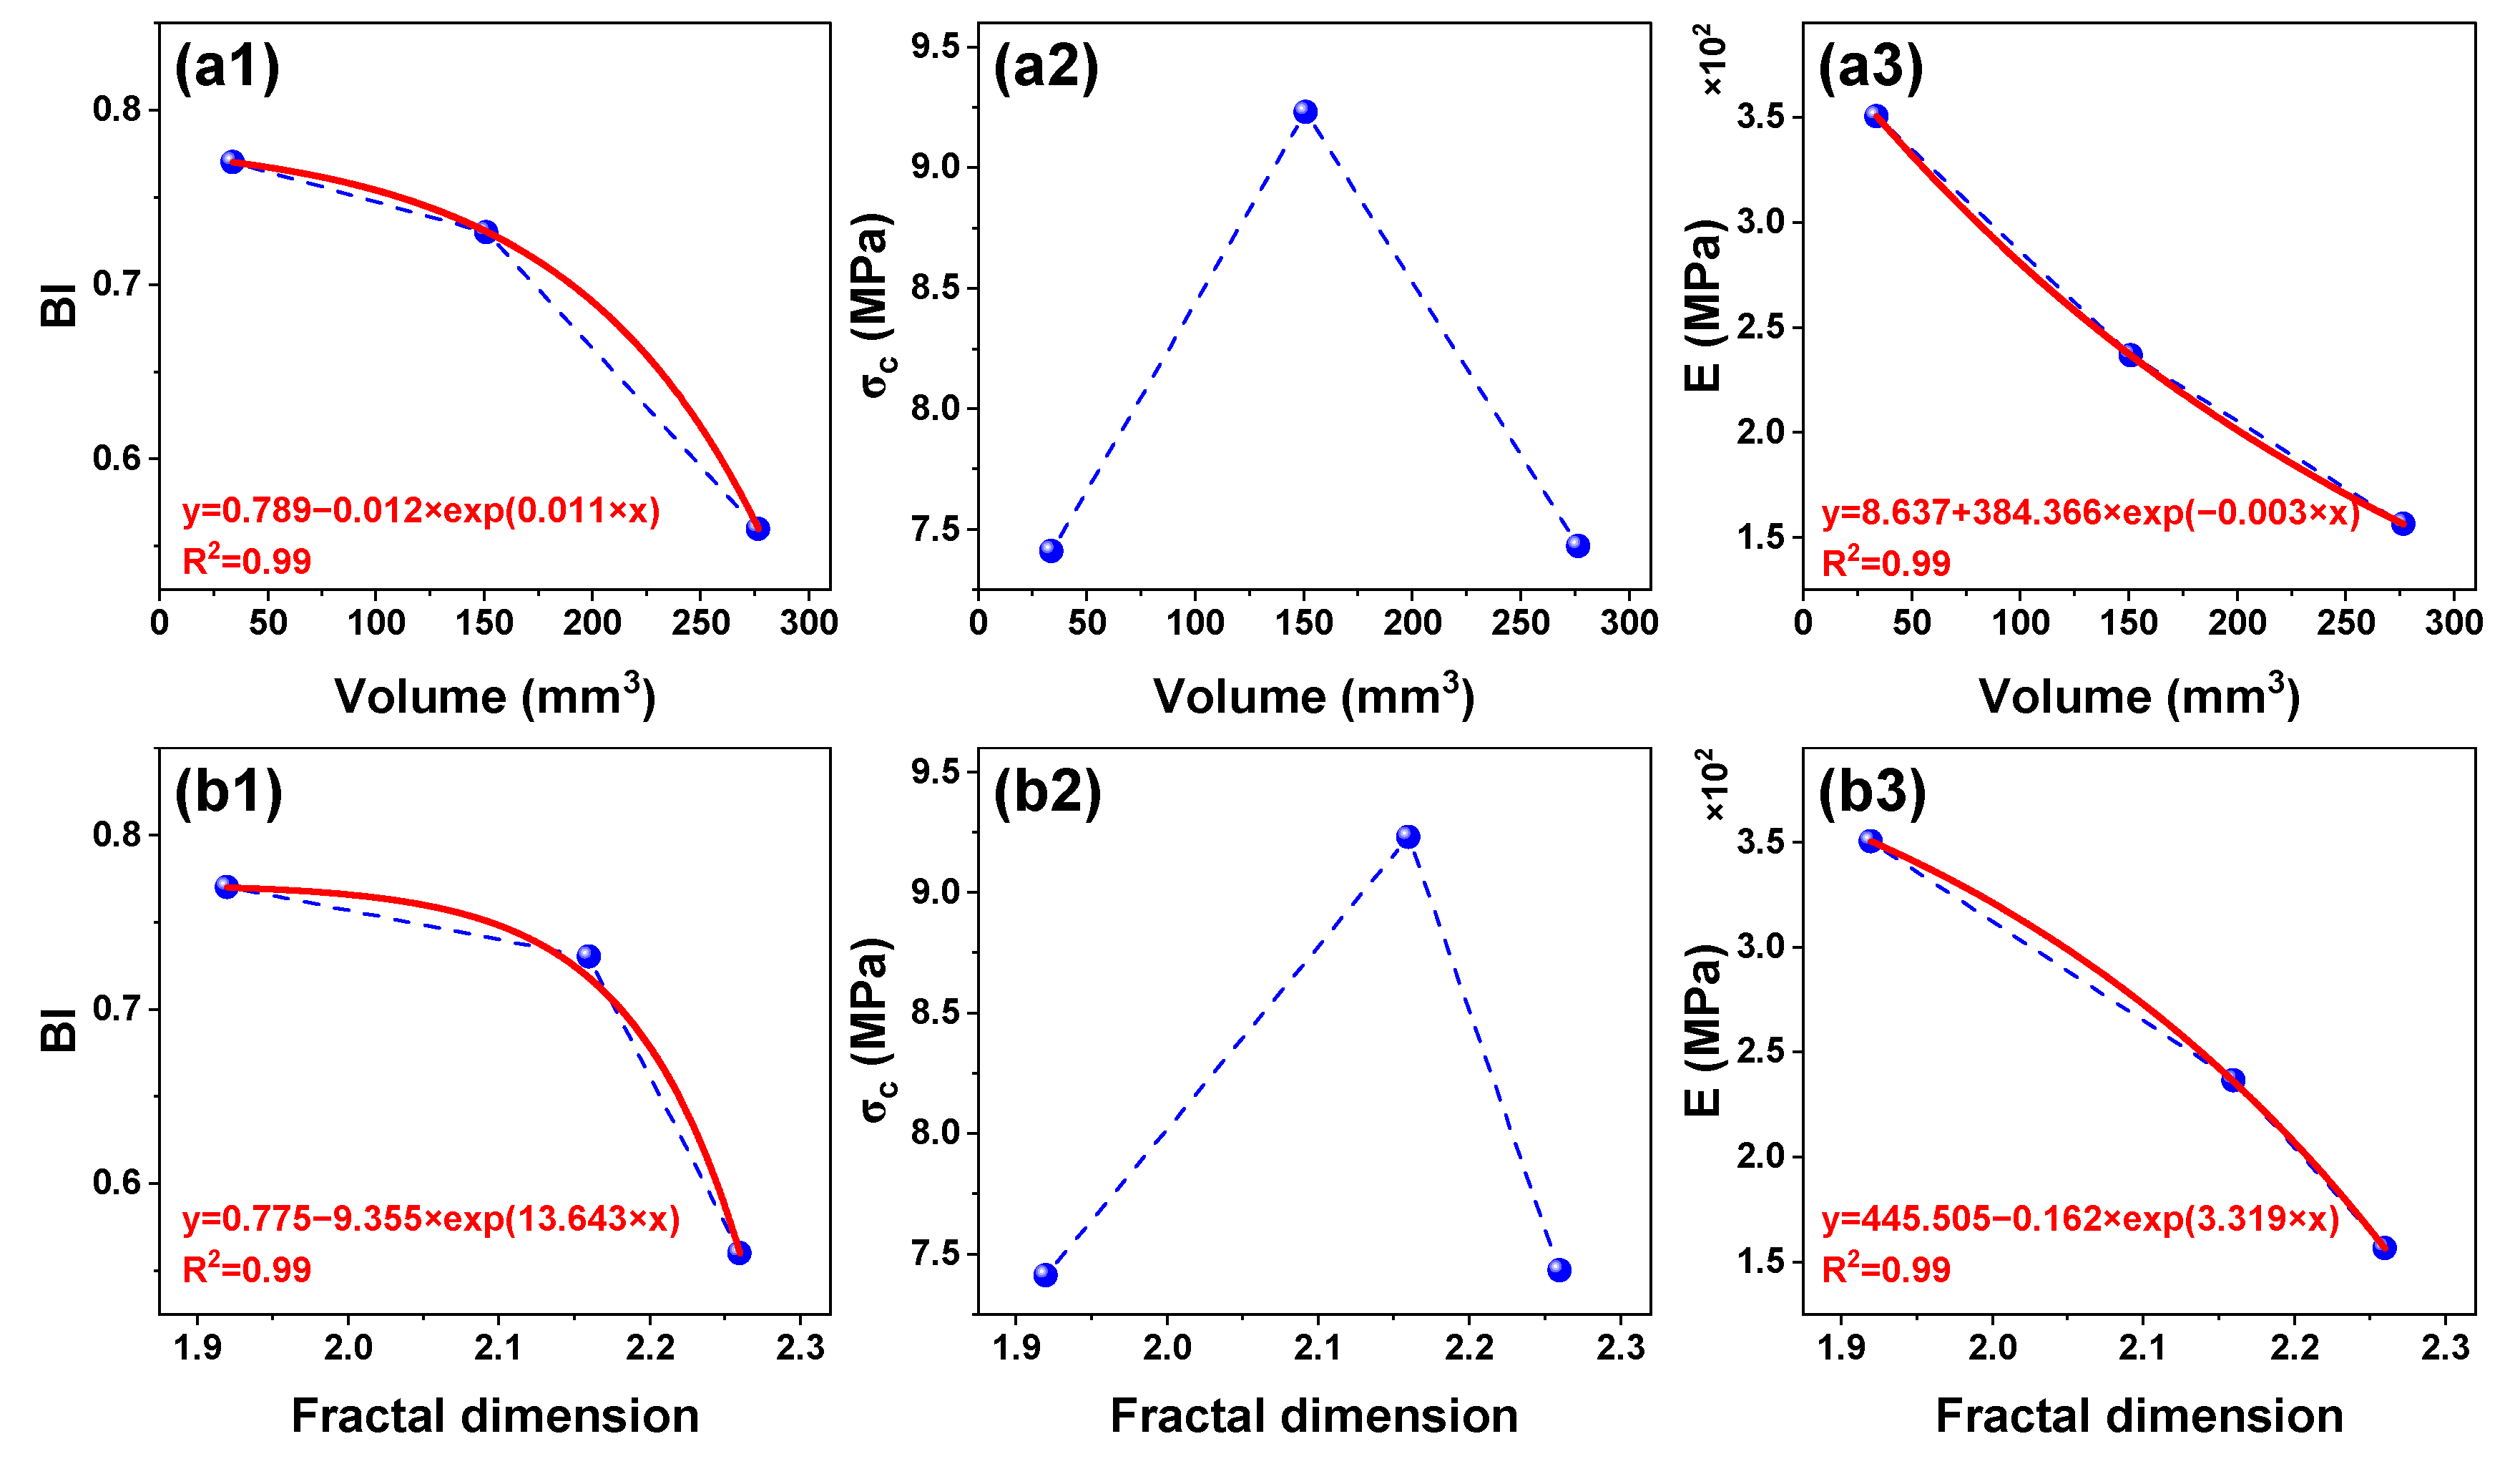
Compared with other pore characterization techniques, CT scanning technology can intuitively visualize the 3D morphological features of the pore–fracture system, which will undoubtedly deepen the understanding of the evolution of the cracks. Based on Avizo software, we extracted and visualized the 3D pore–fracture systems of each coal sample under each loading step using the method in Section 2.3.1 (Figure 10). Further, based on Avizo’s Label Analysis, Fractal Dimension(3D), and Axis Connectivity modules (Neighborhood = 26), we quantitatively analyzed a series of 3D structural parameters of the pore–fracture system, and the results are shown in Figure 11 and Table 4.
Initial stage (Scan A): As can be seen from the scanning results of Scan A in Figure 10, the three coal samples are non-uniformly distributed, with different sizes of initial pore–fracture networks inside them, and their pore–fracture networks’ volume, area, and fractal dimensions (denoted as (volume; area; fractal dimension)time) are (33.96 mm3; 1936.77 mm2; 1.92)0h, (150.99 mm3; 7084.84 mm2; 2.16)8h, and (276.80 mm3; 11,126.54 mm2; 2.26)72h, respectively. In addition, their connectivity (ratio of connected pore–fracture volume to total pore–fracture volume) was 0, 28.75%, and 47.37%, respectively. According to the variations of these parameters, the dehydration effect not only obviously increased the complexity of the fracture network but also increased the connectivity of the fracture network, which verified the promotion of the dehydration effect on the development of pore–fractures. It should be noted that the magnitude of the values of both the 2D and 3D fractal dimensions is not only related to the volume of the fracture but also to the spatial spreading and surface roughness of the fracture. Thus, it is normal for the fractal dimension of the S-0h sample to be less than 2 due to the fact that the cracks in the sample do not fill the entire dimensional space.
Compaction stage (Scan B): The horizontal fractures of all three groups of coal samples showed obvious contraction, especially in the S-0h and S-8h coal samples. The shrinkage closure of the cracks not only caused a decrease in the volume, area, and fractal dimension (abbreviated as VAD) of their pore–cracks (Table 4) but also caused the disappearance of pore–crack connectivity in the S-8h coal samples (Figure 10, S-8h-B), while for the S-72h coal samples, the axial extension of the local cracks caused the crack cluster at the top of the samples to interconnect with the initial connected pore–cracks, forming a larger scale of connected pore–cracks. It should be noted that the S-72h coal sample has the largest ε1 (up to 2.10%), but its VAD value has the smallest decrease. This is due to the limitation of CT scanning resolution, since we can only observe the pore–fracture structure above 20 μm, and it is hypothesized that there is a large number of microfractures below CT resolution in S-72h, and they are compressed and contribute most of the ε1 in this stage.
Elastic stage (Scan C): The VAD value of the three sets of coal samples was (11.18 mm3; 651.46 mm2; 1.76)0h, (33.71 mm3; 1818.89 mm2; 1.90)8h, and (219.71 mm3; 8689.06 mm2; 2.21)72h, respectively. Compared with the previous stage, they all showed different degrees of decrease. In addition, we also observed significant horizontal fracture closure under pressure on the pore–fracture distribution images (e.g., Figure 10, S-8h-C). However, these indications do not suggest the absence of fracture expansion at this stage. On the contrary, axial fracture expansion activity, which is positively correlated with the dehydration time, occurred in all coal samples. Therefore, it can be inferred that with the large-scale disappearance of horizontal cleavage and the beginning of axial fracture development, the type of the fracture system of the three groups of coal samples has irreversibly and fundamentally changed during the elastic stage, i.e., from the horizontal crack-dominated fracture system to the axial crack-dominated fracture system, which is in line with the observation results of the 2D fracture in Section 3.2.1.
Plastic stage (Scan D): All three groups of coal samples had different degrees of axial fracture extension and local plastic damage, which led to a significant increase in the complexity of their respective pore–fracture systems, as well as structural parameters, compared with the previous deformation phase. Specifically, the S-0h coal sample, which was not affected by the dehydration effect, had the lowest pore–fracture complexity and plastic damage, presenting only a number of small-sized fractures and a small number of plastic cracking zones. The S-72h sample, which was severely affected by the dehydration effect, showed the most severe plastic damage due to the distribution of large-sized cracks with well-developed connectivity and a large number of plastic cracking zones. Compared with the S-0h group, the S-8h group, which was moderately affected by the dehydration effect, developed more large-sized axial cracks, but they were not connected with each other, and most of the sample were still in the state of elastic deformation. It is easy to find that the VAD value of the plastic stage of the coal samples is becoming larger and larger with the increase in dehydration time. Obviously, the dehydration effect promotes the complexity of the fracture structure of lignite coal samples in the plastic stage.
Post-peak stage (Scan E): After failure, the internal cracks of the three coal samples expanded and penetrated along the axial cracks formed in the elastic stage and formed three axial penetrating crack networks with different degrees of complexity but showed significantly different damage characteristics. As can be seen from Figure 10, the S-0h coal sample rapidly ruptured along the axial direction into a penetrating crack system with simple shape, small opening, and a limited number of secondary cracks, showing obvious brittle damage characteristics. Its parameters increased accordingly to (377.13 mm3; 4758.84 mm2; 2.14)0h. The S-8h coal sample fractured brittlely along the axial direction into a complex penetrating crack system consisting of a larger number of secondary cracks and several main cracks with larger openings. Compared with the S-0h sample, its plastic damage areas increased significantly, resulting in a corresponding increase in the VAD value to (804.48 mm3; 11,292.50 mm2; 2.27)8h, which was significantly larger than that of S-0h. The S-72h coal sample ruptured into an extremely complex penetrating crack system with the largest number of secondary cracks. All the internal regions showed obvious plastic cracking, causing a rapid increase in the VAD value to (1172.61 mm3; 16,319.31 mm2; 2.35)72h. Obviously, similar to other deformation stages, the VAD and connected pore–crack volume of the pore–fractures of the damaged coal samples increased significantly with the increase in dehydration time.
Figure 11 shows the general evolution trend of the VAD values with the change of stress–strain curve (or pore–crack evolution) for each coal sample, and the background colors with different levels of transparency in the figure represent different deformation stages of each coal sample. The coloring standard of each deformation stage for all samples is consistent with that of Figure 5. The results show that the changes of VAD values of the three groups of coal samples with the change in pore–cracks exhibit the same pattern: “continuous decrease in the compaction and elastic phase, gradual increase in the plastic phase, and sharp increase in the post-peak phase”.
From Figure 11 and Table 4, it can also be observed that the dehydration effect increased the pore–crack complexity of the coal samples at the initial stage, which, in turn, caused a corresponding increase in the pore–crack complexity at the same deformation stage during uniaxial compression, resulting in a significant rise in the VAD value of each coal sample at the same deformation stage with the prolongation of the dehydration time. For example, the fracture volumes of S-0h, S-8h, and S-72h in the compression stage were 16.36 mm3, 81.73 mm3, and 236.12 mm3, respectively, and their fractal dimensions in the plastic stage were 1.82, 2.11, and 2.24, respectively. This directly led to an increase in the fluctuation of the trend of the VAD during uniaxial compression of each coal sample. That is to say, the longer the dehydration time, the more complex the initial pore–crack structure is, the greater the fluctuation of the pore–crack evolution trend of each coal sample during uniaxial the compression process.
Combining the analysis of pore–fracture evolution in both 2D and 3D cases, it can be seen that the dehydration effect positively affected the complexity of the pore structures at each deformation stage during uniaxial compression by positively influencing the development of the initial pore–fractures of lignite. Based on the data in Table 4, we analyzed the correlation between the dehydration time and the pore–fracture parameters of the coal samples at each deformation stage to quantitatively illustrate the relationship between the dehydration effect and the pore–fracture at each deformation stage, as shown in Figure 12. The results show that the VAD values of the pore–fractures of the coal samples increased significantly with the prolongation of the dehydration time regardless of the deformation stage, which again verified the positive influence of the dehydration effect on the evolution of the pore–fractures of the loaded coal samples. Fitting the data for the pre-loading and post-peak phases, we found that the relationship between the VAD values and the dehydration time all conformed to the same numerical equation, i.e., y = A + B × exp(C × x), which was consistent with the fitting results in the 2D condition. In addition, the correlation coefficients (R2) of all the fitting results were as high as 0.99, indicating the correctness of the fitting results. Note that due to the differences in the pore–crack structure and microscopic stress response of each coal sample, the VAD value at each deformation stage showed a more diverse, nonlinear positive correlation with the dehydration time during the loading process, but the overall change trend was still consistent with that of the axial strain (Figure 12d).
Combining the fitting results for both 2D and 3D cases, it is clear that the dehydration effect promotes the development of pore cleavage at the initial stage of the coal samples in a positive exponential manner, which, in turn, positively influences the evolution of the cleavage network of the coal samples in the rest of the deformation stages during the uniaxial compression process. Quantitative analysis of this effect revealed that all pore–fracture parameters, including 2D parameters ( P ¯ 2 D , D ¯ F , 2 D , and σp) and 3D parameters (volume, area, and DF,3D), showed a positive nonlinear correlation with the dehydration time at each deformation stage of the lignite.

4. Discussion

In Chapter 3, we discussed in detail the effect of dehydration on the evolution of microscopic pore–cracks and the macroscopic mechanical behavior of coal samples under uniaxial compression. The results showed that the dehydration effect significantly affected their macroscopic deformation resistance ability and the failure mode. In addition, the dehydration effect positively affected the evolution of the pore–fracture structures at each deformation stage during uniaxial compression by positively influencing the development of the initial pore–fractures of lignite. Here, we will quantitatively analyze the differential influence of the dehydration effect on the macroscopic mechanical properties of coal samples from the perspective of the initial pore–crack structure.
Table 5 compares the meso-structural parameters of the three groups of coal samples with their macro-mechanical parameters during uniaxial compression. From the table, it can be seen that the longer the dehydration time, the larger the initial pore–fracture volume, fractal dimension and other parameters are. However, the larger the initial pore–fracture parameters, such as the fractal dimension, the greater the pore–fracture parameters at each deformation stage during the uniaxial compression process. This again verifies the conclusion in the first paragraph of this section. In addition, with the increase of the initial pore–crack structure parameters, both the secant modulus of each pre-peak deformation stage and its overall elastic modulus and brittleness index decrease gradually. Thus, it can be seen that the initial pore–crack structure of the coal samples has an obvious influence on the macroscopic deformation and failure mode during uniaxial compression. The influence mechanism is that the dehydration effect changes the pore–fracture evolution of the loaded coal samples by positively influencing the initial pore–fracture development in a nonlinear way, which, in turn, affects the macroscopic deformation and damage behavior of the coal samples at each deformation stage and throughout the whole compression process.
To deepen the understanding of the above influence mechanism, we fitted the correlation between the representative parameters of the initial pore–fracture and the main macro-mechanical parameters under different dehydration times in Table 5, as shown in Figure 13. The results show that both the initial pore–fracture volume and fractal dimension showed obvious negative exponential relationships with the brittleness index and elastic modulus of the coal samples, and all of them followed the same form of exponential equation, i.e., y = A + B × exp(C × x). In addition, the correlation coefficients of the four groups of fitting results are all 0.99, which indicates the correctness of the fitting results. However, there is an obvious deviation here, i.e., the relationship curve between the pore–fracture volume and E shows a negative exponential relationship of concave and downward, while the relationship curve between the fractal dimension and E shows a negative exponential relationship with an upward convex shape. Considering that the fractal dimension of the pore–fracture is a comprehensive expression of its volume, spatial spreading, and surface roughness, we tend to believe that the functional relationship between the pore–fracture parameters and E can be approximately expressed by the correlation between the fractal dimension and E. In addition, the correlation between the fractal dimension and BI also shows a negative exponential relationship with upward convexity, so it is considered that the relationship between the initial pore–fracture parameters and the macroscopic deformation and failure mode parameters (E and BI) of coal samples with different dehydration times can be expressed as a nonlinear, negative, exponential relationship with upward convex characteristics: y = A + B × exp(C × x).
Figure 13 also shows that there is no significant correlation between the volume and fractal dimension of the initial pore–cracks and the uniaxial compression strength of the coal samples under different dehydration times. In other words, the development of initial pore–cracks has no significant weakening effect on the uniaxial compression strength of coal samples under natural dehydration conditions. The possible reasons may be as follows: (1) The initial pore–cracks after dehydration mainly consisted of vertical cracks in the hard layer and horizontal cracks at the bedding plane. Most of the horizontal cracks were closed after compression, and the remaining vertical cracks in the hard layer failed to connect with each other to form a penetrating crack until the plastic stage (Figure 7a and Figure 10). Note that in the pore–fracture structure diagrams of each pre-peak stage of the S-72h sample (Figure 10), the penetration directions of the connected pore–fractures are all in the XY direction. (2) The results of an atomic force microscopy (AFM) test of lignite matrix fragments during wet–dry cycling showed that [17] the average Young’s modulus and adhesion force of lignite after wet–dry cycling did not change significantly compared with its natural state, i.e., the micro-mechanical properties of lignite did not undergo significant weakening during wet–dry cycling. Since the nature and preparation conditions of the lignite samples studied by this scholar are highly similar to those of the present study, this conclusion is also applicable to the changes in the micro-mechanical properties of lignite under natural dehydration conditions.

5. Conclusions

(1) The dehydration effect significantly influenced the pre-peak deformation and post-peak damage behaviors of lignite. The full stress–strain curves of different dehydrated coal samples obtained from uniaxial compression and in situ CT scanning tests all showed that with an increase in the dehydration time, both the compaction stage and the overall duration increased significantly, while the duration of the elastic stage was shortened considerably. The secant modulus of each deformation stage as well as the elastic modulus decreased linearly with the increase in dehydration time. In addition, as the dehydration time was prolonged, the damage mode gradually shifted from brittle to plastic, with the fragmentation characteristics becoming increasingly obvious. However, the dehydration effect exerted little significant influence on the peak strength.
(2) Qualitative analysis based on the in situ CT scanning data showed that the dehydration effect exacerbates the intensity of pore–fracture evolution activities at all deformation stages by promoting the development of the initial pore–fracture network in lignite. Specifically, it induces the generation and subsequent compression-induced closure of more horizontal cracks. Simultaneously, it promotes the initiation and propagation of more axial cracks, the manifestation of more severe plastic damage, and the formation of more convoluted and interconnected penetrating fractures. It also induces slight local damage during the compaction stage, prolonging the compaction of horizontal cracks into the elastic stage and exacerbating the local interconnection of fissures in the plastic stage. These factors constitute the underlying causes of the remarkable decline in the deformation resistance and the conspicuous transition of the failure mode in dehydrated coal samples.
(3) Quantitative analysis based on the in situ CT scanning data demonstrates that parameters such as the fractal dimension, surface porosity, and fracture volume of the pore–fractures in three lignite samples all exhibit an evolution trend of “continuous decrease during the compaction and elastic stages–gradual increase during the plastic stage–sharp growth during the post-peak stage” with the dynamic evolution of the pore–fracture system. However, the dehydration effect enhances the complexity of the initial pore–fractures in coal samples in a positive exponential manner (y = A + B × exp(C × x)). This leads to an increase in the complexity and heterogeneity of pore–fractures at each deformation stage during uniaxial compression, thereby causing a nonlinear increase in the relevant parameters and greater fluctuations in this evolutionary trend.
(4) The mechanism accounting for the differential influence of the dehydration effect on the macroscopic mechanical behavior of lignite is as follows: The dehydration effect exerts a nonlinear positive impact on the initial pore–fractures of the lignite. This, in turn, non-linearly and positively facilitates the evolution of pore–fractures at each deformation stage during the loading process. Consequently, it non-linearly and negatively modifies the overall deformation and failure behavior of the coal samples. Mathematically, this nonlinear negative relationship is represented as y = A + B × exp(C × x). Furthermore, the dehydration effect does not lead to a weakening of the micro-mechanical properties of lignite, nor does it result in the formation of effective through-going fractures within the coal samples. Hence, under natural dehydration conditions, the dehydration effect manifests no remarkable weakening influence on the uniaxial compressive strength of lignite samples.

Author Contributions

Conceptualization, S.Y.; Methodology, S.Z.; Formal analysis, L.M.; Writing—original draft preparation, S.Y.; Writing—review and editing, L.H.; Visualization, S.Y.; Supervision, W.Z.; Funding acquisition, L.M. All authors have read and agreed to the published version of the manuscript.

Funding

This study was supported by the National Natural Science Foundation of China (NSFC) (Grant No. 51574223), the Jiangsu Province Basic Science Research Project for Universities (24KJD410001), the Nantong Natural Science Foundation Project (JC2023111), Research Project of JCET (GYKY20235; GYJY202326), the Innovation and Entrepreneurship Project of Jiangsu (G-2023-0366; GY-2024-0298), the Scientific and Technological Key Project of Henan Province (242102320338), and the Key Scientific Research Projects of Colleges and Universities in Henan Province (24A440010).

Data Availability Statement

The data presented in this study are available from the corresponding author upon request.

Conflicts of Interest

The authors declare no conflicts of interest.

References

  1. Gao, M.; Cheng, C.; Miao, Z.; Zhou, Y.; Wan, K.; He, Q. The non-isothermal drying characteristics of lignite and prevention strategies for structure damage. Energy 2023, 284, 129258. [Google Scholar] [CrossRef]
  2. Liu, X.; Yu, H.; Wei, L. Experimental study on the dehydration characteristics and evolution of the physicochemical structure of XilinGol lignite during the dehydration process. Fuel 2021, 291, 120241. [Google Scholar] [CrossRef]
  3. Cheng, C.; Gao, M.; Miao, Z.; Wan, K.; He, Q. Structural changes mechanism of lignite during drying: Correlation between macroscopic and microscopic. Fuel 2023, 339, 126955. [Google Scholar] [CrossRef]
  4. Zhou, Y.; Gao, M.; Miao, Z.; Cheng, C.; Wan, K.; He, Q. Physicochemical properties and combustion kinetics of dried lignite. Energy 2024, 289, 129928. [Google Scholar] [CrossRef]
  5. Liu, W.; Niu, S.; Tang, H. Structural characteristics of pores and fractures during lignite pyrolysis obtained from X-ray computed tomography. J. Pet. Sci. Eng. 2023, 220, 111150. [Google Scholar] [CrossRef]
  6. Zhang, T.; Lou, C.; Teng, D.; Li, G.; Li, P.; Yun, Q.; Zhou, G. Hot-air drying behavior of lignite and quantitative characterization for its surface damage. Dry. Technol. 2023, 41, 2171–2188. [Google Scholar] [CrossRef]
  7. Xin, F.; Xu, H.; Tang, D.; Chen, Y.; Cao, L.; Yuan, Y. Experimental study on the change of reservoir characteristics of different lithotypes of lignite after dehydration and improvement of seepage capacity. Fuel 2020, 277, 118196. [Google Scholar] [CrossRef]
  8. Lu, Y.; Pu, H.; Wang, L.; Li, Z.; Meng, X.; Wang, B.; Zhang, K. Fracture evolution in mudstone specimens containing a pre-existing flaw under true triaxial compression. Int. J. Rock Mech. Min. Sci. 2021, 138, 104594. [Google Scholar] [CrossRef]
  9. Yu, Y.; Ni, C.; Cui, W.; Cheng, W.; Chen, Y. Progressive failure characteristics of coal under uniaxial compression: A comprehensive application of micro-ct and digital volume correlation. Bull. Eng. Geol. Environ. 2024, 83, 419. [Google Scholar] [CrossRef]
  10. Wu, Y.; Wang, D.; Wang, L.; Shang, Z.; Zhu, C.; Wei, J.; Yuan, A.; Zhang, H.; Zeng, F. An analysis of the meso-structural damage evolution of coal using X-ray CT and a gray-scale level co-occurrence matrix method. Int. J. Rock Mech. Min. Sci. 2022, 152, 105062. [Google Scholar] [CrossRef]
  11. Tutluoğlu, L.; Öge, İ.F.; Karpuz, C. Relationship Between Pre-failure and Post-failure Mechanical Properties of Rock Material of Different Origin. Rock Mech. Rock Eng. 2015, 48, 121–141. [Google Scholar] [CrossRef]
  12. Wen, J.; Tang, Z.; Dyson, A.P.; Tolooiyan, A. The mechanical behaviour of pre-existing transverse cracks in lignite under uniaxial compression. Geomech. Geophys. Geo-Energy Geo-Resour. 2020, 7, 6. [Google Scholar] [CrossRef]
  13. Wu, H.; Bai, H.; Chen, Y.; Pu, H.; Zhang, K. Mechanical Properties and Damage in Lignite under Combined Cyclic Compression and Shear Loading. Sustainability 2020, 12, 8393. [Google Scholar] [CrossRef]
  14. Song, Y.; Ma, H.; Yang, J.; Zheng, J.; Yang, J.; Bao, W. Dynamic Mechanical Behaviors and Failure Mechanism of Lignite under SHPB Compression Test. Sustainability 2022, 14, 10528. [Google Scholar] [CrossRef]
  15. Zhao, Y.; Liu, T.; Lin, B. Micromechanical Properties of Different Rank Coal and Their Impact on Fracture Compressibility. Energy Fuels 2024, 38, 9515–9528. [Google Scholar] [CrossRef]
  16. Yang, N.; Hu, G.; Zhu, J.; Duan, H.; Wang, T.; Li, Y. Evolution of pore-fracture structure and permeability of coal by microwave irradiation under uniaxial compression. J. Nat. Gas Sci. Eng. 2022, 107, 104759. [Google Scholar] [CrossRef]
  17. Xin, F.; Fang, C.; Wang, S.; Xiong, B.; Cao, C.; Liu, D.; Tang, D.; Xu, H. Influence of Composition on Differential Evolution of Pore–Fracture Systems and Micro-mechanical Properties of Lignite During Drying-Wetting Cycles. Nat. Resour. Res. 2024, 33, 365–388. [Google Scholar] [CrossRef]
  18. Ma, H.; Song, Y.; Yang, J.; Zheng, J.; Shen, F.; Shao, Z. Experimental investigation on acoustic emission and damage characteristics of dehydrated lignite in uniaxial compression test. Bull. Eng. Geol. Environ. 2023, 82, 292. [Google Scholar] [CrossRef]
  19. Ma, H.; Song, Y.; Yang, J.; Zheng, J.; Shen, F.; Shao, Z.; Xia, Z. Experimental Investigation on Physical–Mechanical Behaviors and Macro–Micro-structural Responses of Lignite Subjected to Freeze–Thaw Cycles. Nat. Resour. Res. 2023, 32, 543–566. [Google Scholar] [CrossRef]
  20. Wang, G.; Qin, X.; Shen, J.; Zhang, Z.; Han, D.; Jiang, C. Quantitative analysis of microscopic structure and gas seepage characteristics of low-rank coal based on CT three-dimensional reconstruction of CT images and fractal theory. Fuel 2019, 256, 115900. [Google Scholar] [CrossRef]
  21. Han, L.; Shen, J.; Wang, J.; Shabbiri, K. Characteristics of Pore Evolution and Its Maceral Contributions in the Huolinhe Lignite during Coal Pyrolysis. Nat. Resour. Res. 2021, 30, 2195–2210. [Google Scholar] [CrossRef]
  22. Liu, W.; Wang, G.; Han, D.; Xu, H.; Chu, X. Accurate characterization of coal pore and fissure structure based on CT 3D reconstruction and NMR. J. Nat. Gas Sci. Eng. 2021, 96, 104242. [Google Scholar] [CrossRef]
  23. Sun, L.; Zhang, C.; Wang, G.; Huang, Q.; Shi, Q. Research on the evolution of pore and fracture structures during spontaneous combustion of coal based on CT 3D reconstruction. Energy 2022, 260, 125033. [Google Scholar] [CrossRef]
  24. Wu, Y.; Tao, S.; Bi, C.; Tang, S.; Men, X. Pore-fracture and permeability heterogeneity of different marcolithotypes of medium-rank coals in Jixi Basin, China. Geoenergy Sci. Eng. 2023, 231, 212395. [Google Scholar] [CrossRef]
  25. Chen, S.; Dou, L.; Cai, W.; Zhang, L.; Tian, M.; Han, Z. Evolution of Coal Microfracture by Cyclic Fracturing of Liquid Nitrogen Based on μCT and Convolutional Neural Networks. Rock Mech. Rock Eng. 2024, 57, 2103–2124. [Google Scholar] [CrossRef]
  26. Hou, C.; Jiang, B.; Li, M.; Song, Y.; Cheng, G. Micro-deformation and fracture evolution of in-situ coal affected by temperature, confining pressure, and differential stress. J. Nat. Gas Sci. Eng. 2022, 100, 104455. [Google Scholar] [CrossRef]
  27. Zhou, Z.; Sheng, M.; Ge, Z.; Li, R.; Gong, S.; Zhang, H. Mechanical properties and failure characteristics of supercritical carbon dioxide soak in water-bearing coal rocks. Energy 2024, 286, 129599. [Google Scholar] [CrossRef]
  28. Shi, X.; Pan, J.; Hou, Q.; Jin, Y.; Wang, Z.; Niu, Q.; Li, M. Micrometer-scale fractures in coal related to coal rank based on micro-CT scanning and fractal theory. Fuel 2018, 212, 162–172. [Google Scholar] [CrossRef]
  29. Liu, Y.; Yin, G.; Li, M.; Zhang, D.; Deng, B.; Liu, C.; Lu, J. Anisotropic Mechanical Properties and the Permeability Evolution of Cubic Coal Under True Triaxial Stress Paths. Rock Mech. Rock Eng. 2019, 52, 2505–2521. [Google Scholar] [CrossRef]
  30. Kou, M.-M.; Liu, X.-R.; Wang, Z.-Q.; Nowruzpour, M. Mechanical properties, failure behaviors and permeability evolutions of fissured rock-like materials under coupled hydro-mechanical unloading. Eng. Fract. Mech. 2021, 254, 107929. [Google Scholar] [CrossRef]
  31. Lu, Q.; Guo, J.; Liu, Z.; Ren, Y.; Wang, X.; Guan, B.; Chen, C.; He, L. Investigation of thermal induced damage of deep shale considering in-situ thermal shock effects. Geoenergy Sci. Eng. 2023, 222, 211439. [Google Scholar] [CrossRef]
  32. Zhu, J.; Qi, T.; Li, J.; Cheng, Z.; Zhang, Y. The Effects of High Temperature on Crack Propagation and Failure Characteristics of Sandstone. Rock Mech. Rock Eng. 2023, 56, 5753–5779. [Google Scholar] [CrossRef]
  33. Shan, C.; Yao, Q.; Cao, S.; Xu, Q.; Zheng, C.; Xia, Z.; Li, Y.; Yan, L. Fracture Development Patterns and Micro–Macrostructural Fractal Characteristics of Acid–Base Coal Samples. Nat. Resour. Res. 2024, 33, 831–865. [Google Scholar] [CrossRef]
  34. Wei, G.; Zhang, R.; Yu, C.; Zhang, K.; Wang, K. Coupled relationships between overburden stress and ultra-deep sandstone brittle deformation properties based on in situ CT scanning. J. Struct. Geol. 2023, 173, 104905. [Google Scholar] [CrossRef]
  35. Wu, K.; Meng, Q.; Li, R.; Wang, C.; Shen, T. In-situ CT scan-based analysis of damage evolution of coral reef limestone under cyclic loads. J. Build. Eng. 2024, 96, 110596. [Google Scholar] [CrossRef]
  36. Wang, D.; Zeng, F.; Wei, J.; Zhang, H.; Wu, Y.; Wei, Q. Quantitative analysis of fracture dynamic evolution in coal subjected to uniaxial and triaxial compression loads based on industrial CT and fractal theory. J. Pet. Sci. Eng. 2021, 196, 108051. [Google Scholar] [CrossRef]
  37. Yu, Y.; Qiu, Z.; Cheng, W.; Yang, Q.; Cui, W.; Rong, K.; Li, Y. Fracture and porosity evolution of coal under uniaxial compression: An in-situ X-ray tomography study. Geomech. Energy Environ. 2023, 36, 100499. [Google Scholar] [CrossRef]
  38. Li, X.; Wang, Q.; Wu, K.; Wang, J.; Qi, Q. Microscopic fracture evolution and propagation mechanism of coal with high coal burst liability. Theor. Appl. Fract. Mech. 2024, 130, 104331. [Google Scholar] [CrossRef]
  39. Liu, H.; Mao, L.; Ju, Y.; Hild, F. Damage evolution in coal under different loading modes using advanced digital volume correlation based on X-ray computed tomography. Energy 2023, 275, 127447. [Google Scholar] [CrossRef]
  40. Li, G.; Qin, Y.; Yao, H.; Qu, J.; Zhang, H.; Fang, X.; Shang, F.; Zhang, L. 3D pore structure characterization and permeability anisotropy visualization simulation of fusain. Energy 2024, 291, 130422. [Google Scholar] [CrossRef]
  41. GB/T 50266-2013; Standard for Test Methods of Engineering Rock Mass. China Planning Press: Beijing, China, 2013.
  42. Wen, Y.; Ni, G.; Zhang, X.; Zheng, Y.; Wang, G.; Wang, Z.; Huang, Q. Fine characterization of pore structure of acidified anthracite based on liquid intrusion method and Micro-CT. Energy 2023, 263, 125639. [Google Scholar] [CrossRef]
  43. Sun, X.; Shi, F.; Ding, J.; Tao, Z.; Zhang, Y.; Miao, C.; Cui, L. Study on Microscopic Mechanism and Failure Mode of Water–Rock Coupling in Fine Sandstone Under Uniaxial Compression. Rock Mech. Rock Eng. 2023, 56, 6823–6842. [Google Scholar] [CrossRef]
  44. Zhao, G.; Guo, Y.; Wang, L.; Chang, X.; Yang, H.; Guo, W.; Wu, X.; Yang, C. Experimental Study on Mechanical, Brittleness, and Fracture Behavior of Deep Shales Subjected to Fracturing Fluid-Shale Interactions at Reservoir Temperature and In-Situ Stress Conditions. Rock Mech. Rock Eng. 2024, 57, 27–44. [Google Scholar] [CrossRef]
Figure 1. Prepared lignite samples wrapped in fresh-keeping film. Note: Owing to different processing batches, only cylindrical lignite samples are shown here. For cuboid lignite samples, please refer to Figure 2(a2).
Fractalfract 09 00220 g001
Figure 2. Experimental flow chart: (a1,a2) the lignite blocks and some prepared cuboid lignite samples; (b1,b2) Espec SETH-2-021L constant climate cabinet and the coal samples being dried; (c1,c2) MTS 810 material testing system and the coal sample under load; (d1,d2) RX solution easytom 230 CT scanning system and its internal loading and scanning system.
Fractalfract 09 00220 g002
Figure 3. The 3D reconstruction process of pore–fractures based on Yan’s (YS) segmentation method (a) and (b) the CT image of the lignite before and after cropping; (c) pore segmentation based on the Interactive Top-Hat method; (d) fracture segmentation based on the Interactive Top-Hat method; (e) setting of markers on the fractures using the brush tool; (f) screening of the fractures based on the “Reconstruction from Markers” command; (g) merging of the pores and the fractures using the “Or Image” command; (h) 3D visualization of the pore–fracture networks; (i) quantitative analysis based on the “Label Analysis” command.
Fractalfract 09 00220 g003
Figure 4. Stress–strain curves of the lignite samples with different dehydration times and their basic mechanical parameters obtained from uniaxial compression tests. Note: (a1a3) are the stress–strain curves for S-0h, S-8h, and S-72h, respectively; (b1b3) are the peak strain, peak strength, and elastic modulus of the three groups of lignite samples.
Fractalfract 09 00220 g004
Figure 5. Stress–strain curves of the lignite samples with different dehydration times and their mechanical responses at each pre-peak deformation stage obtained from in situ CT scanning experiments. Note: (a1,b1,c1) are the stress–strain curves for S-0h, S-8h, and S-72h, respectively; (a2,b2,c2) are the mechanical responses of the lignite samples with different dehydration times at each pre-peak deformation stage; I = initial compaction stage, II = linear elastic stage, III = plastic stage, and IV = post-peak stage, and AB, BC, and CD belong to the I, II, and III deformation stages, respectively.
Fractalfract 09 00220 g005
Figure 6. Variation of failure patterns, stress–strain responses at the crack penetration stage of lignite samples subjected to different dehydration times, and their brittleness indices. Note: (a1a3) are the failure patterns for S-0h, S-8h, and S-72h, respectively; (b1b3) are the stress–strain responses of S-0h, S-8h, and S-72h during the crack penetration stage obtained from in situ CT scanning experiments, respectively; (c1c3) are their brittleness indices, respectively.
Fractalfract 09 00220 g006
Figure 7. Evolution of 2D pore–fractures in lignite samples with different dehydration times at various deformation stages. (a) XZ plane; (b) XY plane.
Fractalfract 09 00220 g007aFractalfract 09 00220 g007b
Figure 8. Variations of 2D pore–fracture parameters at different deformation stages of lignite samples with different dehydration times. Note: (a1a3) are the variations of surface porosity for S-0h, S-8h, and S-72h, respectively; (b1b3) are the variations of 2D fractal dimension for S-0h, S-8h, and S-72h, respectively; (a4,b4) are the mean and standard deviation of the three samples’ surface porosities and 2D fractal dimensions, respectively.
Fractalfract 09 00220 g008
Figure 9. Correlation of 2D pore–fracture parameters with dehydration time for lignite samples at different deformation stages. Note: (ac), respectively, show the correlations of the pore–fracture surface porosity, the pore–fracture fractal dimension, the axial strain of lignite samples at different deformation stages with the dehydration time.
Fractalfract 09 00220 g009
Figure 10. Evolution of 3D pore–fractures in lignite samples with different dehydration times at various deformation stages. Note: the connected pore–fractures are colored red, the isolated pore–fractures ranked top 5 in terms of volume are colored blue, and other isolated pores are rendered gray.
Fractalfract 09 00220 g010
Figure 11. Variations of 3D pore–fracture parameters at different deformation stages of lignite samples with different dehydration times. Note:(a1,b1,c1) are the pore–fracture volume variations for S-0h, S-8h, and S-72h, respectively; (a2,b2,c2) are the pore–fracture area variations for S-0h, S-8h, and S-72h, respectively; (a3,b3,c3) are the pore–fracture fractal dimension variations for S-0h, S-8h, and S-72h, respectively.
Fractalfract 09 00220 g011
Figure 12. Correlation of 3D pore–fracture parameters with dehydration time for lignite samples at different deformation stages. Note: (ad), respectively, show the correlations of the pore–fracture volume, the pore–fracture area, the pore–fracture fractal dimension, and the axial strain of lignite samples at different deformation stages with the dehydration time.
Fractalfract 09 00220 g012
Figure 13. Correlation between 3D initial pore–fracture parameters of lignite samples with different dehydration times and their mechanical parameters. Note: (a1a3), respectively, show the correlations of the initial pore–fracture volume with BI, σc, and E; (b1b3), respectively, show the correlations of the initial pore–fracture fractal dimension with BI, σc, and E.
Fractalfract 09 00220 g013
Table 1. General information of the samples.
Properties Wujianfang Lignite
Proximate analysis, %Mad17.40
Aad16.94
Vad28.51
FCad37.15
Maceral composition (%)Huminite51.81
Inertinite 45.46
Liptinite2.74
Ro (%) Vitrinite reflectance 0.28
Note: M, moisture (ad refers to the air-dried condition); A, ash; V, volatile matter; FC, fixed carbon.
Table 2. The specific CT scanning points at distinct deformation stages of the dehydrated lignite samples.
SampleScan 1Scan 2Scan 3Scan 4Scan 5Scan 6
S-0hInitial stateCompaction stateElasticity stagePlasticity stagePost-peak stageNone
S-8hInitial stateCompaction stateElasticity stageElasticity stagePlasticity stagePost-peak stage
S-72hInitial stateCompaction stateElasticity stagePlasticity stagePost-peak stageNone
Table 3. The 2D pore–fracture parameters at various deformation stages of the dehydrated lignite samples.
SampleScanning PointSurface Porosity2D Fractal Dimension
P ¯ 2 D (%)σp D ¯ F , 2 D σf
S-0hA0.360.310.970.14
C0.120.130.800.19
D0.180.180.880.17
E3.951.311.180.04
S-8hA1.580.851.150.09
C0.350.220.970.11
D1.080.471.140.07
E8.423.551.280.05
S-72hA2.901.281.250.08
C2.301.131.220.09
D2.671.211.250.08
E12.282.571.360.04
Note: P ¯ 2 D = mean value of the surface porosity; σp = standard deviation of the surface porosity; D ¯ F , 2 D = mean value of the 2D fractal dimension; σf = standard deviation of the 2D fractal dimension.
Table 4. The 3D pore–fracture parameters at various deformation stages of the dehydrated lignite samples.
SampleScanning Pointε1 (%)Volume (mm3)Area (mm2)DF,3D
S-0hA033.961936.771.92
B0.9416.36970.701.80
C1.7211.18651.461.76
D2.3617.521011.441.82
E2.68377.134758.842.14
S-8hA0150.997084.842.16
B1.6281.734476.682.07
C3.6333.711818.891.90
D4.60103.315497.562.11
E4.86804.4811,292.502.27
S-72hA0276.8011,126.542.26
B2.10236.129439.162.23
C3.84219.718689.062.21
D5.50254.749886.992.24
E6.241172.6116,319.312.35
Note: ε1 = axial strain; DF,3D = 3D fractal dimension.
Table 5. Statistics of pore–fracture parameters of lignite samples with different dehydration times and their mechanical parameters during uniaxial compression.
SampleScanning PointPore–Fracture ParametersMechanical Parameters
Volume (mm3)Area (mm2)DF,3Dε1 (%)Estage (MPa)σc (MPa)BI
S-0hA33.961936.771.920 7.410.77
B16.36970.701.800.94177.09
C11.18651.461.761.72350.42
D17.521011.441.822.36444.79
E377.134758.842.142.68
S-8hA150.997084.842.160 9.230.73
B81.734476.682.071.62107.06
C33.711818.891.903.63236.62
D103.315497.562.114.60319.40
E804.4811,292.502.274.86
S-72hA276.8011,126.542.260 7.430.56
B236.129439.162.232.1077.19
C219.718689.062.213.84156.23
D254.749886.992.245.50173.36
E1172.6116,319.312.356.24
Note: DF,3D = 3D fractal dimension; ε1 = axial strain; Estage = secant modulus of different pre-peak deformation stages; σc = peak strength; BI = brittleness index. The bolded numbers in the column “Pore–fracture parameters” are the initial pore-structure parameters of each coal sample, and the bolded numbers in the column “Mechanical parameters” are their mechanical parameters.
Disclaimer/Publisher’s Note: The statements, opinions and data contained in all publications are solely those of the individual author(s) and contributor(s) and not of MDPI and/or the editor(s). MDPI and/or the editor(s) disclaim responsibility for any injury to people or property resulting from any ideas, methods, instructions or products referred to in the content.

