

Multifractal Characteristics of Grain Size Distributions in Braided Delta-Front: A Case of Paleogene Enping Formation in Huilu Low Uplift, Pearl River Mouth Basin, South China Sea

Abstract
1. Introduction
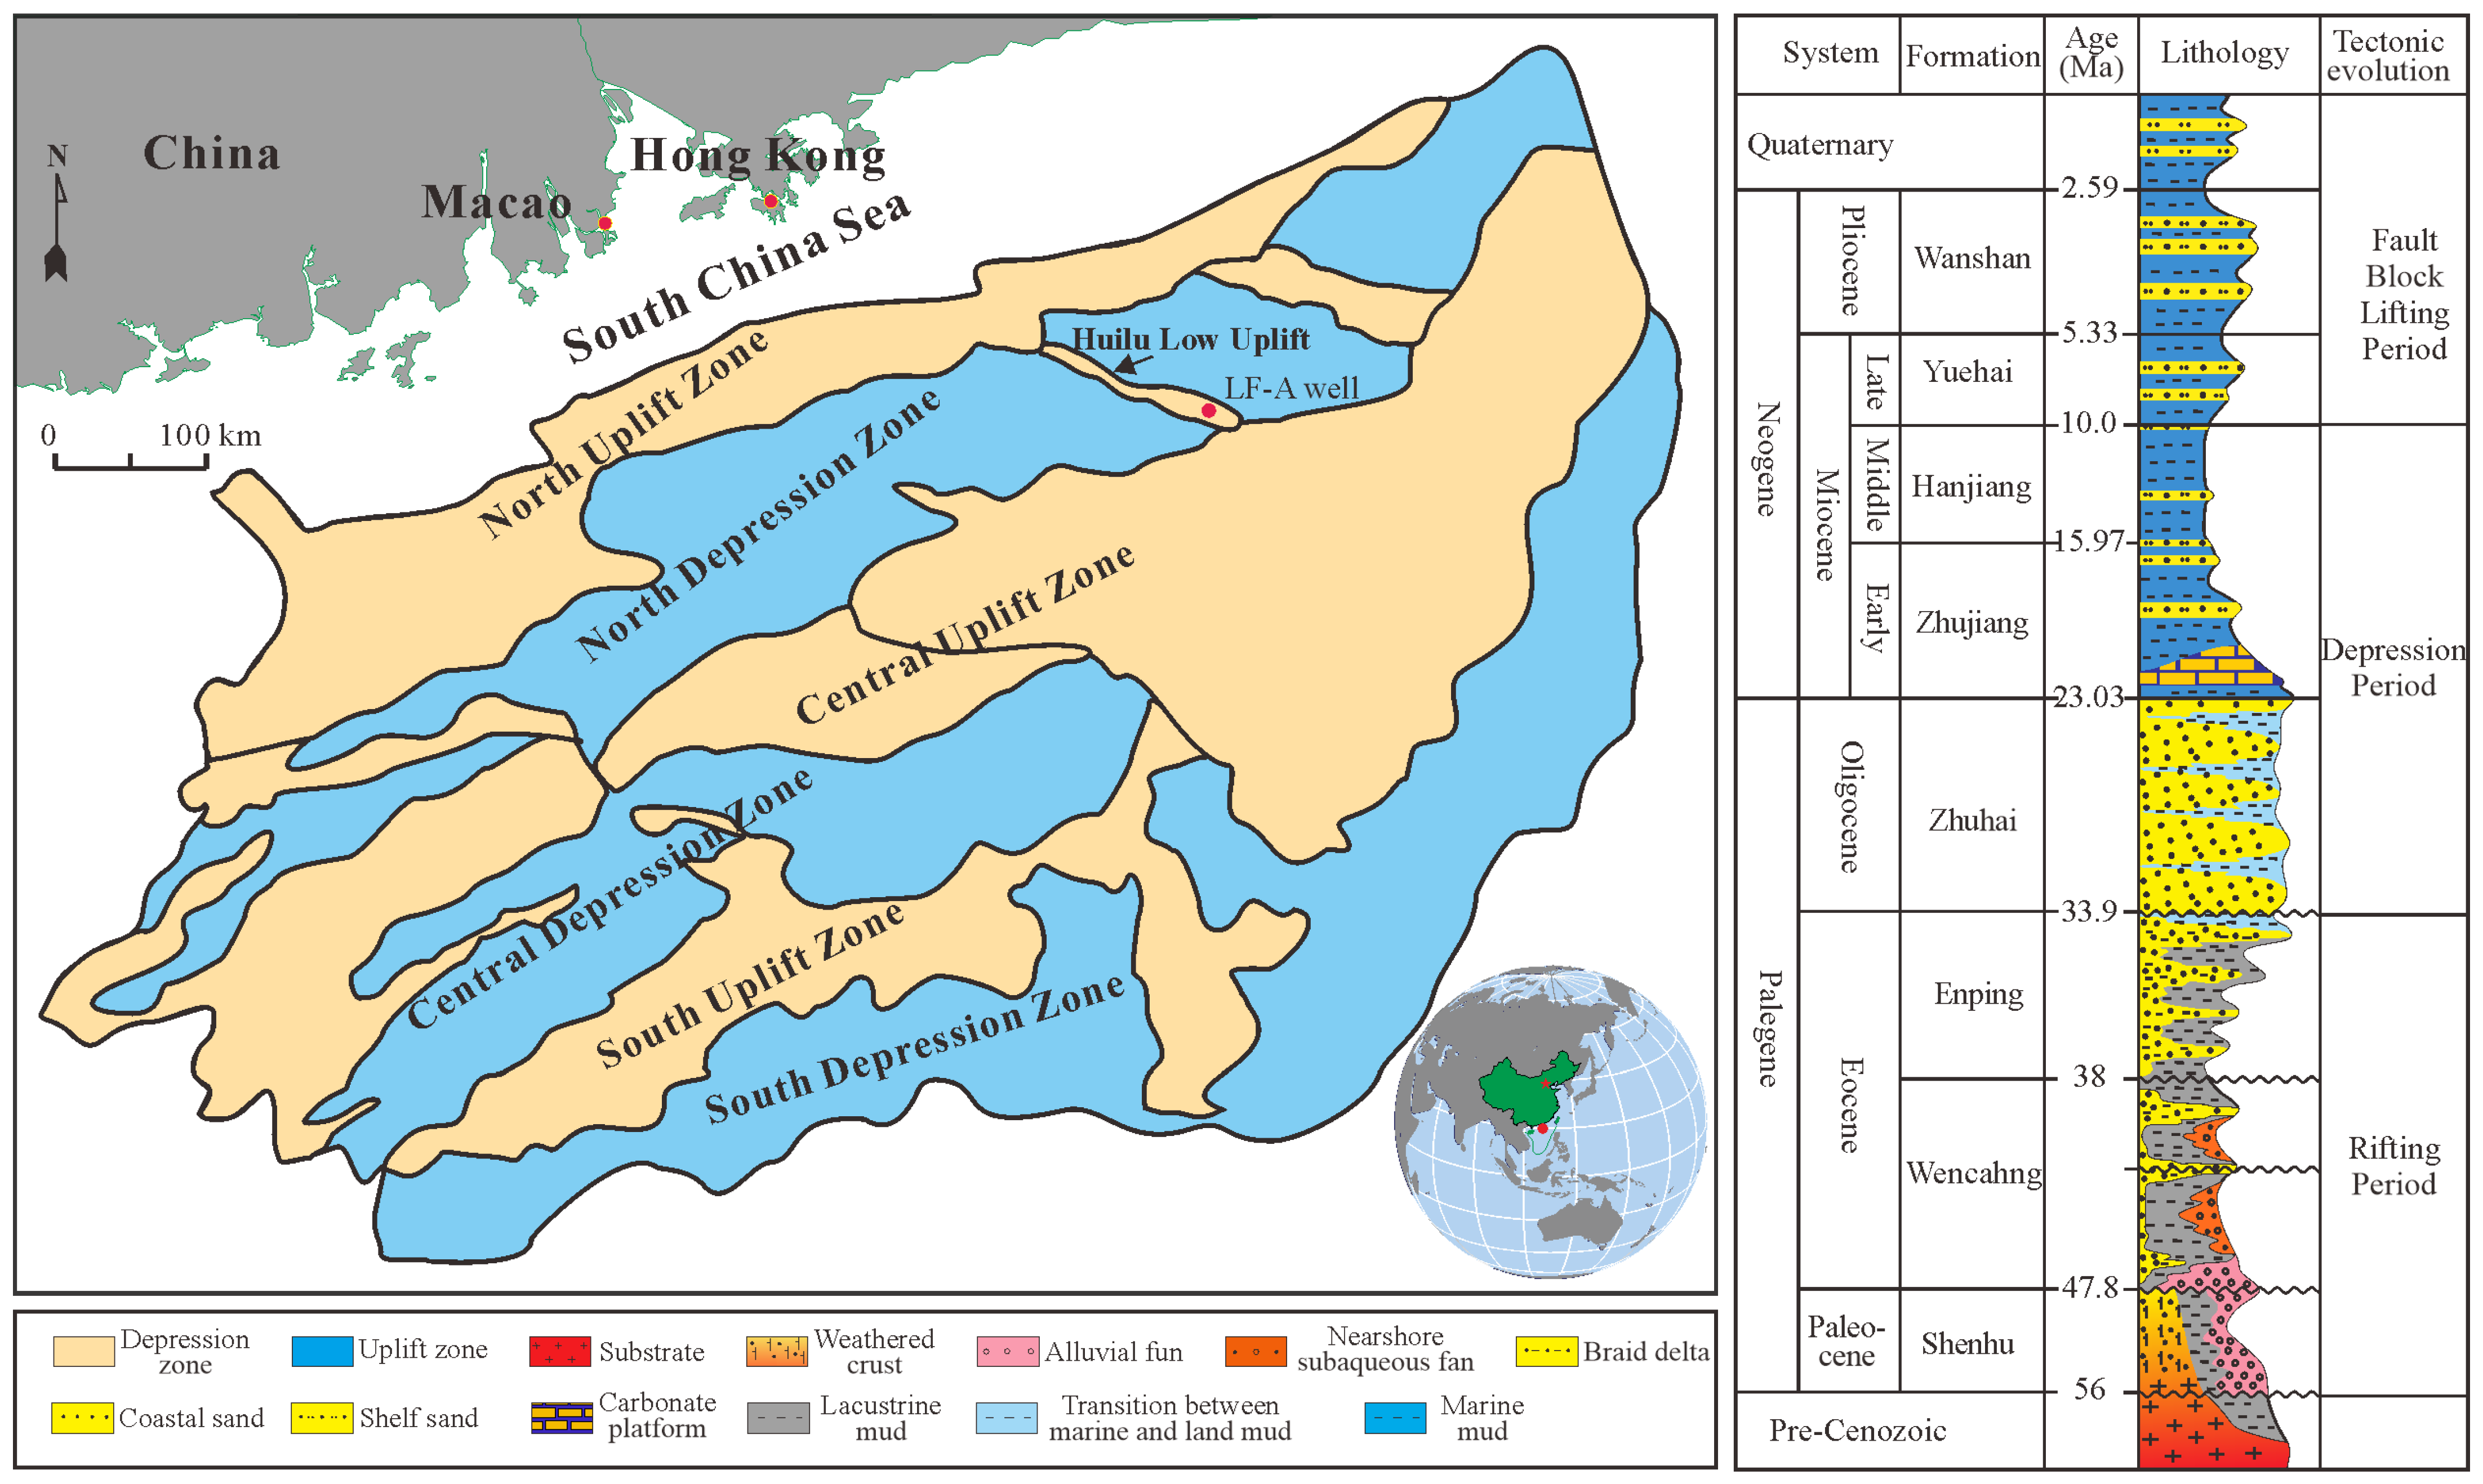
2. Geological Setting
3. Materials and Methods
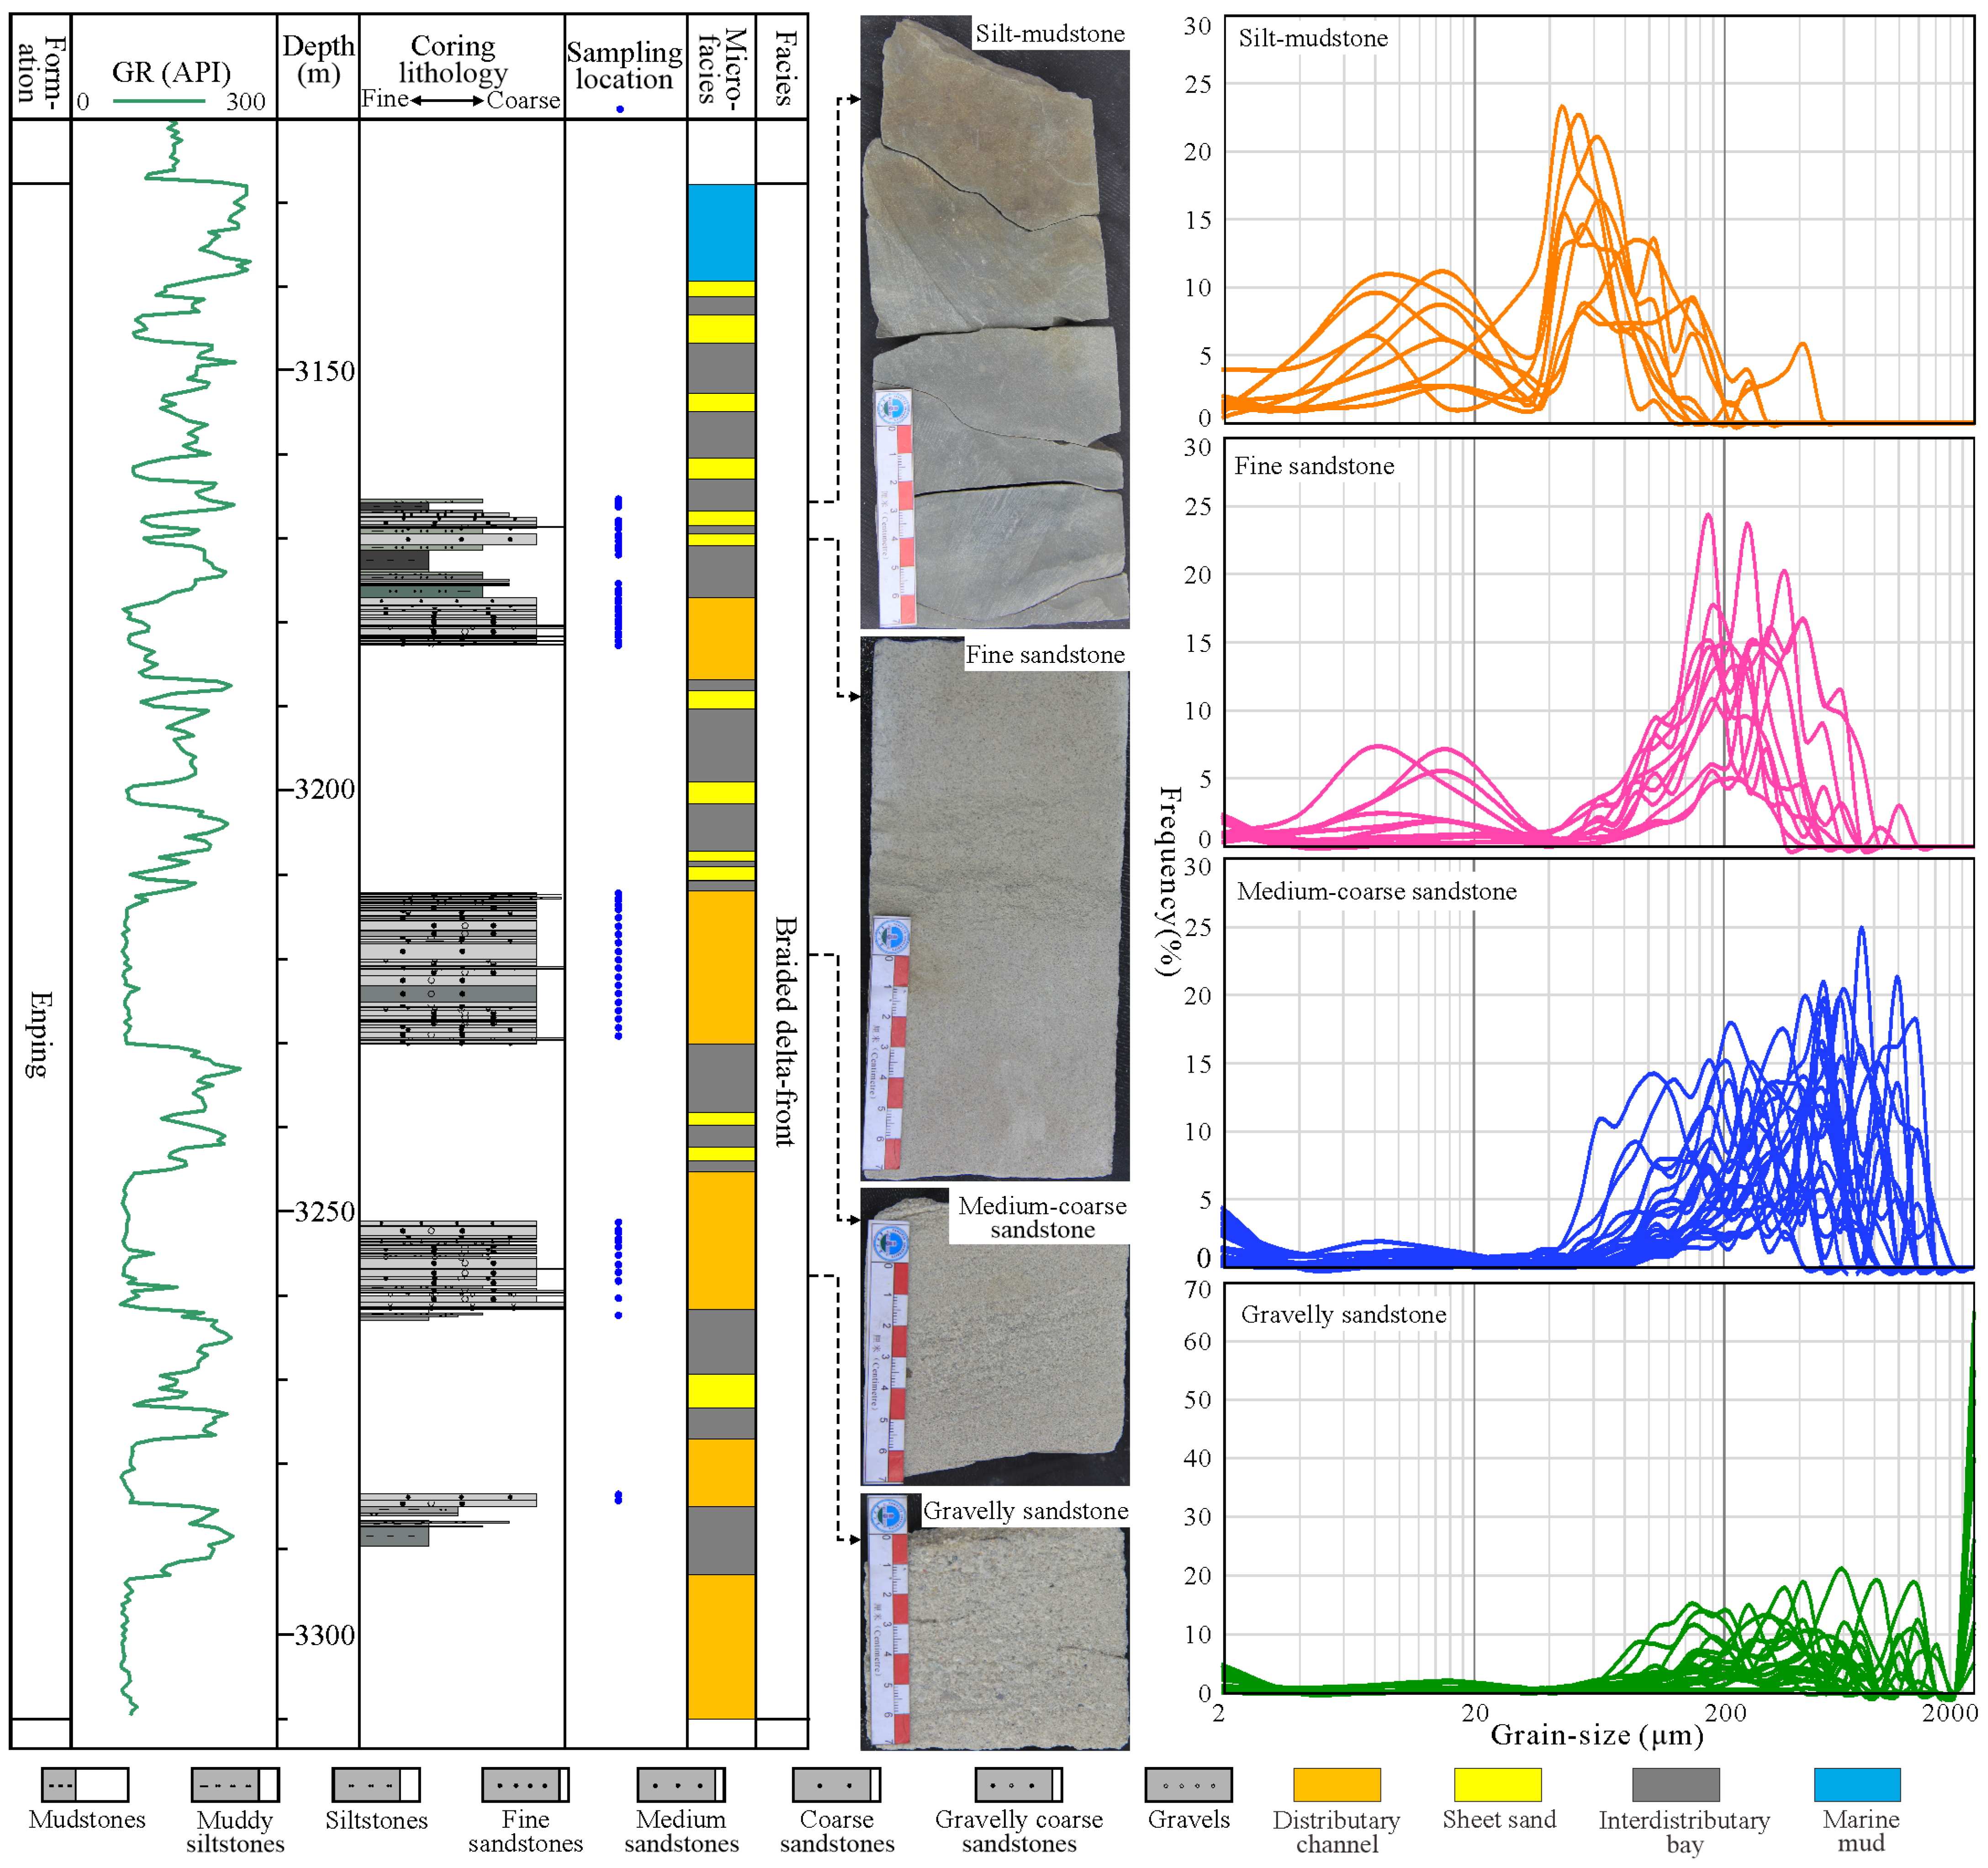
3.1. GSD Samples
3.2. GSD Experiment
3.3. GSD Interval Reconstruction
3.4. GSD Multifractal Parameters Calculation
4. Results
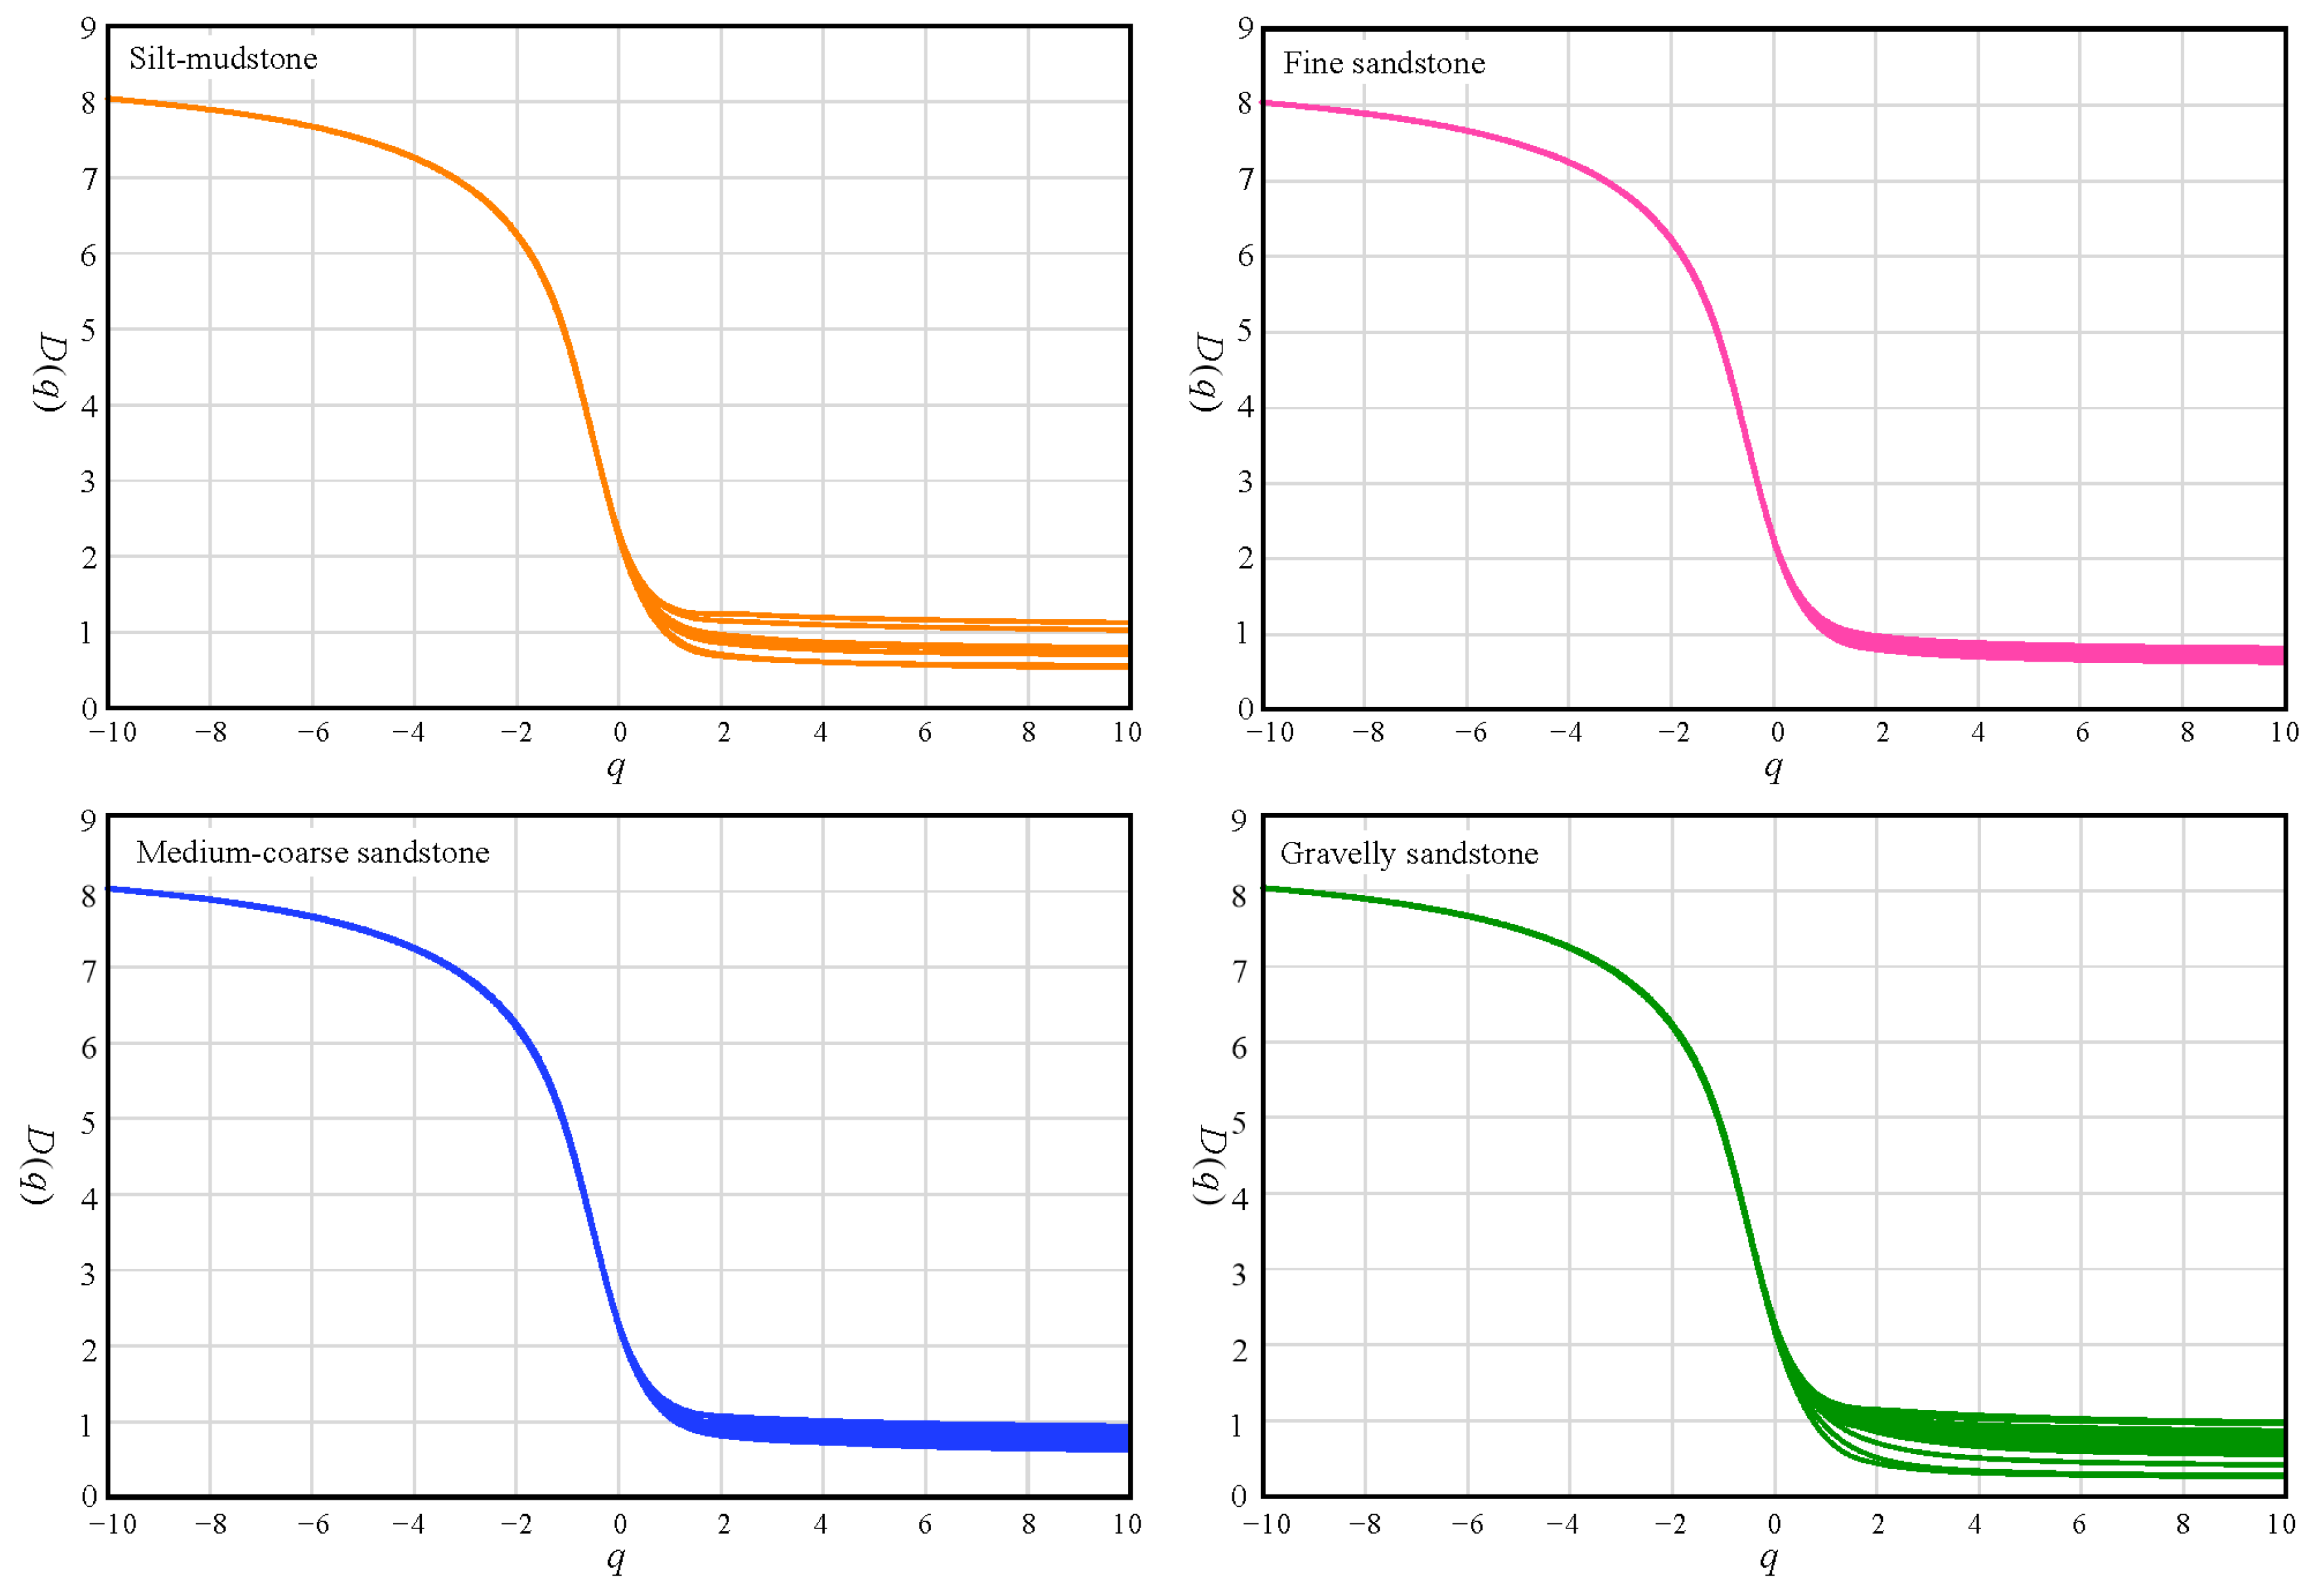
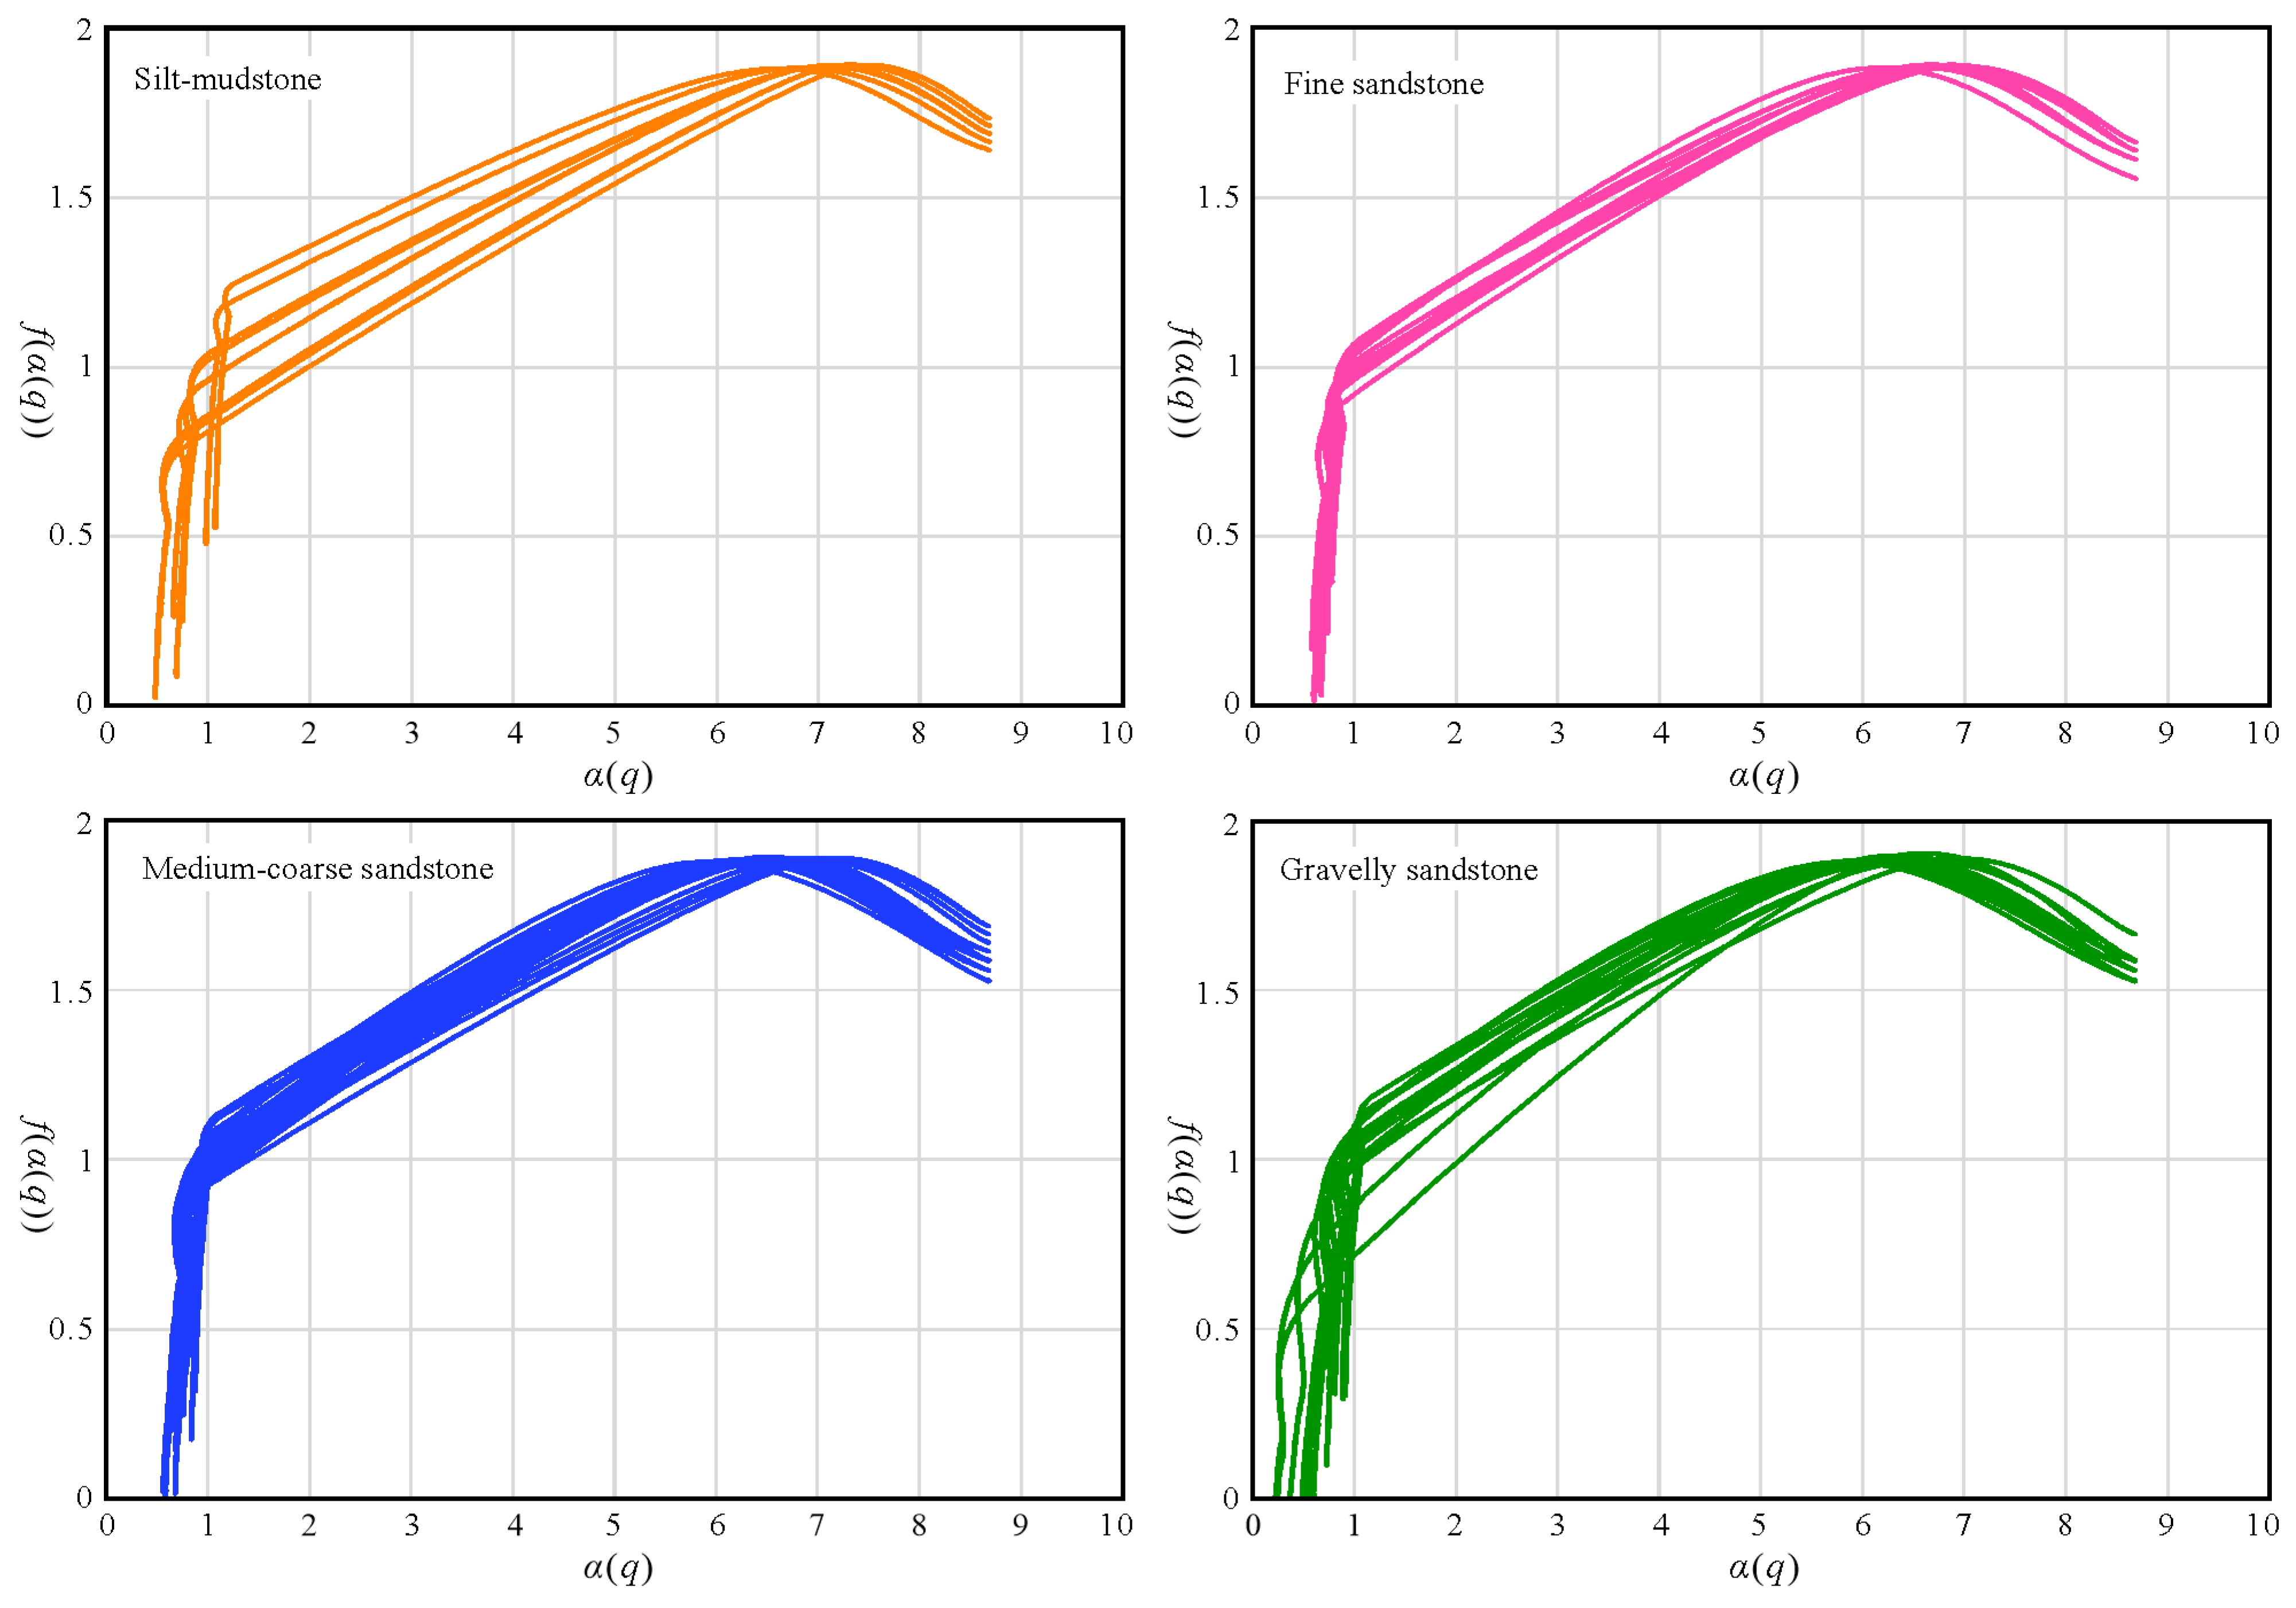
4.1. Multifractal Spectrum
4.2. Multifractal Parameters
5. Discussion
5.1. Multifractal vs. Traditional Parameters
5.2. Software Package for GSD Multifractal
5.3. Processes of GSD Multifractal Analysis
6. Conclusions
- (1)
- GSDs from silt-mudstones, fine sandstones, medium-coarse sandstones, and gravelly sandstones are obtained in different sedimentary environments of braided delta-front. Generalized dimension spectrum curves are sigmoidal and decrease monotonically. The decrease range of the generalized dimension in the negative moment is greater than that in the positive moment. The multifractal singularity spectrum curves are asymmetric, convex, and right-hook unimodal.
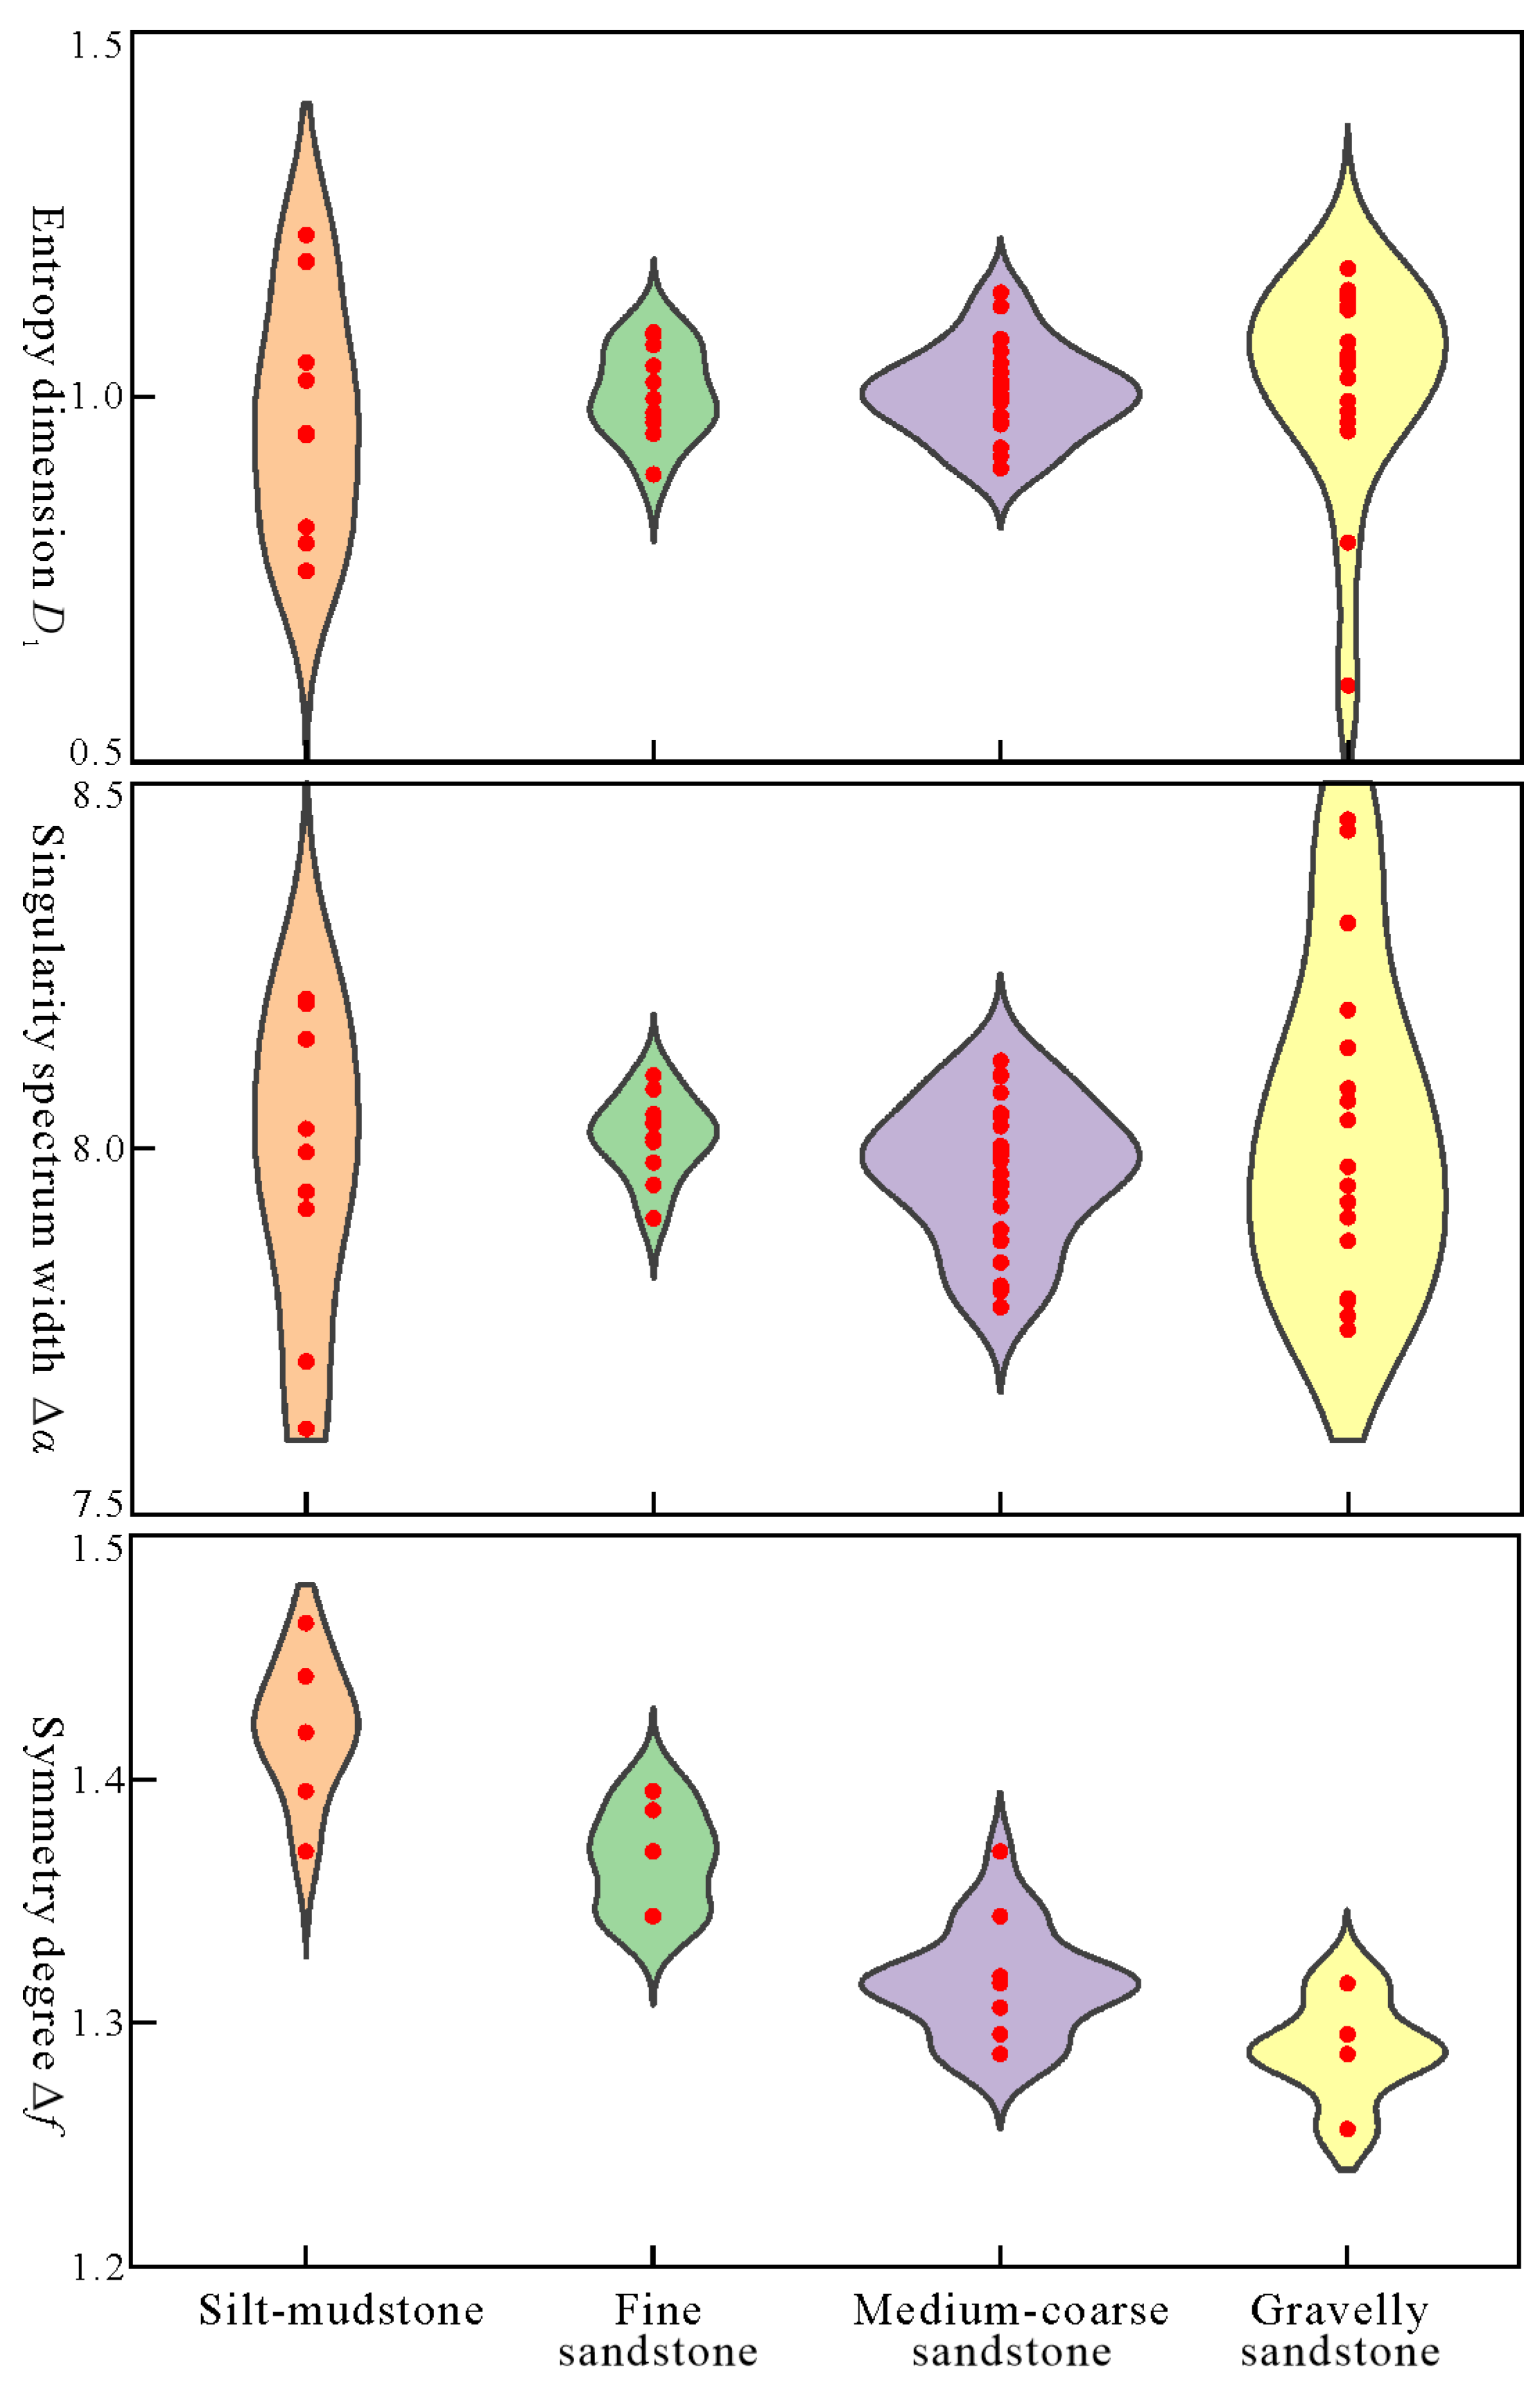
- (2)
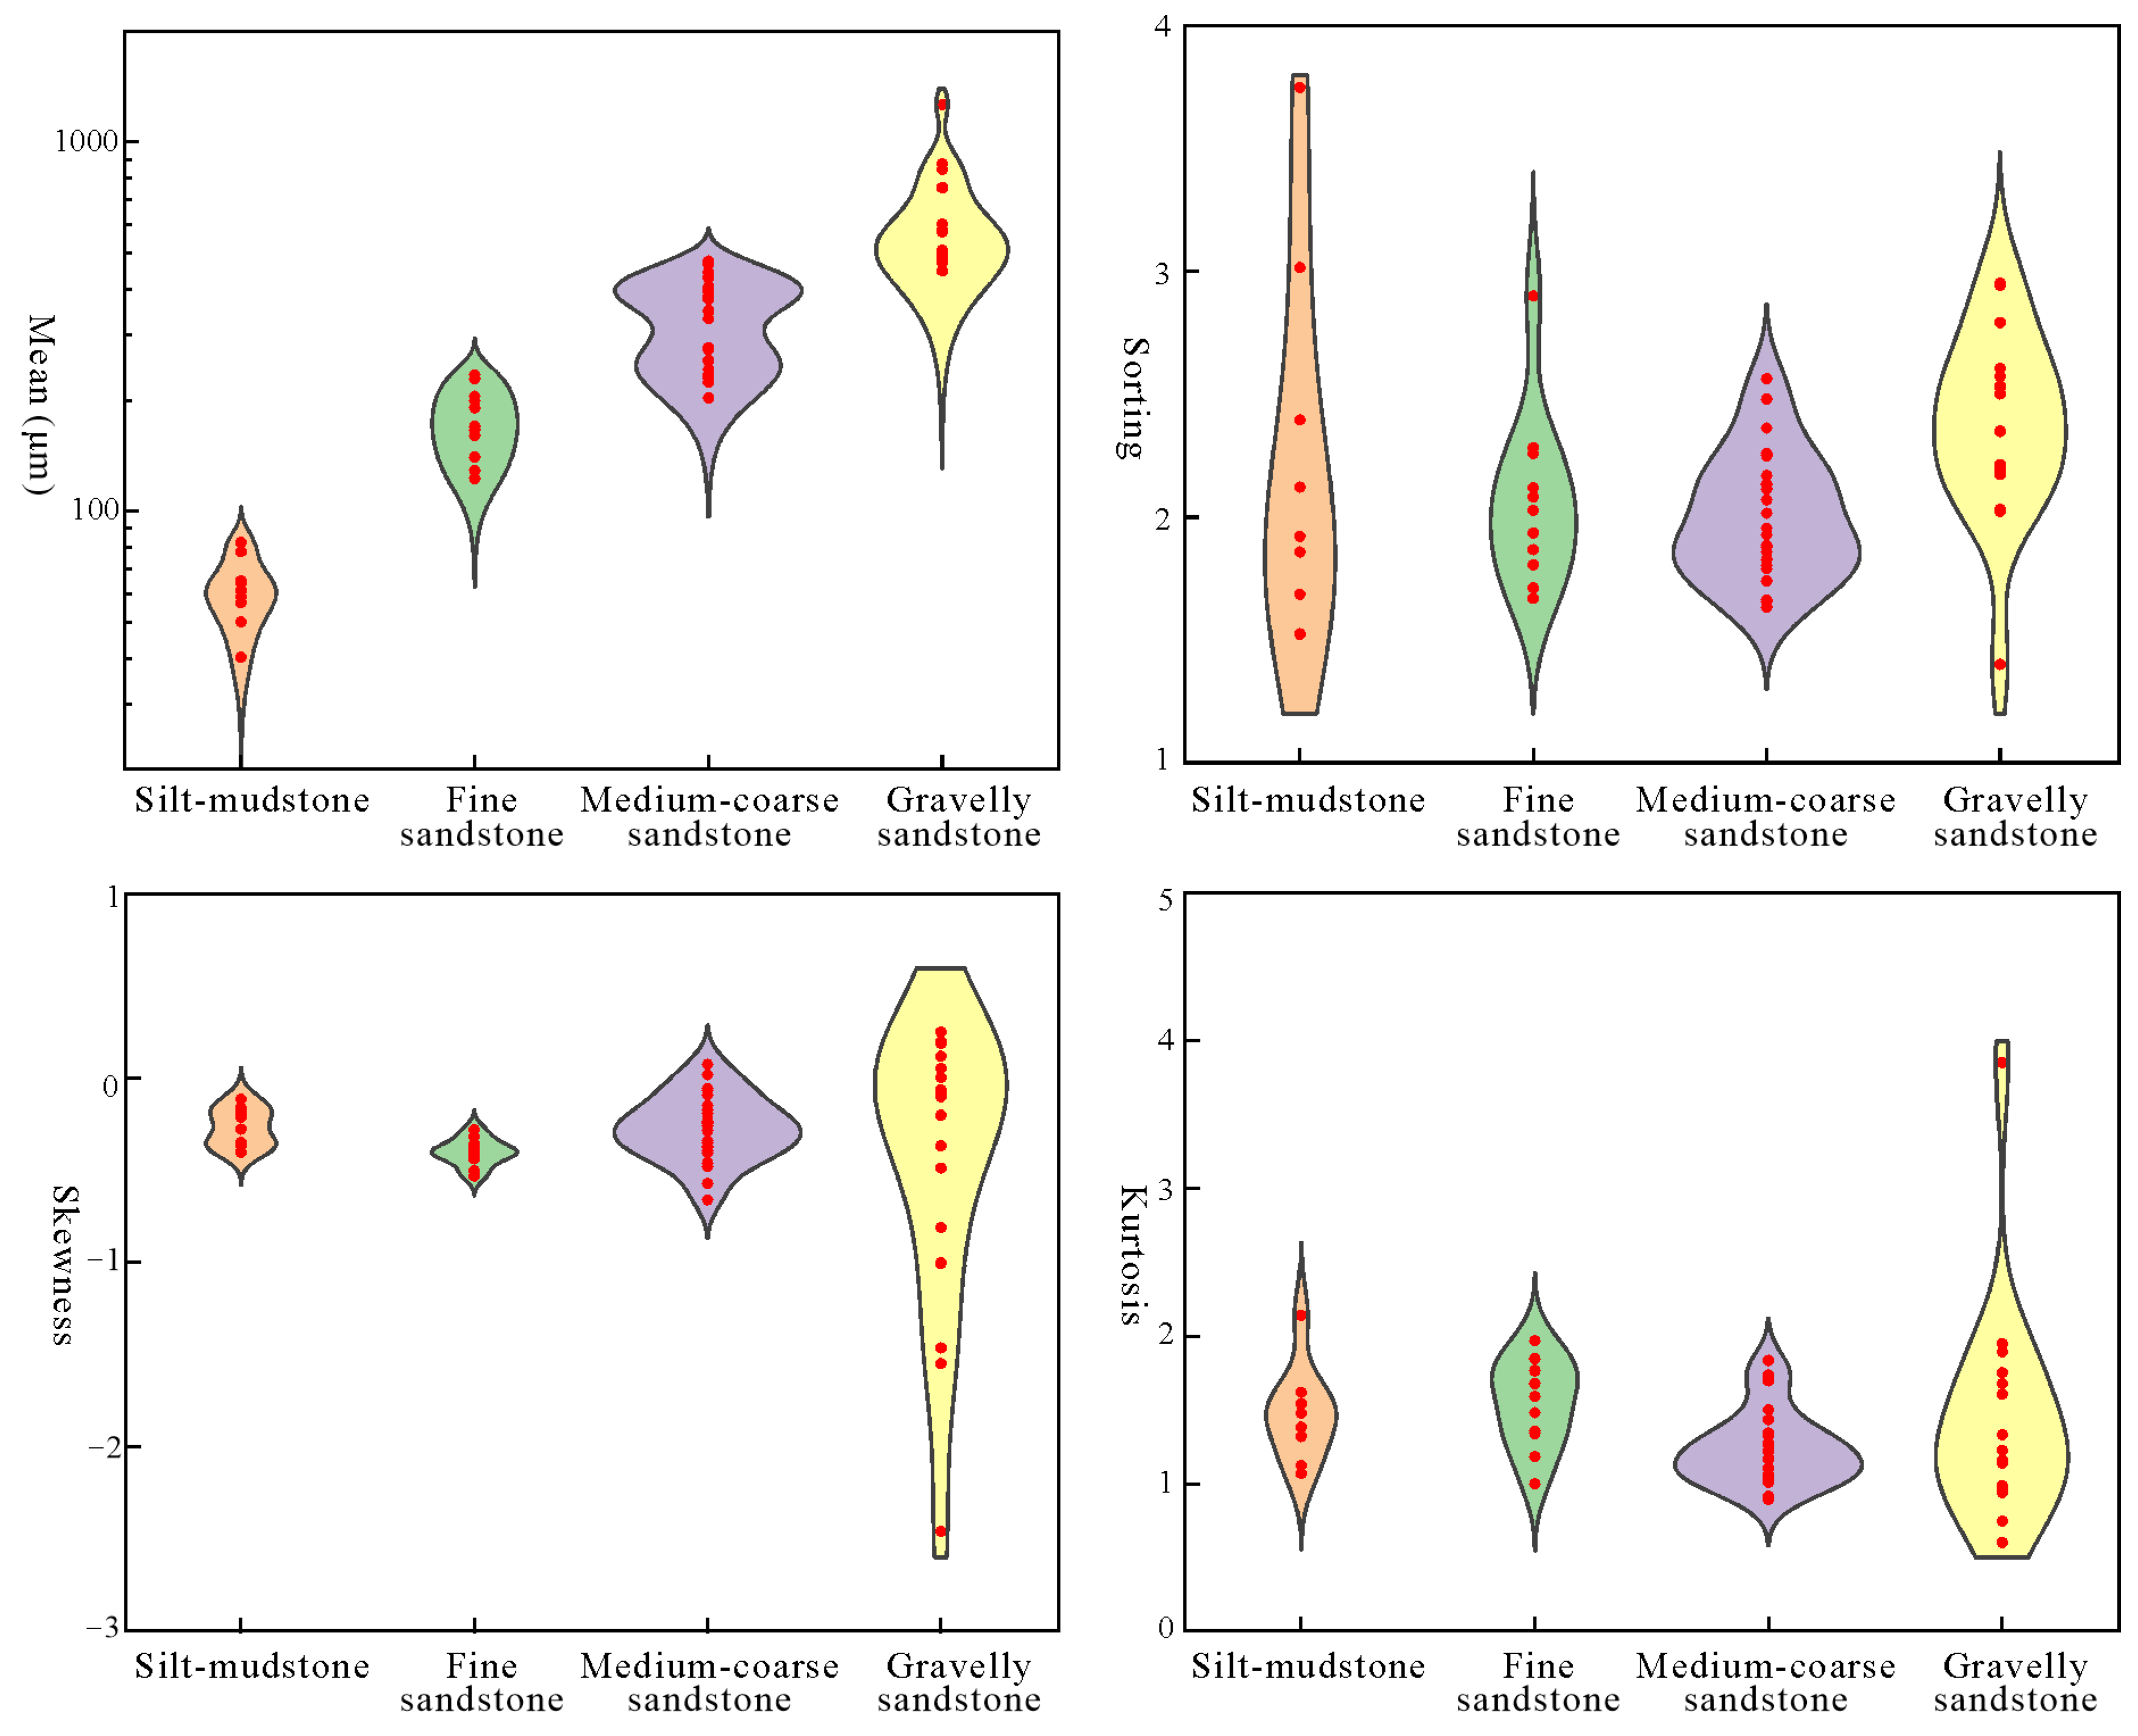
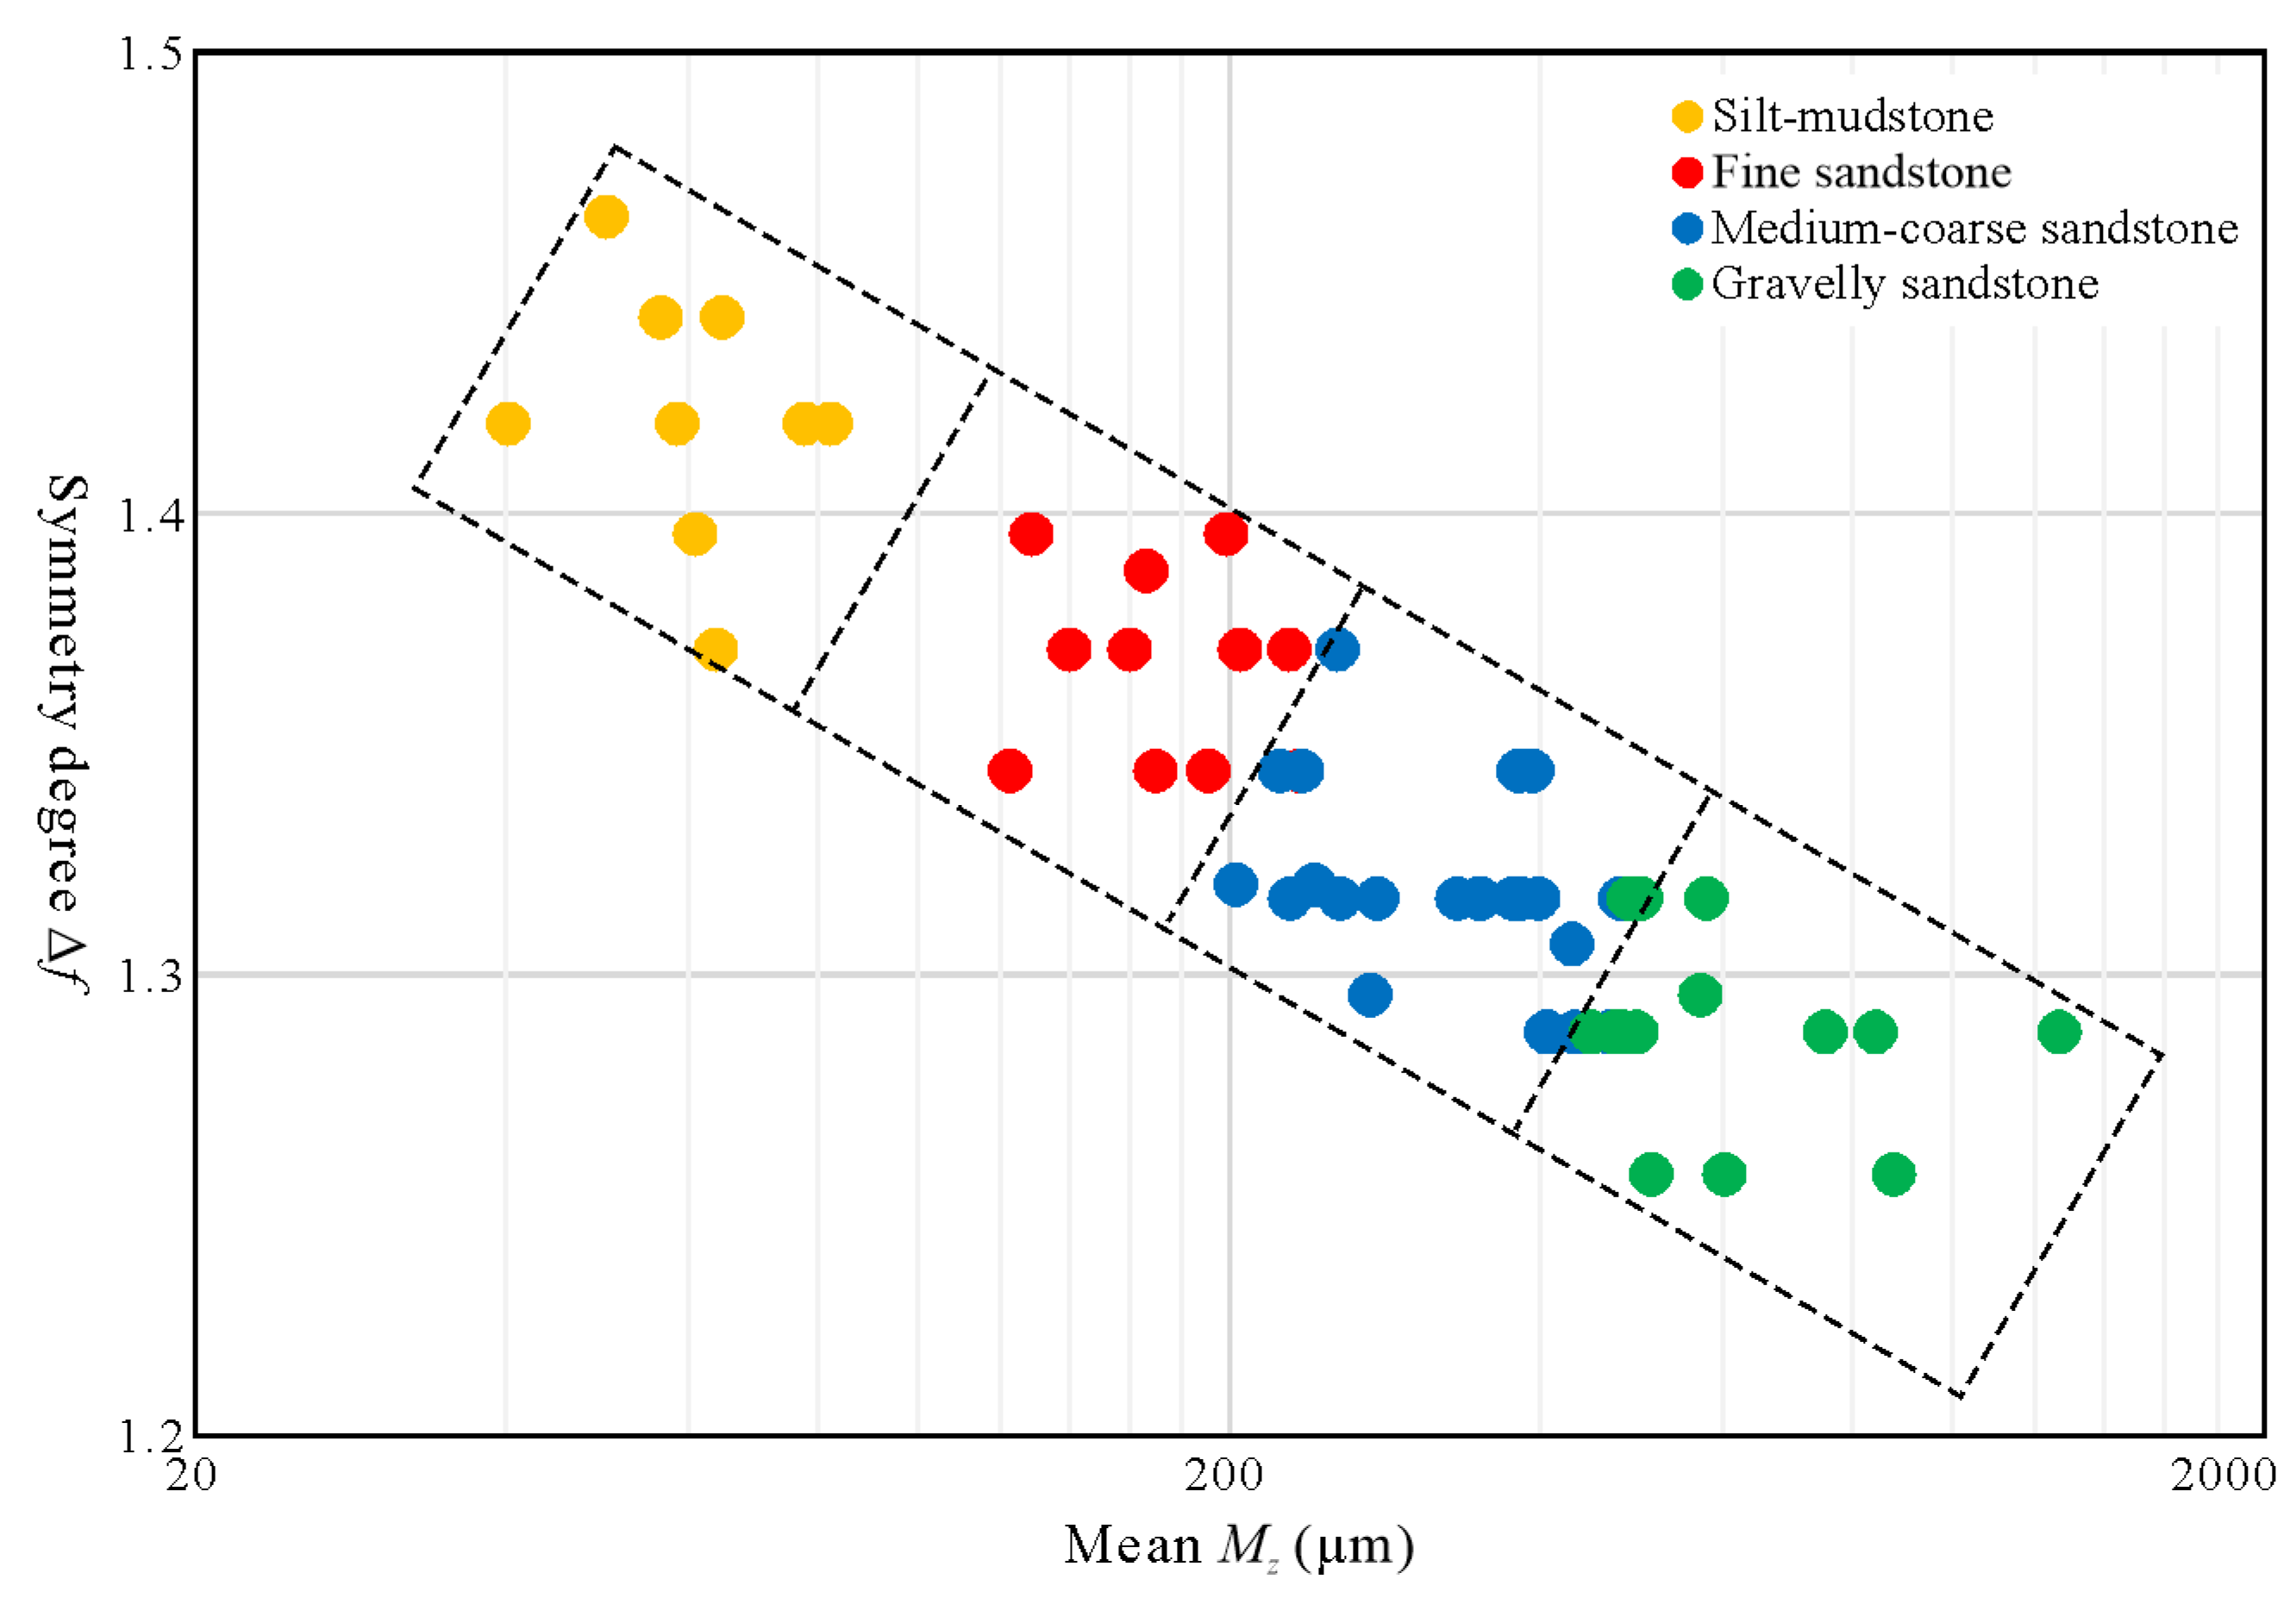
- The entropy dimension and singularity spectrum width ranges of silt-mudstones and gravelly sandstones are wider than those of fine and medium-coarse sandstones. The symmetry degree scopes from different lithologies are concentrated. With the increase of grain sizes, the symmetry degree decreases overall. The symmetry degree and mean of GSDs are effective for distinguishing the different lithologies from various depositional environments in braided delta-front.
- (3)
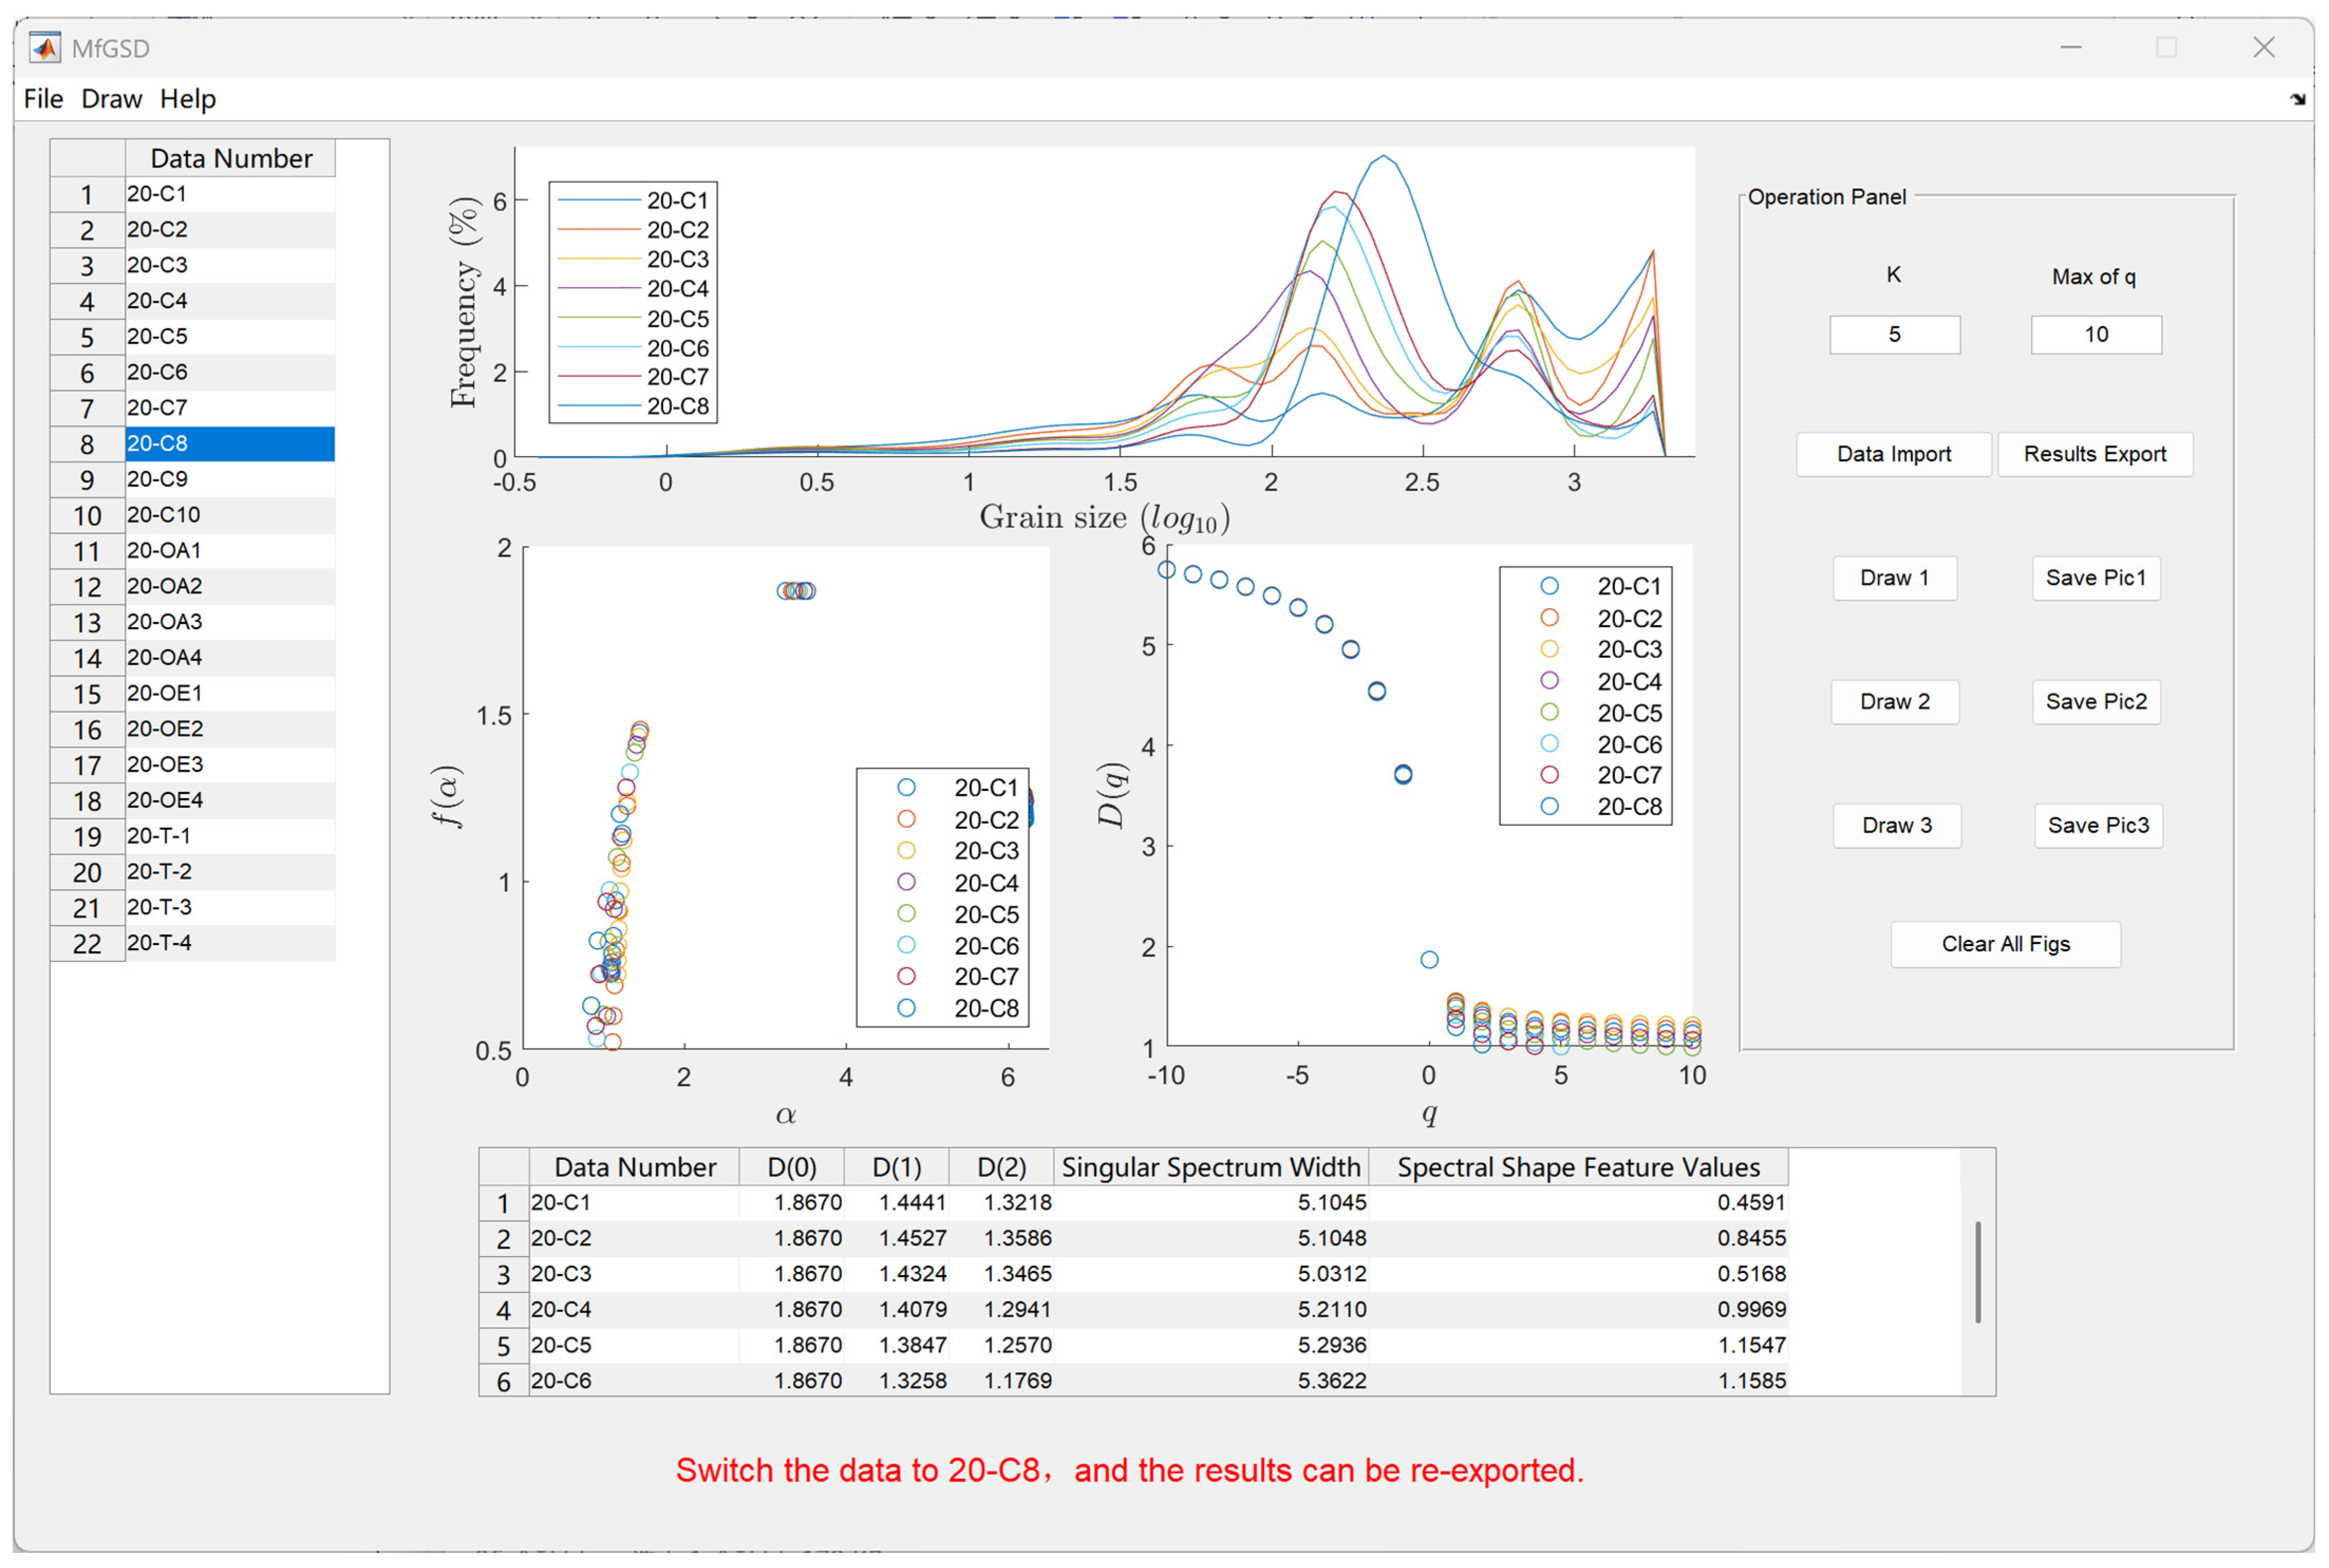
- The MfGSD is a flexible, efficient, and easy-to-use tool that can be used to conduct multifractal analysis of sediment GSDs. It generates not only the multifractal spectrum characteristics of GSDs but also outputs many useful multifractal parameters to reveal depositional information. MfGSD is open-source software that may be used to explore GSDs in various kinds of sedimentary environments.
Author Contributions
Funding
Institutional Review Board Statement
Informed Consent Statement
Data Availability Statement
Acknowledgments
Conflicts of Interest
Abbreviations
| GSD | Grain size distribution |
| GR | Natural gamma ray, API |
| J | Subintervals of GSD |
| pi(ε) | Probability density functions |
| ui(q, ε) | q-order probability of the Ji subinterval |
| D(q) | Multifractal generalized dimension |
| D0 | Capacity dimension |
| D1 | Entropy dimension |
| D2 | Correlation dimension |
| α(q) | Multifractal singularity index |
| f(α(q)) | Singularity spectrum |
| α0 | Average of singular spectrum functions |
| Δα | Width of multifractal singularity spectrum |
| Δf | Symmetry degree of multifractal spectrum |
| Mz | Mean of GSD, μm |
References
- Weltje, G.J.; Prins, M.A. Genetically meaningful decomposition of grain-size distributions. Sediment. Geol. 2007, 202, 409–424. [Google Scholar]
- Yuan, R. Progress on mining methods of sedimentological information from grain-size distribution from the background of big data. Acta Sediment. Sin. 2023; first online. [Google Scholar] [CrossRef]
- Hartmann, D.; Flemming, B. From particle size to sediment dynamics: An introduction. Sediment. Geol. 2007, 202, 333–336. [Google Scholar]
- Liu, Y.M.; Wang, T.; Wen, T.; Zhang, J.G.; Liu, B.; Li, Y.; Zhang, H.; Rong, X.Q.; Ma, L.; Guo, F.; et al. Deep learning-based grain-size decomposition model: A feasible solution for dealing with methodological uncertainty. Sedimentology 2024, 71, 1873–1894. [Google Scholar] [CrossRef]
- Gan, S.Q.; Scholz, C.A. Skew normal distribution deconvolution of grain-size distribution and its application to 530 samples from Lake Bosumtwi, Ghana. Int. J. Sediment Res. 2017, 87, 1214–1225. [Google Scholar]
- Yuan, R.; Zhang, C.M.; Zhao, Y.; Zhang, L.; Chen, Z.; Zhang, B.J.; Huang, R.X. Decomposing subpopulations from grain-size distributions based on skew normal probability distribution and their significances for sedimentary environments. Geol. Rev. 2022, 68, 1033–1045. [Google Scholar]
- Blott, S.J.; Pye, K. GRADISTAT: A grain size distribution and statistics package for the analysis of unconsolidated sediments. Earth Surf. Proc. Land. 2001, 26, 1237–1248. [Google Scholar]
- Blott, S.J.; Pye, K. Particle size scales and classification of sediment types based on particle size distributions: Review and recommended procedures. Sedimentology 2012, 59, 2071–2096. [Google Scholar]
- Ordóñez, C.; Ruiz-Barzola, O.; Sierra, C. Sediment particle size distributions apportionment by means of functional cluster analysis (FCA). Catena 2016, 137, 31–36. [Google Scholar]
- Liu, X.Q.; Song, L.; Wu, Q.L.; Li, G.M.; Mao, X. Application of the affinity propagation clustering algorithm based on grain-size distribution curve to discrimination of sedimentary environment—A case study in Baiyangdian area. Mar. Geol. Quatern. Geol. 2020, 40, 198–209. [Google Scholar]
- Klovan, J.E. The use of factor analysis in determining depositional environments from grain-size distribution. J. Sediment. Petrol. 1966, 36, 115–125. [Google Scholar] [CrossRef]
- Liu, Y.M.; Liu, X.X.; Sun, Y.B. QGrain: An open-source and easy-to-use software for the comprehensive analysis of grain size distributions. Sediment. Geol. 2021, 423, 105980. [Google Scholar] [CrossRef]
- McLaren, P.; Hill, S.H.; Bowles, D. Deriving transport pathways in a sediment trend analysis (STA). Sediment. Geol. 2007, 202, 489–498. [Google Scholar] [CrossRef]
- Gao, S. Grain size trend analysis: Principle and applicability. Acta Sediment. Sin. 2009, 27, 826–836. [Google Scholar]
- Grout, H.; Tarquis, A.M.; Wiesner, M.R. Multifractal analysis of particle size distributions in soil. Environ. Sci. Technol. 1998, 32, 1176–1182. [Google Scholar] [CrossRef]
- Miranda, J.G.V.; Montero, E.; Alves, M.C.; González, A.P.; Vázquez, E.V. Multifractal characterization of saprolite particle-size distributions after topsoil removal. Geoderma 2006, 134, 373–385. [Google Scholar] [CrossRef]
- Paz-Ferreiro, J.; Vázquez, E.V.; Miranda, J.G.V. Assessing soil particle-size distribution on experimental plots with similar texture under different management systems using multifractal parameters. Geoderma 2010, 160, 47–56. [Google Scholar] [CrossRef]
- Posadas, A.N.D.; Giménez, D.; Bittelli, M.; Vaz, C.M.P.; Flury, M. Multifractal characterization of soil particle-size distributions. Soil Sci. Soc. Am. J. 2001, 65, 1361–1367. [Google Scholar] [CrossRef]
- Qiao, J.B.; Zhu, Y.J.; Jia, X.X.; Shao, M.A. Multifractal characteristics of particle size distributions (50–200 m) in soils in the vadose zone on the Loess Plateau, China. Soil Till. Res. 2021, 205, 104786. [Google Scholar] [CrossRef]
- Chang, H.; Zuo, H.J.; Wang, H.B.; Yan, M. Multi-fractal features and their significances of surface sediments along both banks of the Yellow River Reach in the Ulanbuh Desert. Arid Zone Res. 2019, 36, 1559–1567. [Google Scholar]
- Li, J.L.; He, X.B.; Wei, J.; Bao, Y.H.; Tang, Q.; de Dieu Nambajimana, J.; Nsabimana, G.; Khurram, D. Multifractal features of the particle-size distribution of suspended sediment in the Three Gorges Reservoir, China. Int. J. Sediment Res. 2021, 36, 489–500. [Google Scholar] [CrossRef]
- Li, Y.; Deng, Y.H.; Li, Y.C. Characteristics and mechanism of source rock development controlled by sedimentary microfacies in river-delta system: Case study of coal-measure source rock in Enping Formation in Pearl River Estuary Basin. Geoscience 2021, 35, 1065–1077. [Google Scholar]
- Lei, Y.C.; Qiu, X.W.; Wu, Q.L.; Zhu, H.T.; Xiao, Z.B.; Li, M. Source and sink system and exploration practice in Early Wenchang Period on East Side of Huilu Low Uplift. J. Jilin Univ. (Earth Sci. Ed.) 2024, 54, 413–428. [Google Scholar]
- Xie, X.J.; Tang, W.; Zhang, S.F.; Zhu, R.; Fan, D.X.; Li, R. Sedimentary characteristics and geological significance of a mixed-process delta for petroleum exploration in the Zhuhai formation of the Baiyun Depression, Pearl River Mouth Basin, China. Petrol. Res. 2024, 9, 599–609. [Google Scholar]
- Ju, Z.L.; Tang, H.; Liu, W.X.; Zhu, Y.D.; Tian, T.F.; Mao, Y. Identification of mudstone markers and its application in stratigraphic correlation in transitional sediments: A Case of the Paleogene in Oilfield A, Lufeng Sag, Zhujiangkou Basin. Marin Orig. Petrl. Geol. 2024, 22, 89–94. [Google Scholar]
- Peng, G.R.; Liu, P.; Song, P.L.; Gao, X.; Xiong, W.L.; Xiang, Q.W.; Han, B. Characteristics of the “fan-braid” complex and main controlling factors of favorable reservoir in the Enping Formation, Huizhou 26 Sag, Pearl River Mouth Basin. Earth Sci. 2023; first online. Available online: https://link.cnki.net/urlid/42.1874.P.20231127.1128.004 (accessed on 28 November 2023).
- Que, X.M.; Shu, Y.; Wang, X.D.; Lei, Y.C.; Wang, Y.C.; Wu, Q.L. Provenance characteristics and sedimentary evolution of Zhu I Depression in Paleogene: Indications from detrital zircon ages. Earth Sci. 2024, 49, 2373–2387. [Google Scholar]
- Dietze, E.; Hartmann, K.; Diekmann, B.; IJmker, J.; Lehmkuhl, F.; Opitz, S.; Stauch, G.; Wunnemann, B.; Borchers, A. An end-member algorithm for deciphering modern detrital processes from lake sediments of Lake Donggi Cona, NE Tibetan Plateau, China. Sediment. Geol. 2012, 243–244, 169–180. [Google Scholar]
- Yuan, R.; Feng, W.J.; Zhang, C.M.; Zhao, K.; Liu, J.L.; Fu, W.J.; Wang, Z.Y.; Meng, Q.H.; Wang, L.H. Fluvial—Aeolian dune depositional environment significances from grain-size end-member in low-beach at the head of Tianxing Central-bar in Wuhan section of Yangtze River. Geol. Rev. 2024, 70, 436–448. [Google Scholar]
- Folk, R.L.; Ward, W.C. Brazos River bar: A study in the significance of grain size parameters. J. Sediment. Petrol. 1957, 27, 3–26. [Google Scholar]
- Rodríguez-Lado, L.; Lado, M. Relation between soil forming factors and scaling properties of particle size distributions derived from multifractal analysis in topsoils from Galicia (NW Spain). Geoderma 2017, 287, 147–156. [Google Scholar]
- Wang, J.M.; Lu, X.; Feng, Y.; Yang, R.X. Integrating multi-fractal theory and geo-statistics method to characterize the spatial variability of particle size distribution of minesoils. Geoderma 2018, 317, 39–46. [Google Scholar]

| Parameter | Silt-Mudstone | Fine Sandstone | Medium-Coarse Sandstone | Gravelly Sandstone |
|---|---|---|---|---|
| Δf | 1.35–1.5 | 1.33–1.4 | 1.27–1.37 | 1.25–1.32 |
| Mz (μm) | <60 | 60–220 | 200–350 | >300 |
Disclaimer/Publisher’s Note: The statements, opinions and data contained in all publications are solely those of the individual author(s) and contributor(s) and not of MDPI and/or the editor(s). MDPI and/or the editor(s) disclaim responsibility for any injury to people or property resulting from any ideas, methods, instructions or products referred to in the content. |
© 2025 by the authors. Licensee MDPI, Basel, Switzerland. This article is an open access article distributed under the terms and conditions of the Creative Commons Attribution (CC BY) license (https://creativecommons.org/licenses/by/4.0/).
Share and Cite
Yuan, R.; Yan, Z.; Zhu, R.; Wang, C. Multifractal Characteristics of Grain Size Distributions in Braided Delta-Front: A Case of Paleogene Enping Formation in Huilu Low Uplift, Pearl River Mouth Basin, South China Sea. Fractal Fract. 2025, 9, 216. https://doi.org/10.3390/fractalfract9040216
Yuan R, Yan Z, Zhu R, Wang C. Multifractal Characteristics of Grain Size Distributions in Braided Delta-Front: A Case of Paleogene Enping Formation in Huilu Low Uplift, Pearl River Mouth Basin, South China Sea. Fractal and Fractional. 2025; 9(4):216. https://doi.org/10.3390/fractalfract9040216
Chicago/Turabian StyleYuan, Rui, Zijin Yan, Rui Zhu, and Chao Wang. 2025. "Multifractal Characteristics of Grain Size Distributions in Braided Delta-Front: A Case of Paleogene Enping Formation in Huilu Low Uplift, Pearl River Mouth Basin, South China Sea" Fractal and Fractional 9, no. 4: 216. https://doi.org/10.3390/fractalfract9040216
APA StyleYuan, R., Yan, Z., Zhu, R., & Wang, C. (2025). Multifractal Characteristics of Grain Size Distributions in Braided Delta-Front: A Case of Paleogene Enping Formation in Huilu Low Uplift, Pearl River Mouth Basin, South China Sea. Fractal and Fractional, 9(4), 216. https://doi.org/10.3390/fractalfract9040216