Article

Experimental and Microscopic Analysis for Impact of Compaction Coefficient on Plastic Strain Characteristic of Soft Clay in Seasonally Frozen Soil Regions

1
Department of Civil Engineering, Hangzhou City University, Hangzhou 310015, China
2
Zhejiang Engineering Research Center of Intelligent Urban Infrastructure, Hangzhou City University, Hangzhou 310015, China
3
Key Laboratory of Safe Construction and Intelligent Maintenance for Urban Shield Tunnels of Zhejiang Province, Hangzhou 310015, China
4
College of Civil Engineering and Architecture, Zhejiang University, Hangzhou 310058, China
*
Author to whom correspondence should be addressed.
Fractal Fract. 2025, 9(4), 214; https://doi.org/10.3390/fractalfract9040214
Submission received: 22 January 2025 / Revised: 24 March 2025 / Accepted: 25 March 2025 / Published: 28 March 2025
(This article belongs to the Section Engineering)

Abstract

Freeze–thaw cycles and the soil compaction coefficient ( λ c ) have significant influence on the plastic strain for the foundation of underground structures in seasonal permafrost regions. Understanding the microstructural evolution of freeze–thawed soil is pivotal for assessing the long-term settlement of infrastructure foundation under repeated train loading. This study investigates the impacts of freeze–thaw cycles and λ c on the plastic strain and pore size distribution (PSD), as well as fractal characteristics, of soft clay via a set of cyclic triaxial tests and nuclear magnetic resonance (NMR) analyses. Fractal theory was adopted to analyze the heterogeneity of soil specimens. The results showed that an increase in λ c could efficiently alleviate the cumulative plastic strain. It also decreased the proportion of large pores and facilitated the generation of small and medium-sized pores. The analysis of the NMR test demonstrated that the freeze–thaw cycle led to the disruption of the soil’s microporous structure. Moreover, a higher value of λ c encouraged the formation of a more intricate and uniform pore structure. This, in turn, increased the fractal dimension, enhanced the structural heterogeneity, and thereby improved the soil’s structural complexity and its resistance to deformation. These findings underscore the significance of achieving optimal compaction levels to bolster soil stability under freeze–thaw conditions, provide valuable guidance for infrastructure design in permafrost regions, and help to ensure the durability and stability of transportation networks, such as railways and roads, over time.

1. Introduction

Permafrost is a special multiphase soil comprising various cemented particles, with a complex structure marked by numerous pores. Approximately 53.5% of China’s landmass falls within seasonal permafrost regions, subjecting the soil to recurrent freeze–thaw cycles, which significantly deteriorate soil strength, particularly in colder areas [1,2]. During freezing, frost heave occurs due to the expansion of pore water and particle displacement, while thawing causes the water to melt and the particles to reposition. This repetitive process has a deep-seated effect on the mechanical performance of the soil [3]. In locales enduring long-term dynamic loads, for instance, those near railways, the structural stability of permafrost is increasingly undermined. Repeated loads from train operations cause continuous compaction and shear forces, exacerbating soil deformations. In seasonal permafrost, the interaction between freeze–thaw cycles and train-induced dynamic loads heightens the potential for soil settlement, posing significant risks to infrastructure safety [4]. Research indicates that cyclic loads cause a decline in soil strength, particularly within soft soil environments [5]. In such soft soils, freeze–thaw cycles cause the loosening of the soil structure and a reduction in its resistance to deformation [6,7]. Comprehending the joint impacts of freeze–thaw cycles and cyclic loading is crucial for the design and upkeep of infrastructure located in these areas. Therefore, research on cumulative plastic strain and microscopic pore distribution under various freezing conditions and prolonged dynamic loading is critical for mitigating risks and ensuring structural stability [8].
Under cyclic train loading, two key factors contribute to the long-term settlement of train tunnel foundations. One is the settlement caused by the freezing–thawing process, and the other is the cumulative plastic strain accompanied by the dissipation of pore pressure. Frost heave causes modifications to the soil’s microstructures and then decreases the soil’s dynamic performance and increases the settlement [9]. To examine these changes, methods like NMR, Computed Tomography (CT), Scanning Electron Microscopy (SEM), and Mercury Intrusion Porosimetry (MIP) are utilized. Nevertheless, each of these approaches has its own set of drawbacks. SEM requires decomposing samples, introducing structural destruction and randomness [10,11,12,13]. CT provides 3D pore imaging but with low resolution, while MIP cannot directly observe pore morphology [14,15,16]. NMR offers non-destructive, in situ testing, making it effective for analyzing microstructures and water–soil interactions [17,18,19]. Indoor tests such as uniaxial compression and cyclic loading tests further reveal the effects of freeze–thaw cycles on soft soils’ strength, providing insights for engineering design [20,21,22]. Understanding these combined effects is critical for maintaining infrastructure stability in seasonal permafrost regions.
Fractal theory, first introduced by Benoît Mandelbrot [23], offers a valuable method for analyzing the shapes and distribution characteristics of intricate geometrical forms. In recent times, this approach has been employed for the study of soil microstructure [24]. Lange et al. [25] used fractal theory in conjunction with image analysis to evaluate the fractal characteristics in the pore structure of cement materials. Noh et al. [26] forged a link between matric suction and unfrozen water content and obtained key parameters from the statistical particle size distribution based on Mualem’s model. Additionally, Khalili et al. [27] put forward a fractal model that took volume change factors into account. However, these studies are constrained by the oversimplification of soil particle pore morphology. However, existing fractal models often oversimplify pore morphology as idealized geometric shapes, failing to represent the true complexity and irregularity of real-world pore structures modified by cyclic loading. Additionally, the impact of λ c in governing pore structure evolution within soft clay matrices remains poorly understood. More effort is needed to be made to unravel the multiscale interactions between λ c , microstructural reorganization, and the fractal attribute differentiation of soft clay in permafrost region.
The objective of this study is to assess the impacts of λ c and a solitary freeze–thaw cycle on the mechanical attributes and microstructure of soft clay when subjected to dynamic cyclic loading. First, a series of cyclic triaxial tests and NMR tests are conducted on soft clay and freeze–thawed soft clay samples with different λ c to evaluate the plastic strain and pore structure change under repeated train loading. Then, based on the results, the effect of these factors on the cumulative permanent strain, the build-up of pore pressure, the configuration of the micropore structure, and the fractal characteristics exhibited by the samples is analyzed. By integrating microscopic structural analysis, the study linked the macroscopic axial cumulative plastic deformation with soil microstructure, providing insights into the long-term settlement of foundation soils in seasonal regions. Additionally, fractal dimension was used to quantify the complexity of soil pore distribution, aiding in understanding the structural evolution of soils under repeated vehicle loading.

2. Materials and Methods

2.1. Materials

As depicted in Figure 1, the test soft clay was obtained from a foundation pit close to a train station in Hangzhou, China. The component analysis test indicated that the main components of this soil were illite and montmorillonite. The physical properties test was conducted according to ASTM D4318 [28], and the results were presented in Table 1. To guarantee consistent water content, maintain structural integrity, and achieve reliable and uniform test results, the specimens were prepared by artificially freezing remolded soil.

2.2. Experiments

The primary performance indexes that need to be investigated were axial strain, pore water pressure, and alterations in the microstructure. Three experiments were conducted on the test samples to evaluate these performances, including freeze–thaw cycle tests, repeated loading triaxial tests, and NMR tests.
According to the ASTM D421-85 [29], for the tests in this paper, the sample preparation process consisted of drying remolded soil for 24 h at 60 degrees in the drying oven and then crushing it and passing it through a 0.425 mm sieve to ultimately obtain fine-grained clay. The specimens were made by five layers based on the layered compaction method. The height of each layer was 2 cm, which was strictly measured by vernier calipers, and the final cylindrical specimens with a diameter of 50 mm, a height of 100 mm, and a mass of about 360 g were produced. The λ c tested were 0.80, 0.85, and 0.90, with the higher coefficients expected to limit frost heave and reduce deformation under dynamic loading. After compaction, these specimens were vacuum-saturated at 0.1 MPa for 4 h to ensure full saturation. The test plan for this study was summarized in Table 2.
The freeze–thaw cycle test was carried out using the DW-25 freeze–thaw machine (Cangzhou Lanqi Instrument Co., Ltd., Cangzhou, China). In each freeze–thaw cycle, the test sample was first frozen at −10 °C for 4 h. Subsequently, it was immersed in water at 20 °C for an additional 4 h to finish the thawing stage.
After the freeze–thaw cycles, repeated loading triaxial tests were performed with the Geotechnical Digital Systems (GDS, Earth Products China Limited, Guangzhou, China) to simulate actual loading scenarios. The testing parameters included a confining pressure of 100 kPa, a dynamic stress amplitude of 20 kPa, and a loading frequency of 1 Hz, with a half-sine waveform. Table 3 provides a summary of the test procedure and relevant parameters.
Finally, the samples experienced NMR scanning using the MesoMR23-060H-I NMR system (Suzhou Niumag Analytical Instrument Corporation, Suzhou, China) to investigate changes in microstructure. The samples were placed in NMR tubes while maintaining full saturation to ensure accurate analysis of pore distribution and water content. The specimens in the tests were shown in Figure 2.

2.3. Analysis Method of NMR Test

2.3.1. Calculation Method of PSD

The researchers utilized NMR technology to inspect hydrogen protons [30]. This was achieved through analyzing the interaction between the hydrogen nuclei within samples and the external magnetic field. For this process, first position the sample within the main magnetic field ( B 0 ) and then apply the radiofrequency pulses. This caused the spin proton nuclei to absorb electromagnetic waves, changing from a lower to a higher energy state and altering the magnetization vector from its equilibrium position.
Once the pulses stopped, the hydrogen nuclei sent out signals at a specific frequency and, at the same time, released the energy that had been absorbed. This enabled the spin proton nuclei to transition back to an equilibrium state, a process known as relaxation, characterized by a relaxation time.
To describe the dynamics of the NMR system, the Bloch equations were applied. In this study, the model assumed a static magnetic field ( B ) oriented along the Z axis and a radiofrequency field B 1 ( t ) directed along the X axis. The authors worked out an equation for the cumulative external magnetic field that was exerted on the nuclear spin system as follows:
B ( t ) = ( B x , B y , B z ) = ( 2 B 1 cos ω t , 0 , B 0 )
In the laboratory coordinate system, the Bloch equation was formulated as follows:
d M x d t = γ ( M y B + M z B 1 sin ω t ) M x T 2
d M y d t = γ ( M z B 1 cos ω t M x B 0 ) M y T 2
d M z d t = γ ( M x B 1 sin ω t M y B 1 cos ω t ) M z M 0 T 1
where B represents the magnetic field vector, with B x , B y , and B z being its components along the three spatial directions, B 0 is the initial value for the magnetic field, and B 1 refers to the alternating magnetic field. M represents the magnetization vector, with M x , M y , and M z being its components along the three spatial directions. The parameters t , γ , and M 0 correspond to time, the rotation ratio, and the maximum magnetization, respectively. The rotation frequency is indicated by ω , with T 1 and T 2 referring to the longitudinal and transverse relaxation times.
Upon the transition from the laboratory frame to a rotating coordinate system, the Bloch equation, which pertains to M , is formulated in the following manner:
d M x d t = M y ( ω 0 ω ) M x T 2
d M y d t = M x ( ω 0 ω ) + γ B 1 M z M y T 2
d M z d t = γ B 1 M y ( M z M 0 ) T 1
After applying pulses to a nuclear spin system, the system generally enters a relaxation stage. The longitudinal relaxation process can be depicted by the equation below:
d M z d t = ( M z M 0 ) T 1
Equation (8) can then be presented as follows:
M z ( t ) = M 0 ( 1 e t / T 1 )
For transverse relaxation, the derived equation is presented as follows:
d M x y d t = M x y T 2
Equation (10) can then be exhibited as follows:
M x y ( t ) = M 0 x y e ( t / T 2 )
The T 2 parameter is frequently applied in studying porous fluid media. Drawing on the low-field NMR relaxation mechanism, T 2 relaxation offers a certain degree of understanding regarding the material’s pore structure. It can be categorized into three kinds: free relaxation, surface relaxation, and diffusion-induced relaxation. Surface and free relaxation impact both the horizontal and vertical dimensions, whereas diffusion relaxation is restricted to horizontal influences. The T 2 is expressed as follows [18,31]:
1 T 2 = 1 T 2 B + 1 T 2 S + 1 T 2 D
where T 2 B represents the free transverse relaxation time of the liquid. T 2 S denotes the relaxation time related to surface effects, and T 2 D stands for the relaxation time affected by diffusion within a magnetic field gradient. In porous media, the relaxation of the fluid is mainly governed by surface interactions. When in a uniform magnetic field, the T 2 B for liquid water is computed as follows:
1 T 2 B = ρ 2 S V
In this context, ρ 2 symbolizes the extent of transverse surface relaxation. This value is ascertained by the features of the saturated fluid, the spectrum of mineral composition, and attributes of the pore surface. S represents the surface area of the pores, while V indicates the volume of the pores.
T 2 is related to the pore aperture R , and it can be expressed as follows:
1 T 2 = ρ 2 S V = F s ρ 2 R
Here, F s represents the pore-shape factor. For a pore in the shape of a cylindrical tube, F s = 2 . The specific details regarding the determination of this value are elaborated in Tian’s [32] research. Consequently, Equation (14) can be rewritten as follows:
1 T 2 = 2 ρ 2 R

2.3.2. Calculation Method of Fractal Dimension Based on Fractal Theory

Fractal theory provides a framework for describing the intricate pore structure of soil, with the fractal dimension serving as a quantitative measure of the heterogeneity of soil pores [33]. Based on the fundamental principles of fractals, the fractal characteristics of PSD can be represented as follows [34]:
N ( > r ) = r r max P ( r ) d r = a r D
within this framework, r max denotes the largest pore radius. The function P ( r ) stands for the probability density function of the PSD. The variable a acts as a proportionality constant, and D represents the pore fractal dimension. By differentiating Equation (16) with respect to r , P ( r ) can be obtained as follows:
P ( r ) = a r D 1
where a = D a is the constant of proportionality. The cumulative pore volume for pores (diameter less than r ) is given by
V ( < r ) = r min r P ( r ) a r 3 d r
where a is a shape-dependent constant (e.g., a = 1 for cubic pores and a = 4π/3 for spherical pores), and r min represents the minimum pore radius.
Substitution of Equation (17) into Equation (18) obtains
V ( < r ) = a ( r 3 D r min 3 D )
Consequently, the total pore volume is derived through the following method:
V s = V ( < r max ) = a ( r max 3 D r min 3 D )
where a = D a 2 is the constant of proportionality.
Thus, for pores with a diameter smaller than r , the S v can be expressed as follows:
S v = V ( < r ) V s = r 3 D r min 3 D r max 3 D r min 3 D
Since r min << r max , the above equation can be simplified as follows:
S v = r 3 D r max 3 D
Based on geometric fractal theory, taking the logarithm of both sides of Equation (22) yields
lg S v = ( 3 D ) log r + ( D 3 ) log r max
where r max is the maximum pore size.

3. Results

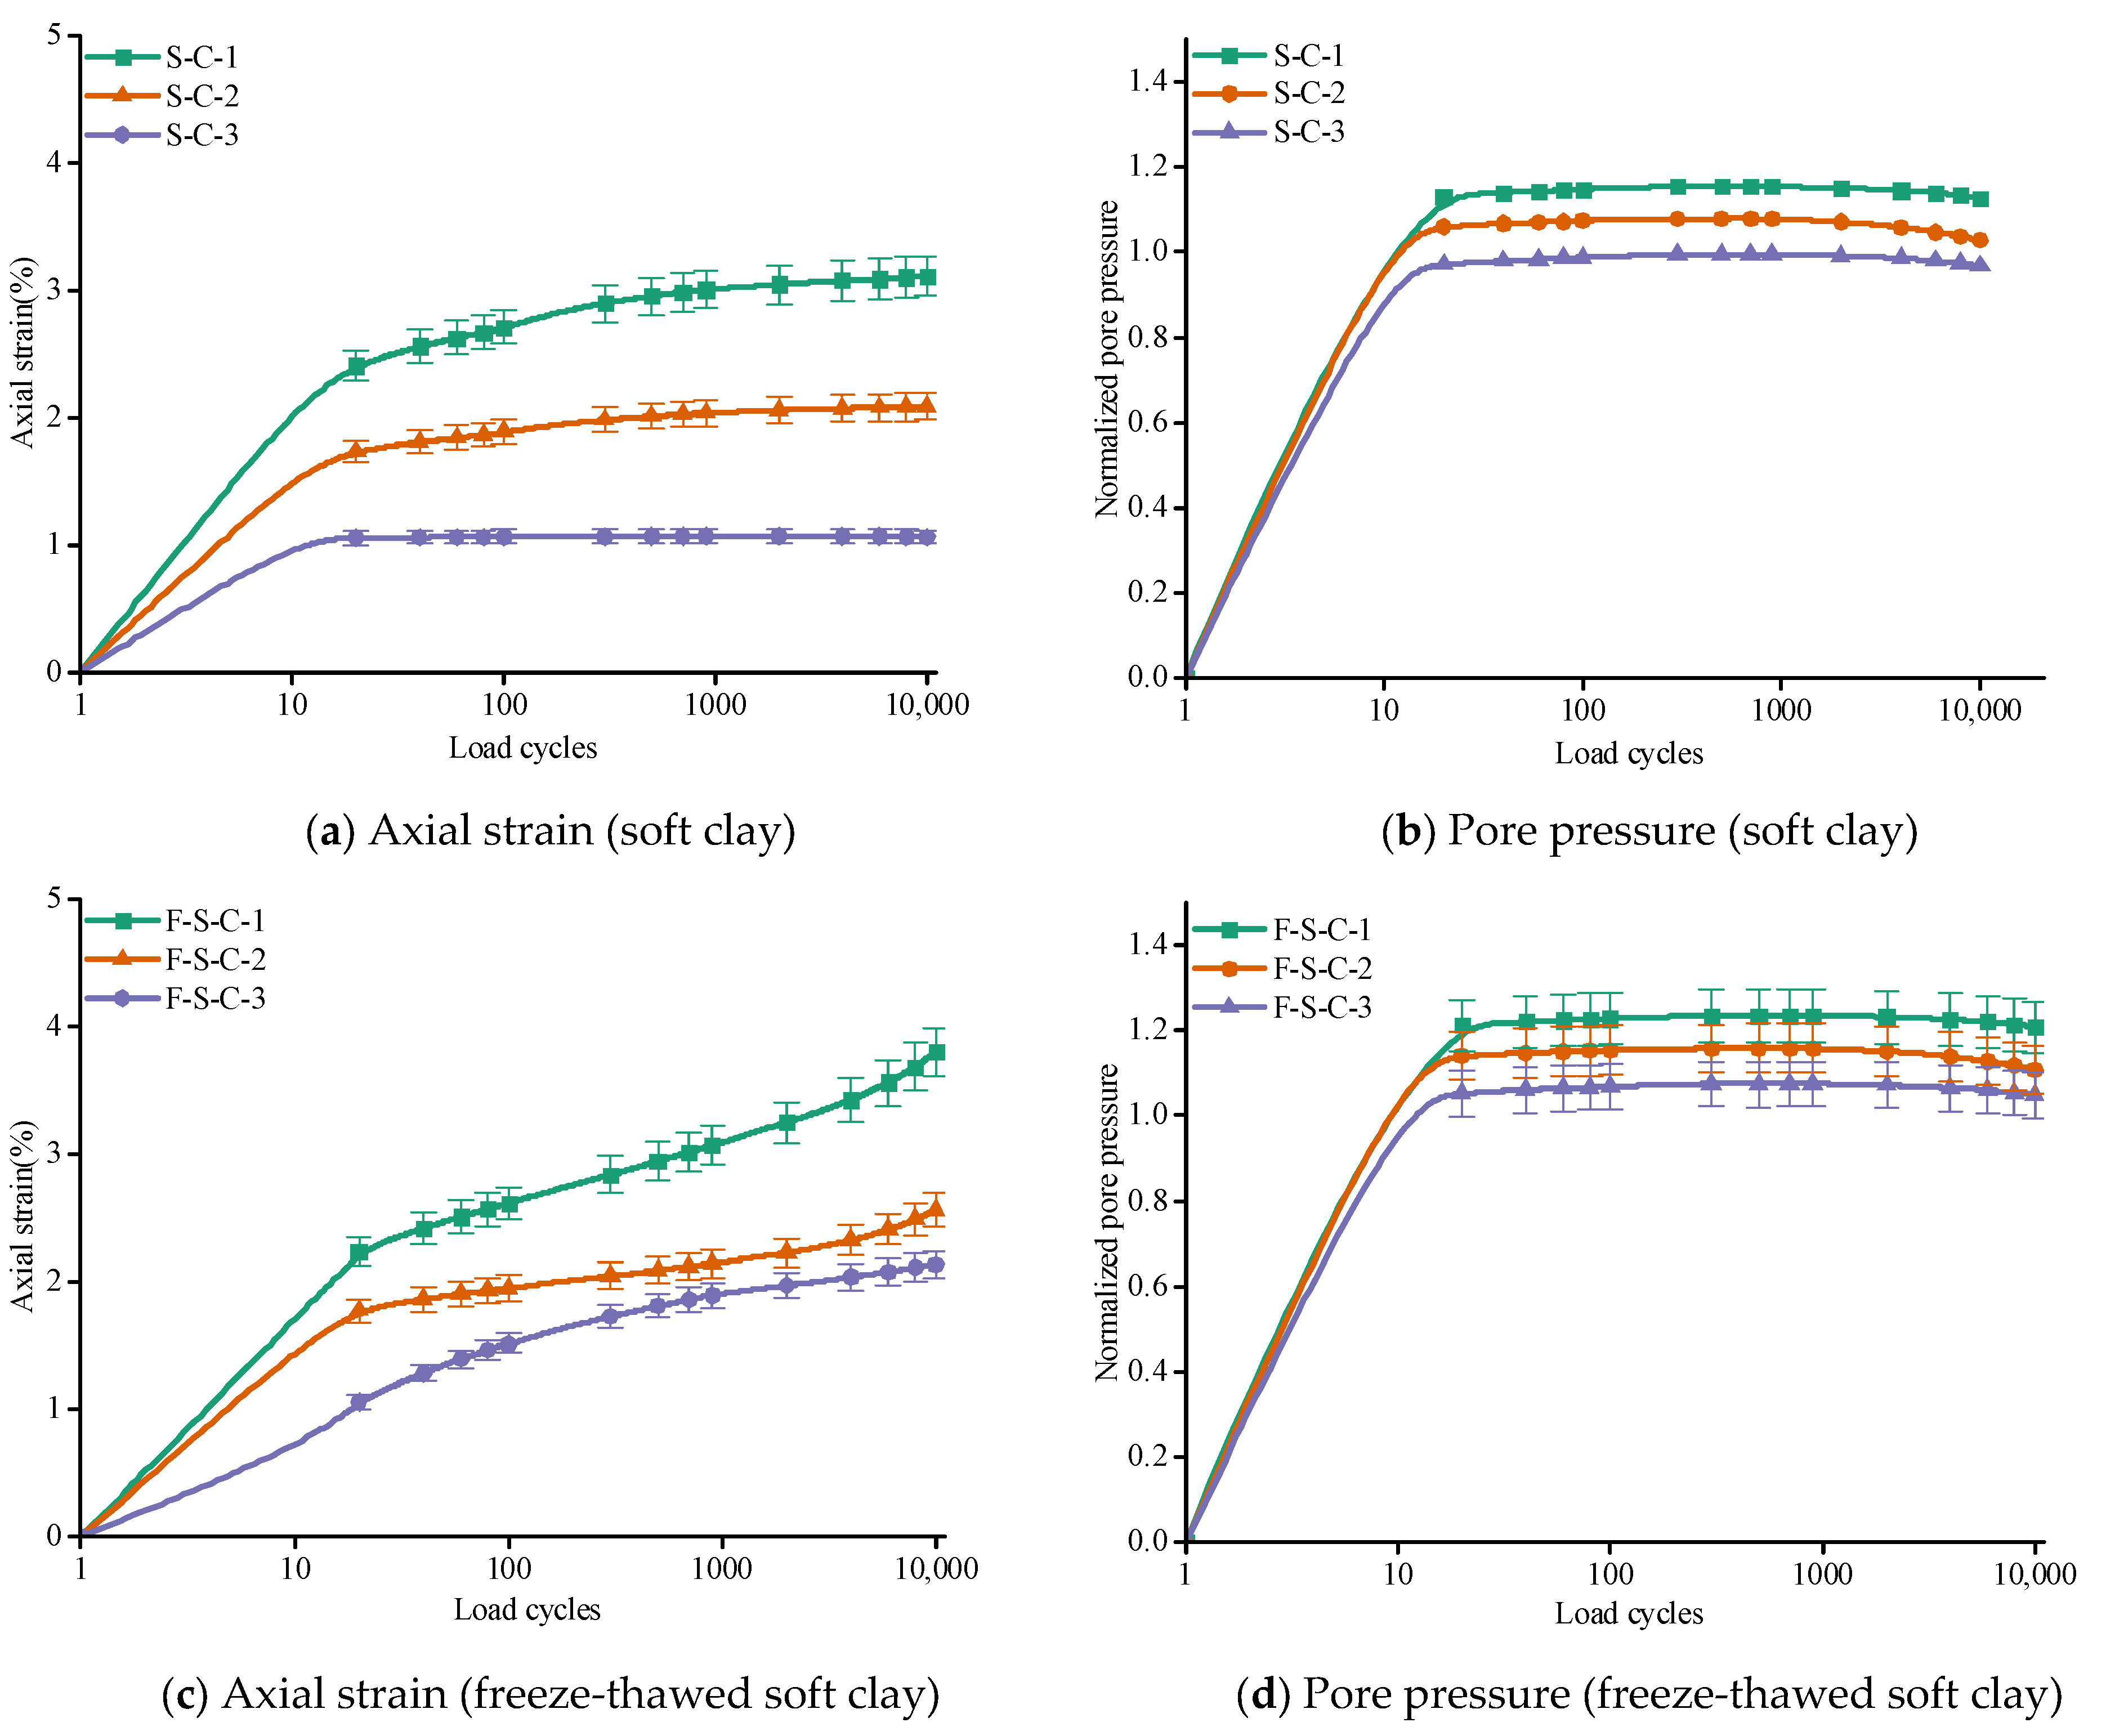
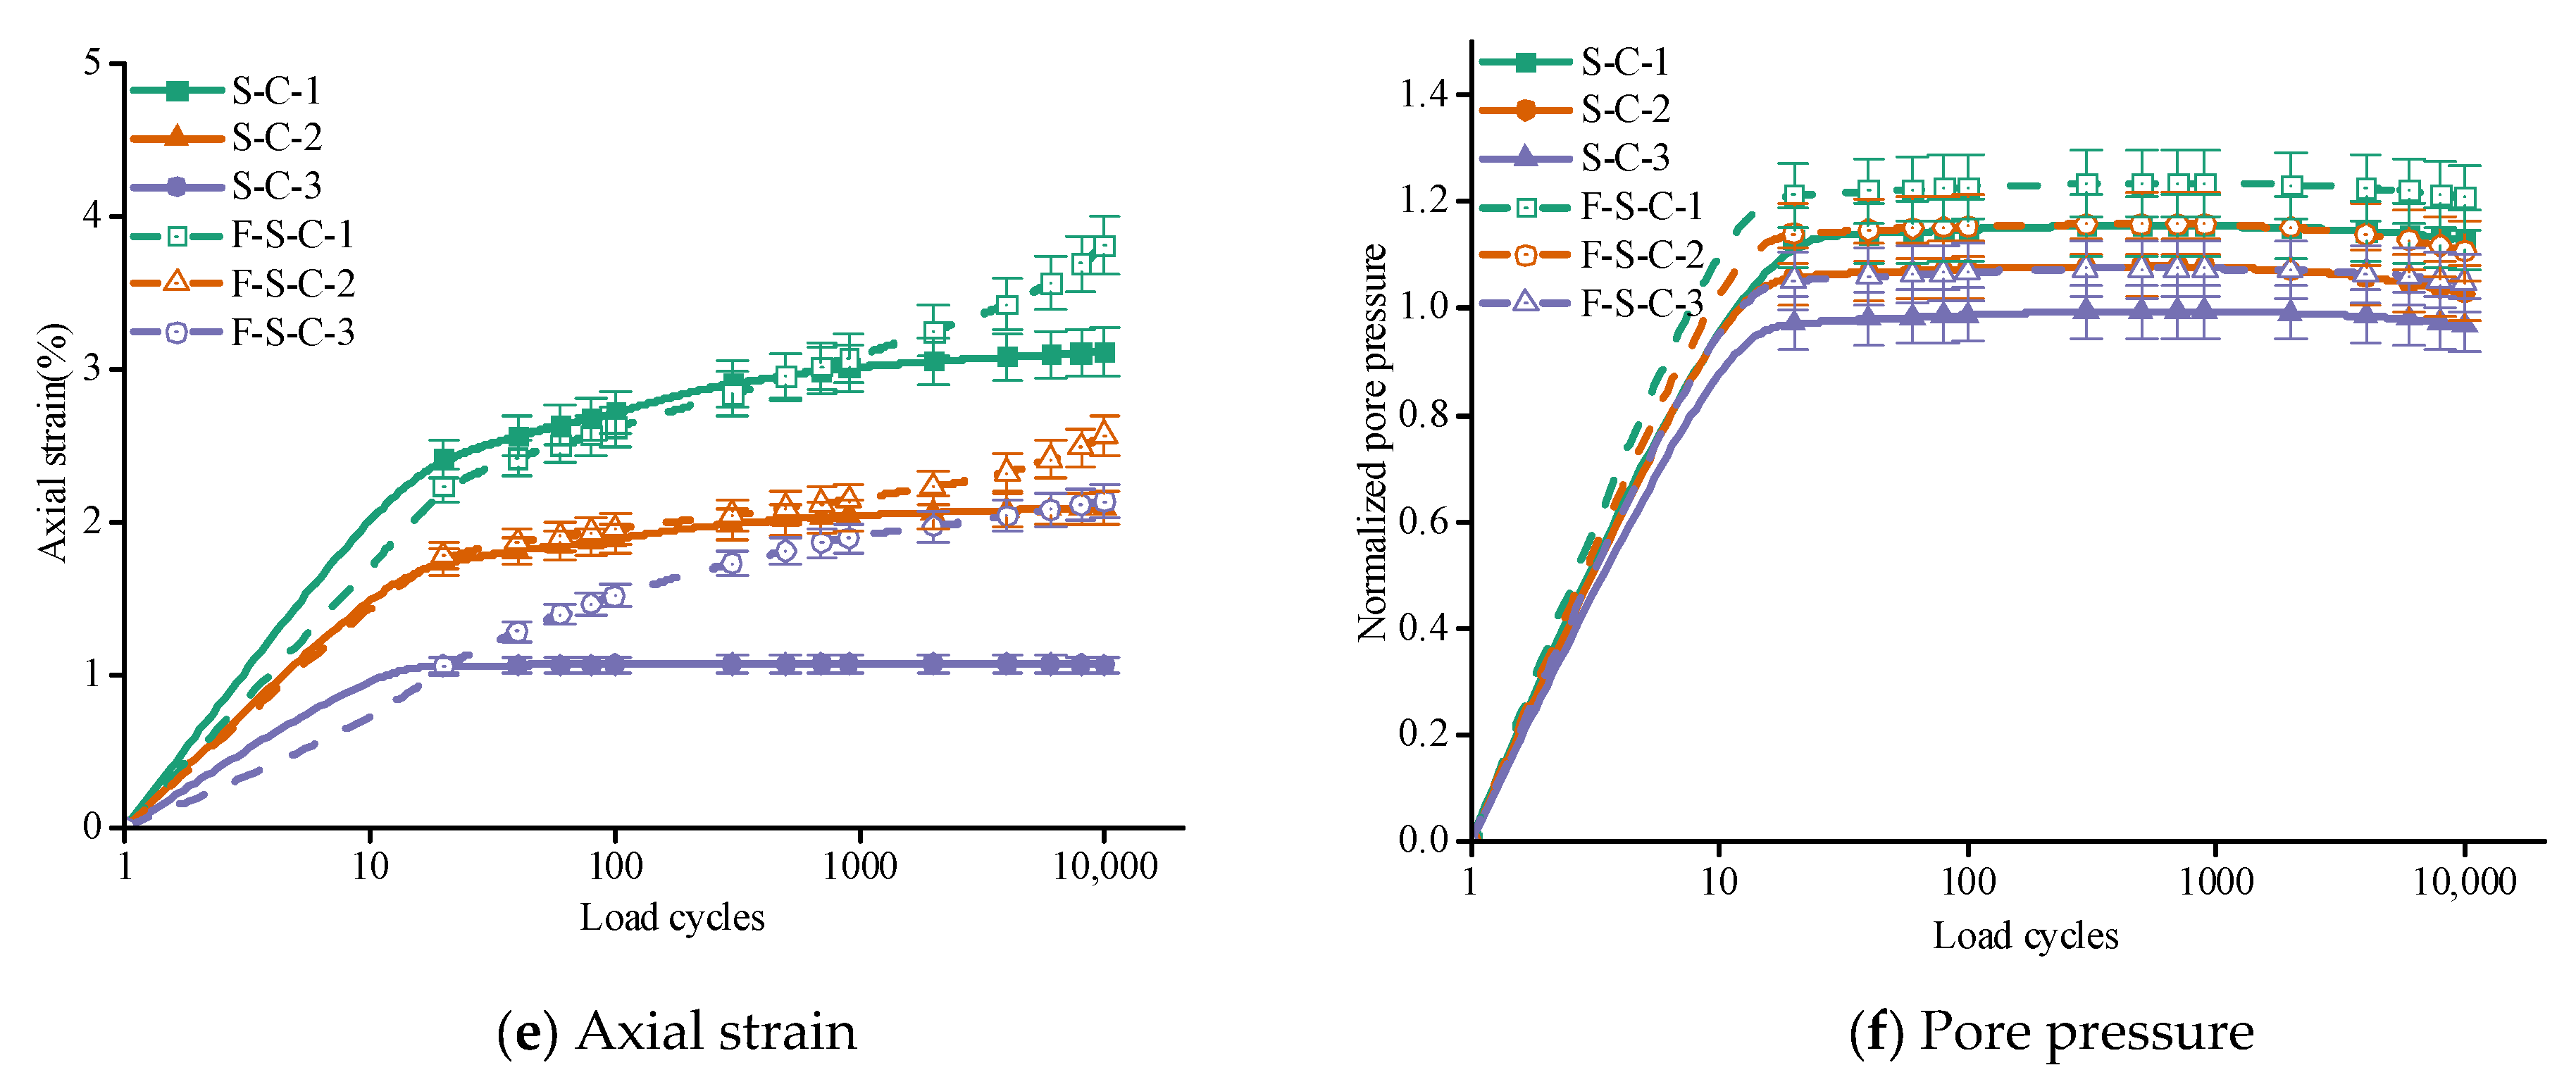
3.1. Triaxial Loading Test

This study analyzed the effect of different λ c and freeze–thaw cycles on the behavior of soft clay using repeated loading triaxial tests. Soil samples with λ c of 0.80, 0.85, and 0.90 were subjected to one freeze–thaw cycle at −10 °C. Key parameters such as axial strain accumulation and pore water pressure were measured under cyclic train loading, as shown in Figure 3. Cyclic loading initially compresses the soil’s internal pores, resulting in rapid axial strain accumulation. After approximately 20 cycles, the soil becomes more compact, and the strain accumulation rate decreases. However, freeze–thawed soils exhibited significantly higher axial strain compared to unfrozen soils, with strain often doubling after a freeze–thaw cycle. The strain in freeze–thawed samples often doubles, highlighting the weakening effect of freeze–thaw cycles. Soils with higher λ c (e.g., 0.90) show reduced axial strain accumulation. This is because higher compaction reduces inter-particle gaps, limiting structural damage during freeze–thaw processes. In contrast, lower λ c soils (e.g., 0.80) have more void spaces, which allow greater water migration and ice crystal formation during freezing, exacerbating strain accumulation. Higher λ c mitigates deformation caused by cyclic loading, preserving soil stability. For infrastructure in seasonal permafrost regions, this suggests that achieving higher compaction reduces settlement risks and enhances the long-term durability of foundations. However, balancing compaction efficiency with cost remains a critical consideration.
Pore water pressure increases sharply at the onset of cyclic loading due to initial soil compression. Over time, it stabilizes as water redistributes and the soil structure compacts. Freeze–thawed soils show higher initial pore water pressure compared to unfrozen samples. This is attributed to changes in soil structure during freezing, where ice lens formation increases bound water content and reduces free water. Higher λ c reduces pore water pressure development under cyclic loading. Densely compacted soils have fewer large pores, limiting water migration and minimizing frost heave effects during freezing. Lower λ c soils, on the other hand, exhibit more significant pore water pressure increases due to greater water mobility and larger pore spaces. Controlling pore water pressure is critical for maintaining soil strength and reducing the risk of liquefaction or excessive deformation. Higher λ c not only improves stability during cyclic loading but also minimizes the adverse influence of freeze–thaw cycles on pore water redistribution. This insight is valuable for designing stable foundations in frost-susceptible soils.
Higher λ c reduces axial strain and pore water pressure, enhancing resistance to deformation and frost heave. This supports the construction of more durable infrastructure in seasonal permafrost regions. While higher compaction levels improve soil performance, they also increase costs and construction time. An optimal λ c value must balance engineering efficiency with economic considerations. Understanding the transformation of pore structure during freeze–thaw cycles informs strategies to minimize settlement and maintain strength. Proper compaction prior to freezing can significantly mitigate frost heave and related structural issues.
These findings underline the importance of tailored compaction strategies for infrastructure stability, particularly in regions experiencing freeze–thaw cycles. Optimal compaction not only enhances long-term performance but also reduces maintenance needs, ensuring sustainable development in challenging environments.

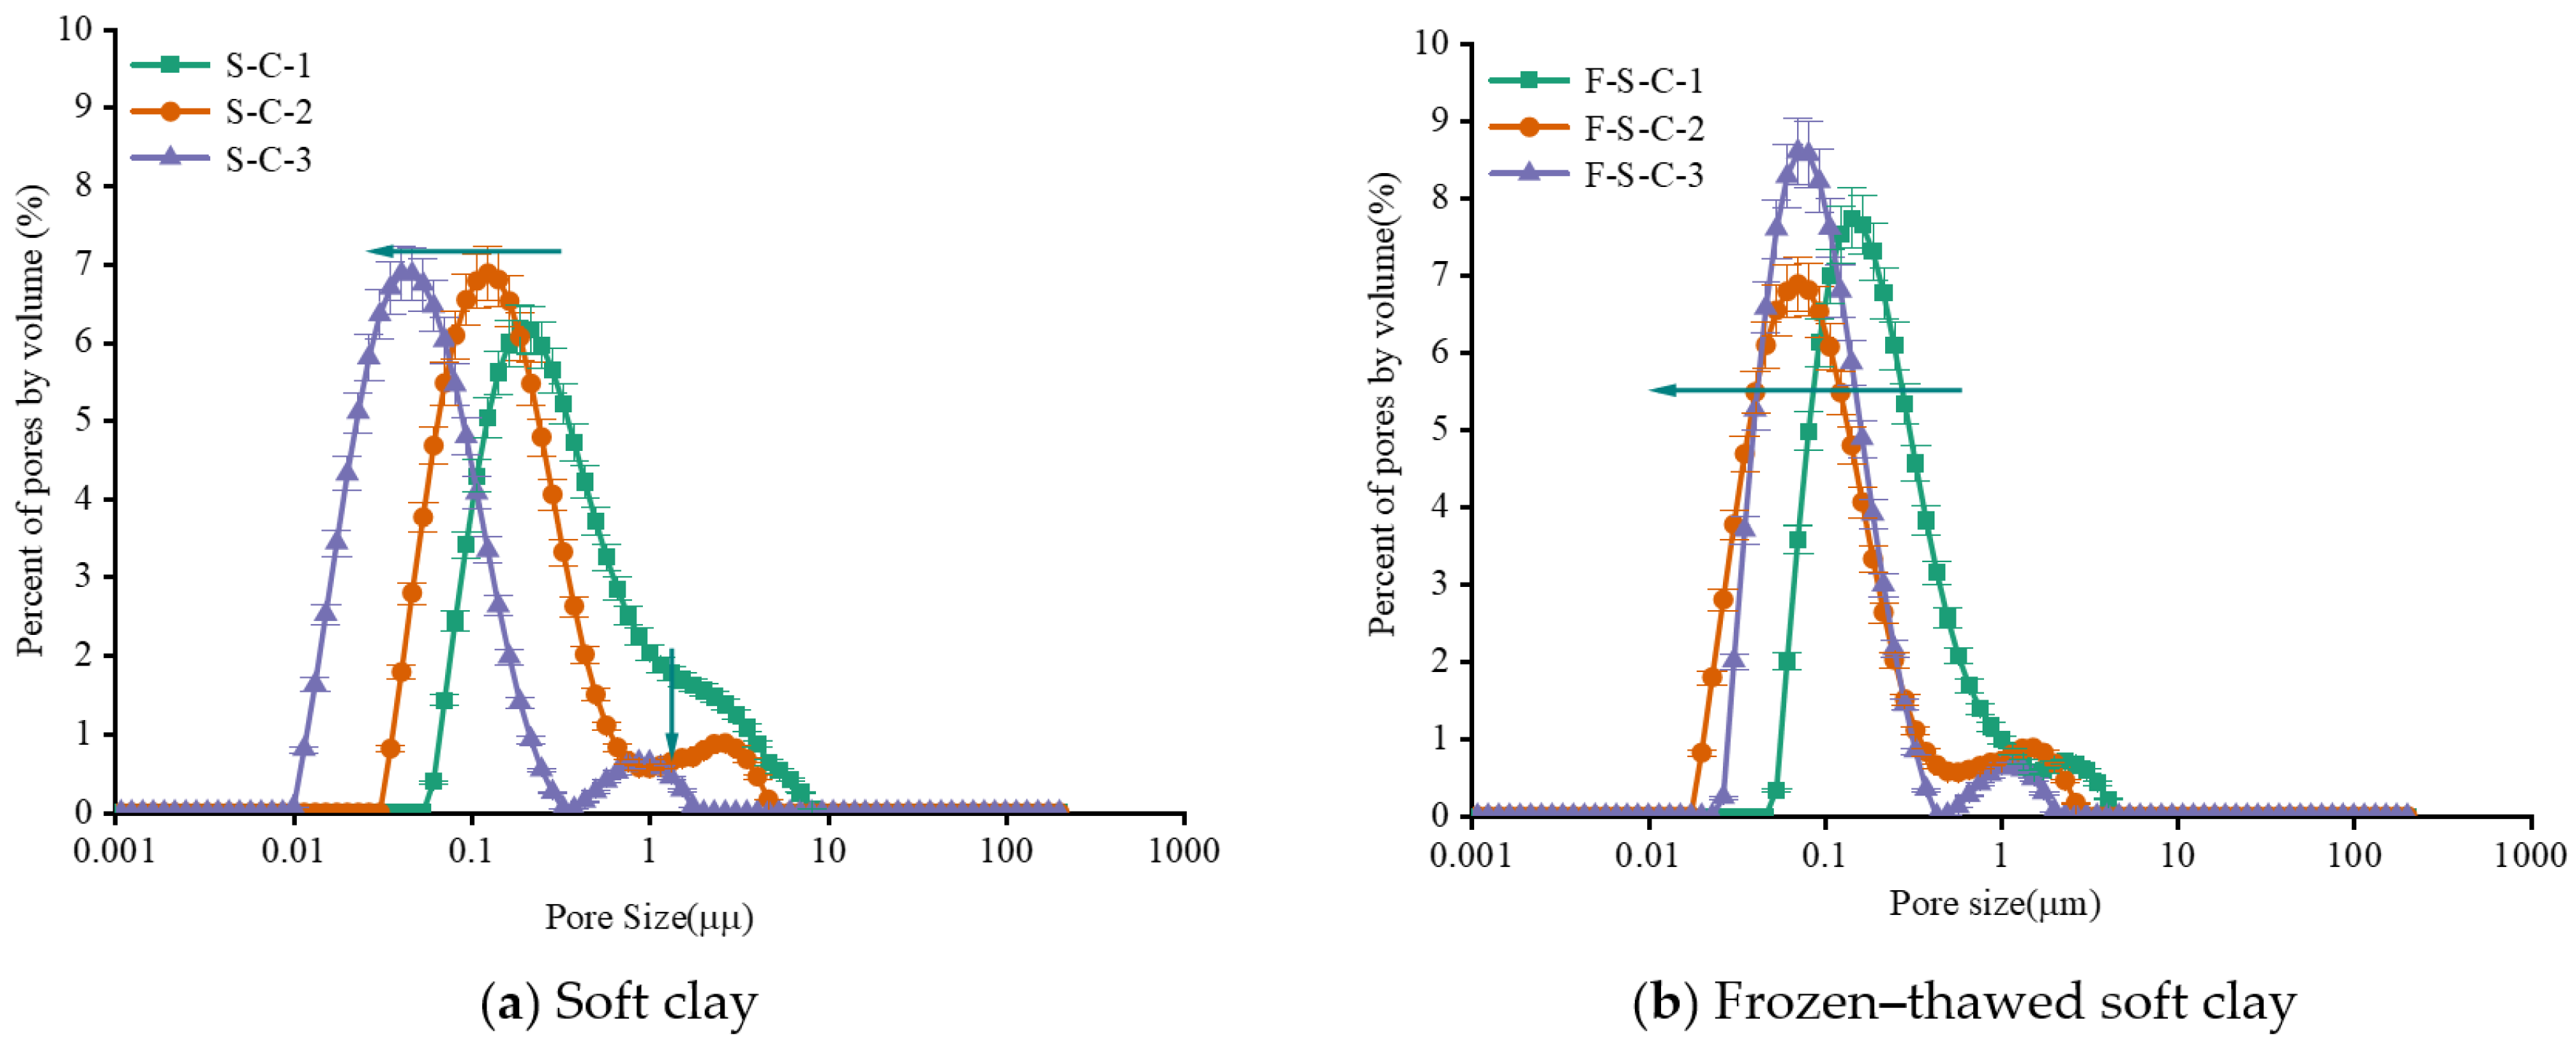
3.2. Pore Size Distribution of Samples

The PSD of soft clay under different λ c was analyzed to explore the structural changes caused by compaction and freeze–thaw cycles, as presented in Figure 4. The λ c significantly affects the pore structure, shifting the PSD curve toward smaller pores as λ c increases. The arrows in the figure indicate the direction of peak pore movement. For example, with a λ c of 0.80, pores are distributed between medium to large pores (1–10 μm) and small pores (0.08–1 μm). However, when the coefficient increases to 0.90, large pores are compressed into micropores (diameter < 0.08 μm), and a more distinct secondary peak emerges. This reflects how higher compaction reduces inter-particle gaps and transforms larger pores into smaller ones, densifying the soil and limiting water migration.
The mechanism behind these transformations lies in the interaction between soil structure, particle arrangement, and freezing processes. During freezing, ice lenses form as water migrates through the pores toward the freezing front, disrupting particle connections and enlarging pores temporarily. Upon thawing, the ice melts, and the particles rearrange, resulting in the collapse of large pores and the creation of numerous micropores. This process significantly alters the pore structure, especially in loosely compacted soils, where large pores are more prevalent initially.
To compare the structure change of soils after freeze–thaw cycle, Figure 5 presented the PSD of two soft clays. It shows that, after a freeze–thaw cycle, the PSD curves remain bimodal but shift toward smaller pores because the medium and large pores are converted into small pores. The increase in small pore volume indicates enhanced densification after freezing and thawing, with fewer pathways for water migration, which could affect the soil’s hydraulic behavior. The comparison across λ c of 0.80, 0.85, and 0.90 confirms that the structural changes are consistent, regardless of the degree of compaction. However, higher λ c mitigates the impact of freeze–thaw cycles by pre-compressing the soil, reducing the potential for pore expansion during freezing. We compared the PSD changes between soft clay and freeze–thawed clay, showing a reduction in large pores (1–10 μm) and an increase in small pores (0.01–0.08 μm) across all compaction levels after freezing and thawing.
These findings have important engineering implications, particularly for construction in seasonally frozen regions. The transformation of large pores into micropores due to freeze–thaw cycles can influence the strength, settlement behavior, and permeability of foundation soils. As compaction increases, the reduced pore size improves soil stability by limiting frost heave and minimizing post-thaw settlement. However, insufficient compaction leaves the soil vulnerable to pore expansion, water migration, and strength loss during freeze–thaw cycles, leading to potential structural instability. Therefore, achieving an optimal λ c (such as 0.85 or 0.90) is critical for mitigating freeze–thaw impacts, balancing construction costs, and ensuring long-term soil stability.

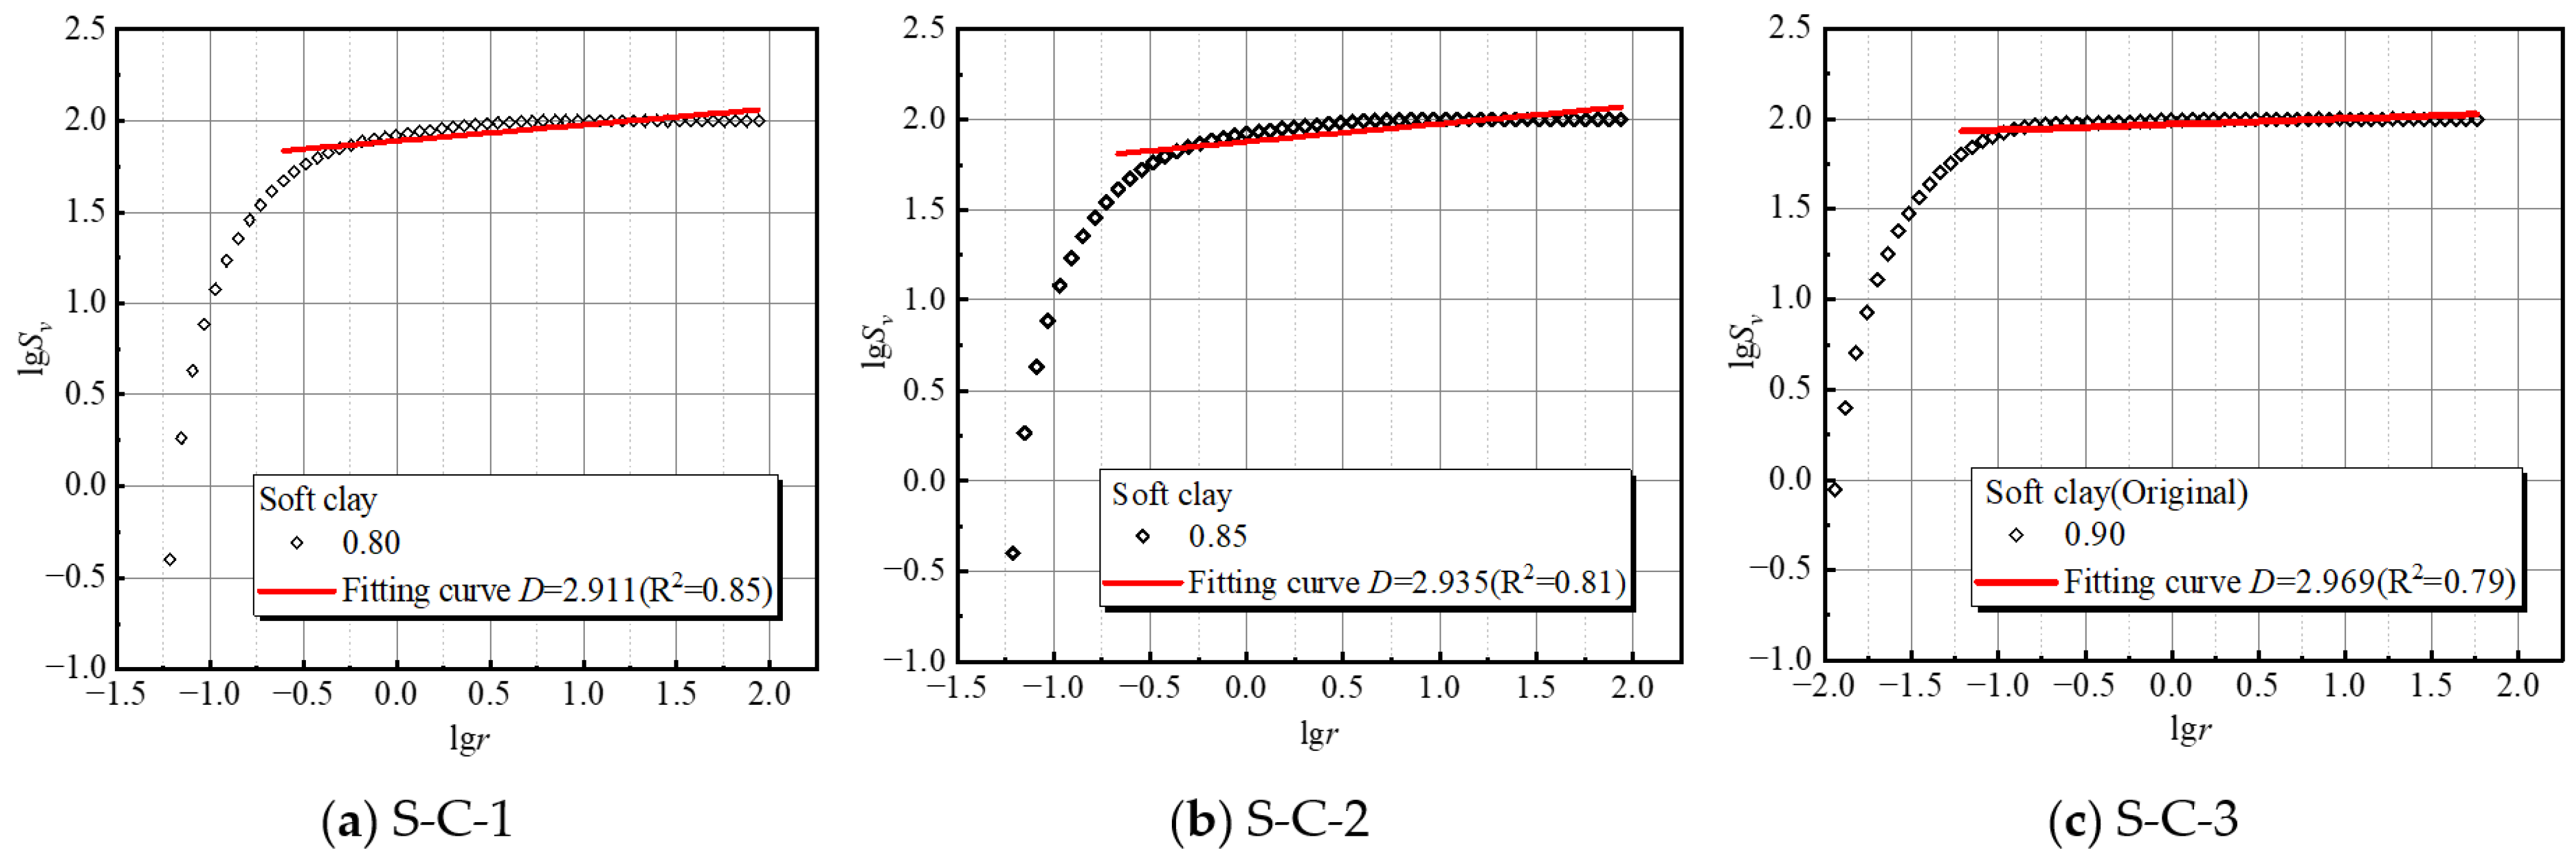
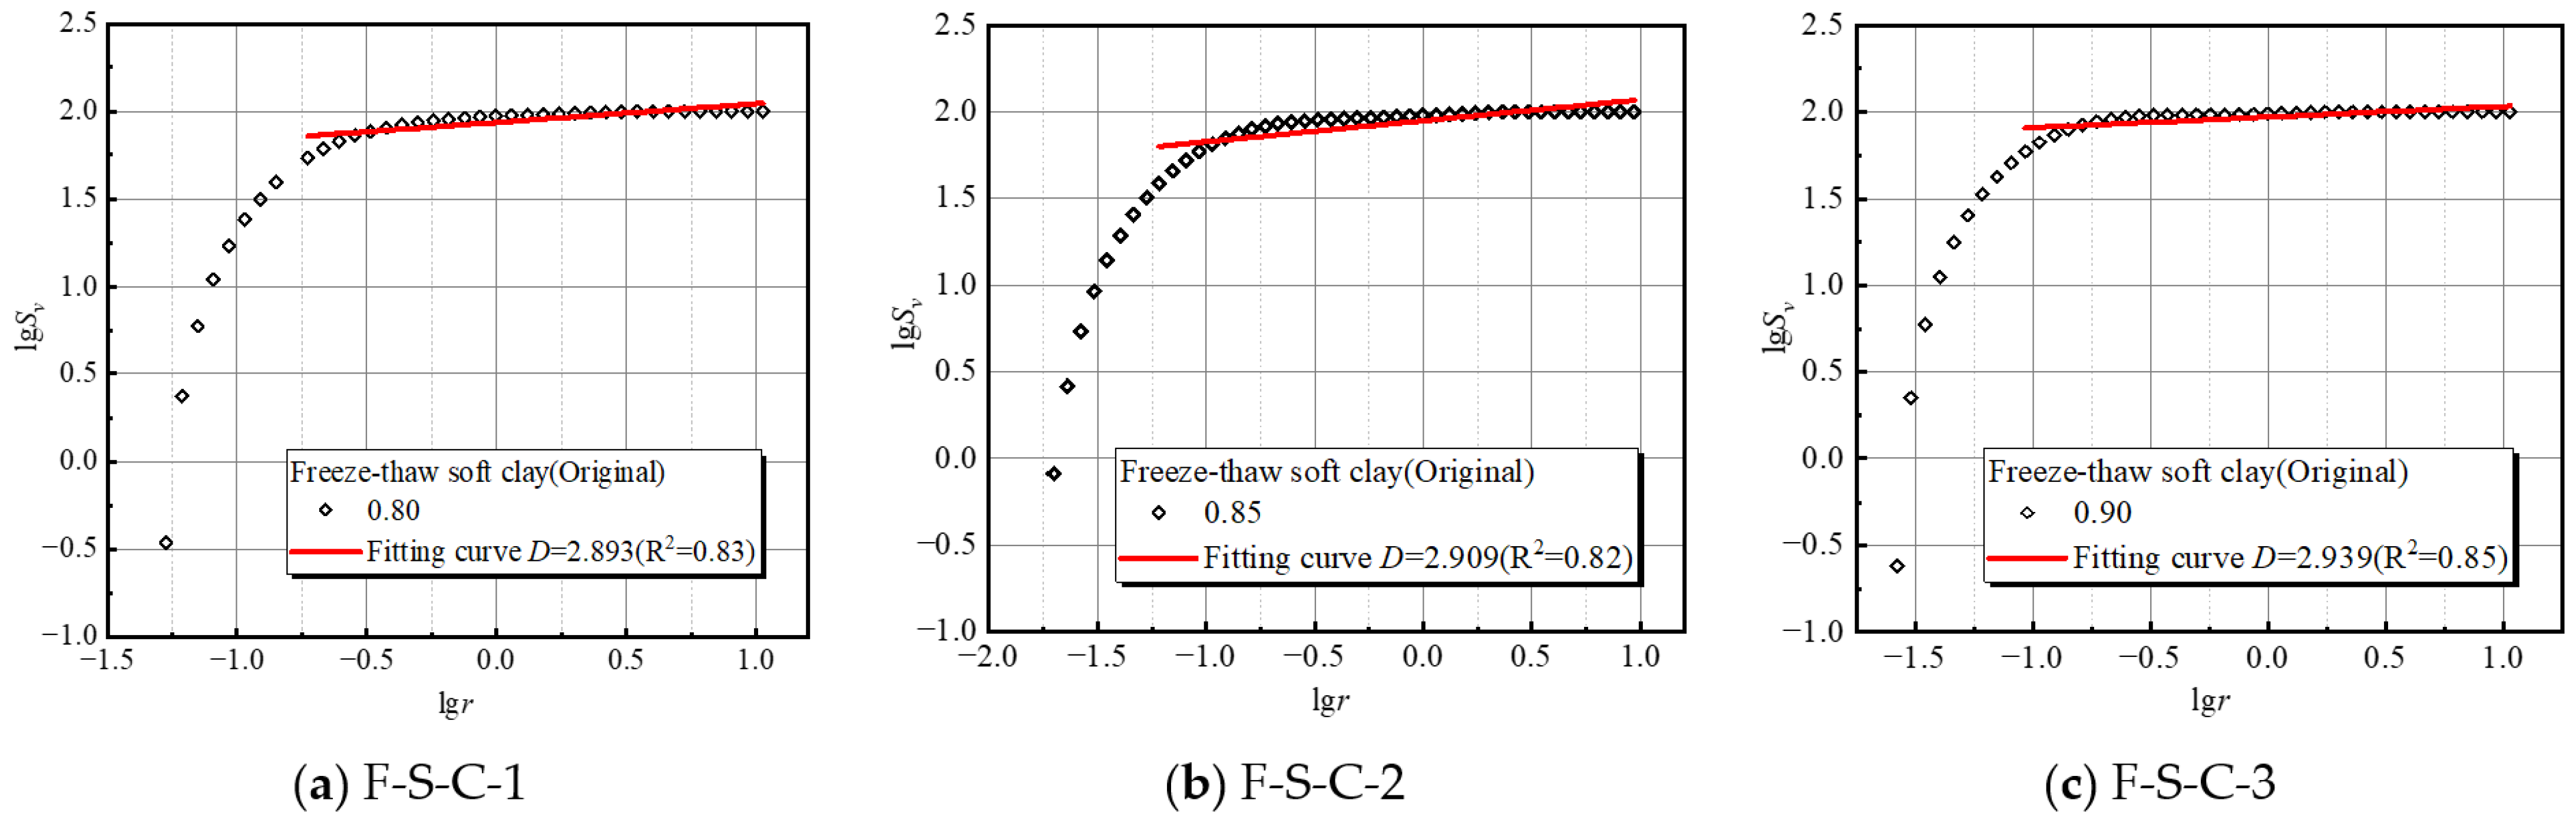
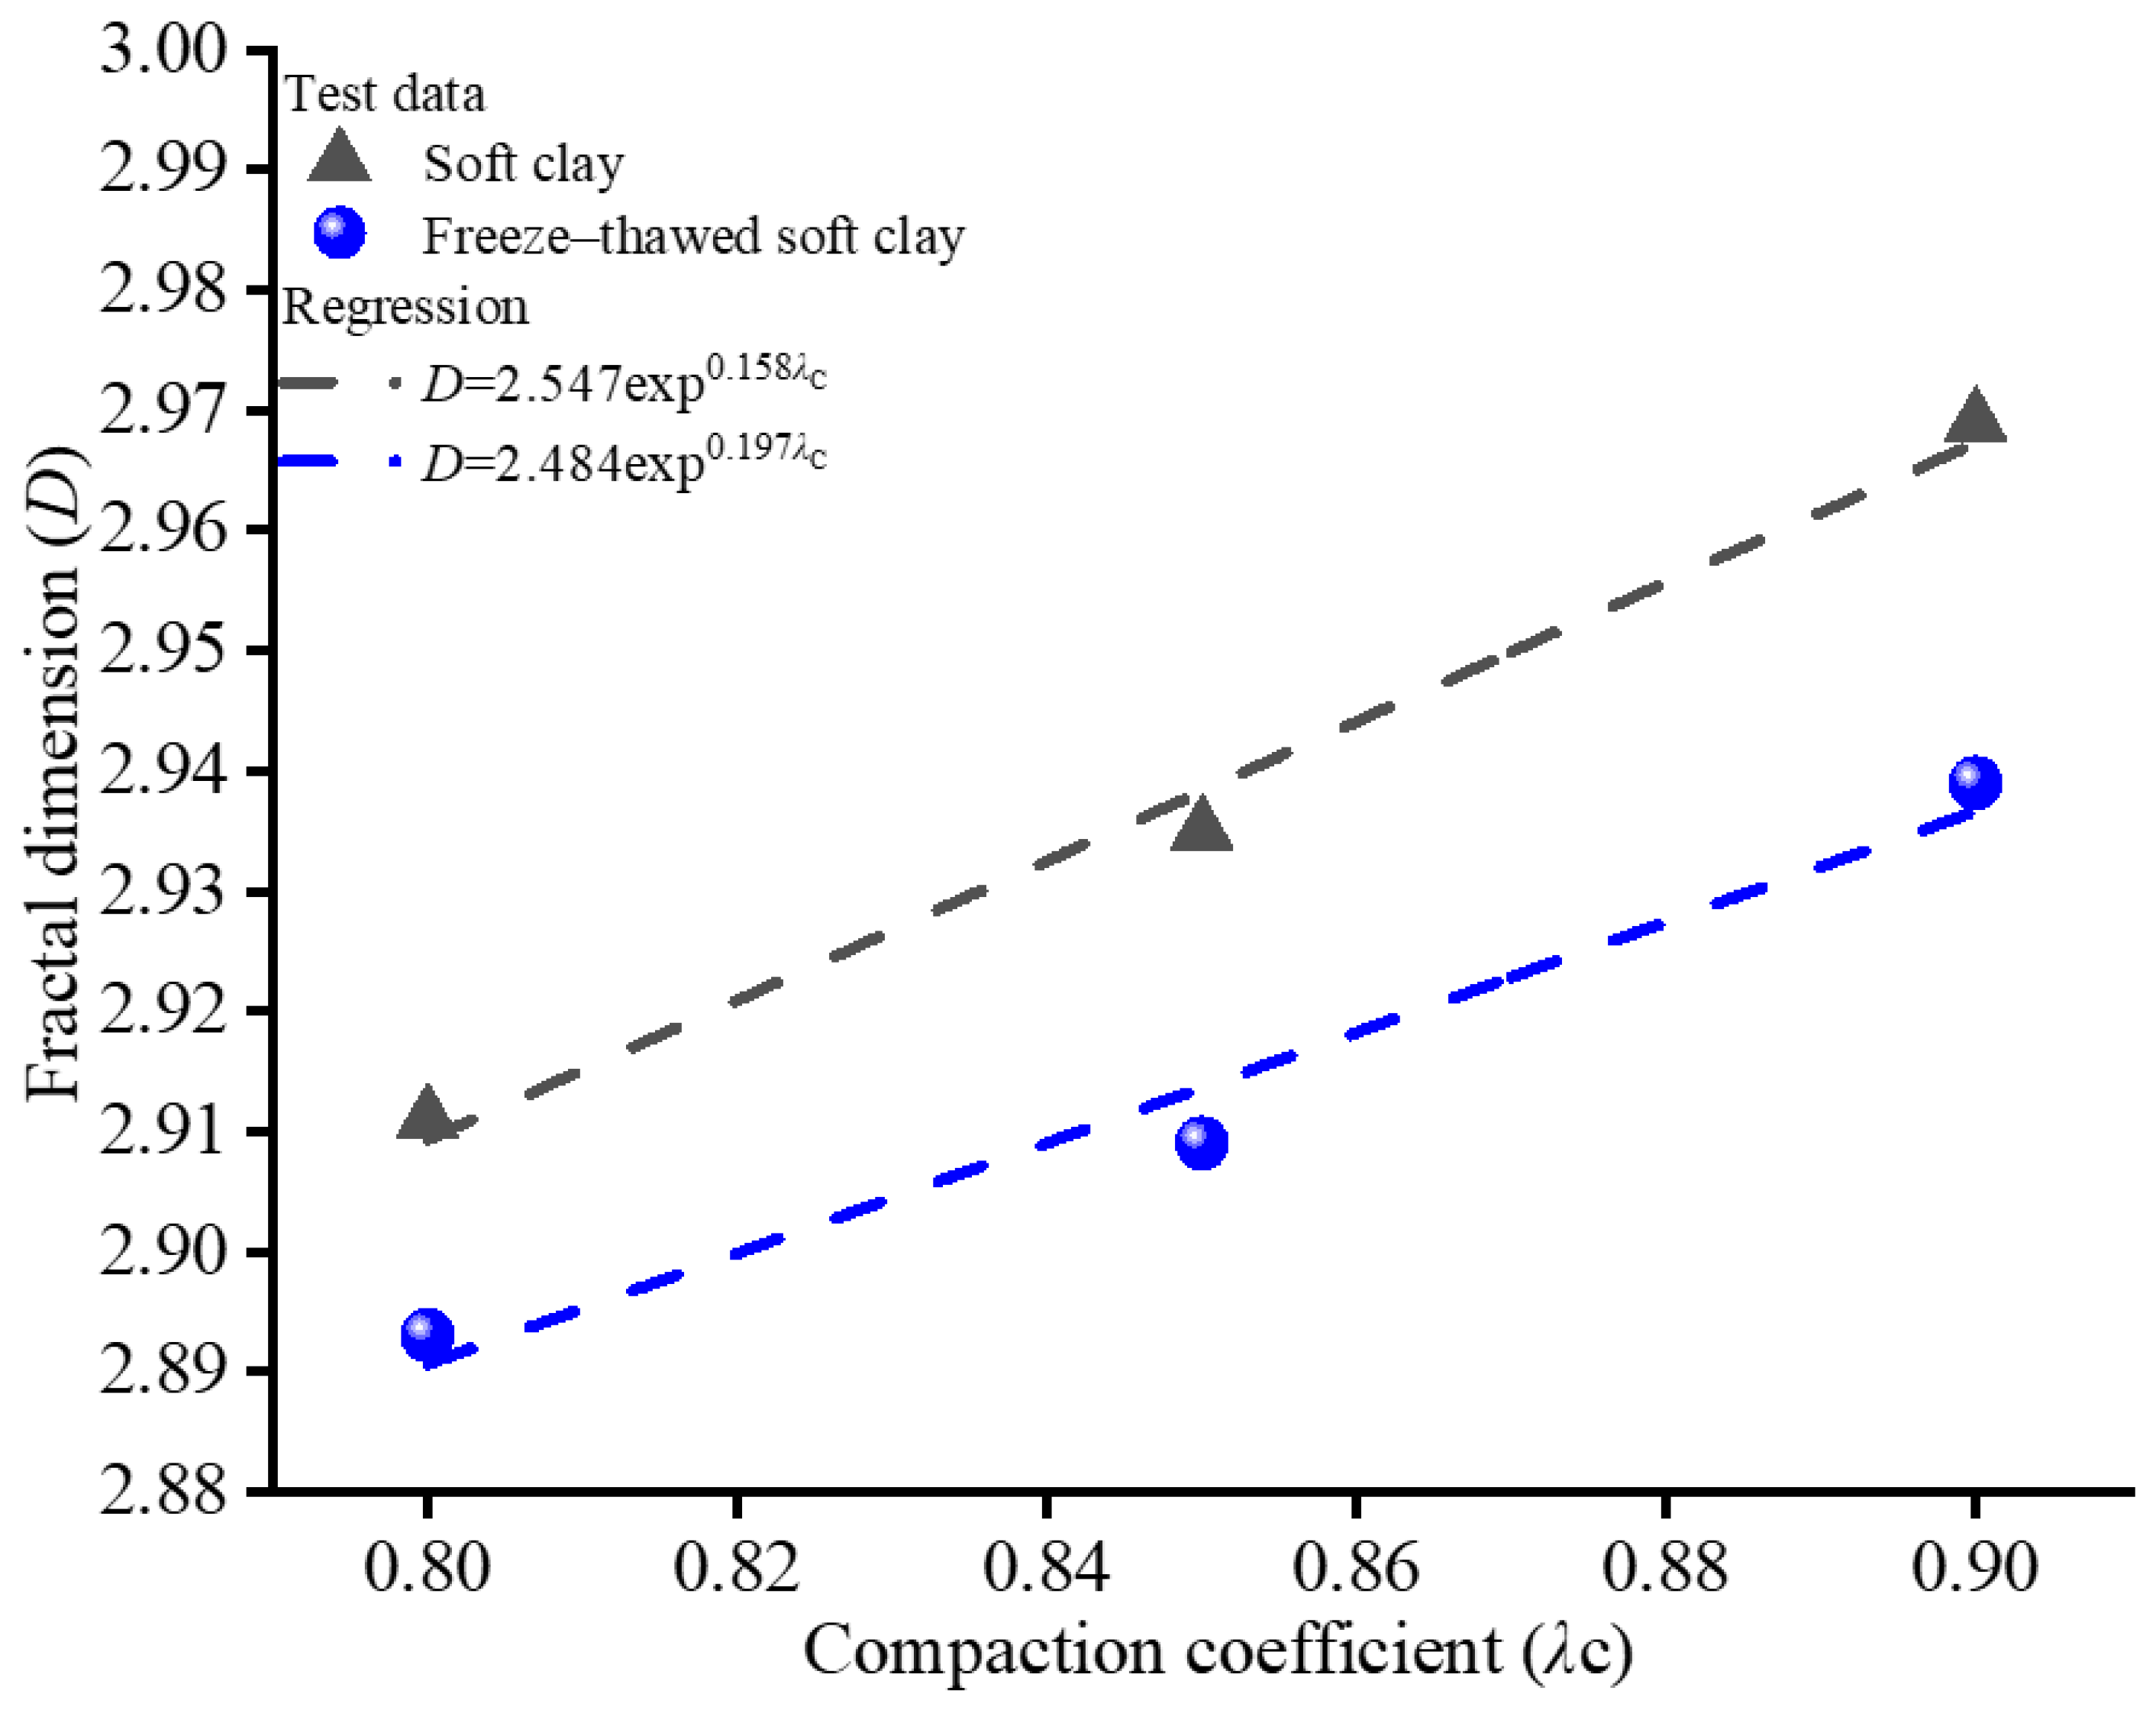
3.3. Fractal Dimension for the Microstructure of Samples

Figure 6 and Figure 7 presented the lg S v lg r curves for soft clay and freeze–thawed soft clay respectively. It was indicated that the PSD and fractal characteristics can be divided into two distinct segments, corresponding to larger pores and smaller pores. Regression analysis based on Equation (23) shows that larger pores exhibit clear fractal behavior, with correlation coefficients (R2) ranging from 0.79 to 0.85 (average 0.82) for soft clay and 0.82 to 0.85 (average 0.83) for freeze–thawed clay, indicating that the fractal characteristics are more prominent in freeze–thawed soils. The D quantifies the complexity of the microstructure, with higher values reflecting greater heterogeneity and a more intricate pore distribution. This analysis provides critical insights into the deformation behavior of soils under cyclic loading and freeze–thaw cycles. A higher D signifies increased complexity in pore structures, which impacts water movement, pore pressure evolution, frost heave, and thaw-induced settlement. The transformation of larger pores into smaller ones during freeze–thaw cycles affects the load-bearing capacity and stability of soils, potentially leading to non-uniform deformation. Thus, fractal analysis helps predict settlement behavior, assess frost heave risks, and guide the design of infrastructure by linking pore structure complexity with deformation potential in seasonally frozen regions.
Figure 8 depicts the relationship that exists between the D and λ c in two soft clays. The findings show that as λ c increases, the D of the soil samples also grows. Dou et al. [35] has highlighted that a higher D indicates more complex pore structures. Thus, a rise in λ c results in a significant increase in D , suggesting greater pore distribution complexity in both clay types.
The D is of utmost significance in dictating the mechanical characteristics of geological materials. Lange et al. [25] utilized fractal theory and image analysis techniques to explore the pore structure of cement, thereby providing valuable insights into its permeability behavior. Recognizing the relevance of D in geological studies, the authors emphasized the need to calculate and predict these values for better analysis of engineering characteristics.
Considering the relationship between λ c and the D for soft clays (refer to Figure 8), along with the increasing complexity of porosity, the following relation was established:
D = α exp β λ c
where α and β represent the coefficients.
The regression analysis results for the soft clays are presented in Table 4. The authors hypothesized that this fitting relationship reflects the fact that the λ c affects the soft clay and freeze–thaw soft clay deformation strains, which in turn affects foundation settlement and stability, and is useful in evaluating foundation settlement in areas of seasonal permafrost.

4. Discussion

(a)
In this study, repeated loading triaxial tests showed a clear initial compression effect of internal pores, leading to rapid axial strain accumulation during the initial loading phase. As cyclic loading continued, the strain accumulation rate significantly reduced after approximately 20 cycles, indicating stabilization. This pattern suggests initial pore compression and rapid pore water pressure build-up followed by partial dissipation, leading to decreased deformation rates as soil density increases.
Following one freeze–thaw cycle at −10 °C, samples exhibited significantly increased axial strain under cyclic loading, often double that of unfrozen samples. This demonstrates a pronounced weakening effect due to freeze–thaw cycles. The cyclic loading response varied distinctly among different compaction levels. Highly compacted samples (0.90 compaction) experienced substantially smaller deformation compared to loosely compacted samples (0.80 compaction), with moderately compacted samples (0.85) showing intermediate behavior. This confirms that initial compaction significantly influences the soil’s resilience against freeze–thaw damage.
(b)
Microstructural changes observed via NMR indicated a significant increase in large pores in loosely compacted soils (0.80) following freeze–thaw cycles. This increase in large pore volume reflects the microstructural disruption caused by ice crystal growth. During freezing, water migrates to freezing fronts, forming ice crystals and ice lenses, which push soil particles apart, creating microcracks and larger voids upon thawing. Such structural changes lead to decreased soil strength and increased plastic strain under cyclic loading. Highly compacted soils showed limited pore expansion, suggesting restricted water migration and reduced ice formation, preserving structural integrity.
(c)
The significance of these results for geotechnical engineering in cold or seasonal permafrost regions is substantial. The marked increase in deformation after even a single freeze–thaw cycle indicates that traditional design approaches using soil properties obtained at ambient temperatures may underestimate deformation and settlement risks.
To mitigate these effects, engineering practices should emphasize increasing initial soil compaction to reduce pore spaces and limit ice formation. This study highlights the importance of achieving higher compaction (around 0.90) for improved long-term stability. Additionally, soil improvement techniques such as incorporating cement or lime stabilizers, improving drainage systems, or employing thermal insulation methods could significantly reduce freeze–thaw damage. Engineers should thus integrate these strategies into design practices to ensure adequate safety margins.

5. Conclusions

In this study, a series of NMR tests and repeated loading triaxial tests were conducted on soft clay to evaluate the permanent deformation characteristic in seasonal permafrost regions when under train-induced dynamic loads. The findings led to the following main conclusions:
(a)
Both freeze–thawed and unfrozen soils exhibit significant compaction effects under cyclic loading, with rapid increases in axial strain and pore water pressure during the initial cycles. After approximately 20 cycles, the soil structure becomes denser, leading to slower changes and stabilization. Freeze–thawed soils show higher strain and pore water pressure compared to unfrozen soils, reflecting the weakening effect of the freeze–thaw process.
(b)
Higher λ c significantly reduces the strain accumulation rate and the development of pore water pressure, with strain decreasing by approximately 50%. It also optimizes the PSD by reducing large pores and increasing small and medium pores. At the microscopic level, higher λ c limits water migration and ice lens formation during freezing, maintaining soil stability and deformation resistance.
(c)
The freeze–thaw effect disrupts the soil’s microscopic pore structure, collapsing large pores into smaller ones, weakening inter-particle connections, and reducing soil strength. Higher λ c promotes the formation of a more complex and uniform pore structure, increases the D , and enhances soil structural complexity and deformation resistance. These findings provide theoretical support for infrastructure construction in seasonal permafrost regions.
(d)
Adopting higher compaction coefficients in engineering construction can reduce the strain and pore water pressure caused by freezing and thawing and improve the deformation resistance of the foundation. At the same time, it can also reduce the proportion of large pores and optimize it to small and medium pore structure, reducing the risk of freezing and expansion. Simulating cyclic loading at the early stage of construction can accelerate the densification of soil structure and optimize the pore structure. D can be used in engineering acceptance to provide a microscopic basis for the compaction effect and deformation resistance of the project.
This study demonstrates how cyclic loading and freeze–thaw effect distinctly affect soil stability and deformation by experiments and microscopic evaluation. The future work will focus on investigating the cumulative effects of multiple freeze–thaw cycles coupled with varying compaction coefficients to assess long-term pore structure resilience and validate the sustainability of optimal compaction thresholds under repeated frost action. Then, it will seek to develop multiscale predictive models integrating fractal parameters and NMR-derived pore data with machine learning to enable real-time settlement forecasting.

Author Contributions

M.S.: project administration, funding acquisition, methodology, and supervision. Z.H.: data curation, investigation, writing—original draft, and writing—review and editing. Z.L.: investigation, writing—original draft, and writing—review and editing. G.L.: supervision, writing—original draft, and writing—review and editing. C.H.: resources. J.L.: formal analysis. All authors have read and agreed to the published version of the manuscript.

Funding

This research was supported by Zhejiang Provincial Natural Science Foundation of China under Grant No. LTGG23E080002.

Data Availability Statement

The data are available from the corresponding author on request.

Conflicts of Interest

The authors declare no conflicts of interest.

References

  1. Wang, S.J.; Niu, F.J.; Chen, J.B.; Dong, Y.H. Permafrost research in China related to express highway construction. Permafr. Periglac. Process. 2020, 31, 406–416. [Google Scholar] [CrossRef]
  2. Liu, F.R.; Ma, W.; Zhou, Z.W.; Wen, Z.; Mu, Y.H.; Shen, M.D.; He, P.F. Dynamic behaviors of frozen silt under repeated traffic loading. Road Mater. Pavement Des. 2024, 25, 1068–1089. [Google Scholar] [CrossRef]
  3. Zhang, C.Y.; Zhao, Y.D.; Zhang, R.R.; Zheng, Y.L. Research on the Influence of Water Vapor Diffusion and Evaporation on Water and Heat Transfer in Frozen Soil. Eurasian Soil Sci. 2018, 51, 1240–1251. [Google Scholar] [CrossRef]
  4. Gao, L.; Luo, L.; Lu, D.; Wei, B.; Nan, L.W.H. Dynamic Response of Railway Subgrade Under Train Load and Freeze–Thaw Action. Appl. Sci. 2025, 15, 1735. [Google Scholar] [CrossRef]
  5. Lei, H.; Song, Y.; Qi, Z.; Liu, J.; Liu, X. Accumulative plastic strain behaviors and microscopic structural characters of artificially freeze-thaw soft clay under dynamic cyclic loading. Cold Reg. Sci. Technol. 2019, 168, 102895. [Google Scholar] [CrossRef]
  6. Tovey, N.K.; Krinsley, D.H. Mapping of the orientation of fine-grained mineral in soils and sediments. Bull. Int. Assoc. Eng. Geol. 1992, 46, 93–101. [Google Scholar] [CrossRef]
  7. Liang, B.; Zhang, G.S.; Liu, D.R. Experimental study on thawing subsidence characters of permafrost under frost heaving and thawing circulation. Chin. J. Geotech. Eng. 2006, 28, 1213–1217. [Google Scholar] [CrossRef]
  8. Li, T.; Kong, L.; Guo, A. The deformation and microstructure characteristics of expansive soil under freeze–thaw cycles with loads. Cold Reg. Sci. Technol. 2021, 192, 103393. [Google Scholar] [CrossRef]
  9. Tang, Y.Q.; Yan, J.J. Effect of freeze–thaw on hydraulic conductivity and microstructure of soft soil in shanghai area. Environ. Earth Sci. 2015, 73, 7679–7690. [Google Scholar] [CrossRef]
  10. Jia, J.; Xie, X.; Yang, K. Soil microstructure evolution and macro deformation mechanism for controlling construction disturbance in Shanghai soft soil. J. Shanghai Jiaotong Univ. Sci. 2016, 21, 713–718. [Google Scholar] [CrossRef]
  11. Tovey, N.K. A digital computer technique for orientation analysis of micro-graphs of soil fabric. J. Microsc. 1980, 120, 303–315. [Google Scholar] [CrossRef]
  12. Di Remigio, G.; Rocchi, I.; Zania, V. Scanning Electron Microscopy and clay geomaterials: From sample preparation to fabric orientation quantification. Appl. Clay Sci. 2021, 214, 106249. [Google Scholar] [CrossRef]
  13. Tang, Y.; Sun, K.; Zhang, X.; Zhou, J.; Yang, Q.; Liu, Q. Microstructure changes of red clay during its loss and leakage in the karst rocky desertification area. Environ. Earth Sci. 2016, 75, 537. [Google Scholar] [CrossRef]
  14. Sun, M.M.; Yu, J.G.; Ding, Z.; He, S.H. Numerical Model about the Influence of Cyclic Load on the Hydraulic Conductivity of Soft Clay. KSCE J. Civ. Eng. 2021, 25, 4159–4172. [Google Scholar] [CrossRef]
  15. Kong, L.; Wang, Y.; Sun, W.; Qi, J. Influence of plasticity on unfrozen water content of frozen soils as determined by nuclear magnetic resonance. Cold Reg. Sci. Technol. 2020, 172, 102993. [Google Scholar] [CrossRef]
  16. Maheshwari, P.; Pujari, P.K.; Sharma, S.K.; Dutta, D.; Sudarshan, K.; Mithu, V.S.; Madhu, P.K.; Deshpande, S.K.; Patil, P.N.; Raje, N. Phase transition of nanoconfined water in clay: Positron annihilation, nuclear magnetic resonance, and dielectric relaxation Studies. J. Phys. Chem. C 2013, 117, 14313–14324. [Google Scholar] [CrossRef]
  17. Mardani-Aghabaglou, A.; Kalıpcılar, İ.; İnan Sezer, G.; Sezer, A.; Altun, S. Freeze–thaw resistance and chloride-ion penetration of cement-stabilized clay exposed to sulfate attack. Appl. Clay Sci. 2015, 115, 179–188. [Google Scholar] [CrossRef]
  18. Bird, N.R.A.; Preston, A.R.; Randall, E.W.; Whalley, W.R.; Whitmore, A.P. Measurement of the size distribution of water-filled pores at different matric potentials by stray field nuclear magnetic resonance. Eur. J. Soil Sci. 2005, 56, 135–143. [Google Scholar] [CrossRef]
  19. Webber, J.B.W.; Corbett, P.; Semple, K.T.; Ogbonnaya, U.; Teel, W.S.; Masiello, C.A.; Fisher, Q.J.; Valenza, J.J.; Song, Y.-Q.; Hu, Q. An NMR study of porous rock and biochar containing organic material. Microporous Mesoporous Mater. 2013, 178, 94–98. [Google Scholar] [CrossRef]
  20. Bragg, R.A.; Andersland, O.B. Strain rate, temperature, and sample size effects on compression and tensile properties of frozen sand. Eng. Geol. 1981, 18, 35–46. [Google Scholar] [CrossRef]
  21. Fei, W.; Yang, Z.J. Modeling unconfined compression behavior of frozen Fairbanks silt considering effects of temperature, strain rate and dry density. Cold Reg. Sci. Technol. 2019, 158, 252–263. [Google Scholar] [CrossRef]
  22. Girgis, N.; Li, B.; Akhtar, S.; Courcelles, B. Experimental study of rate-dependent uniaxial compressive behaviors of two artificial frozen sandy clay soils. Cold Reg. Sci. Technol. 2020, 180, 103166. [Google Scholar] [CrossRef]
  23. Mandelbrot, B.B. The fractal geometry of nature. Am. J. Phys. 1998, 51, 468. [Google Scholar] [CrossRef]
  24. Tyler, S.W.; Wheatcraft, S.W. Application of fractal mathematics to soil water retention estimation. Soil Sci. Soc. Am. J. 1989, 53, 987–996. [Google Scholar] [CrossRef]
  25. Lange, D.A.; Jennings, H.M.; Shah, S.P. Image analysis techniques for characterization of pore structure of cement-based materials. Cem. Concr. Res. 1994, 24, 841–853. [Google Scholar] [CrossRef]
  26. Noh, J.H.; Lee, S.R.; Park, H. Prediction of cryo-swcc during freezing based on pore-size distribution. Int. J. Geomech. 2012, 12, 428–438. [Google Scholar] [CrossRef]
  27. Khoshghalb, A.; Pasha, A.Y.; Khalili, N. A fractal model for volume change dependency of the water retention curve. Geotechnique 2015, 65, 1–6. [Google Scholar] [CrossRef]
  28. ASTM D4318; Standard Test Methods for Liquid Limit, Plastic Limit and Plasticity Index of Soils. ASTM: West Conshohocken, PA, USA, 2017.
  29. ASTM D421-85; Practice for Dry Preparation of Soil Samples for Particle-Size Analysis and Determination of Soil. ASTM: West Conshohocken, PA, USA, 2007.
  30. Lai, J.; Wang, G.; Wang, Z.; Chen, J.; Pang, X.; Wang, S.; Zhou, Z.; He, Z.; Qin, Z.; Fan, X. A review on pore structure characterization in tight sandstones. Earth-Sci. Rev. 2018, 177, 436–457. [Google Scholar] [CrossRef]
  31. Yu, J.; Sun, M.; He, S.; Huang, X.; Wu, X.; Liu, L. Accumulative deformation characteristics and microstructure of saturated soft clay under cross-river subway loading. Materials 2021, 14, 537. [Google Scholar] [CrossRef]
  32. Tian, H.; Wei, C.; Wei, H.; Yan, R.; Chen, P. An NMR-based analysis of soil-water characteristics. Appl. Magn. Reson. 2014, 45, 49–61. [Google Scholar] [CrossRef]
  33. Mandelbrot, B.B.; Passoja, D.E.; Paullay, A.J. Fractal character of fracture surfaces of metals. Nature 1984, 308, 721–722. [Google Scholar] [CrossRef]
  34. Avnir, D.; Farin, D.; Pfeifer, P. Chemistry in noninteger dimensions between two and three. II. fractal surfaces of adsorbents. J. Chem. Phys. 1983, 79, 3566–3571. [Google Scholar] [CrossRef]
  35. Dou, W.; Liu, L.; Jia, L.; Xu, Z.; Wang, M.; Du, C. Pore structure, fractal characteristics and permeability prediction of tight sandstones: A case study from Yanchang Formation, Ordos Basin, China. Mar. Pet. Geol. 2021, 123, 104737. [Google Scholar] [CrossRef]
Figure 1. Test materials.
Fractalfract 09 00214 g001
Figure 2. Test specimens. (a) Saturated specimen; (b) Freeze–thawed specimen; (c) Specimen after mounting on triaxial test system.
Fractalfract 09 00214 g002
Figure 3. Relationship between axial strain, pore pressure, and number of vibrations.
Fractalfract 09 00214 g003aFractalfract 09 00214 g003b
Figure 4. PSD of soft clay under different λ c .
Fractalfract 09 00214 g004
Figure 5. Comparison for the PSD of soils before and after freeze–thaw cycle.
Fractalfract 09 00214 g005
Figure 6. Estimation of D for soft clay with varying λ c .
Fractalfract 09 00214 g006
Figure 7. Estimation of D for freeze–thawed soft clay under varying λ c conditions.
Fractalfract 09 00214 g007
Figure 8. Fractal dimension D of clays at various compaction coefficient λ c levels.
Fractalfract 09 00214 g008
Table 1. Basic physical parameters of the test soft clay.
PropertiesValues
Natural water content (w)27.8%
Specific gravity (Gs)2.71
Natural void ratio (e)0.82
Liquid limit (WL)28
Plastic limit (WP)20
Table 2. Testing plan.
NO.MaterialsNumber of Freeze–Thaw Cycles λ c
S-C-1Soft clay00.80
S-C-20.85
S-C-30.90
F-S-C-1Freeze–thawed soft clay10.80
F-S-C-20.85
F-S-C-30.90
Table 3. Test procedures for triaxial loading tests.
Experimental StageRadial Pressure/kPaBack Pressure/kPaTime/min
Back pressure saturation I2006
Back pressure saturation II620600200
B(Saturation index)-check6706001 (B to 0.97 in 1 min)
Consolidation I70065090
Consolidation II750650Continuing until the pore pressure has completely dissipated
Cyclic loadingAmplitude: 20 kPa, static bias stress: 20 kPa, frequency: 1 Hz.
Loading control: displacement control; abort condition: cyclic loading times are loaded or strain exceeds 30%.
Table 4. Model parameters for test clays.
ParameterSoft ClayFreeze–Thawed Soft ClayR2
α2.5472.4840.98
β0.1580.1970.94
Disclaimer/Publisher’s Note: The statements, opinions and data contained in all publications are solely those of the individual author(s) and contributor(s) and not of MDPI and/or the editor(s). MDPI and/or the editor(s) disclaim responsibility for any injury to people or property resulting from any ideas, methods, instructions or products referred to in the content.

