Abstract
This paper proposes a method for searching for pipeline leaks by analyzing the Hurst exponent of acoustic signals. The investigations conducted on the laboratory setup and the current pipelines of the water supply system. During the experiments, through defects of the round shape-type pipeline with diameters from 1 to 5 mm were modeled. For calculating Hurst exponent, rescaled range analysis (R/S analysis), and detrended fluctuation analysis (DFA) were used. The research results have shown that pipeline leaks are reliably detected by analyzing the Hurst exponent of acoustic signals. The signals of a defect-free pipeline are close to the level of a deterministic signal. When a leak occurs in a pipeline, the Hurst exponent decreases. Pipeline fluctuations are anti-persistent nature. It is shown that a change in the size of the through hole in the pipeline wall does not have a significant effect on the value of the Hurst exponent of acoustic signals. These results are explained by using spectral analysis and CFD modeling (Computational Fluid Dynamics modeling) methods in the Ansys Fluent software (v. 19.2). It has been established that the spectral components that contribute most to the fractal structure of signals are concentrated within the frequency range from 0 to 2 kHz.
1. Introduction
Leaks are a serious problem for pipeline systems. Timely detection of leaks is critically important in order to increase the reliability and efficiency of their operation. Monitoring devices are used to pre-detect a defective pipeline branch in a complex, branched system.
Of the wide variety of leak detection methods, the acoustic method can be distinguished, which is widely used to search for defects in water supply systems, heating networks, gas pipelines, etc. It is based on the registration of acoustic waves that propagate through the pipeline. The principle of operation of such a leak monitoring system is shown in Figure 1. Accelerometers can be used as acoustic sensors, which are mounted on the outer surface of the pipeline. Analog signals from the sensors are converted to digital form and analyzed using various methods.
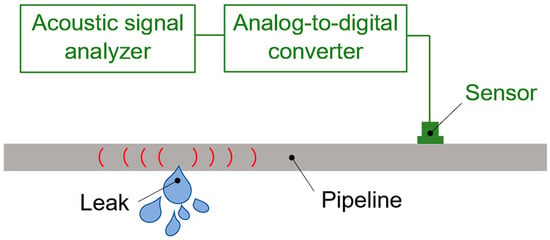
Figure 1.
The principle of operation of a leak monitoring system.
Most acoustic leak detection methods in pipelines rely on spectral analysis. Recently, wavelet analysis [1,2], Hilbert–Huang transform [3], and neural network technologies [4,5,6,7] have been used. However, despite their widespread use, these methods have their limitations. Spectral analysis assumes that the signal is stationary, so its results may be distorted in the presence of non-stationary components. The wavelet analysis is more adaptable to temporary changes in the signal, but its quality largely depends on the correct choice of the basis function and the optimal level of decomposition. This is a rather difficult task, which significantly affects the results of the analysis. The disadvantages of the Hilbert–Huang transformation include the difficulty of selecting parameters in the empirical mode decomposition (EMD) algorithm and interpreting the results, as well as the need for large computational resources. Neural networks require even more computing power. Their effectiveness strongly depends on the quality and volume of the training data. Accordingly, the task of finding an effective and simple method for data processing and analysis in acoustic control of pipelines remains relevant.
The fractal theory developed by Benoit Mandelbrot is a powerful tool for analyzing, processing, and classifying data, especially when it comes to complex, irregular, and self-organizing structures. Fractal analysis is widely used in a wide variety of fields: cartography [8,9], computer graphics [10,11], natural sciences [12,13,14,15], economics [16], medicine [17,18,19], and other fields [20,21,22].
Acoustic signals of pipelines, like many natural phenomena, can also demonstrate self-similarity at various time intervals. In the present paper, it is proposed to use fractal analysis to identify complex patterns in acoustic signals that may be associated with leaks in the pipeline system.
The article has the following structure:
- Section 2 presents algorithms for fractal analysis of acoustic signals;
- Section 3 describes the experimental setup and the methodology of laboratory research;
- Section 4 presents the results of laboratory investigations and their interpretation using spectral analysis and CFD modeling methods;
- Section 5 discusses the effect of filtering acoustic pipeline signals on the Hurst exponent;
- Section 6 presents a methodology for conducting experiments on the current pipelines of the water supply system and discusses their results;
- In the conclusion, the key findings of this investigation are presented.
2. Methods of Fractal Signal Analysis
Fractal time series analysis as a rule connected with the calculation of the Hurst exponent H, which is related to the fractal dimension D as follows:
H = 2 – D.
If H = 0.5, the investigated process is considered stochastic (this value of H corresponds to Brownian motion).
H = 0.5–1 means a persistent process characterized by long-term memory (when subsequent exponent strongly depends on the past ones).
With a value of H = 0–0.5, the process is considered to be anti-persistent. This indicates that the system is characterized by frequent but small changes. We can say that the higher the Hurst exponent, the fewer kinks there are in the time series.
Most often, the methods of rescaled range analysis (R/S analysis) and detrended fluctuation analysis (DFA) are used to estimate H. Table 1 provides a brief comparison of these methods.

Table 1.
Comparison of R/S analysis and DFA methods.
In practice, estimating the Hurst exponent is a difficult task. The results of the H assessment obtained by different methods may differ. Since the true values H of acoustic signals from pipelines are a priori unknown, two independent and reliable methods (R/S analysis and DFA) were used to establish and analyze dependencies, each with its own characteristics.
2.1. Rescaled Range Analysis (R/S Analysis)
The R/S analysis was developed by H.E. Hurst to solve problems related to water resource accumulation [23,24], and it was further developed in the works of B. Mandelbrot [25,26,27]. Currently, rescaled range analysis is the most well-known method of fractal analysis. It is widely used in the investigation of financial market dynamics [28,29], seismic data research [30], for the analysis of cardiac time series [31], etc.
The idea of R/S analysis is that there is a power dependence of the form
where R—the range of variation (variation in an indicator is understood as its accumulated deviation from the average value), S—the standard deviation of the indicator, δ—the number of indicator values in the group, and c—the constant.
The following algorithm is used for R/S analysis.
- A series x(t) is divided into N groups by δ elements.
- For each i-th group (i = 1, 2, …, N) the following are calculated:
- (1)
- the average value of ;
- (2)
- accumulated deviations from the mean , forming N series ;
- (3)
- range ;
- (4)
- rescaled range .
After that, the obtained N values of R/S are averaged. Such calculations are performed for different values of δ.
- 3.
- The Hurst exponent H is defined as the coefficient at an independent variable in the linear regression equation , where c—the free term.
2.2. Detrended Fluctuation Analysis (DFA)
Detrended fluctuation analysis is proposed by C.-K. Peng et al. [32]. DFA is widely used in the fractal analysis of financial series [33,34], biomedical signals [35], vibration of machine parts [36], etc.
The DFA algorithm includes the following steps:
- For the time series x(t) a cumulative series y(t), is constructed, each term of which is calculated using the formula , where —the average value of x(t).
- Next, the series y(t) is divided into N segments of length δ. A fluctuation function is calculated for each segment:where Ym(t)—the local m- polynomial trend within a given segment (i.e., the value of the trend function at point t).
The degree of the approximation polynomial determines the order of the method. For example, the DFA-1—assumes subtraction of linear trend, and the DFA-2—quadratic trend, etc. The DFA-1 method was used in this work to analyze acoustic signals. The effect of the order of the approximating polynomial on the results of calculating the Hurst exponent of acoustic leakage signals is discussed in more detail in the article [37].
- 3.
- Then, the N-obtained functions F(δ) are averaged. Such calculations are repeated for different values of δ.
- 4.
- For self-similar processes, there is a power dependence:
The Hurst exponent H is defined as the coefficient at an independent variable in the linear regression equation , where b—the free term.
3. Laboratory Experiments
The structural diagram of the experimental setup is shown in Figure 2.
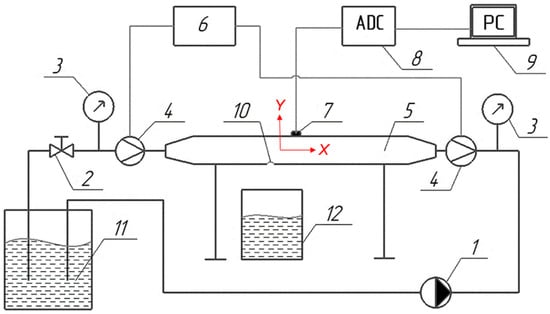
Figure 2.
The scheme of the experimental setup: 1—pumping station MAC550 (LEO, China); 2—valve, 3—manometer, 4—electromagnetic flow meter ERSV-410 (Vzljot, Russia); 5—pipeline; 6—measuring unit of flow meter TSRV-022 (Vzljot, Russia); 7—vibration acceleration sensor AP2038P-1000 (GlobalTest, Russia); 8—analog-to-digital converter ZET 030 (ZETLAB, Russia); 9—PC; 10—defect; 11—water storage capacity; 12—drain container.
The experimental setup consists of a closed loop in which water circulates. Pumping station (1) is equipped with a frequency-controlled drive. The valve (2) is designed to set the hydraulic resistance, which is required for the operation of the pumping station. Pressure gauges (3) and electromagnetic flow meters (4) are installed at the inlet and outlet of the pipeline (5). To register the acoustic signals of the pipeline (5), a three-component vibration acceleration sensor (7) is used. It has the following specifications: axial sensitivity of 1000 mV/g; natural frequency of 35 kHz. The sampling frequency of the analog-to-digital converter (8) is 50 kHz. During the experiments, acoustic signals were simultaneously recorded in the longitudinal and radial directions relative to the axis of the pipeline (respectively, the X and Y axes in Figure 2).
Experimental investigations were carried out on a pipeline with an external diameter of 89 mm, a wall thickness of 3.5 mm, and a length of 2 m (Figure 3).
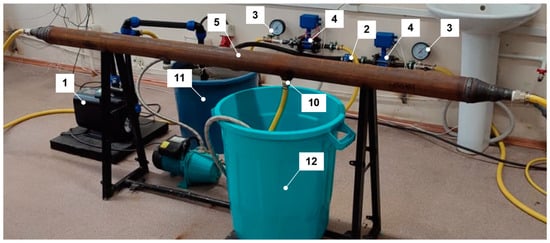
Figure 3.
Photo of the experimental setup (numbering of elements corresponds to Figure 2).
Pipeline defects are modeled using steel discs with holes of different diameters (from 1 to 5 mm). They are shown in Figure 4. The discs were mounted and clamped with a threaded fitting on a nipple welded to the pipe (Figure 5a). To eliminate noise from the impact of the water jet, a rubber hose was connected to the leak site, at the end of which a ball valve was located (Figure 5b).
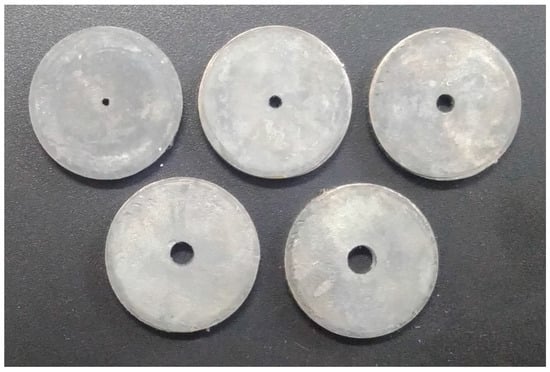
Figure 4.
Defects models.
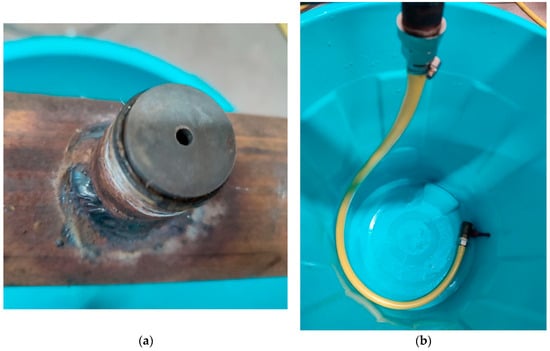
Figure 5.
Method of fixing discs on a pipeline: (a) a pipe nipple welded onto the pipe with a steel disc mounted on it; (b) connecting the pipe nipple to a rubber hose.
The experiments were conducted as follows: A disk was installed on the pipe, simulating a pipeline defect. By changing the rotation speed of the pump station drive, the pressure in the pipeline was set in a range from 1.5 to 4 bar. Acoustic signals from the pipeline surface were recorded at different pump discharge pressures. In the case of a closed ball valve, the condition of the pipeline was considered defect-free, and in the case of an open one, defective (Figure 5b).
Table 2 shows the measurement results of the pump capacity and leakage consumption depending on the size of the defect and the pump discharge pressure.

Table 2.
Pump capacity and leakage consumption.
4. Results of Laboratory Experiments and Their Discussion
The Hurst exponent of acoustic signals was calculated using R/S analysis and DFA-1 methods. Signals with a length of 20,000 samples were processed. The rescaled range R/S(δ) and the fluctuation function F(δ) were calculated for signal sections (windows) of length δ = 16–1024.
Figure 6 and Figure 7 show the results of calculating the Hurst exponent of pipeline vibrations in the longitudinal and radial directions. The values in the figures are obtained by the median averaging of 20 acoustic signals.
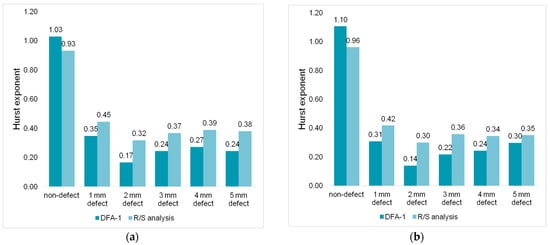
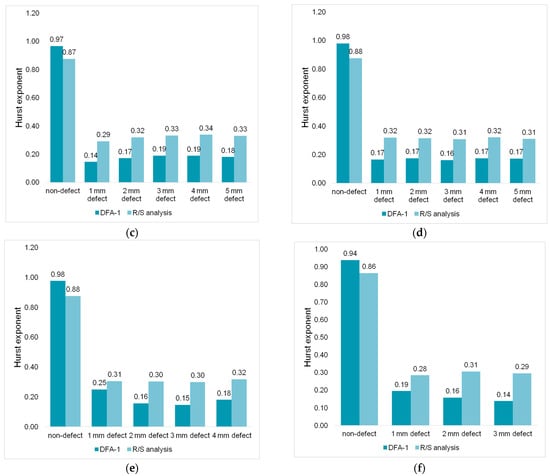
Figure 6.
Hurst exponent of acoustic signals recorded in the longitudinal direction of the pipeline at different pump discharge pressures: (a) 1.5 bar; (b) 2 bar; (c) 2.5 bar; (d) 3 bar; (e) 3.5 bar; (f) 4 bar.
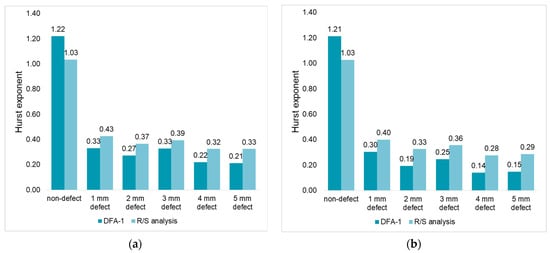
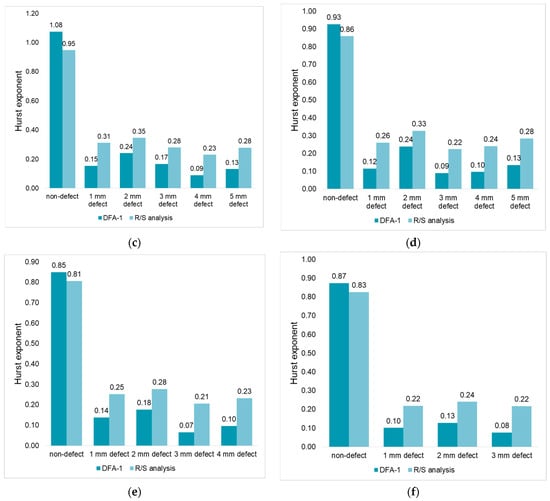
Figure 7.
Hurst exponent of acoustic signals recorded in the radial direction of the pipeline at different pump discharge pressures: (a) 1.5 bar; (b) 2 bar; (c) 2.5 bar; (d) 3 bar; (e) 3.5 bar; (f) 4 bar.
It can be seen from the diagrams in Figure 6 and Figure 7 that pipeline leaks are reliably detected by analyzing the Hurst exponent of acoustic signals. The signals of the defect-free pipeline are close to the level of the deterministic signal (H → 1). When a leak occurs in the pipeline, a decrease in the Hurst exponent is observed, pipeline fluctuations are anti-persistent (H < 0.5), and frequent but small amplitude changes appear in the signals. The decrease in H values is explained by the appearance of turbulent pulsations of water in the area of the defect location. The results obtained are consistent with the works of [37,38].
It should be noted that the values of the Hurst exponent calculated by different methods differ. The DFA-1 method, in comparison with the R/S analysis, demonstrates a higher Hurst exponent for defect–free pipeline signals, and a lower one for a pipeline with a leak.
As the size of the pipeline defect changes, the Hurst exponent changes slightly. To analyze the spread of values, the absolute deviation from the average is calculated:
where the i-th Hurst exponent from a series of data obtained at constant pressure in the pipeline and different defect diameters.
—the arithmetic mean of the Hurst exponent for data obtained at constant pressure in the pipeline and different defect diameters.
The maximum values of absolute deviations from the mean are summarized in Table 3.

Table 3.
Maximum values of absolute deviations.
Table 3 shows that the absolute deviation of the Hurst exponent for defects of different sizes does not exceed 0.1 (in the case of using the DFA-1 method). In that way, it can be assumed that the pipeline signals with the considered leak sizes are similar in their fractal structure.
Spectral analysis of acoustic signals and CFD modeling of hydrodynamic processes occurring in a pipeline with leaks were performed to explain the reasons for small deviations in the Hurst exponent when the leak size changes.
Figure 8 shows the power spectrum of acoustic pipeline signals at a pressure of 2.5 bar (the spectrum was obtained by median averaging over 20 signals). It can be seen from the figure that the spectrum of a defect-free pipeline decreases uniformly on a logarithmic frequency scale. With the appearance of a water leak, the energy of the acoustic signal increases, and the spectrum graph bends noticeably. The shape of the spectra does not change with increasing size of the pipeline defect, the amplitudes of the spectral components increase over the entire frequency range.
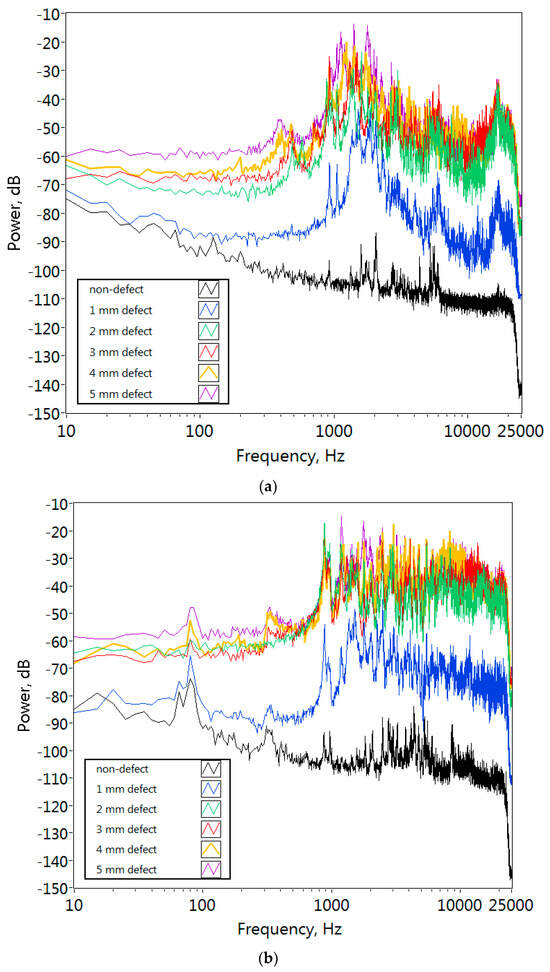
Figure 8.
Power spectrum of acoustic signals: (a) recorded in the longitudinal direction of the pipeline; (b) the radial direction of the pipeline.
By using Ansys Fluent software (v. 19.2) package, the turbulence eddy frequency and the turbulence kinetic energy of the water flow in the area of the defect were calculated. The k-ω SST (Shear Stress Transport) turbulence model was used in the calculations. The boundary conditions were set in the classical form in accordance with the experimentally obtained data: the flow velocity at the inlet to the pipe and the pressure at the outlet of the pipe. The conditions for draining water with a hose connection in the defect area are taken into account. The convergence of the calculation was achieved at a scaled residual level of 105. The coupled solution algorithm with Third-Order MUSCLE was used. The tasks were solved in a transient formulation, and three-dimensional models were calculated.
Figure 9 and Figure 10 show the results of numerical simulation of water leakage from defects of various sizes at a pipeline pressure of 2.5 bar.
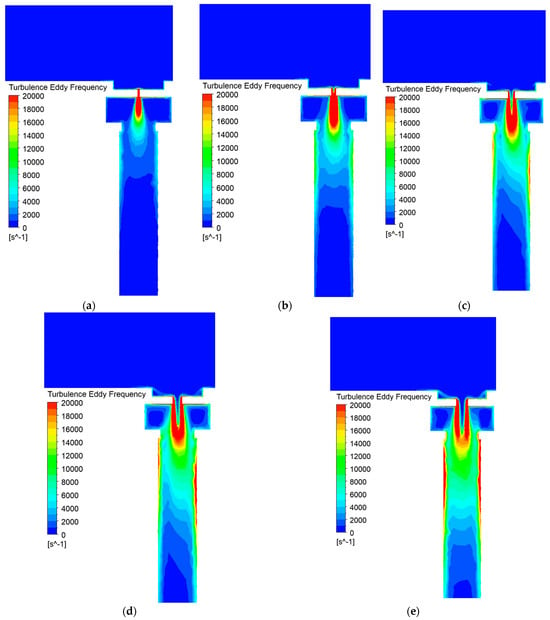
Figure 9.
Turbulence eddy frequency at different defect diameters: (a) 1 mm; (b) 2 m; (c) 3 mm; (d) 4 mm; (e) 5 mm.
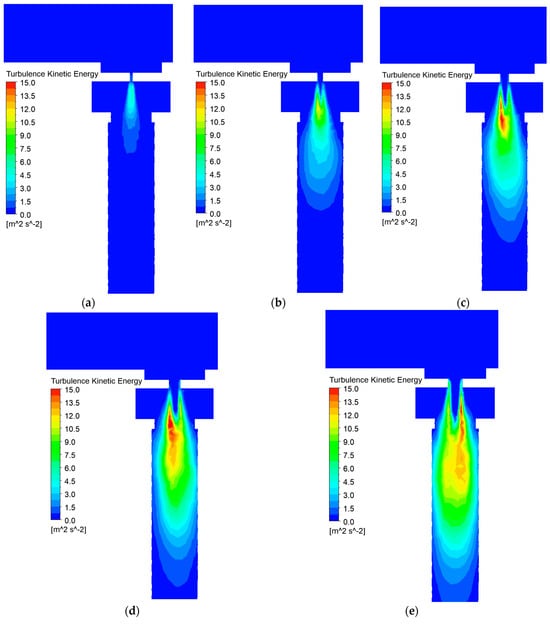
Figure 10.
Turbulence kinetic energy at different defect diameters: (a) 1 mm; (b) 2 m; (c) 3 mm; (d) 4 mm; (e) 5 mm.
Figure 9 shows that with an increase in the size of the defect, a proportional growth of zones with high-frequency and low-frequency vortex formation is observed, and a certain scale invariance remains. This explains the lack of significant changes in the Hurst exponent with an increase in the size of the leak. The increase in amplitude of spectral components is due to an increase in turbulence kinetic energy of which the calculations are shown in Figure 10.
5. The Effect of Signal Filtering on the Hurst Exponent
Pulsations of the turbulent flow can propagate through the fluid in a pipeline over considerable distances (hundreds of meters) and cause the walls of that pipeline (along the entire path of signal propagation) to undergo complex bending vibrations. The propagation range of elastic vibrations in the medium is limited by attenuation. The higher the frequency of the signal, the faster it fades and spreads over a shorter distance.
To assess the possibility of monitoring long sections of the pipeline, an analysis of changes in the Hurst exponent of acoustic signals after their filtration was carried out.
The signals obtained in laboratory studies were filtered using a 20th-order Butterworth low-pass filter. After filtering the signals, the Hurst exponent was calculated for them using the DFA-1 method. The calculation results for different cutoff frequencies (for example, a pipeline with a pressure of 2.5 bar) are shown in Figure 11.
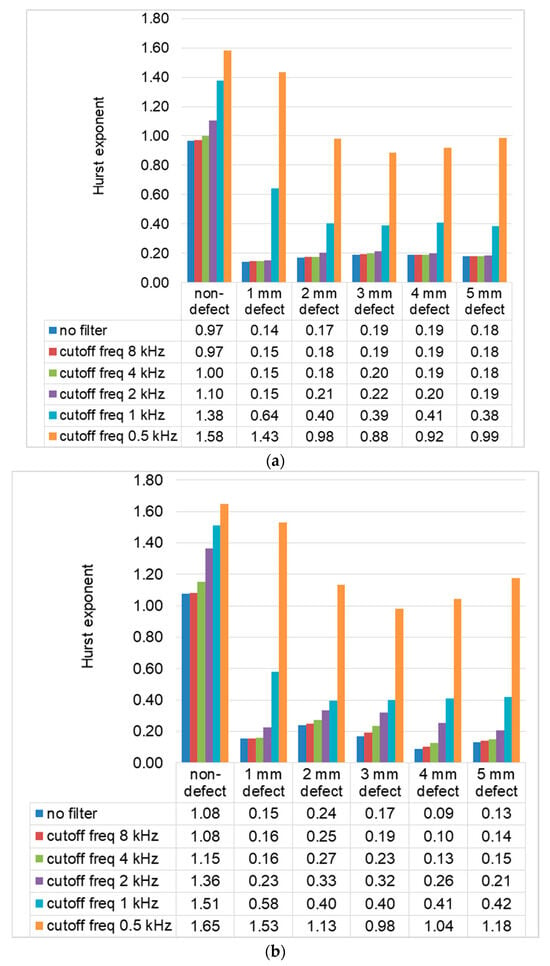
Figure 11.
The results of the calculation of the Hurst exponent using the DFA-1 method at different filter cutoff frequencies: (a) for signals recorded in the longitudinal direction of the pipeline; (b) for signals recorded in the radial direction of the pipeline.
Figure 11 shows that the suppression of frequency components above 2 kHz does not significantly change the Hurst exponent of acoustic signals. The spectral components that make the main contribution to the fractal structure of the signals are concentrated in the frequency band from 0 to 2 kHz.
An acoustic signal with a frequency of up to 2 kHz can propagate through the pipeline over considerable distances. For example, commercially available acoustic correlation leak detectors, when operating in this frequency range, can detect water leaks at a distance of up to 600 m. This suggests the possibility of monitoring extended sections of the pipeline using fractal analysis of acoustic signals.
6. Experimental Studies on Current Pipelines of the Water Supply System
Experimental studies have been conducted on steel pipelines of the current water supply system. The experiments were carried out in the basements of two public buildings on pipelines of different passage diameters: 100 and 50 mm. To simulate a pipeline defect, a steel disc with a through hole with a diameter of 5 mm was used, as shown in Figure 3. The disc was mounted on a shut-off valve and clamped with a threaded fitting, water was drained through a rubber hose. In the case of a closed tap, the condition of the pipeline was considered defect-free; in the case of an open one, defective. A photo of the location of the defect model is shown in Figure 12 and Figure 13.
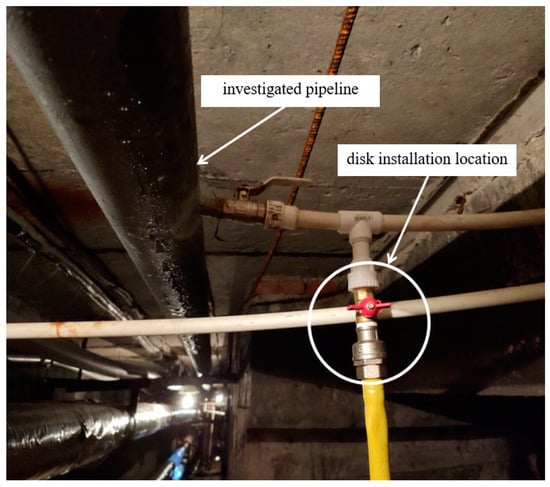
Figure 12.
Photo of the pipeline under investigation with a diameter of 100 mm.
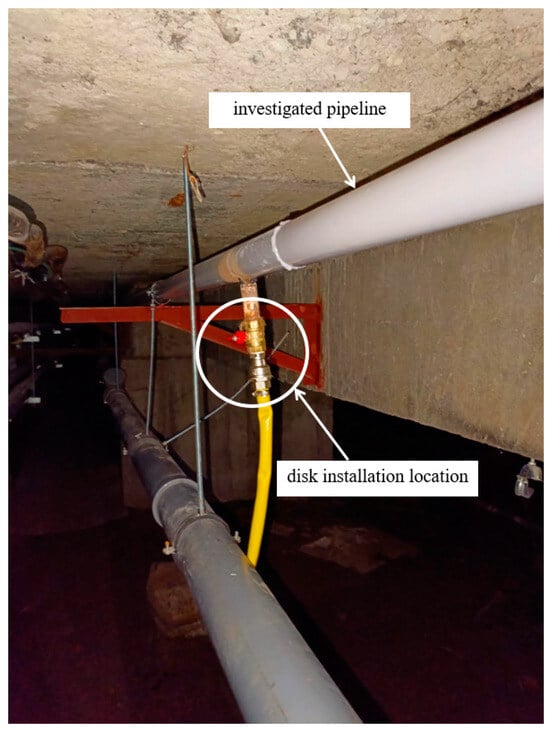
Figure 13.
Photo of the pipeline under investigation with diameter of 50 mm.
Pipeline vibrations were recorded by the vibration acceleration sensor AP-2038P-1000 (conversion coefficients—1000 mV/g, natural frequency—35 kHz). The sensor was installed at different distances from the leak site. The largest distance from the leak to the sensor was: 60 m when experimenting on a pipeline with a diameter of 100 mm and 40 m on a pipeline with a diameter of 50 mm.
The pipeline signals were recorded in computer memory with a sampling frequency of 50 kHz.
A confidence interval with a significance level α = 0.05 was constructed to estimate the spread of the Hurst exponent values obtained in various locations of the defect-free pipeline:
where average value of the Hurst exponent;
SE—standard error;
quantile of Student’s distribution with v degrees of freedom 1–α/2.
Figure 14 and Figure 15 show the results of the analysis of the Hurst exponent of radial vibrations of the pipeline using DFA-1 and R/S analysis methods, as well as the limits of the confidence interval. In these figures are indicated the following:
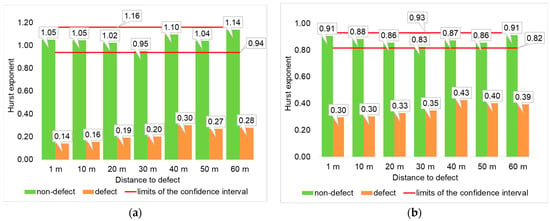
Figure 14.
The results of the analysis of radial vibrations of a pipeline with a diameter of 100 mm using various methods: (a) DFA-1; (b) R/S analysis.
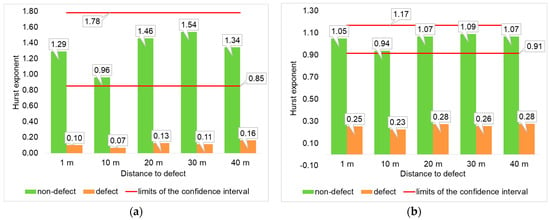
Figure 15.
The results of the analysis of radial vibrations of a pipeline with a diameter of 50 mm using various methods: (a) DFA-1; (b) R/S analysis.
- green color—the values of the Hurst exponent obtained on the pipeline in the absence of leakage;
- orange color—the values of the Hurst exponent obtained on the pipeline in the presence of a leak;
- red color—the limits of the confidence interval.
It can be seen from Figure 14 and Figure 15 that if there a leak in the pipeline, the H value is below the boundary of the confidence interval. The DFA-1 and R/S analysis methods can reliably determine the presence of a leak.
The Hurst exponent varies along the length of the pipeline. The reason for the variation in values may be changes in water flow during experiments, as well as the presence of corrosive and mineral depositions on the inner surface of the pipeline.
It should be noted that, unlike the R/S analysis, the DFA-1 method demonstrates a greater variation in the values of the H value in different sections of the defect-free pipeline. This is clearly seen by changing the boundaries of the confidence interval in Figure 14. In the case of using the DFA-1 method on defect-free sections of a pipeline with a diameter of 50 mm, the Hurst exponent is = 1.32 ± 0.47; in the case of R/S analysis, = 1.04 ± 0.13. This is due to the fact that the DFA method has a high sensitivity to changes in slowly evolving fluctuations of signals [39].
7. Conclusions
Pipeline leaks are reliably detected by analyzing the Hurst exponent of acoustic signals. It is established that the Hurst exponent of a defect-free pipeline is H → 1. When a leak appears in the pipeline, H decreases, pipeline fluctuations are anti-persistent, and frequent but small amplitude changes appear in the signals. With a change in the size of the through hole in the pipe wall, the Hurst exponent changes slightly. The decrease in the values of H is explained by the occurrence of turbulent pulsations of water in the area of the defect location. These pulsations can propagate in the pipeline fluid over considerable distances and cause the walls of this pipeline to perform complex bending vibrations.
With the appearance of leakage, acoustic vibrations are excited in a wide range of frequencies. The spectral components that make the main contribution to the fractal structure of the signals are concentrated in the frequency band from 0 to 2 kHz.
The acoustic leak signal propagates through the pipeline over considerable distances. DFA-1 and R/S analysis methods can be successfully applied to detect a defective pipeline branch in a complex branched system. The results obtained confirm the possibility of creating a monitoring system for water supply networks using fractal analysis of acoustic signals. However, pipeline transport has a wide range of applications. Various raw materials and products can be transported through pipelines, such as oil, natural gas, and water vapor, etc. The effectiveness of leak control of other pipeline systems by the proposed method requires further research.
Author Contributions
Conceptualization, A.Z. and S.Z.; software A.Z.; investigation, S.Z., E.I., I.K. and R.A.; validation, Y.V.; writing—original draft preparation, S.Z. and E.I.; writing—review and editing, A.Z.; data curation, I.K. and R.A. All authors have read and agreed to the published version of the manuscript.
Funding
This research was funded by the Russian Science Foundation grant No. 22-79-10045, https://rscf.ru/en/project/22-79-10045/ (accessed date 20 January 2025).
Data Availability Statement
The raw data supporting the conclusions of this article will be made available by the authors on request.
Conflicts of Interest
The authors declare no conflicts of interest.
Nomenclature
| H | Hurst exponent |
| D | Fraclal Dimension |
| x(t) | Time series |
| y(t) | Cumulative series |
| t | Time |
| N | Number of groups (segments) |
| δ | Number of elements in a group (segment) |
| X | Accumulated deviation from the mean |
| R | Range of variation |
| S | Standard deviation |
| F(δ) | Fluctuation function |
| Ym(t) | Local m-polynomial trend |
| d | Absolute deviation from mean |
| t1–α/2(v) | Quantile of Student’s distribution with v degrees of freedom 1 – α/2 |
| SE | Standard error |
| α | Significance level |
References
- Luong, T.T.; Kim, J.M. The enhancement of leak detection performance for water pipelines through the renovation oftraining data. Sensors 2020, 20, 2542. [Google Scholar] [CrossRef] [PubMed]
- Shukla, H.; Piratla, K. Leakage detection in water pipelines using supervised classification of acceleration signals. Autom. Constr. 2020, 117, 103256. [Google Scholar] [CrossRef]
- Cheraghi, N.; Taheri, F. A damage index for structural health monitoring based on the empirical mode decomposition. J. Mech. Mater. Struct. 2007, 2, 43–62. [Google Scholar] [CrossRef]
- Liu, Y.; Ma, X.; Li, Y.; Tie, Y.; Zhang, Y.; Gao, J. Water pipeline leakage detection based on machine learning and wireless sensor networks. Sensors 2019, 19, 5086. [Google Scholar] [CrossRef] [PubMed]
- Mysorewala, M.F.; Cheded, L.; Ali, I.M. Leak detection using flow-induced vibrations in pressurized wall-mounted water pipelines. IEEE Access 2020, 8, 188673–188687. [Google Scholar] [CrossRef]
- Wang, W.; Sun, H.; Guo, J.; Lao, L.; Wu, S.; Zhang, J. Experimental study on water pipeline leak using In-Pipe acoustic signal analysis and artificial neural network prediction. Measurement 2021, 186, 110094. [Google Scholar] [CrossRef]
- Guo, G.; Yu, X.; Liu, S.; Ma, Z.; Wu, Y.; Xu, X.; Wang, X.; Smith, K.; Wu, X. Leakage detection in water distribution systems based on time–frequency convolutional neural network. J. Water Res. Plan. Manag. 2021, 147, 04020101. [Google Scholar] [CrossRef]
- Chen, Q.; Liu, G.; Ma, X.; Li, X.; He, Z. Fractal generator for efficient production of random planar patterns and symbols in digital mapping. Comput. Geosci. 2017, 105, 91–102. [Google Scholar] [CrossRef]
- Cipolletti, M.P.; Delrieux, C.A.; Perillo, G.M.E.; Piccolo, M.C. Border extrapolation using fractal attributes in remote sensing images. Comput. Geosci. 2014, 62, 25–34. [Google Scholar] [CrossRef]
- Peng, F.; Zhou, D.; Long, M.; Sun, X. Discrimination of natural images and computer generated graphics based on multi-fractal and regression analysis. AEU—Int. J. Electron. Commun. 2017, 71, 72–81. [Google Scholar] [CrossRef]
- Pardo-Vicente, M.-A.; Pavón-Domínguez, P.; Moreno-Nieto, D.; Herrera-Collado, M. Evaluation of printing parameters in additive manufactured samples using fractal geometry of computed tomography images. Addit. Manuf. 2024, 94, 104476. [Google Scholar] [CrossRef]
- Wang, F.; Zhou, C.; Zhang, D.; Deng, H.; Wen, X.; Chen, G. Study of CH4-H2-CO-Air premixed combustion characteristics based on fractal dimension and flame crack method. Int. J. Hydrogen Energy 2024, 63, 1212–1228. [Google Scholar] [CrossRef]
- Ma, X.; Zhang, F.; Luo, H.; Guo, G. Water shortage detection of jujube trees based on spectral technology and random forest classifier integrated with fractal theory. Ind. Crops Prod. 2024, 216, 118729. [Google Scholar] [CrossRef]
- Dimri, V.P.; Ganguli, S.S. Fractal Theory and Its Implication for Acquisition, Processing and Interpretation (API) of Geophysical Investigation: A Review. J. Geol. Soc. India 2019, 93, 142–152. [Google Scholar] [CrossRef]
- Tang, S.W.; He, Q.; Xiao, S.Y.; Huang, X.Q.; Zhou, L. Fractal Plasmonic Metamaterials: Physics and Applications. Nanotechnol. Rev. 2015, 4, 277–288. [Google Scholar] [CrossRef]
- Jiang, Z.-Q.; Xie, W.-J.; Zhou, W.-X.; Sornette, D. Multifractal Analysis of Financial Markets: A Review. Rep. Prog. Phys. 2019, 82, 125901. [Google Scholar] [CrossRef]
- Datta, D.; Sathish, S. Application of fractals to detect breast cancer. J. Phys. Conf. Ser. 2019, 1377, 012030. [Google Scholar] [CrossRef]
- Hart, M.G.; Romero-Garcia, R.; Price, S.J.; Suckling, J. Global effects of focal brain tumors on functional complexity and network robustness: A prospective cohort study. Clin. Neurosurg. 2019, 84, 1201–1213. [Google Scholar] [CrossRef]
- Dona, O.; Hall, G.B.; Noseworthy, M.D. Temporal fractal analysis of the rs-BOLD signal identifies brain abnormalities in autism spectrum disorder. PLoS ONE 2017, 12, e0190081. [Google Scholar] [CrossRef]
- Babanin, O.; Bulba, V. Designing the technology of express diagnostics of electric train’s traction drive by means of fractal analysis. East.-Eur. J. Enterp. Technol. 2016, 4, 45–54. [Google Scholar] [CrossRef][Green Version]
- Chandrasekaran, S.; Poomalai, S.; Saminathan, B.; Suthanthiravel, S.; Sundaram, K.; Hakkim, F.F.A. An investigation on the relationship between the hurst exponent and the predictability of a rainfall time series. Meteorol. Appl. 2019, 26, 511–519. [Google Scholar] [CrossRef]
- Xie, X.; Li, S.; Guo, J. Study on Multiple Fractal Analysis and Response Characteristics of Acoustic Emission Signals from Goaf Rock Bodies. Sensors 2022, 22, 2746. [Google Scholar] [CrossRef] [PubMed]
- Hurst, H.E. The Long-Term Storage Capacity of Reservoirs. Trans. Am. Soc. Civ. Eng. 1951, 116, 770–799. [Google Scholar] [CrossRef]
- Hurst, H.E. Methods of using long-term storage in reservoirs. Proc. Inst. Civ. Eng. 1955, 1, 519–543. [Google Scholar] [CrossRef]
- Mandelbrot, B.; Wallis, J.R. Robustness of the Rescaled Range R/S in the Measurement of Noncyclic Long-Run Statistical Dependence. Water Resour. Res. 1969, 5, 967–988. [Google Scholar] [CrossRef]
- Mandelbrot, B. Statistical methodology for non-periodic cycles: From the covariance to R/S analysis. Ann. Econ. Soc. Meas. 1972, 1, 2–11. [Google Scholar]
- Mandelbrot, B.; Taqqu, M.S. Robust R/S analysis of longrun serial correlation. Bulletin of the International Statistical Institute. Proc. 42nd Sess. Int. Stat. Inst. 1979, 48, 69–104. [Google Scholar]
- Danilenko, S. R/S Financial Market Analysis. Liet. Mat. Rink. 2008, 48, 186–190. [Google Scholar] [CrossRef]
- Li, J.; Chen, Y. Rescaled range (R/S) analysis on seismic activity parameters. Acta Seimol. Sin. 2001, 14, 148–155. [Google Scholar] [CrossRef]
- Gospodinova, E.; Lebamovski, P.; Georgieva-Tsaneva, G.; Negreva, M. Evaluation of the Methods for Nonlinear Analysis of Heart Rate Variability. Fractal Fract. 2023, 7, 388. [Google Scholar] [CrossRef]
- Zournatzidou, G.; Farazakis, D.; Mallidis, I.; Floros, C. Stochastic Patterns of Bitcoin Volatility: Evidence across Measures. Mathematics 2024, 12, 1719. [Google Scholar] [CrossRef]
- Peng, C.-K.; Buldyrev, S.V.; Havlin, S.; Simons, M.; Stanley, H.E.; Goldberger, A.L. Mosaic Organization of DNA Nucleotides. Phys. Rev. E 1994, 49, 1685–1689. [Google Scholar] [CrossRef] [PubMed]
- Serletis, A.; Uritskaya, O.; Uritsky, V. Detrended fluctuation analysis of the us stock market. Int. J. Bifurc. Chaos 2008, 18, 599–603. [Google Scholar] [CrossRef]
- Alvarez-Ramirez, J.; Alvarez, J.; Rodriguez, E. Short-term predictability of crude oil markets: A detrended fluctuation analysis approach. Energy Econ. 2008, 30, 2645–2656. [Google Scholar] [CrossRef]
- Ihlen, E.A. Introduction to Multifractal Detrended Fluctuation Analysis in Matlab. Front. Physiol. 2012, 3, 141. [Google Scholar] [CrossRef]
- Liu, J. Detrended fluctuation analysis of vibration signals for bearing fault detection. In Proceedings of the IEEE Conference on Prognostics and Health Management, Denver, CO, USA, 20–23 June 2011; pp. 1–5. [Google Scholar] [CrossRef]
- Zagretdinov, A.; Ziganshin, S.; Izmailova, E.; Vankov, Y.; Klyukin, I.; Alexandrov, R. Detection of Gate Valve Leaks through the Analysis Fractal Characteristics of Acoustic Signal. Fractal Fract. 2024, 8, 280. [Google Scholar] [CrossRef]
- Zagretdinov, A.; Ziganshin, S.; Izmailova, E.; Vankov, Y.; Klyukin, I.; Alexandrov, R. Detection of Pipeline Leaks Using Fractal Analysis of Acoustic Signals. Fractal Fract. 2024, 8, 213. [Google Scholar] [CrossRef]
- Bashan, A.; Bartsch, R.; Kantelhardt, J.W.; Havlin, S. Comparison of detrending methods for fluctuation analysis. Phys. A Stat. Mech. Its Appl. 2008, 387, 5080–5090. [Google Scholar] [CrossRef]
Disclaimer/Publisher’s Note: The statements, opinions and data contained in all publications are solely those of the individual author(s) and contributor(s) and not of MDPI and/or the editor(s). MDPI and/or the editor(s) disclaim responsibility for any injury to people or property resulting from any ideas, methods, instructions or products referred to in the content. |
© 2025 by the authors. Licensee MDPI, Basel, Switzerland. This article is an open access article distributed under the terms and conditions of the Creative Commons Attribution (CC BY) license (https://creativecommons.org/licenses/by/4.0/).