Article

Pore Structure Evolution of Coal After Supercritical CO2–Water–Rock Treatment: A Multifractal Analysis

1
School of Resources and Geosciences, China University of Mining and Technology, Xuzhou 221116, China
2
Carbon Neutrality Institute, China University of Mining and Technology, Xuzhou 221008, China
3
Jiangsu Key Laboratory of Coal-Based Greenhouse Gas Control and Utilization, China University of Mining and Technology, Xuzhou 221108, China
*
Authors to whom correspondence should be addressed.
Fractal Fract. 2025, 9(3), 144; https://doi.org/10.3390/fractalfract9030144
Submission received: 24 December 2024 / Revised: 13 February 2025 / Accepted: 18 February 2025 / Published: 25 February 2025
(This article belongs to the Special Issue Multiscale Fractal Analysis in Unconventional Reservoirs)

Abstract

The evolution of coal’s pore structure is crucial to the efficient capture of carbon dioxide (CO2) within coalbeds, as it provides both adsorption sites and seepage space for the adsorbed- and free-phase CO2, respectively. However, the conventional single fractal method for characterizing pore structure fails to depict the intricacies and variations in coal pores. This study innovatively applies the low-temperature N2/CO2 sorption measurement and multifractal theory to investigate the evolution of the microporous structure of coals (e.g., from the Huainan coalfield) during the supercritical CO2(ScCO2)–water–rock interaction process. Firstly, we observed that the ScCO2–water–rock interaction does not significantly alter the coal’s pore morphology. Notably, taking the ZJ-8# sample as an example, low-temperature N2 sorption testing displayed a stable pore volume following the reaction, accompanied by an increase in specific surface area. Within the CO2 sorption testing range, the ZJ-8# sample’s pore volume remained unchanged, while the specific surface and pore width performed displayed a slight decrease. Secondly, by introducing key parameters from multifractal theory (such as Dq, α(q), τ(q), and f(α)), we assessed the heterogeneity characteristics of the coal’s pore structure before and after the ScCO2–water–rock reaction. The N2 sorption analysis reveals an increase in pore heterogeneity for the ZJ-8# sample and a decrease for the GQ-13# sample within the sorption testing range. In the context of low-temperature CO2 sorption analysis, the pore distribution complexity and heterogeneity of the GQ-11# and GQ-13# samples’ pores were escalated after ScCO2–water–rock interaction. The experimental and analysis results elucidated the dual roles of precipitation and dissolution exerted by the ScCO2–water–rock interaction on the micropores of coal reservoirs, underscoring the heterogeneous nature of the reaction’s influence on pore structures. The application of fractal theory offers a novel perspective compared to traditional pore characterization methods, significantly improving the precision and comprehensiveness of pore structure change descriptions.

1. Introduction

Since the Industrial Revolution, anthropogenic CO2 emissions have been increasing, leading to a higher frequency of extreme climate events and causing severe environmental damage, as well as having profound effects on human society [1]. Carbon capture, utilization, and storage is recognized as a pivotal strategy in mitigating global warming [2]. Among these strategies, the geological storage of CO2 in coalbeds is particularly effective at lowering atmospheric CO2 concentrations [3,4]. China boasts abundant coalbed methane (CBM) resources [5,6,7], and the injection of CO2 into coal seams plays a pivotal role in augmenting CBM production [8,9,10]. Prior research indicates that the pore structure within coal seams undergoes substantial alterations after CO2 injection, which in turn directly impacts the geological sequestration capacity for CO2. Therefore, understanding pore structure variation characteristics of coal induced by CO2 injection is crucial for elucidating in situ seepage laws of coalbed methane and unraveling the CO2-enhanced production and sequestration mechanism.
Coal represents a complex pore-rich medium characterized by an intricate network of internal pore structure [11,12]. The characterization of coal’s pore structure typically relies on two main methodological categories: fluid intrusion and imaging techniques [13]. In recent years, numerous scholars have employed these methodologies to investigate coal’s pore structure, optimizing the techniques and integrating multiple approaches. Qi et al. investigated anthracite coal samples across a spectrum of particle sizes, concluding that the 150–200 mesh range is most suitable for low-temperature N2 sorption analyses [14]. Zhang et al. applied low-temperature N2/CO2 sorption experiments and mercury intrusion porosimetry (MIP) to identify the pore size distribution (PSD) and architecture within coal-shale samples of different particle sizes. It was found that the differences in pore and fracture structural parameters resulting from sample preparation are minor, implying that coal-shale blocks are suitable substitutes for original rock in studying coal-shale pore structure generalities [15]. Li et al. utilized nuclear magnetic resonance (NMR) and MIP to assess coal’s PSD sensitivity in response to pressure variation. They found that NMR provides more dependable information on coal’s PSD, and MIP’s accuracy can be enhanced through optimized testing pressures [16]. Vranjes-Wessely et al. adopted a comprehensive approach, including TEM imaging and gas adsorption techniques, which has improved understanding of pore evolution and gas storage capacity in coals [17].
Conventional characterization methods have their merits, but they often fail to quantify the complexity and variability of pore shapes. In recent decades, numerous studies have utilized fractal analysis theory to quantitatively describe the heterogeneity of porous media [18,19,20]. As research advances, traditional fractal methods have proven to be insufficient for characterizing complex porous media that exhibit significant differences in pore structures despite having similar fractal dimensions [21,22,23]. Multifractal methods, which extend beyond single fractal approaches, provided a nuanced quantitative link between PSD and media heterogeneity [24,25,26]. Zhang et al. applied multifractal analysis theory to examine coal samples across various metamorphic grades, deriving multifractal pore structure parameters from MIP and low-temperature N2 sorption analyses. They found that the increased coal metamorphism correlates with heightened pore structure heterogeneity and complexity [27]. Zhu et al. determined the N2 sorption fractal dimension in coal samples and investigated its correlation with pore structure parameters and gelation capacity. They suggested redefining the fractal dimension in terms of N2 sorption relative pressure to better quantify mesopore volume roughness in coal [28]. Zheng et al. enhanced the single T2 cutoff value (T2C) model in NMR using multifractal theory, devising a novel dual T2C model for fluid classification [29,30]. Fang et al. examined the multifractal dimensions derived from low-temperature N2/CO2 sorption tests on coal samples from the Junggar and Qinshui basins, identifying a positive link between pore heterogeneity and Langmuir volume [31]. Vasilenko et al. calculated coal bed permeability using the Kozeny–Carman model, validated by small-angle neutron scattering data. They demonstrated that reduced fractal dimension with depth enlarges macropores, enhancing permeability and gas content in deep coal beds [32].
In this article, we proposed the utilization of multifractal theory to enhance the understanding of coal pore structure properties derived from low-temperature N2/CO2 adsorption–desorption experiments. This approach aims to examine changes in pore structure heterogeneity and connectivity during the ScCO2–water–rock interaction, offering valuable insights for unveiling the mechanism of ScCO2–water–rock reaction and assessing geological CO2 sequestration potential.

2. Sampling and Experiments

2.1. Coal Samples

For our analysis, coal samples were gathered at the Guqiao and Zhangji coal mine, situated within the Panxie mining region in the Huainan Coalfield, Anhui Province, China. Samples were specifically taken from the 8#, 11#, and 13# coal seams, labeled sequentially as ZJ-8#, GQ-11#, and GQ-13#. All samples were crafted into cylindrical forms measuring 5 cm in diameter and 10 cm in length, as well as ground into a particle sized between 60 and 80 mesh. Sample preparation, storage, and experimental procedures strictly followed relevant industry and national standards, namely the “Method for Sampling of Coal and Rock” (GB/T 19222-2003) [33] and “Method for Preparation of Coal and Rock Analysis Samples” (GB/T 16773-2008) [34]. The prepared samples were promptly wrapped in plastic film and absorbent paper, then stored in sealed bags to maintain their integrity. Table 1 presents the characterization results of physical properties obtained from proximate analysis, helium porosity, gas permeability, and micro component measurements.

2.2. Low-Temperature N2/CO2 Gas Sorption Experiment

To determine the specific surface area, pore volume, and PSD of the samples, low-temperature N2 and CO2 sorption experiments were performed using an Autosorb-iQ automatic analyzer manufactured by Quantachrome Instruments, Boynton Beach, FL, USA. The experimental procedures were strictly carried out in accordance with the national standard GB/T 21650.3—2011 “Determination of Pore Size Distribution and Porosity for Solid Materials by Mercury Intrusion Porosimetry and Gas Adsorption—Part 3: Analysis of Micropores by Gas Adsorption” [35]. Prior to measurement, samples were ground to a 60–80 mesh size and dehydrated under vacuum conditions at 378 K and 0.25 Pa for 24 h. Then, the prepared particle samples were tested with N2 at 77 K for isothermal adsorption–desorption. The specific surface area, pore volume, and PSD were derived from the Brunauer–Emmett–Teller (BET) model, the Barret–Joyner–Halenda (BJH) model, and the BJH-modified Kelvin equation, respectively. Isothermal CO2 sorption tests were conducted at 273 K to measure the parameters of pores ranging from 0.489 to 1.083 nm based on the density functional theory (DFT) model.

2.3. Supercritical CO2–Water–Rock Reaction Experiment

The experimental apparatus for the ScCO2–water–rock reaction comprises a high-pressure vessel (reaction chamber), a pressurization apparatus, and a gas supply system. The high-pressure container, with a 1.5 L capacity, is crafted from corrosion-resistant 316L stainless steel, mimicking the conditions of high temperature, pressure, and confinement in situ environments. The pressurization system modulates chamber pressure using an electronic pressure regulator, allowing experimental pressure settings through a human–machine interface or manual adjustment. Heating is conducted via a resistance wire element, enabling temperature regulation from room temperature to 453 K, with an automatic controller ensuring isothermal conditions. The laboratory simulation of the CO2 storage process involves the simultaneous injection of CO2 and water into the reactor to interact with reservoir rocks under sealed conditions. (i) A 3 g/L NaCl brine is prepared to simulate formation water; (ii) Coal samples are placed in contact with the prepared formation water in a high-temperature, high-pressure reaction vessel; subsequently, CO2 is compressed and the pressurized gas is introduced into the vessel. The reaction temperature and pressure are adjusted for each sample based on the geothermal and geo-pressure gradients corresponding to the burial depth, as detailed in Table 2. (iii) After the reaction, samples are extracted for subsequent porosity and permeability analysis.

2.4. Multifractal Theory

As an extension of single fractal analysis, multifractal theory describes self-similarity through a continuous function rather than a singular fractal dimension. The box-counting method is commonly employed to characterize the multifractal properties within porous media. The detailed principles and computational steps of multifractal analysis theory have been previously described [36,37]. In this section, we provide only a brief introduction to multifractal analysis. Initially, cubic boxes with an edge length of ε are used to cover the low-temperature N2 PSD range. The coal’s PSD is divided into N(ε) boxes. The probability mass distribution Pi (ε) is given by
P i ε = N i ε i = 1 N ε N i ε
where Ni (ε) represents the cumulative porosity or cumulative pore volume within interval i and Pi (ε) is the probability mass distribution function.
For a sample with multifractal characteristics, its probability mass distribution function Pi (ε) exhibits a power–law relationship with the scale size ε of the box, which can be expressed as
P i ε   ε α i
where αi denotes the Lipschitz–Hölder singularity index, and the magnitude of αi is often related to the position i of the box.
Defining the number of boxes with the same singularity index α as Nα (ε), then Nα (ε) conforms to
N α ε ε f α
where f(α) is the fractal dimension set constituted by boxes with the same singularity index α and the relationship graph between f(α) and α is known as the multifractal spectrum.
The q-matrix partition function X(q, ε) for the box scale size ε can be expressed as
X q , ε = i = 1 N i P i q ε ε q 1 D q
where Dq represents the generalized fractal dimension corresponding to the q-matrix, and according to Equation (4), it can be derived as follows:
D q = 1 q 1 lim ε 0 log i = 1 N ε P i q ε log ε
where Dq is a function of the q-order matrix distribution. For the q-order matrix, when q < 0, Dq is a function of the q-order matrix distribution. For the q-order matrix, when q > 0, Dq represents areas of high probability density.
From Equation (5), the generalized fractal dimension can be obtained (also known as the multifractal dimension). Concurrently, the mass distribution function of the q-order matrix τ(q) can be defined as
τ q = lim ε 0 log X q , ε log ε = lim ε 0 i = 1 N ε P i q ε log ε
By combining Equations (5) and (6), the mass distribution function τ(q) can also be expressed as
τ q = 1 q D q
Through the Legendre transformation, the relationship between the singularity strength α(q) and the matrix order q, as well as the mass distribution function τ(q), can be represented as [38]
α q = d τ q dq
f α = q α q τ q

2.5. Experimental Procedures

Initially, coal samples from three seams were fashioned into cylindrical specimens measuring Φ2.5 cm × 5 cm and ground into powder with particle sizes ranging from 60 to 80 mesh. These powdered samples underwent low-temperature N2/CO2 adsorption–desorption analyses to ascertain the initial pore characteristics. Concurrently, the cylindrical samples were placed in a high-temperature, high-pressure reactor for ScCO2–water–rock interaction experiments. After the reaction, the cylindrical specimens were retrieved, reground to a particle size range of 60–80 mesh, and retested with low-temperature N2/CO2 sorption to determine the subsequent pore characteristics. Ultimately, multifractal theory was employed to evaluate the pore characteristics derived from N2/CO2 sorption tests conducted before and after the reaction, revealing the heterogeneity of the sample pores (Figure 1).

3. Results and Discussions

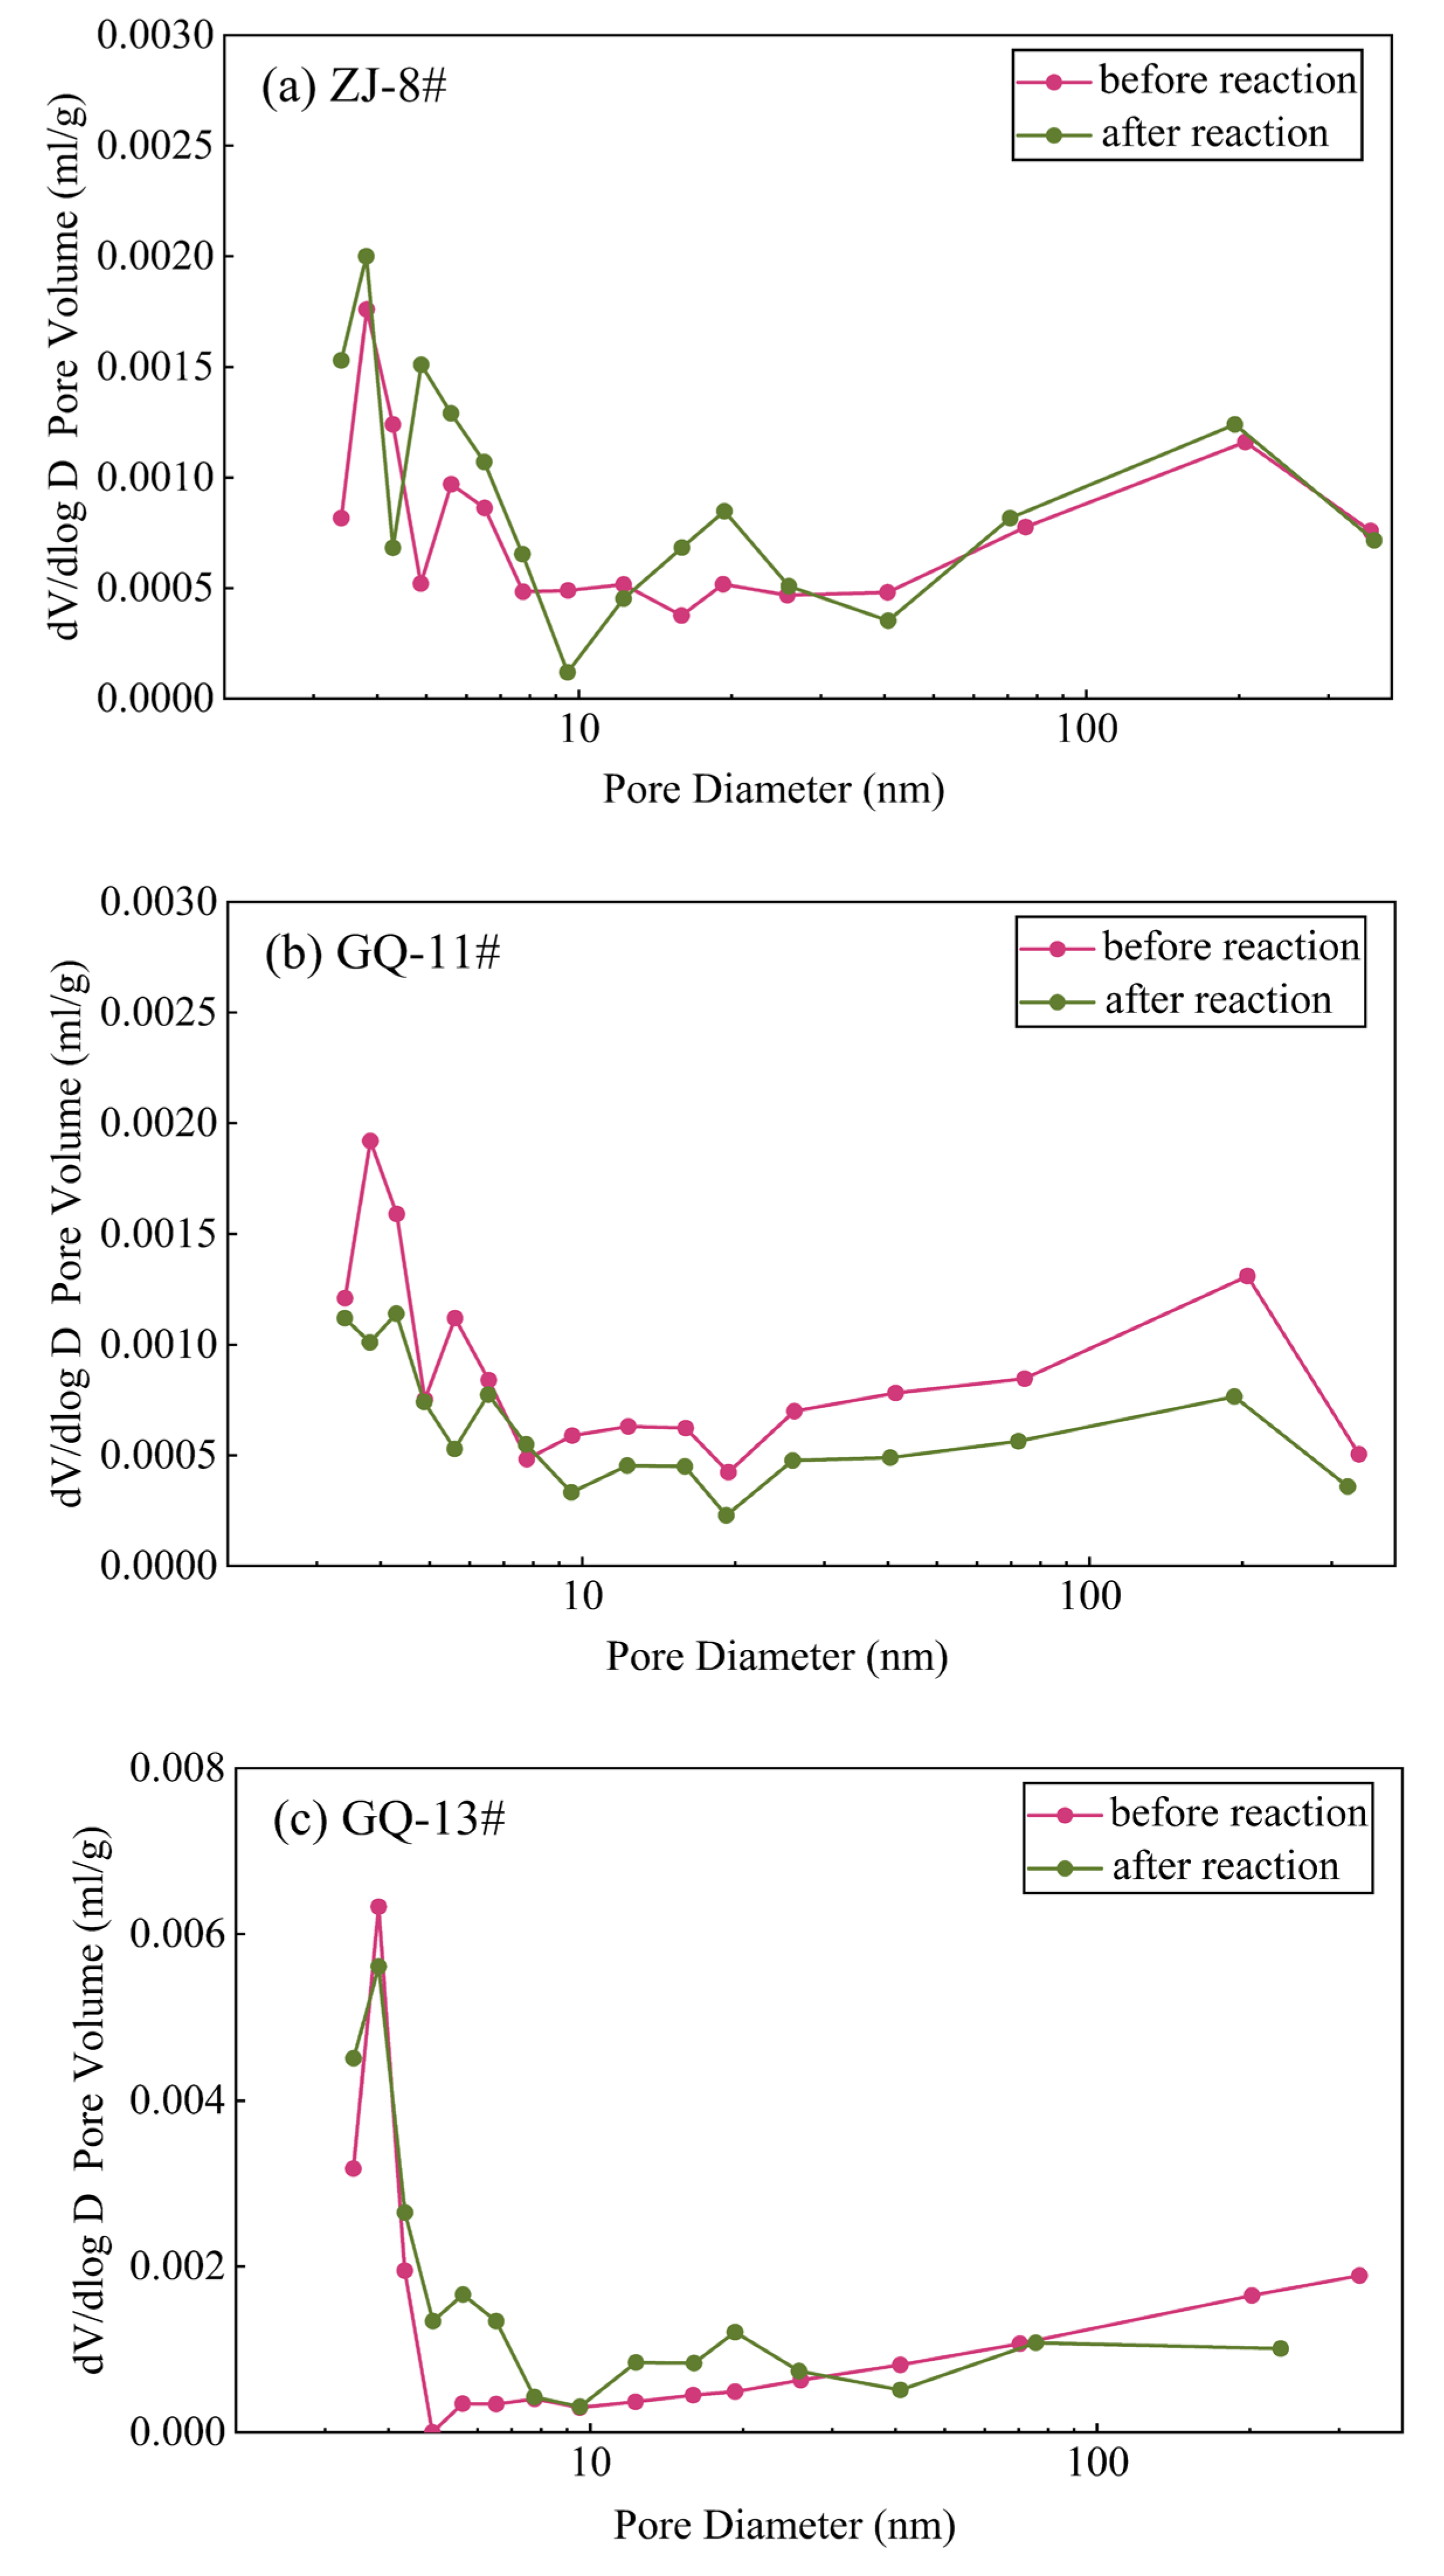
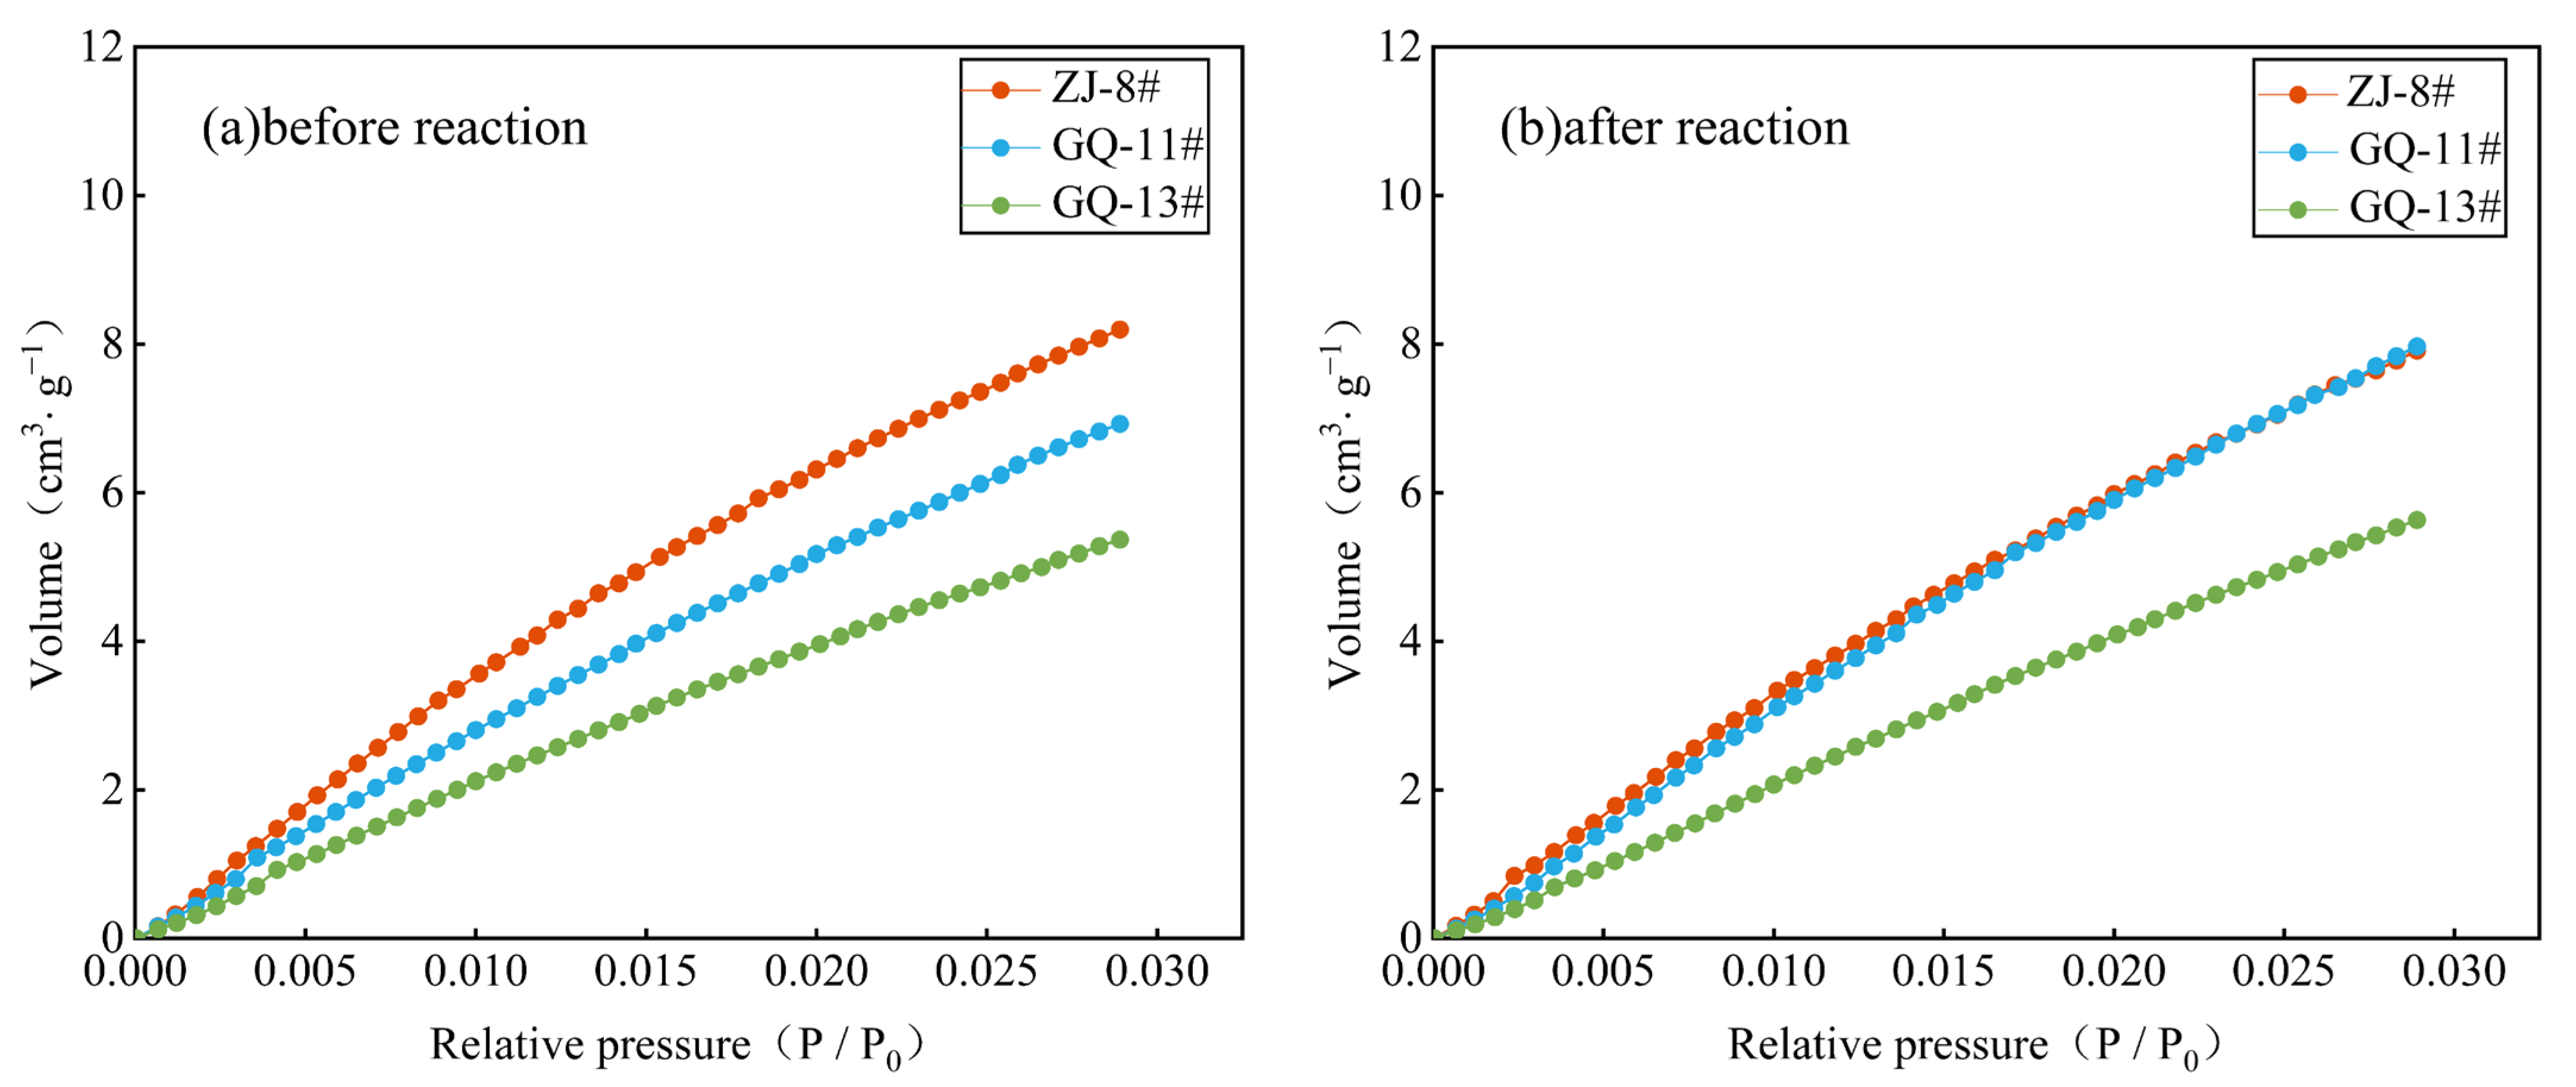
3.1. Low-Temperature N2 Adsorption Testing Results Before and After the ScCO2–Water–Rock Reaction

Table 3 and Figure 2 and Figure 3 present the low-temperature N2 adsorption testing results for three samples before and after the ScCO2–water–rock reaction. After the ScCO2–water–rock reaction, the specific surface area for the ZJ-8# and GQ-13# samples increased by 0.189 m2/g and 0.394 m2/g respectively, whereas the specific surface area of sample GQ-11# decreased by 0.169 m2/g after the reaction. The BJH pore volume of the ZJ-8# and GQ-11# samples remained stable, while the GQ-13# sample exhibited a 0.003 mL/g reduction after the reaction. The pore diameter Dv(d) for the ZJ-8# and GQ-13# samples remained consistent at approximately 3.8–3.82 nm; in contrast, the GQ-11# sample’s Dv(d) reduced from 3.819 nm to 3.402 nm after the reaction.
Figure 2 displays the N2 sorption curves for the samples, which are characterized by three distinct stages: at P/P0 below 0.5, micropores fill; for P/P0 ranging from 0.5 to 0.9, a layered adsorption phenomenon occurs, characterized by heightened adsorption activity and the emergence of hysteresis loops as a result of isotherm divergence; at P/P0 nearing 0.9, adsorption rates increase sharply, signifying the occurrence of capillary condensation along with the existence of mesopores and macropores within the coal structure. The shape of hysteresis loops in the isotherms reflects the characteristics of various pore morphologies. Following IUPAC classification, the coal samples’ isotherms are classified as type A and B. Type A curves, exemplified by the GQ-13# samples before and after the reaction, exhibit a pronounced hysteresis loop at P/P0 ≈ 0.5, suggesting inkwell-shaped pores characterized by narrow entrances and wider interiors. Type B curves, represented by the ZJ-8# and GQ-11# samples, show gradual adsorption changes below P/P0 < 0.8, followed by a sharp, exponential rise as P/P0 nears 1, and a minor hysteresis loop at P/P0 ≈ 0.5. Type B curves indicate well-connected, fully open pores, akin to parallel plate pores. The isotherm shapes of all coal samples were found to be largely consistent before and after the reaction, indicating that the CO2–water–rock reaction exerts a minimal impact on the micropore and mesopore morphology of coal. The GQ-13# sample’s adsorption peak was consistent before and after the reaction, whereas the ZJ-8# sample’s peak rose by approximately 0.2 cm3/g and the GQ-11# sample’s peak declined by 0.4 cm3/g. The adsorption capacity, governed by micropore volume, suggests variable alterations in the micropore volumes of the ZJ-8# and GQ-11# samples due to the ScCO2–water–rock reaction.
Figure 3 displays the PSD of the samples before and after the ScCO2–water–rock reaction. The ZJ-8# sample’s curve shifted from dual-peak to multi-peak in the micropore and mesopore range, suggesting a more intricate PSD after the reaction, peaking primarily at 1–3 nm. The GQ-11# sample experienced a notable decrease in both primary and secondary peak after the reaction, reflecting a reduced micropore count within the test range. Consistently, the GQ-13# sample displayed a single-peak curve centered at 1–3 nm, indicating pores that are predominantly within the micropores, unaffected by the reaction.

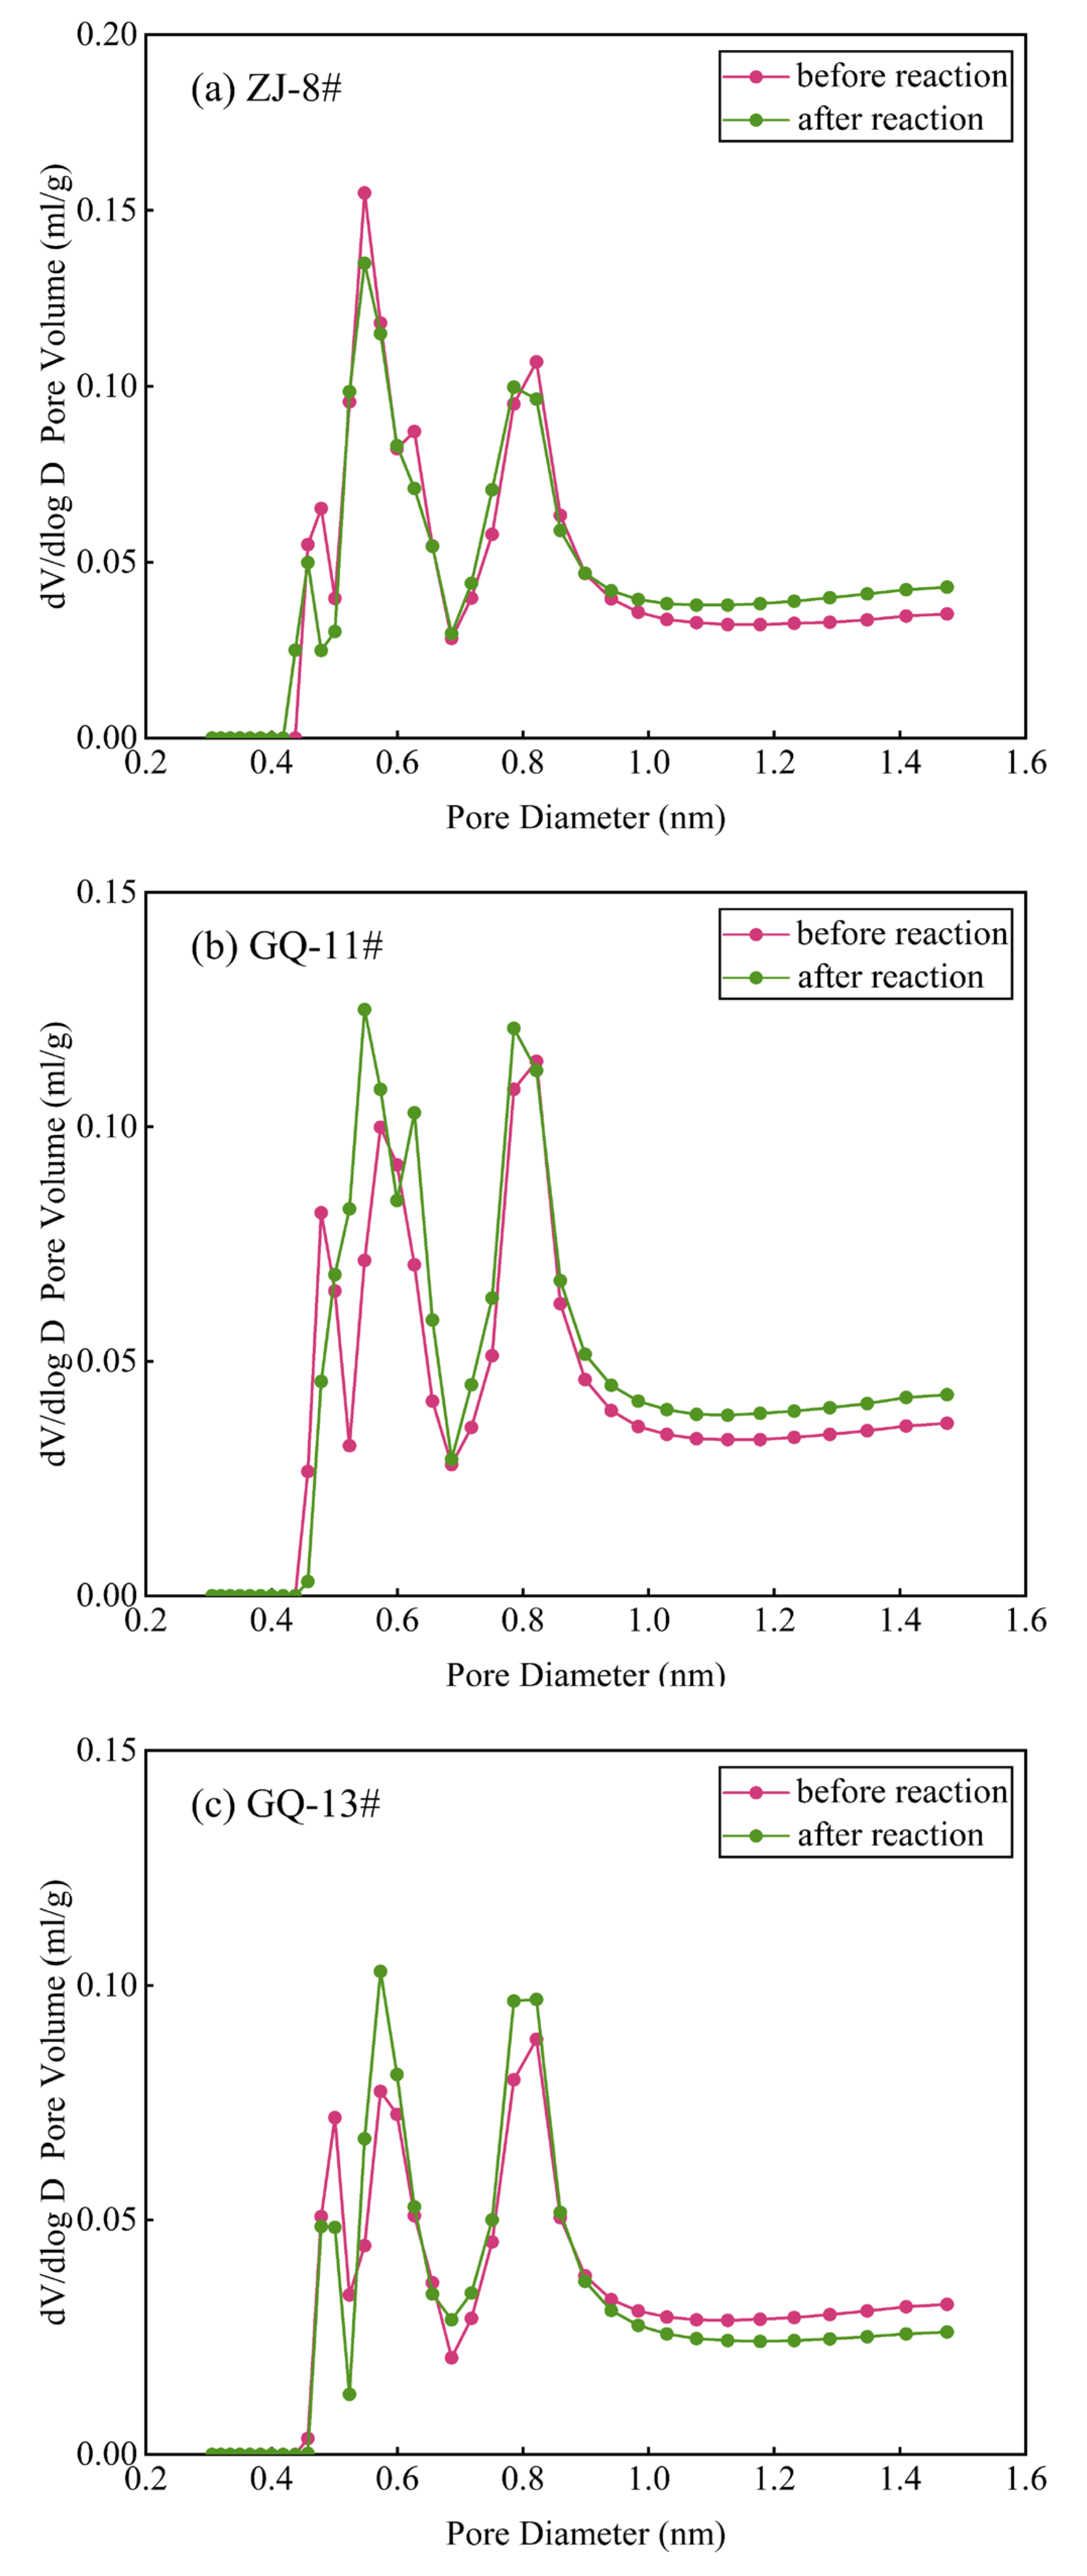
3.2. Data of Low-Temperature CO2 Testing Before and After the Reaction

The low-temperature N2 sorption test primarily serves to characterize mesopores, but it faces challenges in accurately representing the structural attributes of pores that fall outside the mesopore size range. In contrast, low-temperature CO2 testing is preferably suited for pores less than 2 nm in diameter, providing an additional methodological perspective to N2 sorption for a thorough evaluation of coal pore architecture. Table 4 presents the micropore structure parameters of three samples before and after the reaction. Following the ScCO2–water–rock interaction, the specific surface area of the ZJ-8# sample decreased from 85.125 m2/g to 83.01 m2/g, while the pore volume remained essentially unchanged. The average pore diameter shrank from 0.573 nm to 0.548 nm. The specific surface area of the GQ-11# sample increased from 73.793 m2/g to 83.755 m2/g, and the micropore volume rose from 0.027 cm3/g to 0.031 cm3/g, with the average pore diameter expanding from 0.501 nm to 0.573 nm. For the GQ-13# sample, the specific surface area slightly increased from 57.728 m2/g to 58.506 m2/g, with no significant changes observed in the micropore volume or the average pore diameter before and after the reaction.
Figure 4 presents the CO2 sorption isotherms for the samples. Both before and after the reaction, CO2 adsorption–desorption isotherms were shaped like the Langmuir pattern which can be categorized as Type I according to IUPAC classification. For the changes in CO2 adsorption capacity, the absorbed CO2 volume exhibits differently. The samples ZJ-8# and GQ-13# display a stable CO2 adsorption capacity throughout the reaction. In contrast, the GQ-11# sample shows a substantial enhancement after the reaction, suggesting a pronounced impact of the ScCO2–water–rock interaction on the micropore structure which results in micropore formation within the tested range.
Figure 5 presents the PSD obtained from CO2 sorption analyses of the samples. All three samples show a multi-peak pattern below 0.9 nm in pore diameter, which is representative of the micropore structure of coal samples. Micropores larger than 0.9 nm are relatively small in scale. The PSD curves for the samples, both before and after the reaction, display a multi-peak pattern. The ZJ-8# sample exhibited notable decreases in peak values, approximately 0.02, 0.024, and 0.01 for nanopore size ranges of 0.4–0.5 nm, 0.5–0.6 nm, and 0.7–0.9 nm, respectively. This trend implies a diminished microporosity within the ZJ-8# sample as a consequence of the ScCO2–water–rock interaction. Conversely, the GQ-11# sample increases in peak values of 0.02 and 0.01 were noted within the nanopore size ranges of 0.4–0.7 nm and 0.75–0.85 nm, respectively. The GQ-13# sample showed a notable rise in peak values of about 0.035 and 0.015 for the nanopore size intervals of 0.5–0.7 nm and 0.75–0.85 nm, respectively. These observations suggest that the microporosity has been augmented in both the GQ-11# and GQ-13# samples as a result of the CO2–water–rock interaction.

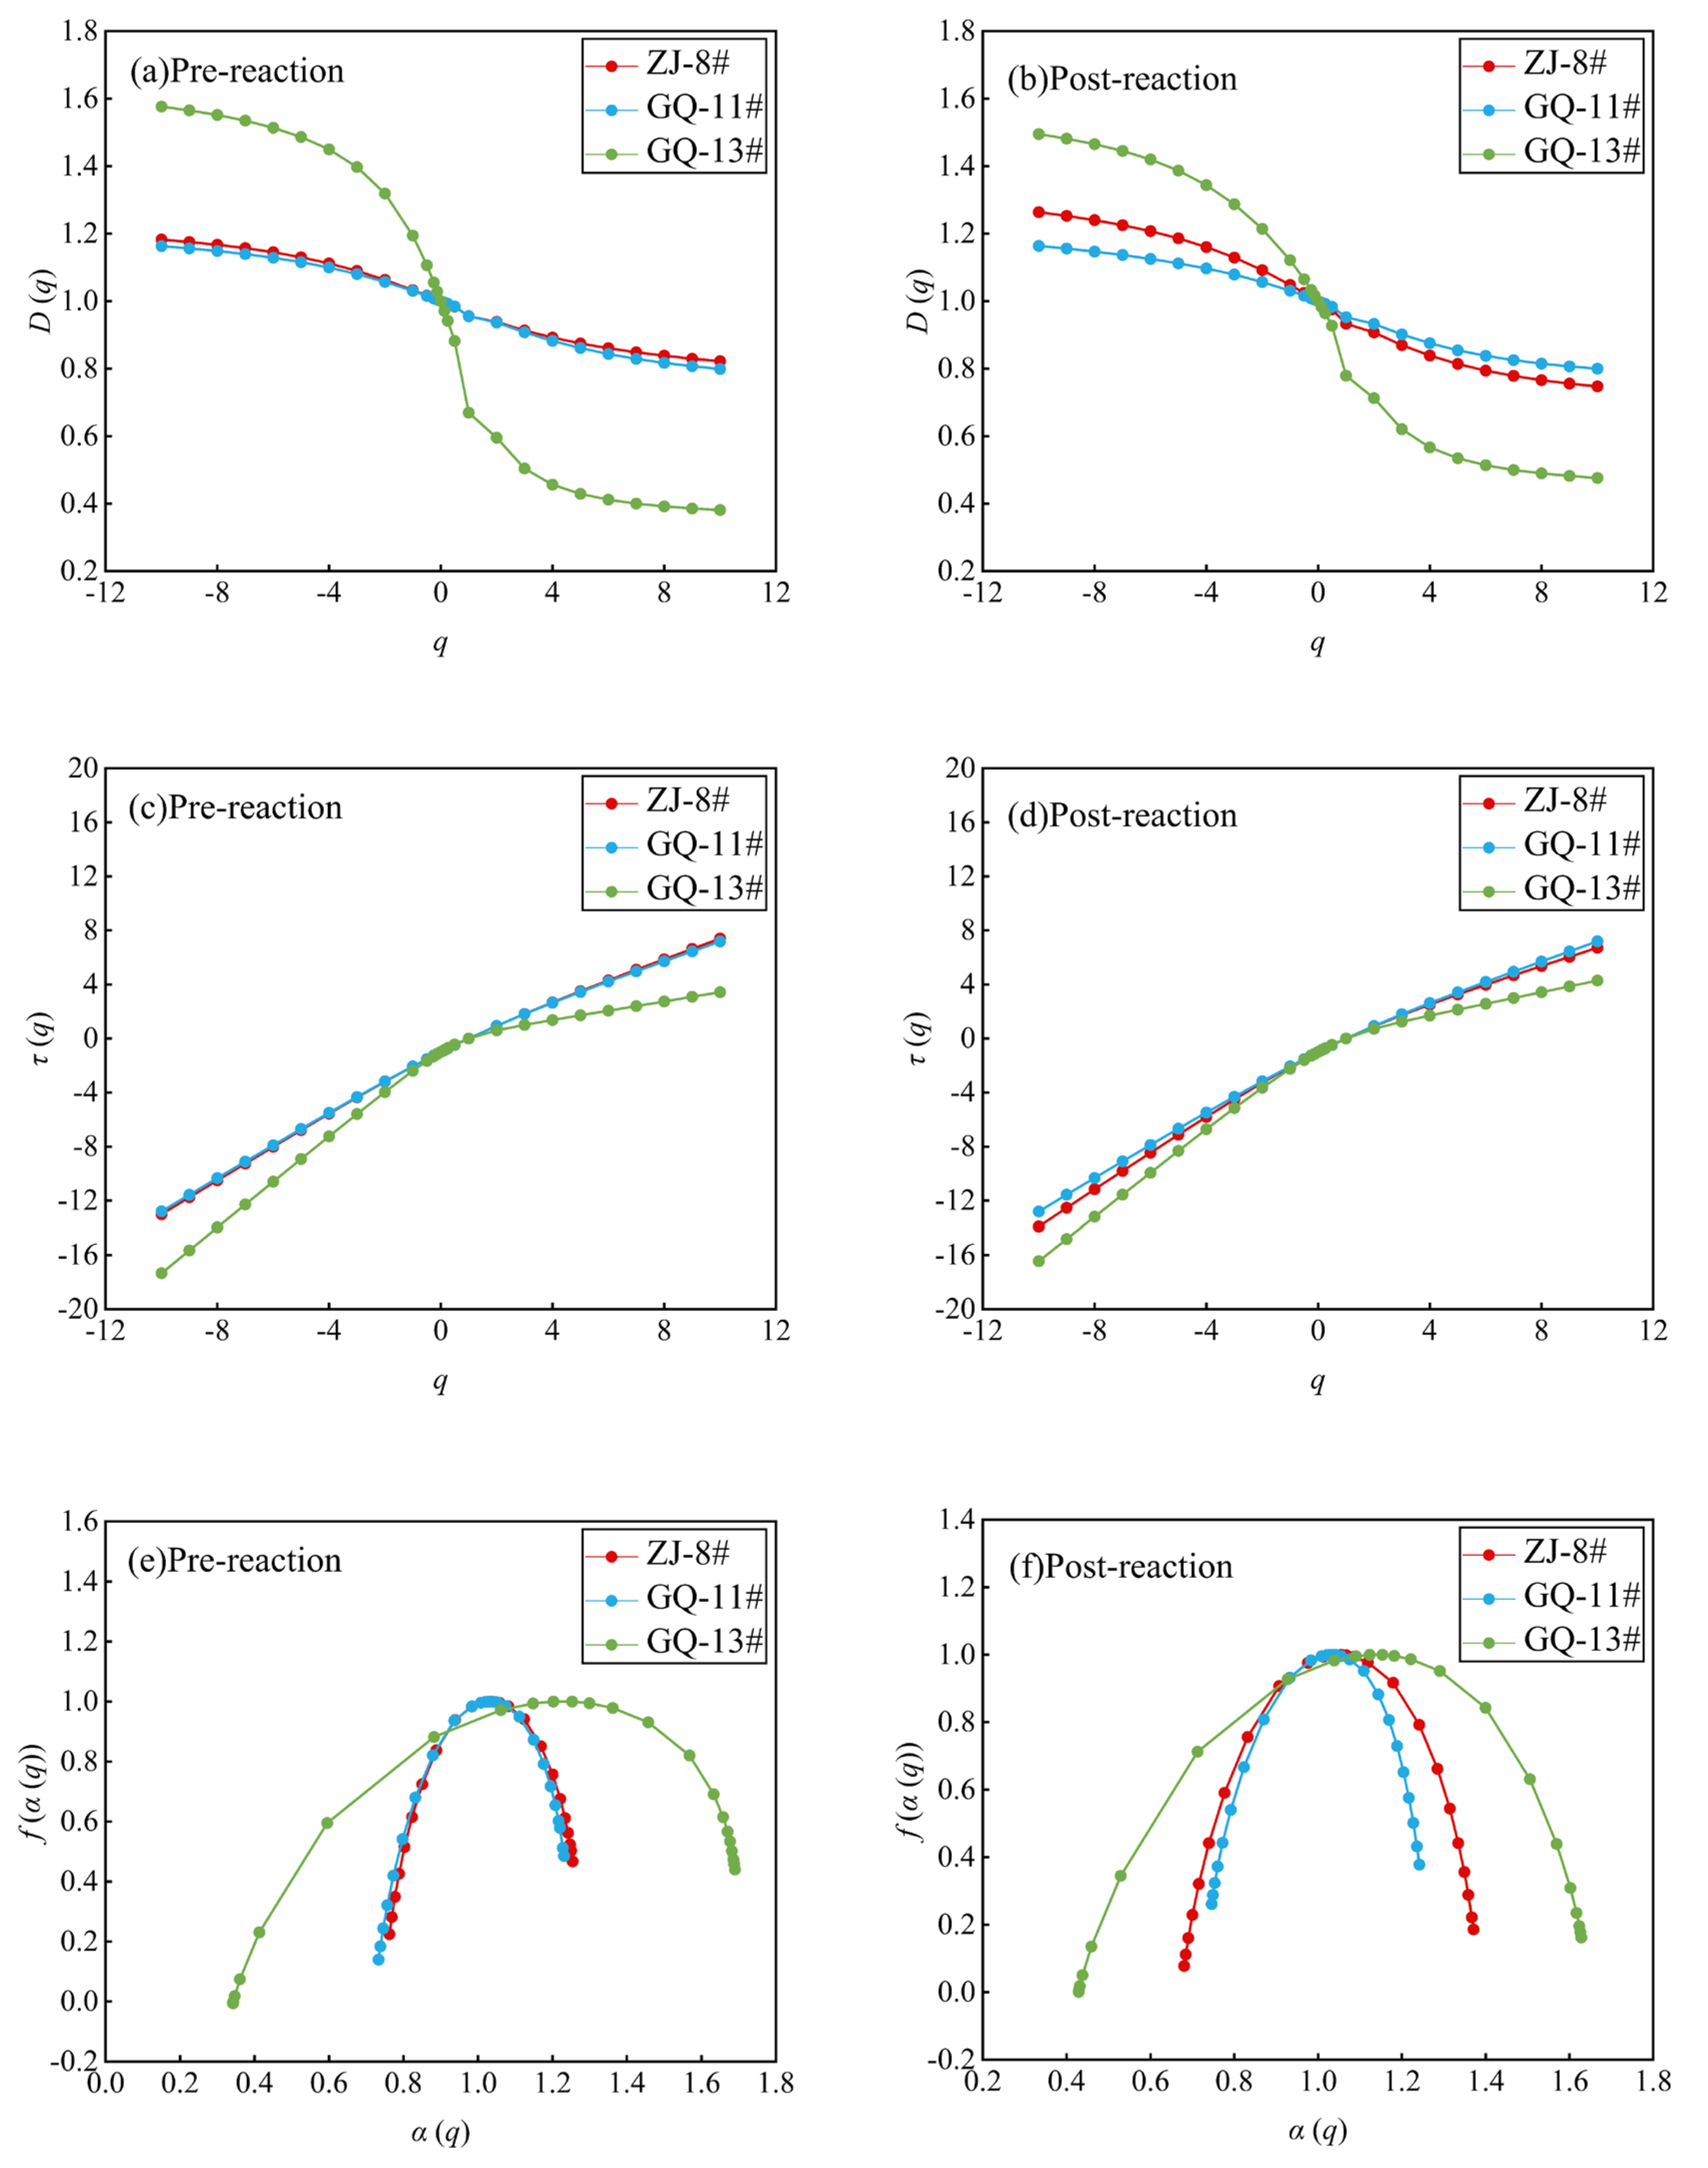
3.3. Multifractal Characteristics

The CO2 and N2 sorption isotherms and PSD curves from Section 3.1 indicate significant heterogeneity in the samples’ pore structures. This section explores the application of multifractality to characterize CO2/N2 testing outcomes before and after the ScCO2–water–rock reactions. Here, the multifractal order q spans the interval from −10 to 10, incremented by 1. The box sizes ε are sequenced as 8, 4, 2, 1, 0.5, 0.25, and 0.125. These parameters are employed to compute the multifractal dimensions Dq and the parameters α(q), τ(q), and f(α). Specifically, D-10 denotes the minimum multifractal dimension Dmin for the smallest scales, while D10 signifies the maximum multifractal dimension Dmax for the largest scales.

3.3.1. The Low-Temperature N2 Multifractal Characteristics

Multifractal analysis was applied to the PSD obtained from the coal’s low-temperature N2 sorption measurements. The outcomes are detailed in Table 5 and Table 6 and depicted in Figure 6.
Table 5 and Table 6 detail the calculated parameters from the low-temperature N2 tests conducted before and after the reactions. The Hausdorff dimension, denoted as D0, represents the fractal dimension at q = 0, signifying the average heterogeneousness of the PSD. The dimension D1 at q = 1, and the correlation dimension D2 at q = 2 are, respectively, calculated. The information in Table 5 indicates that the inequality D0 > D1 > D2 verifies the evident multifractal characteristics of the PSD within coal samples. The analysis reveals that D1 and D0 are closely approximated, indicating a PSD with greater uniformity. Conversely, a lower D1 indicates a denser and more heterogeneous pore structure. The samples ZJ-8# and GQ-11# consistently show higher D1 values than the GQ-13#, potentially due to their plate-like pore structures. Parallel-plate pores likely promote interconnectivity, while inkwell-shaped pores, which are open at one end, are less conducive to connectivity.
The extent of the generalized multifractal dimension spectrum, from D-10 to D10, indicates the level of heterogeneity in local PSD. A broader span denotes increased heterogeneity across specific pore size ranges. Table 5 and Table 6 reveal that the ZJ-8# and GQ-11# samples demonstrate greater spectrum widths than the GQ-13# sample, both before and after the reaction, suggesting greater heterogeneity in the GQ-13# sample’s pore distribution in the N2 testing range.
Figure 6a,b display the correlation between the multifractal dimension Dq and the matrix order q for the PSD before and after the reaction. The Dq-q spectrum of the samples exhibits a consistently monotonic decrease, resembling an inverted ‘S’ shape, with a steep drop in Dq for q < 0 and a moderated decline for q > 0 before and after the reaction. A closer examination shows an increase in the ZJ-8# sample’s spectrum width after the reaction, suggesting increased heterogeneity, and a decrease in the GQ-13# sample’s width, suggesting reduced heterogeneity. The GQ-11# sample’s spectrum width showed no significant change before and after the reaction.
Figure 6c,d illustrate the τ(q) versus q relationship for the samples before and after the reaction. When q < 0, τ(q) exhibits a notable rise as the multifractal order increases; in contrast, the rate of increase slows down for q > 0. The divergent trends on either side of q = 0 in the multifractal quality index spectrum suggest that the coal samples’ PSD exhibits multifractal traits throughout the reaction process. The τ(q)-q curve morphologies of the three samples remain consistent before and after the reaction, exhibiting broad branches for q < 0 that represent sparse regions of low pore volume. The enhanced variability observed in the left segment of the curve, as opposed to the right segment, indicates higher heterogeneity within the finer PSD, which is consistent with the data from the PSD curve.
Figure 6e,f display the multifractal singularity spectra for coal samples before and after the reaction. The relationship between f(α) and singularity strength α displays a parabolic symmetry that opens downward. The f(α)-α spectrum’s varying symmetry suggests multifractal characteristics in the PSD across the testing range. For q < 0, f(α) increases significantly with rising singularity strength α. Conversely, for q > 0, f(α) trends downward as singularity strength α increases. Prior research indicates that the singularity strength range (Δα), from αmax to αmin, informs on PSD complexity and heterogeneity [39]. A Δα greater than zero for the samples signifies robust multifractal characteristics in the coal’s pore structure throughout the reaction process [40]. The parameter α0 reflects the concentration degree of the PSD, with higher values indicating greater local pore aggregation. Before the reaction, the α0 values of three samples were considerably higher than the values after the reaction, suggesting that the ScCO2–water–rock reaction decreased the aggregation degree of mesopores in the N2 testing range.

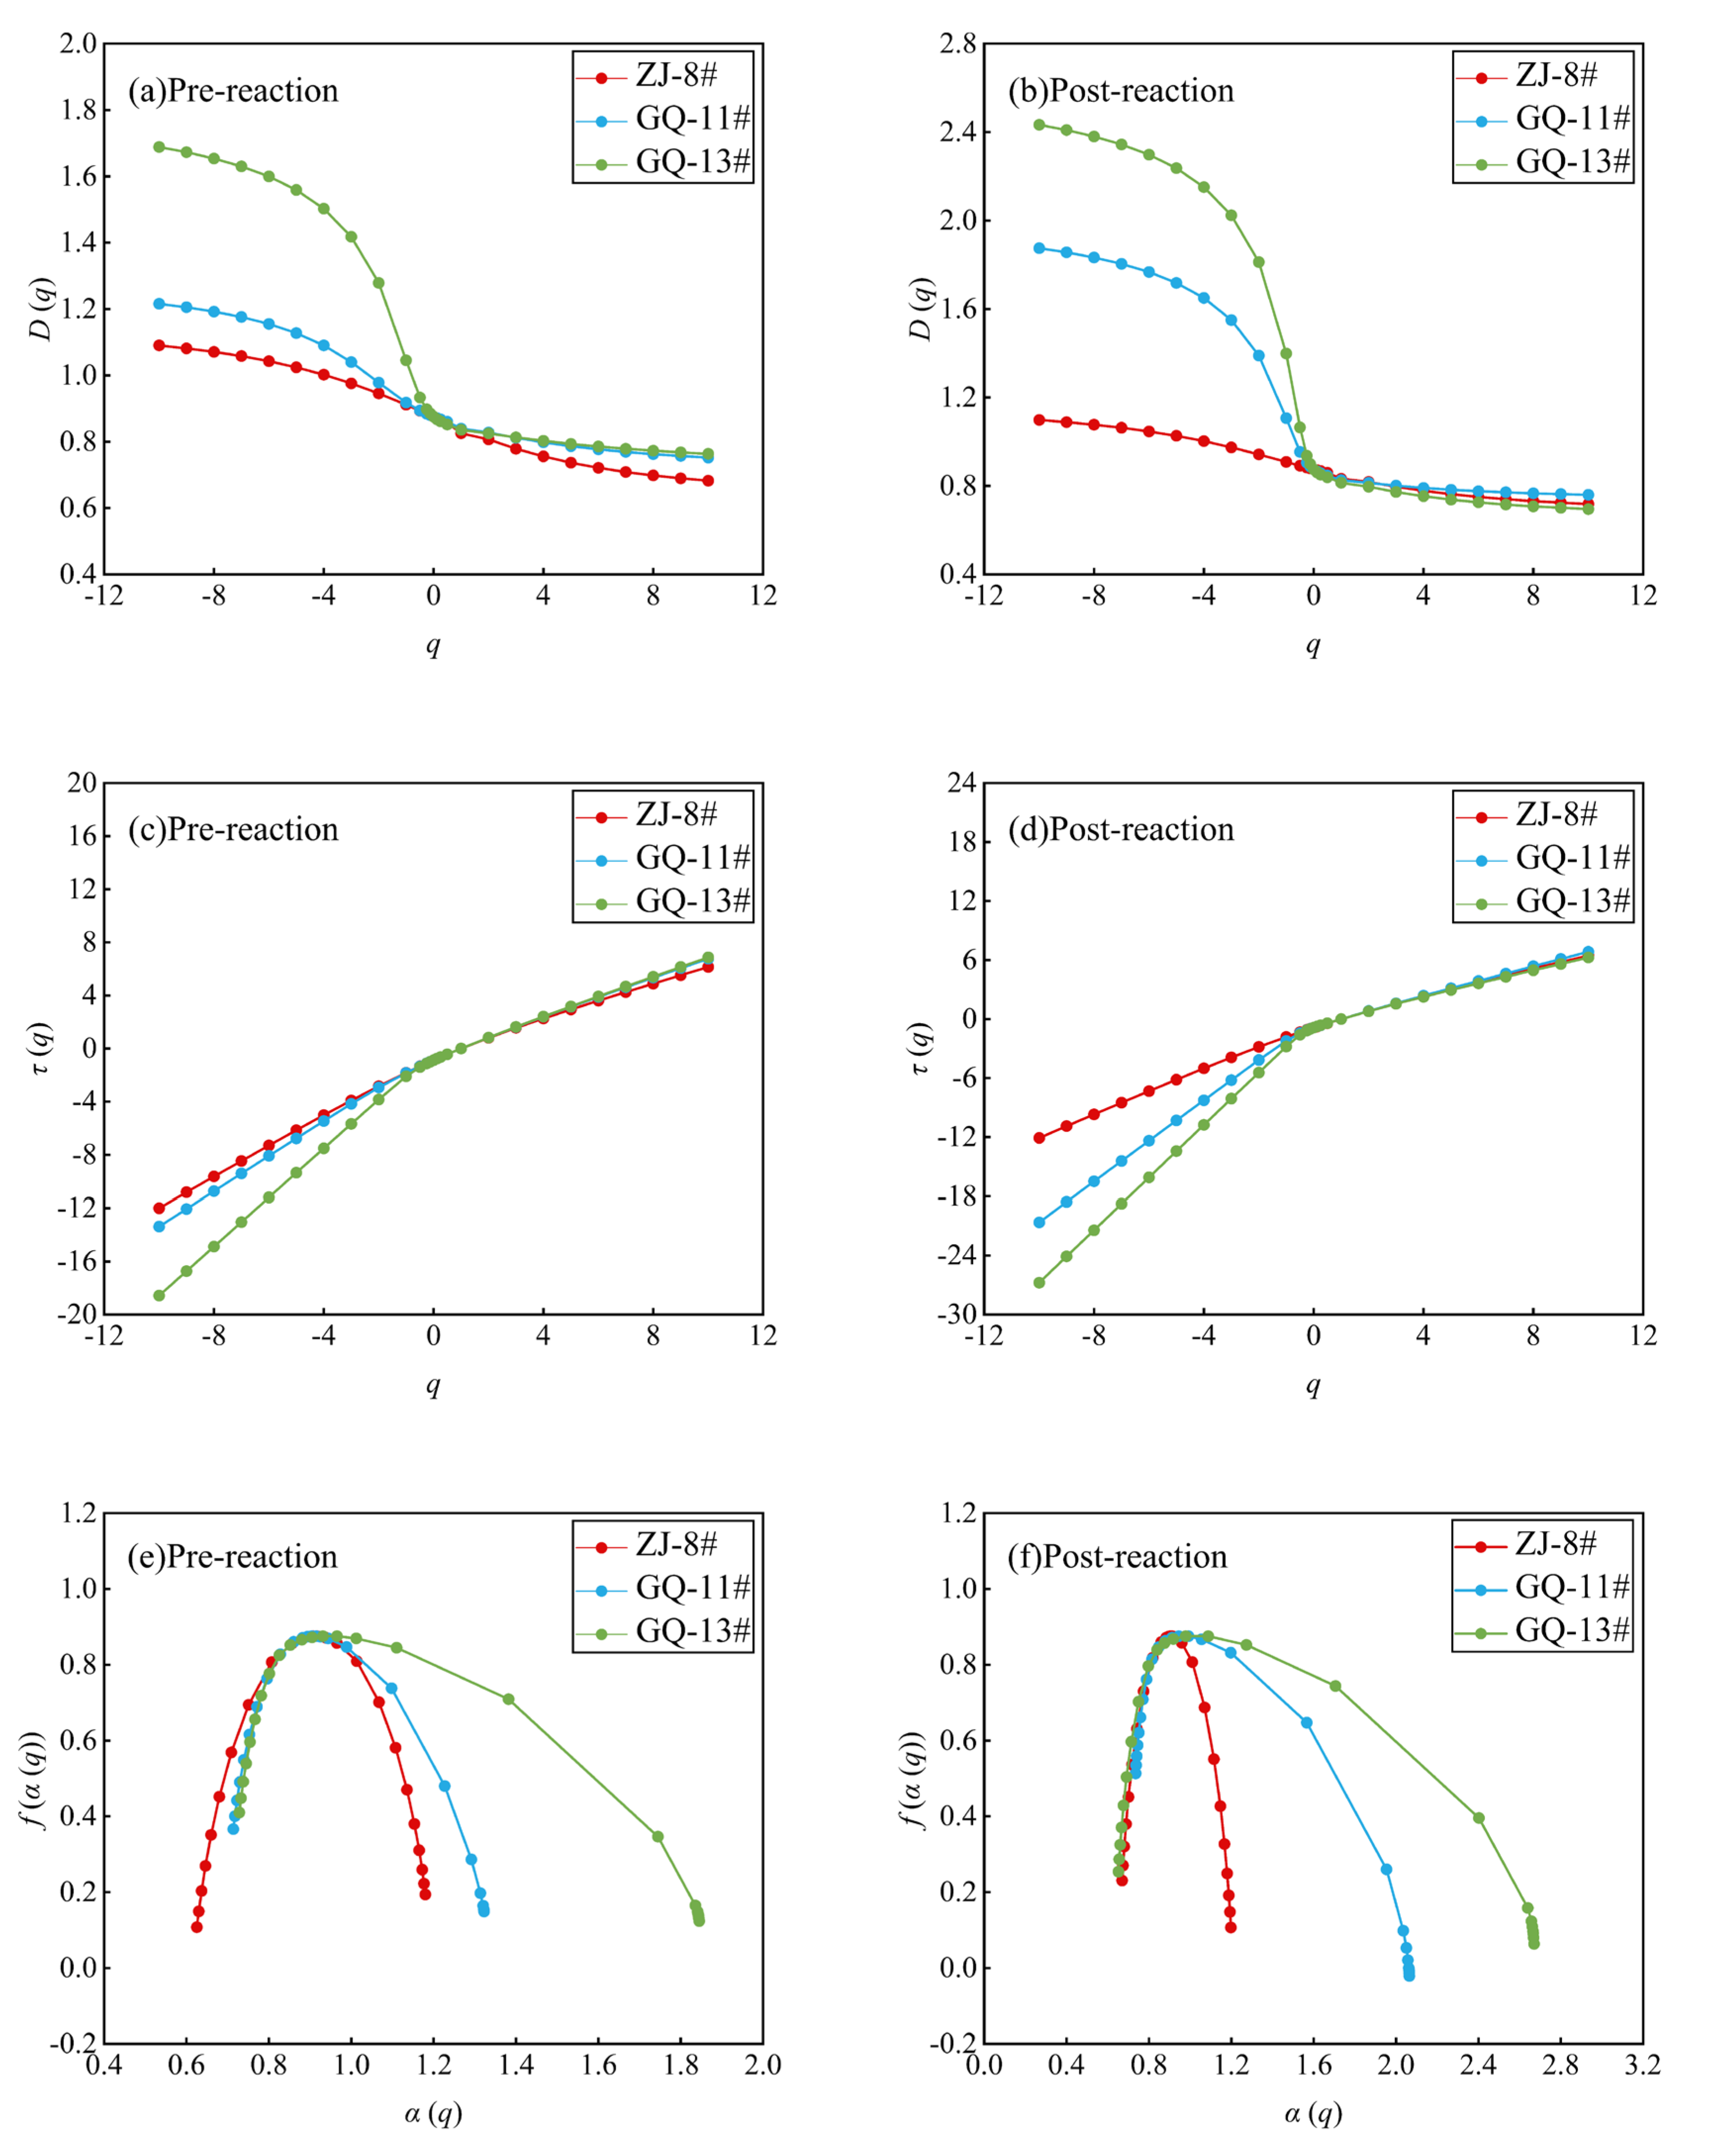
3.3.2. The Low-Temperature CO2 Multifractal Characteristics

Table 7 and Table 8 present parameter calculations from low-temperature CO2 tests on coal samples, both before and after the reaction. The D0 > D1 > D2 inequality, observed before and after the reaction, signifies the pronounced multifractal nature of the coal samples’ PSD. For the generalized multifractal dimension spectrum breadth (D-10 to D10), the GQ-11# and GQ-13# samples show a notable increase after the reaction, while the ZJ-8# sample’s spectrum width experienced a slight decrease. The change in multifractal dimension implies that the micropore heterogeneity of samples GQ-11# and GQ-13# increased but the micropore unevenness of sample ZJ-8# reduced throughout the reaction.
The left spectrum width (D−10 to D0) and the right spectrum width (D0 to D10) disclose characteristics of regions with low and high pore volumes, respectively. Figure 5 shows that micropores are most voluminous between 0.45 and 0.70 nm, exceeding volumes in the 0.70 to 1.4 nm range. Thus, the left and right spectrum widths represent heterogeneity in the 0.7 to 1.4 nm and 0.45 to 0.70 nm pore size ranges.
Figure 7a,b depict the Dq versus q relationship for PSD, as determined by low-temperature CO2 testing, both before and after the reaction. The figures reveal a consistently greater left spectrum width compared to the right for all samples, signifying higher heterogeneity in the 0.45 to 0.70 nm range relative to the 0.70 to 1.08 nm range.
Figure 7c,d show the τ(q) versus q relationship for coal samples in both pre- and post-reaction states. The distinct trends on either side of q = 0 in the multifractal quality index spectrum suggest multifractal characteristics in the coal samples’ PSD throughout the reaction process. The τ(q)-q curve’s left–wide, right–narrow shape indicates greater heterogeneity in the distribution of smaller pores across the characterized diameter range, both before and after the reaction. This finding aligns with the patterns observed in the Dq-q curve diagrams.
Figure 7e,f display the multifractal singularity spectra for coal samples, before and after the reaction. The f(α) versus singularity strength α analysis reveals a parabolic symmetry that opens downward. For q < 0, f(α) increases significantly with the singularity strength α. Alternatively, for q > 0, f(α) trends downward as the singularity strength α increases. The ZJ-8# sample shows negligible Δα change, whereas the GQ-11# and GQ-13# samples exhibit a significant increase after the reaction. The changes in the α0 values of the three samples before and after the reaction all fall within a range of 0.013, implying no significant change in micropore aggregation after-ScCO2–water–rock reaction within the CO2 testing range.

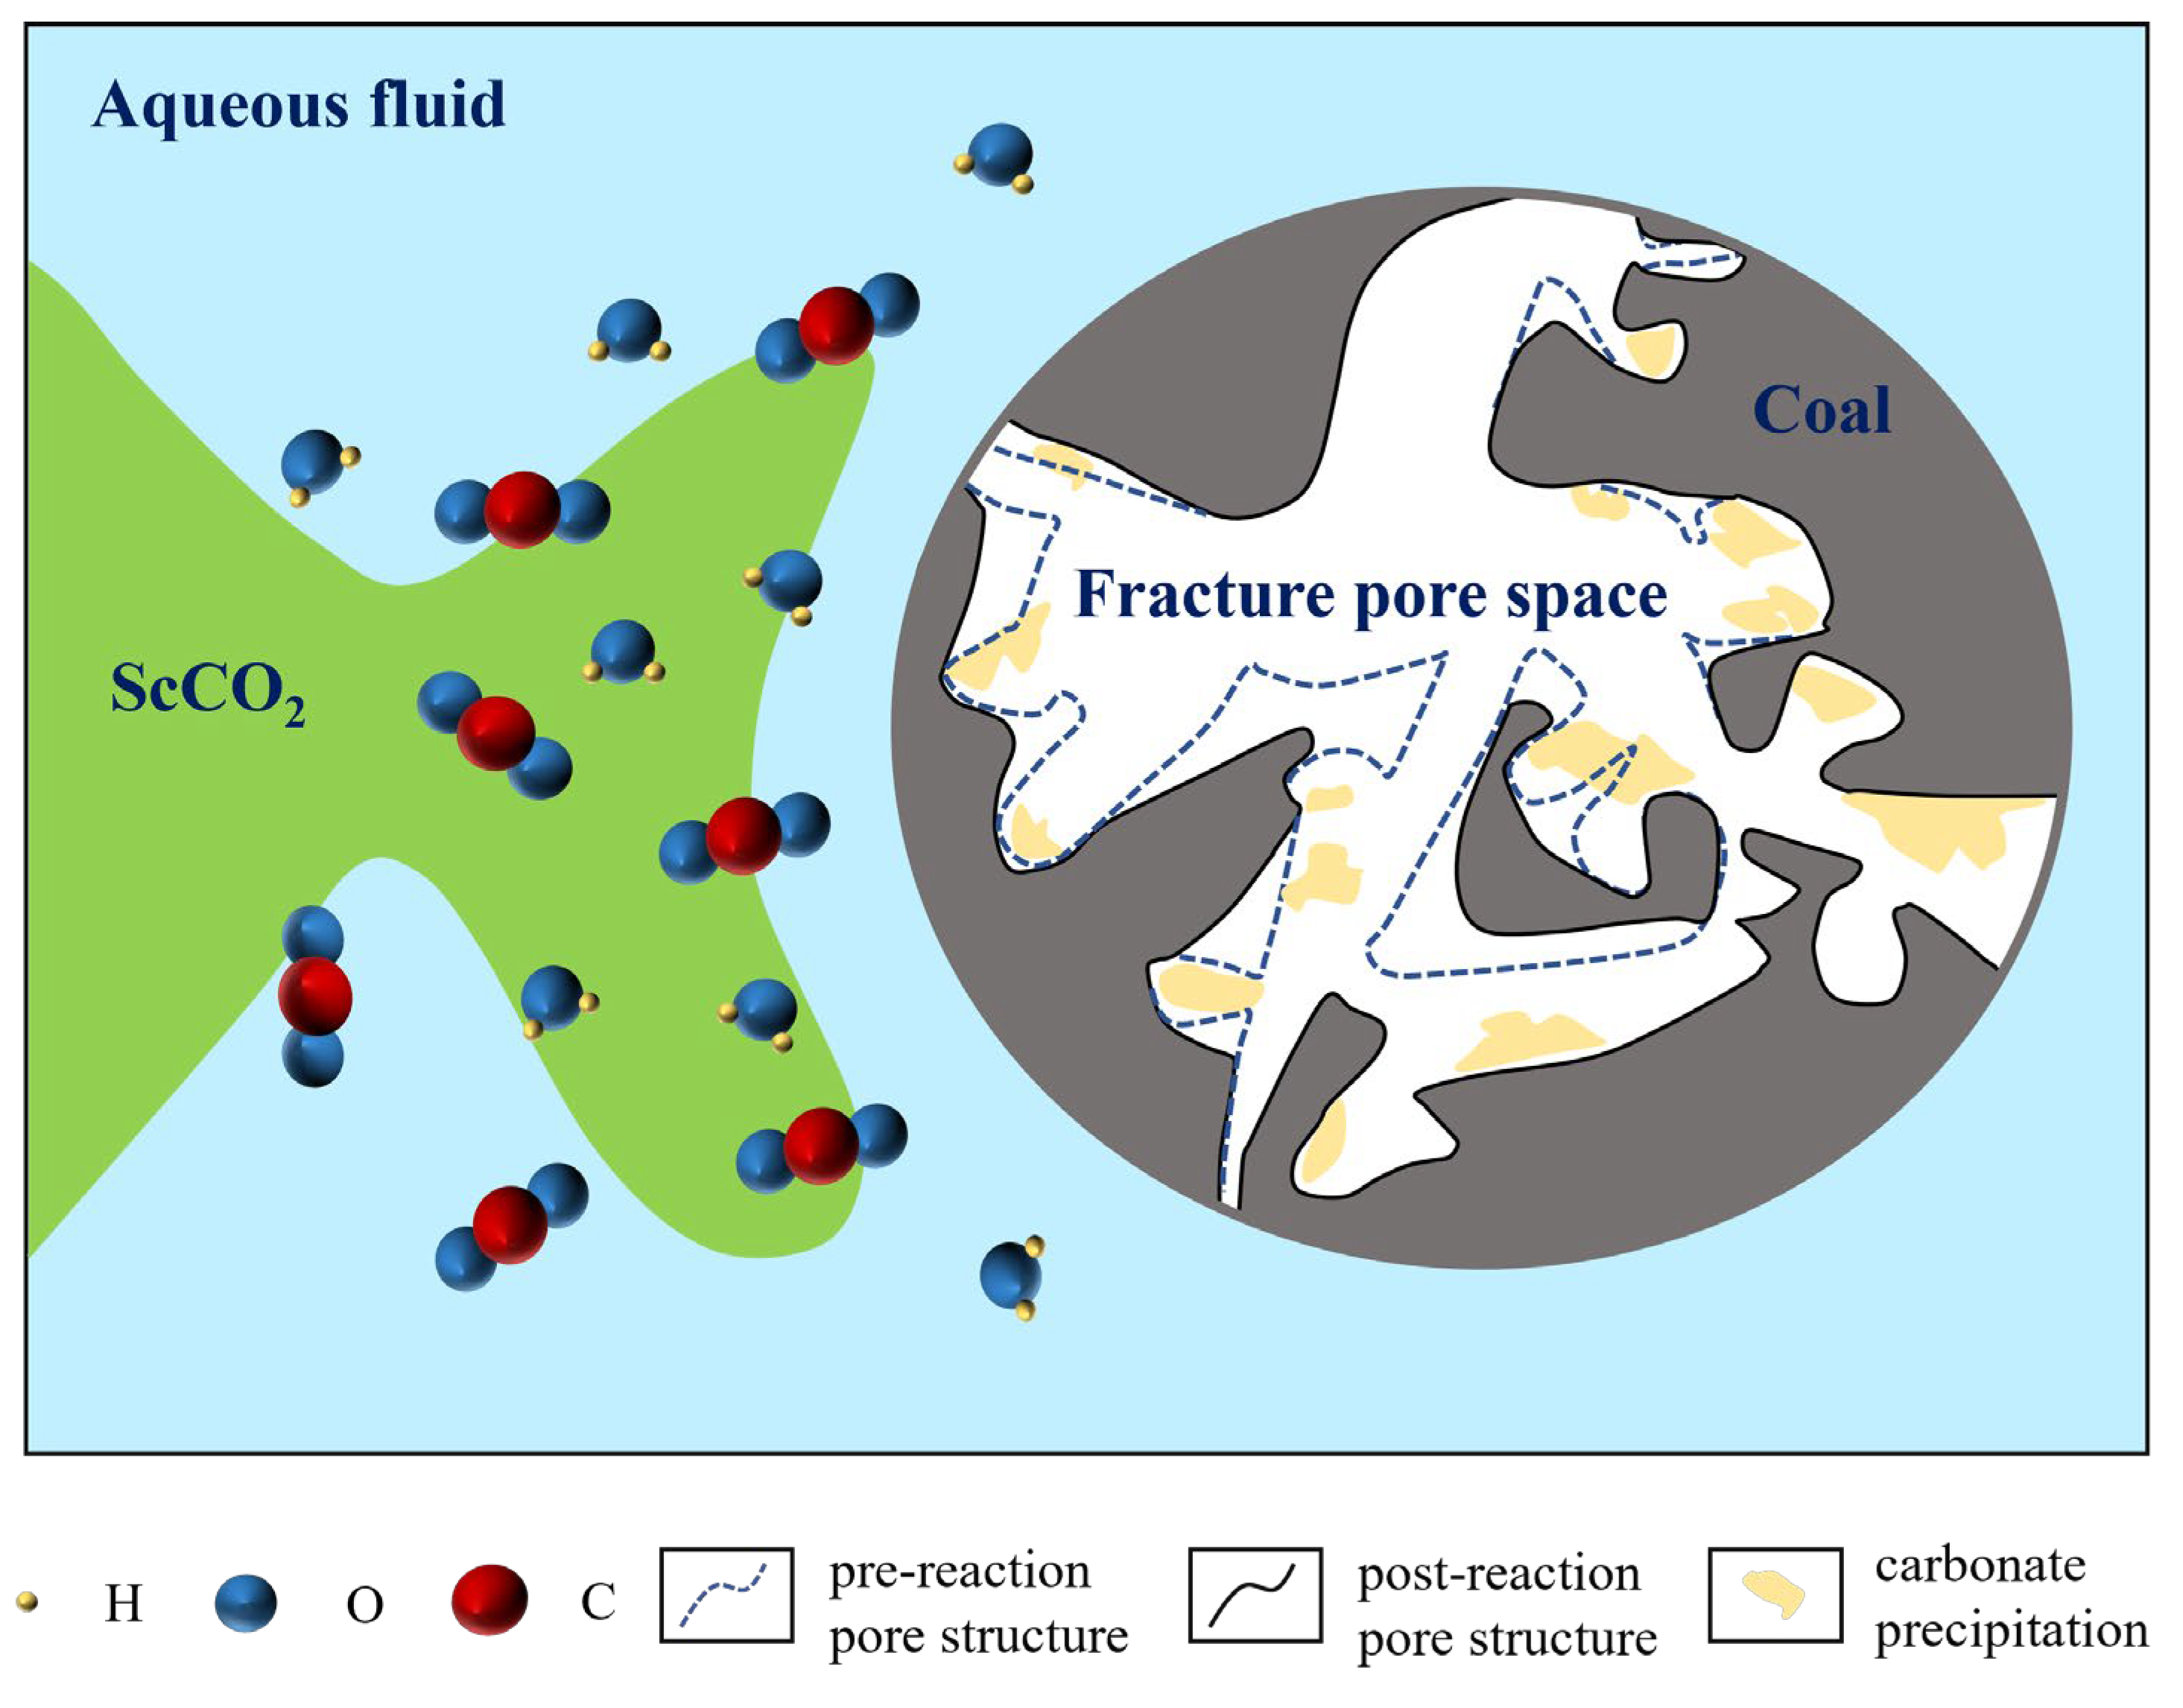
3.4. Mechanisms of Pore Structure Modification in Coal Reservoirs by Supercritical CO2–Water–Rock Interactions

Integrating low-temperature N2 sorption data with multifractal analysis outcomes, we aim to provide a comprehensive characterization of the microporous structure’s evolution in coal reservoirs before and after the reaction. Notably, the ZJ-8# specimen exhibited an increase in micropore volume without significant changes in total pore volume, yet there was a significant increase in total specific surface area. This suggests a possible increase in the number of micropores, potentially due to the heterogeneous effects of ScCO2–water–rock interactions, leading to a more complex pore network and increased sample heterogeneity. For the GQ-11# specimen, it is hypothesized that carbonate precipitates formed during the reaction may have occluded some micropores, resulting in a decrease in specific surface area. Concurrently, it is possible that macropores and mesopores may have expanded or formed new pores, maintaining the total pore volume unchanged. The overall heterogeneity of the GQ-11# specimen remained stable, signifying that the intricacy within the pores before and after the reaction was quantitatively comparable. As for the GQ-13# sample, there was no significant change in this sample’s micropore volume after the reaction, despite a decrease in total pore volume and an increase in total specific surface area. It is hypothesized that carbonate precipitates from the reaction may have sealed some mesopores or macropores in the GQ-13# sample, or thickened the pore walls, resulting in a decreased total pore volume. At the same time, such changes in the pore walls may have increased the specific surface area, and the originally non-connected micropores may have formed new small connecting channels due to dissolution, which corresponds to the D1 value of the GQ-13# sample showing a measurable increase post-reaction.
Integrating low-temperature CO2 sorption data with multifractal analysis results allows us to clarify the changes in the microporous structure of coal samples following ScCO2–water–rock interactions. Specifically, after the ZJ-8# sample underwent ScCO2–water–rock interactions, there was a slight reduction in its specific surface area and average pore diameter, despite the micropore volume remaining unchanged. In conjunction with the results from multifractal analysis, which indicated a decrease in the heterogeneity within the pores, it is hypothesized that the dissolution effect of the ScCO2–water–rock reaction altered the connectivity of the pores. Previously isolated micropores may have become more interconnected, leading to an increase in the volume of transition pores, mesopores, and macropores, while the volume of micropores decreased. This resulted in a slight decrease in specific surface area. Additionally, such changes may have contributed to a reduction in the heterogeneity of the pore structure, as the increase in larger pores and transition pores may have led to a more homogenized pore structure. Similarly, the GQ-11# sample shows an increase in micropore volume and specific surface area, as evidenced by CO2 sorption test results. We propose that this enhancement is attributable to the expansion of micropores via dissolution processes occurring during the ScCO2–water–rock reaction, with the heightened heterogeneity being a consequence of the reaction’s spatial heterogeneity. Concurrently, the GQ-13# sample retains its total micropore volume but displays an increase in micropore specific surface area, suggesting a diversification of micropore shapes and sizes after the reaction, thereby enhancing pore heterogeneity.
In summary, the ScCO2–water–rock reaction exerts a dual effect of precipitation and dissolution on the pores of coal reservoirs. It not only results in the enlargement of existing pores or the formation of new fractures but also leads to the precipitation of carbonates, which can obstruct the original pores. Furthermore, the outcomes of multifractal analysis provide additional insights, indicating that the ScCO2–water–rock reactions occur heterogeneously within the pores (Figure 8).

4. Conclusions

In this research, we evaluated coal samples prior to and following the ScCO2–water–rock reaction, conducting low-temperature N2 and CO2 tests, and subsequently performed multifractal analysis on the derived PSD. The subsequent findings are summarized:
(1)
The low-temperature N2 and CO2 testing offers a comprehensive characterization of coal’s small-scale pore structure features. The ScCO2–water–rock reaction minimally alters coal pore morphology, primarily influencing pore abundance. Specifically, the ZJ-8# sample’s micropore volume increases and its micropore–mesopore distribution becomes more complex under N2 testing conditions. In contrast, the GQ-11# sample experiences a reduction in micropore volume and count, whereas the GQ-13# sample shows no significant change in micropore volume. Within the CO2 sorption testing range, the ZJ-8# sample’s PSD remains largely unchanged before and after the reaction. The GQ-11# and GQ-13# samples display increased micropore abundance, with the GQ-11# sample exhibiting more pronounced micropore development after the reaction.
(2)
The pore size distributions from low-temperature N2 and CO2 sorption experiments reveal multifractal behavior. After the ScCO2–water–rock reaction, N2 testing of multifractal parameters showed a decrease in heterogeneity for the GQ-13# sample, an increase for the ZJ-8# sample, and no significant change for the GQ-11# sample. Moreover, the aggregation degree of mesopores across the N2 testing range decreased uniformly across all samples. CO2 sorption testing multifractal parameters indicated no significant heterogeneity change for the ZJ-8# sample after the reaction, yet a notable increase for the GQ-11# and GQ-13# samples. Pore heterogeneity was more pronounced in the 0.45 to 0.70 nm range compared to the 0.70 to 1.08 nm range for all samples.
(3)
The ScCO2–water–rock reaction exerts complex and varied effects on coal samples. Findings from low-temperature N2/CO2 sorption tests and multifractal analysis have unveiled the dual effects of precipitation and dissolution in ScCO2–water–rock interactions with coal reservoir micropores. These interactions not only lead to the enlargement of existing pores or the formation of new fractures but also result in the precipitation of carbonates that may block the original pores. Furthermore, the analysis of multifractal-related parameters before and after the reaction confirms that the reaction occurs heterogeneously within the pores. Grasping the mechanisms underlying the ScCO2–water–rock interaction is essential for comprehending the intricate changes within the microstructure of coal during CO2 sequestration.
(4)
Our work introduces a novel approach to characterizing coal pore structures by integrating low-temperature N2/CO2 adsorption with multifractal theory, revealing significant alterations in pore size distribution and multifractal characteristics. However, the method cannot dynamically describe the changes in coal pores throughout the entire process of ScCO2–water–rock reactions. Future research should prioritize the application of advanced techniques, such as low-field NMR testing, to elucidate the dynamic changes in coal pore structures throughout the reaction process. Additionally, integrating experimental data with numerical simulations will offer a more holistic and comprehensive understanding of the underlying mechanisms.

Author Contributions

Conceptualization, S.Z.; methodology, S.L.; software, X.D.; formal analysis, Y.L.; investigation, S.Z.; data curation, F.H.; writing—original draft preparation, S.Z.; visualization, S.S.; and M.W.; supervision. All authors have read and agreed to the published version of the manuscript.

Funding

We acknowledge financial support from the National Natural Science Foundation of China (No. 42302194, 42141012), the Natural Science Foundation of Jiangsu Province, China (No. BK20231084, BK20231503), the Applied Basic Research Programs of Xuzhou, China (No. KC23001), and the Fundamental Research Funds for the Central Universities (No. 2023KYJD1001, 2024KYJD2004).

Data Availability Statement

The raw data supporting the conclusions of this article will be made available by the authors on request.

Conflicts of Interest

The authors declare that they have no known competing financial interests or personal relationships that could have appeared to influence the work reported in this paper.

References

  1. Cusworth, D.H.; Duren, R.M.; Thorpe, A.K.; Eastwood, M.L.; Green, R.O.; Dennison, P.E.; Frankenberg, C.; Heckler, J.W.; Asner, G.P.; Miller, C.E. Quantifying global power plant carbon dioxide emissions with imaging spectroscopy. AGU Adv. 2021, 2, e2020AV000350. [Google Scholar] [CrossRef]
  2. Qi, S.; Zheng, B.; Wang, Z.; Zhao, H.; Cui, Z.; Huang, T.; Guo, S.; Fu, L.; Dong, P. Geological evaluation for the carbon dioxide geological utilization and storage (CGUS) site: A review. Sci. China Earth Sci. 2023, 66, 1917–1936. [Google Scholar] [CrossRef]
  3. Yekeen, N.; Khan, J.A.; Ali, M.; Elraies, K.A.; Okunade, O.A.; Ridha, S.; Al-Yaseri, A. Impact of nanoparticles–surfactant solutions on carbon dioxide and methane wettabilities of organic-rich shale and CO2/brine interfacial tension: Implication for carbon geosequestration. ER 2022, 8, 15669–15685. [Google Scholar] [CrossRef]
  4. Raza, A.; Gholami, R.; Rezaee, R.; Rasouli, V.; Rabiei, M. Significant aspects of carbon capture and storage—A review. Petroleum 2019, 7, 335–340. [Google Scholar] [CrossRef]
  5. Yao, Y.; Wang, F.; Liu, D.; Sun, X.; Wang, H. Quantitative characterization of the evolution of in-situ adsorption/free gas in deep coal seams: Insights from NMR fluid detection and geological time simulations. Int. J. Coal Geol. 2024, 285, 104474. [Google Scholar] [CrossRef]
  6. Liu, D.; Zhao, Z.; Cai, Y.; Sun, F. Characterizing coal gas reservoirs: A multiparametric evaluation based on geological and geophysical methods. Gondwana Res. 2024, 133, 91–107. [Google Scholar] [CrossRef]
  7. Liu, D.; Yao, Y.; Chang, Y. Measurement of adsorption phase densities with respect to different pressure: Potential application for determination of free and adsorbed methane in coalbed methane reservoir. Chem. Eng. J. 2022, 446, 137103. [Google Scholar] [CrossRef]
  8. Omotilewa, O.J.; Panja, P.; Vega-Ortiz, C.; McLennan, J. Evaluation of en-hanced coalbed methane recovery and carbon dioxide sequestration potential in high volatile bituminous coal. J. Nat. Gas. Sci. Eng. 2021, 91, 103979. [Google Scholar] [CrossRef]
  9. Zhou, Y.; Zhang, R.; Wang, J.; Huang, J.; Li, X.; Wu, J. Desorption hysteresis of CO2 and CH4 in different coals with cyclic desorption experiments. J. CO2 Util. 2020, 40, 101200. [Google Scholar] [CrossRef]
  10. Vasilenko, T.A.; Kirillov, A.K.; Molchanov, A.N.; Pronskii, E.A. An NMR study of the ratio between free and sorbed methane in the pores of fossil coals. Solid Fuel Chem. 2018, 52, 361–369. [Google Scholar] [CrossRef]
  11. Akhondzadeh, H.; Keshavarz, A.; Awan, F.; Awan, F.U.R.; Zamani, A.; Iglauer, S.; Lebedev, M. Coal cleat network evolution through liquid nitrogen freeze-thaw cycling. Fuel 2022, 314, 123069. [Google Scholar] [CrossRef]
  12. Mejia-Ballesteros, J.E.; Savastano, H., Jr.; Fiorelli, J.; Rojas, M.F. Effect of mineral additions on the microstructure and properties of blended cement matrices for fiber-cement applications. Cem. Concr. Compos. 2019, 98, 49–60. [Google Scholar] [CrossRef]
  13. Youjun, J.; Vafai, K. Analysis of pore scale fluid migration in a porous medium-application to coal rock seam. Int. J. Numer. Methods Heat Fluid Flow 2017, 27, 1706–1719. [Google Scholar] [CrossRef]
  14. Qi, L.; Zhou, X.; Peng, X.; Chen, X.; Wang, Z.; An, F. Study on the difference of pore structure of anthracite under different particle sizes using low-temperature nitrogen adsorption method. Environ. Sci. Pollut. Res. 2023, 30, 5216–5230. [Google Scholar] [CrossRef] [PubMed]
  15. Zhang, S.; Tian, H.; Tang, J.; Zhang, X. Quantitative Characterization of Coal Shale Pores and Fractures Based on Combined High-Pressure Mercury Pressure and Low-Temperature N2/CO2 Adsorption Methods. ACS Omega 2024, 9, 20927–20936. [Google Scholar] [CrossRef] [PubMed]
  16. Li, X.; Kang, Y.; Haghighi, M. Investigation of pore size distributions of coals with different structures by nuclear magnetic resonance (NMR) and mercury intrusion porosimetry (MIP). Measurement 2018, 116, 122–128. [Google Scholar] [CrossRef]
  17. Vranjes-Wessely, S.; Misch, D.; Issa, I.; Kiener, D.; Fink, R.; Seemann, T.; Liu, B.; Rantitsch, G.; Sachsenhofer, R.F. Nanoscale pore structure of Carboniferous coals from the Ukrainian Donets Basin: A combined HRTEM and gas sorption study. Int. J. Coal Geol. 2020, 224, 103484. [Google Scholar] [CrossRef]
  18. Shen, M.; Chen, X. Influence rules and mechanisms of mechanical vibration at different frequencies on dynamic process of gas diffusion from coal particles. Energy Explor. Exploit. 2021, 39, 1939–1957. [Google Scholar] [CrossRef]
  19. Xu, Y.; Chen, X.; Zhao, W.; Chen, P. Effect of water intrusion on the characteristics of surface morphology and pore fracture spaces in argillaceous meagre coal. J. Nat. Gas. Sci. Eng. 2020, 81, 103404. [Google Scholar] [CrossRef]
  20. Li, F.; Jiang, B.; Song, Y.; Cheng, G.; Lu, G. Multifractal behavior of the micro- and mesopore structures of brittle tectonically deformed coals and its influence on methane adsorption capacity. Energy Fuel 2021, 35, 3042–3064. [Google Scholar] [CrossRef]
  21. Gould, D.; Vadakkan, T.; Poché, R.; Dickinson, M. Multifractal and Lacunarity analysis of microvascular morphology and remodeling. Microcirculation 2011, 18, 136–151. [Google Scholar] [CrossRef] [PubMed]
  22. Zhang, C.; Bai, Q.; Zhu, C. A methodology for determining the size distribution of broken rock masses in longwall mining goaf. Geomech. Geophys. Geo-Energy Geo-Resour. 2022, 8, 113. [Google Scholar] [CrossRef]
  23. Bu, H.; Ju, Y.; Tan, J.; Wang, G.; Li, X. Fractal characteristics of pores in nonmarine shales from the Huainan coalfield, eastern China. J. Nat. Gas Sci. Eng. 2015, 24, 166–177. [Google Scholar] [CrossRef]
  24. Zheng, S.; Yao, Y.; Liu, D.; Cai, Y.; Liu, Y. Characterizations of full-scale pore size distribution, porosity and permeability of coals: A novel methodology by nuclear magnetic resonance and fractal analysis theory. Int. J. Coal Geol. 2018, 196, 148–158. [Google Scholar] [CrossRef]
  25. Zhang, M.; Zhang, Q.; Li, G.; Fu, X.; Duan, C.; Liu, H.; Xu, H. Fluid distribution and pore structure multifractal characteristics analysis of coal measure mudstone. J. Nat. Gas. Sci. Eng. 2021, 88, 103810. [Google Scholar]
  26. Chen, X.; Yao, G.; Cai, J.; Huang, Y.; Yuan, X. Fractal and multifractal analysis of different hydraulic flow units based on micro-CT images. J. Nat. Gas Sci. Eng. 2017, 48, 145–156. [Google Scholar] [CrossRef]
  27. Zhang, S.; Liu, H.; Jin, Z.; Wu, C. Multifractal analysis of pore structure in middle-and high-rank coal by mercury intrusion porosimetry and low-pressure N2 adsorption. Nat. Resour. Res. 2021, 30, 4565–4584. [Google Scholar] [CrossRef]
  28. Zhu, J.; Liu, J.; Yang, Y.; Cheng, J.; Zhou, J.; Cen, K. Fractal characteristic of pore structures in 13 coal specimens Relationship among fractal dimension, pore structure parameter, and slurry ability of coal. Fuel Process. Technol. 2016, 149, 256–267. [Google Scholar] [CrossRef]
  29. Zheng, S.; Yao, Y.; Liu, D.; Cai, Y.; Liu, Y. Nuclear magnetic resonance surface relaxivity of coals. Int. J. Coal Geol. 2019, 205, 1–13. [Google Scholar] [CrossRef]
  30. Zheng, S.; Sang, S.; Yao, Y.; Liu, D.; Liu, S.; Wang, M.; Feng, G. A multifractal-based method for determination NMR dual T2 cutoffs in coals. J. Petrol. Sci. Eng. 2022, 214, 110488. [Google Scholar] [CrossRef]
  31. Fang, J.; Li, Q.; Yin, T.; Cai, Y. Investigation on the Nanopore Heterogeneity in Coals and its Influence on Methane Adsorption: A Multifractal Theory Study. ACS Omega 2024, 9, 19504–19516. [Google Scholar] [CrossRef] [PubMed]
  32. Vasilenko, T.; Kirillov, A.; Islamov, A.; Doroshkevich, A.; Łudzik, K.; Chudoba, D.M.; Mita, C. Permeability of a coal seam with respect to fractal features of pore space of fossil coals. Fuel 2022, 329, 125113. [Google Scholar] [CrossRef]
  33. GB/T 19222-2003; General Administration of Quality Supervision, Inspection and Quarantine of the People’s Republic of China, National Standardization Administration. Sampling of Coal Petrology. Standards Press of China: Beijing, China, 2003.
  34. GB/T 16773-2008; General Administration of Quality Supervision, Inspection and Quarantine of the People’s Republic of China, National Standardization Administration. Method of Preparing Coal Samples for the Coal Petrographic Analysis. Standards Press of China: Beijing, China, 2009.
  35. GB/T 21650.3-2011; General Administration of Quality Supervision, Inspection and Quarantine of the People’s Republic of China, National Standardization Administration. Pore Size Distribution and Porosity of Solid Materials by Mercury Porosimetry and Gas Adsorption—Part 3: Analysis of Micropores by Gas Adsorption. Standards Press of China: Beijing, China, 2012.
  36. Li, W.; Liu, H.; Song, X. Multifractal analysis of Hg pore size distributions of tectonically deformed coals. Int. J. Coal Geol. 2015, 144, 138–152. [Google Scholar] [CrossRef]
  37. Zhao, Y.; Zhu, G.; Dong, Y.; Danesh, N.; Chen, Z.; Zhang, T. Comparison of low-field NMR and microfocus X-ray computed tomography in fractal characterization of pores in artificial cores. Fuel 2017, 210, 217–226. [Google Scholar] [CrossRef]
  38. Zheng, S.; Yao, Y.; Liu, D.; Cai, Y.; Liu, Y.; Li, X. Nuclear magnetic resonance T2 cutoffs of coals: A novel method by multifractal analysis theory. Fuel 2019, 241, 715–724. [Google Scholar] [CrossRef]
  39. Zhang, M.; Duan, C.; Li, G.; Fu, X.; Zhong, Q.; Liu, H.; Dong, Z. Determinations of the multifractal characteristics of the pore structures of low-, middle-, and high-rank coal using high-pressure mercury injection. J. Pet. Sci. Eng. 2021, 203, 108656. [Google Scholar] [CrossRef]
  40. Li, Q.; Liu, D.; Cai, Y.; Zhou, Y.; Yin, T. Investigation on the methane adsorption capacity in coals: Considerations from nanopores by multifractal analysis. Energy Fuels 2021, 35, 6633–6643. [Google Scholar] [CrossRef]
Figure 1. Schematic of the ScCO2–water–rock experimental process.
Fractalfract 09 00144 g001
Figure 2. Low-temperature N2 sorption isotherms of the samples before and after the ScCO2–water–rock reaction. (a) presents the low-temperature nitrogen adsorption isotherm of the ZJ-8# sample before the SCCO2—water—rock reaction, (b) shows the isotherm after the reaction, (c) displays the isotherm of the GQ-11# sample before the reaction, (d) illustrates the isotherm after the reaction, (e) provides the isotherm of the GQ-13# sample before the reaction, and (f) depicts the isotherm after the reaction.
Fractalfract 09 00144 g002
Figure 3. PSD of the samples from low-temperature N2 testing before and after the ScCO2–water–rock reaction. (a) presents the PSD of the samples from low-temperature N2 testing before and after the ScCO2–water–rock reaction of sample ZJ-8#; (b) presents the PSD of the samples from low-temperature N2 testing before and after the ScCO2–water–rock reaction of sample GQ-11#; (c) presents the PSD of the samples from low-temperature N2 testing before and after the ScCO2–water–rock reaction of sample GQ-13#.
Fractalfract 09 00144 g003
Figure 4. Isothermal adsorption lines from low-temperature CO2 testing before and after the ScCO2–water–rock reaction. (a) presents the isothermal adsorption lines from low-temperature CO2 testing before the ScCO2–water–rock reaction; (b) presents the isothermal adsorption lines from low-temperature CO2 testing after the ScCO2–water–rock reaction.
Fractalfract 09 00144 g004
Figure 5. PSD from low-temperature CO2 testing before and after the ScCO2–water–rock reaction. (a) presents the PSD from low-temperature CO2 testing before and after the ScCO2–water–rock reaction of sample ZJ-8#; (b) presents the PSD from low-temperature CO2 testing before and after the ScCO2–water–rock reaction of sample GQ-11#; (c) presents the PSD from low-temperature CO2 testing before and after the ScCO2–water–rock reaction of sample GQ-13#.
Fractalfract 09 00144 g005
Figure 6. Multifractal parameter plots from N2 testing before and after the ScCO2–water–rock reaction. (a) presents the multifractal q-Dq spectrum of the pore size distribution for the ZJ-8# sample prior to the SCCO2—water—rock reaction, (b) shows the spectrum for the same sample after the reaction, (c) displays the multifractal τ(q)-q spectrum of the pore size distribution for the GQ-11# sample before the reaction, (d) illustrates the spectrum after the reaction, (e) provides the multifractal f(α)-α spectrum of the pore size distribution for the GQ-13# sample before the reaction, and (f) depicts the spectrum after the reaction.
Fractalfract 09 00144 g006
Figure 7. Multifractal parameters from CO2 testing before and after the ScCO2–water–rock reaction. (a) presents the multifractal q-Dq spectrum of the pore size distribution for the ZJ-8# sample prior to the SCCO2—water—rock reaction, (b) shows the spectrum for the same sample after the reaction, (c) displays the multifractal τ(q)-q spectrum of the pore size distribution for the GQ-11# sample before the reaction, (d) illustrates the spectrum after the reaction, (e) provides the multifractal f(α)-α spectrum of the pore size distribution for the GQ-13# sample before the reaction, and (f) depicts the spectrum after the reaction.
Fractalfract 09 00144 g007
Figure 8. The evolution of coal’s micropore structure during the ScCO2 fluid reaction process.
Fractalfract 09 00144 g008
Table 1. Fundamental petrophysical information of the coal samples.
Sample No.Proximate Analysis (%)Porosity
(%)
Ro
(%)
Maceral Composition (%)
MadAdVdFCdVIEM
ZJ-8#1.2416.5932.7950.632.360.74894.24.11.70.0
GQ-11#1.0514.4733.851.722.550.67588.98.52.50.1
GQ-13#1.2820.9927.5251.491.140.62194.24.21.60.0
Notes: Mad = moisture content in air-dry basis; Ad = ash yield in dry basis; Vd = volatile yield in dry-ash-free basis; FCd = fixed carbon content in air-dry basis; Ro = vitrinite reflectance in oil immersion; V = vitrinite; I = inertinite; E = exinite; M = minerals.
Table 2. Experimental conditions for CO2–water–rock interaction.
Sample IDBurial Depth (m)Temperature (K)Pressure (MPa)Time (d)
ZJ-8#60030577
GQ-11#70030887
GQ-13#80030887
Table 3. Mesopore structure parameters of the samples before and after the reaction according to low-temperature N2 sorption experiment.
Sample No.BET Specific
Surface Area (m2/g)
BJH Pore Volume
(mL/g)
Pore Diameter Dv (d)
(nm)
Before
reaction
ZJ-8#0.1960.0023.812
GQ-11#0.370.0023.819
GQ-13#0.7130.0063.823
After
reaction
ZJ-8#0.3850.0023.808
GQ-11#0.2010.0023.402
GQ-13#1.1070.0033.822
Table 4. Micropore structure parameters of the samples before and after the reaction according to low-temperature CO2 sorption experiment.
Sample No.Surface Area
(m2/g)
Pore Volume
(mL/g)
Average Pore Width
(nm)
Before
reaction
ZJ-8#85.1250.030.573
GQ-11#73.7930.0270.501
GQ-13#57.7280.0220.501
After
reaction
ZJ-8#83.010.030.548
GQ-11#83.7550.0310.573
GQ-13#58.5060.0220.501
Table 5. Multifractal parameters of PSD from N2 testing before the reaction.
Sample
No.
DminD-2D-1D0D1D2DmaxD-10
D10
D-10
–D0
D0
D10
Δαα0
ZJ-8#1.1821.0631.0321.0000.9550.9380.8220.360.1820.1780.4921.0368
GQ-11#1.1631.0571.0301.0000.9570.9370.7990.3640.1630.2010.4981.0352
GQ-13#1.5761.3191.1941.0000.6700.5950.3811.1950.5760.6191.3481.2528
Table 6. Multifractal parameters of PSD from N2 testing after the reaction.
Sample
No.
DminD-2D-1D0D1D2DmaxD-10
D10
D-10
–D0
D0
D10
Δαα0
ZJ-8#1.2631.0921.0481.0000.9330.9070.7470.5160.2630.2530.6910.9756
GQ-11#1.1631.0571.0311.0000.9530.9320.8000.3630.1630.2000.4960.9834
GQ-13#1.4951.2141.1211.0000.7790.7130.4761.0190.4950.5241.1190.9272
Table 7. Multifractal parameters of PSD from CO2 testing before the reaction.
Sample
No.
DminD-2D-1D0D1D2DmaxD-10
D10
D-10
D0
D0
D10
Δαα0
ZJ-8#1.0900.9450.9110.8760.8260.8070.6830.4070.2140.1930.5550.857
GQ-11#1.2160.9780.9180.8760.8390.8280.7520.4640.340.1240.6080.860
GQ-13#1.6891.2791.0460.8760.8360.8250.7640.9250.8130.1121.1170.852
Table 8. Multifractal parameters of PSD from CO2 testing after the reaction.
Sample
No.
DminD-2D-1D0D1D2DmaxD-10
D10
D-10
D0
D0
D10
Δαα0
ZJ-8#1.0990.9430.9090.8760.8330.8190.7180.3810.2230.1580.5280.859
GQ-11#1.8751.3891.1070.8760.8260.8150.7601.1150.9990.1161.3290.847
GQ-13#2.4331.8131.3990.8760.8140.7970.6961.7371.5570.1802.0180.839
Disclaimer/Publisher’s Note: The statements, opinions and data contained in all publications are solely those of the individual author(s) and contributor(s) and not of MDPI and/or the editor(s). MDPI and/or the editor(s) disclaim responsibility for any injury to people or property resulting from any ideas, methods, instructions or products referred to in the content.

