Article

Fractal Characteristics and Pore Structures of Shales from the Doushantuo Formation, Yichang Area, South China

1
Hubei Key Laboratory of Biologic Resources Protection and Utilization, Hubei Minzu University, Enshi 445000, China
2
School of Earth Resources, China University of Geosciences, Wuhan 430074, China
3
Zhanjiang Branch, China National Offshore Oil Corporation, Zhanjiang 524057, China
*
Author to whom correspondence should be addressed.
Fractal Fract. 2025, 9(12), 774; https://doi.org/10.3390/fractalfract9120774
Submission received: 29 October 2025 / Revised: 19 November 2025 / Accepted: 26 November 2025 / Published: 27 November 2025

Abstract

Low-pressure N2 adsorption experiments were conducted on 20 samples from the Doushantuo Formation in the Yichang area to quantitatively characterize their pore structures and fractal properties. The samples are mainly composed of quartz, dolomite, and clay minerals, with minor amounts of feldspar, calcite, and pyrite. The N2 adsorption–desorption isotherms display typical type IV characteristics with a pronounced hysteresis loop, indicating that mesopores are dominant. The specific surface areas range from 3.78 to 11.49 m2/g, and the total pore volumes range from 0.0039 to 0.0169 mL/g, with mesopores contributing most of the total pore volume. Fractal analysis based on the FHH model reveals two distinct fractal dimensions (Df): Df1 = 2.5–2.9 for small pores and Df2 = 2.0–2.3 for large pores. The fractal dimensions are negatively correlated with TOC, quartz, and carbonate contents but positively correlated with clay and pyrite contents. Higher organic matter content tends to produce relatively smooth organic pores, reducing pore heterogeneity, whereas higher clay content increases surface roughness and structural complexity. Overall, the heterogeneity of pore structures in the Doushantuo Formation shales is primarily controlled by mineral composition and organic matter content. These results provide new insights into the pore characteristics and storage potential of Ediacaran marine shales.

1. Introduction

With the continuous rise in global energy demand, shale gas has emerged as an increasingly important clean energy resource owing to its abundant reserves and widespread distribution [1,2]. The pore structure and characteristics of shale play a critical role in the exploration and development of shale gas. Accurate determination of pore parameters and identification of their controlling factors form the basis for a robust evaluation of shale gas potential. Methods for pore characterization can be broadly categorized as qualitative or quantitative. Qualitative approaches include polarized light microscopy, field-emission and focused-ion-beam scanning electron microscopy (FE-SEM and FIB-SEM), and atomic force microscopy (AFM), whereas quantitative methods primarily comprise microtomographic imaging, low-pressure N2/CO2 adsorption, mercury intrusion capillary pressure (MICP) analysis, and small- and ultra-small-angle neutron scattering (SANS and USANS). Integrating these techniques enables a systematic characterization of pore types, pore-size distributions, and their controlling mechanisms in shales [3,4,5,6]. Among these methods, low-pressure N2 adsorption has been widely used to investigate shale pore structures because it objectively characterizes pore systems while offering operational simplicity, low cost, and high reproducibility [7].
However, adsorption data alone cannot fully capture the complexity and heterogeneity of shale pore networks. To address this limitation, fractal theory has been introduced to describe the structural features of porous media. Fractal analysis effectively quantifies the irregularity and heterogeneity of pore surfaces, providing a powerful framework for understanding shale reservoir complexity [4,8]. By treating complex pore systems as integrated entities, fractal theory enables quantitative assessment of pore heterogeneity and surface roughness. Fractal dimensions (Df) typically range from 2 to 3, where values near 2 indicate relatively smooth surfaces, and those approaching 3 represent highly rough and irregular surfaces [3,9]. In this study, low-pressure N2 adsorption data were used to quantitatively analyze the relationships among shale fractal dimensions, composition, and pore structure. This approach aims to identify the primary factors controlling pore heterogeneity and to elucidate their geological significance. The results provide new insights into the microscale pore characteristics of the Doushantuo Formation shales in the Yichang area and offer valuable references for studies of shale pore systems in other regions.

2. Geologic Setting

During the Ediacaran period, global climatic warming led to progressive glacial melting and a consequent rise in sea levels that inundated the entire Yangtze Block. Concurrently, the block experienced sustained slow subsidence, forming a characteristic shelf–basin depositional system (Figure 1), within which the Doushantuo and Dengying formations developed successively from bottom to top (Figure 2) [10,11]. During deposition of the Doushantuo Formation, large-scale transgressive events occurred, and upwelling currents transported abundant nutrients to the depositional area, fostering the proliferation of early marine organisms. The region extending from Yichang to Chongqing was situated in a relatively deep-water intra-platform environment, which not only favored the accumulation and preservation of organic matter but also supported continuous and stable sedimentation, resulting in substantial stratigraphic thickness of the Doushantuo Formation [12].
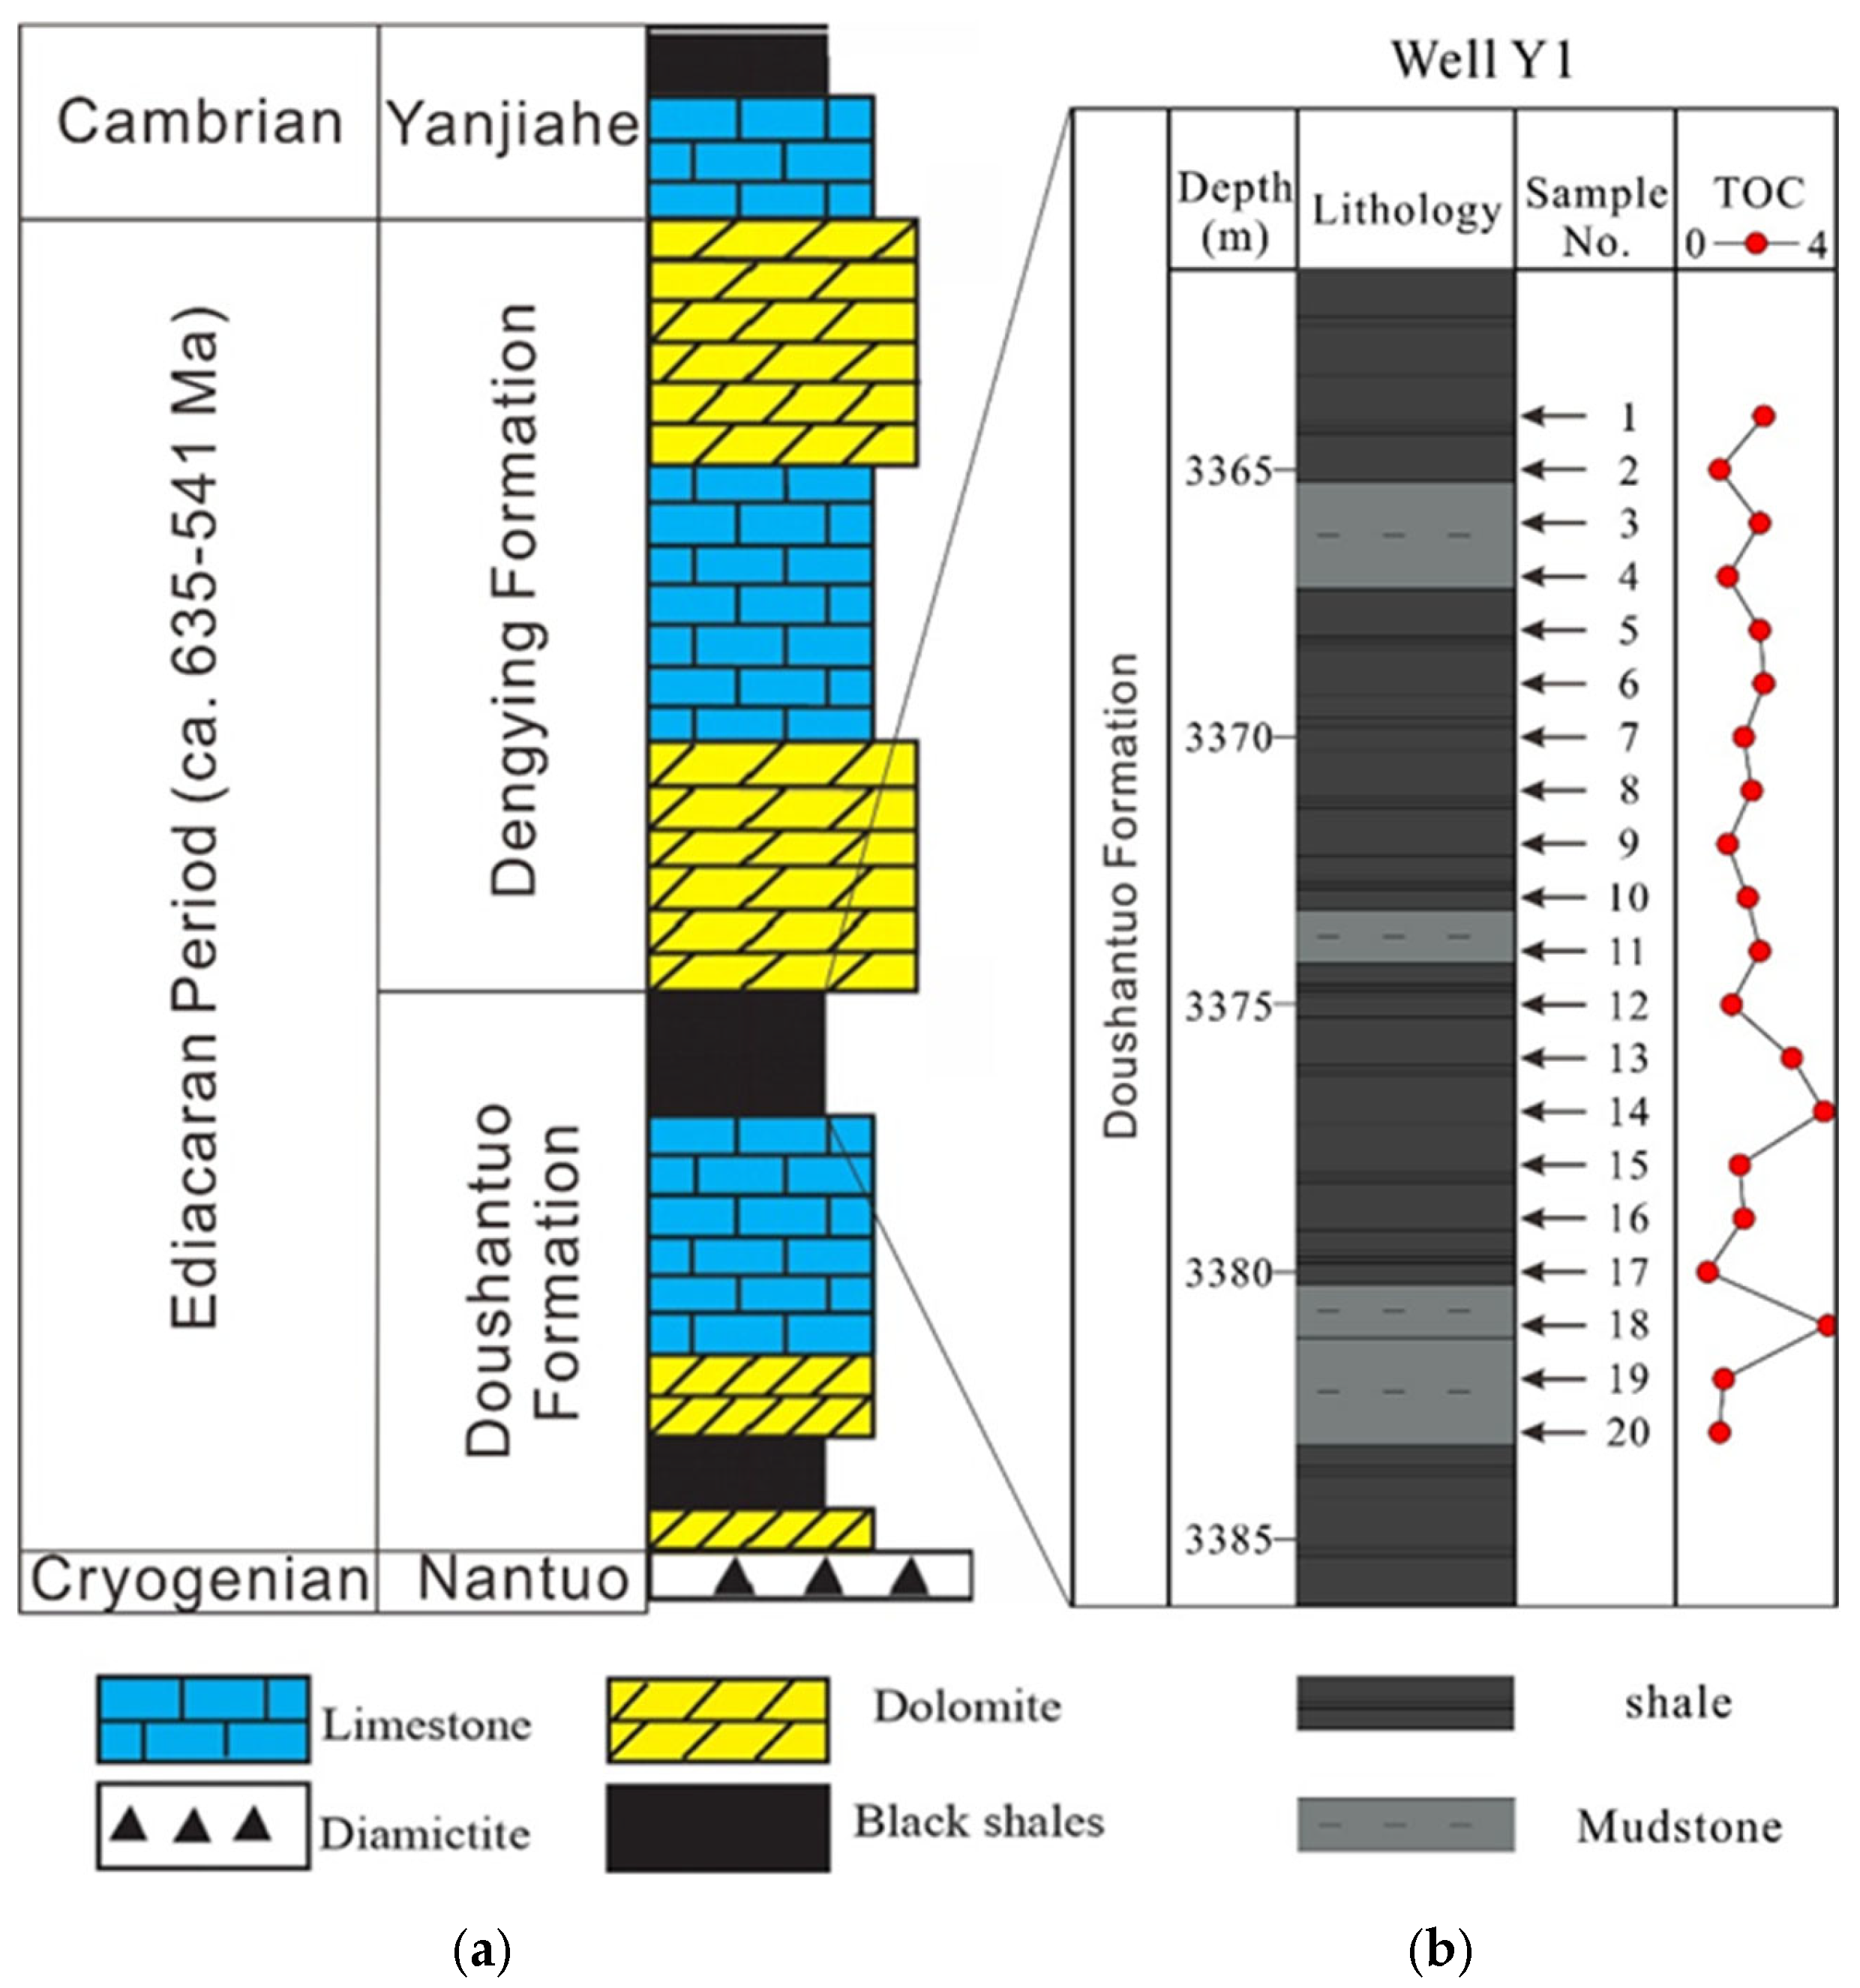
Stratigraphically, the Doushantuo Formation conformably overlies the Nantuo Formation and underlies the Dengying Formation [11,12]. In the Yichang area, its lithological succession, from bottom to top, consists of dolomite, black shale, dolomite, limestone, and black shale (Figure 2). Among these, the black shales of the Doushantuo Formation exhibit considerable shale gas potential and currently represent the primary target interval for shale gas exploration in the Yichang region. The Y1 well analyzed in this study serves as a representative borehole for geological evaluation of the upper Doushantuo shale gas resources in this area (Figure 1 and Figure 2).

3. Samples and Methods

3.1. Samples

In this study, twenty shale core samples were collected from the Doushantuo Formation in the Y1 well, located in the Yichang area. The samples are primarily composed of black shale and dark gray mudstone, deposited in a deep-marine environment within an intrashelf basin. Sampling depths range from 3363 to 3384 m, corresponding to the key interval of shale gas enrichment in the Yichang region (Figure 2).

3.2. Methods

First, the samples were crushed, and a portion of the powdered material was treated with 5% HCl to remove inorganic carbon. The residues were then rinsed with deionized water to eliminate any remaining acid. Total organic carbon (TOC) contents were subsequently determined using a CS230 carbon–sulfur analyzer (LECO, St. Joseph, MI, USA).
For mineralogical analysis, an appropriate amount of powdered sample was examined using a D/max-2500 X-ray diffractometer (Rigaku, Tokyo, Japan) following the treatment and analytical procedures described by Yang et al. (2018) [13]. The X-ray diffraction data provided quantitative estimates of the mineral compositions for all 20 samples.
Powdered samples were degassed under vacuum at 110 °C for 8 h to remove moisture and volatile components. Low-pressure N2 adsorption measurements were then performed on the treated samples using a Micromeritics ASAP 2020 surface area analyzer (Micromeritics, Norcross, GA, USA) at −196 °C. The specific surface area was calculated using the Brunauer–Emmett–Teller (BET) method, the pore volume was determined by the Barrett–Joyner–Halenda (BJH) method, and the pore-size distribution was analyzed using the density functional theory (DFT) approach [4,14].

3.3. Fractal Theory

Since its introduction by the French scientist B. B. Mandelbrot, fractal theory has been widely used to quantitatively describe the morphological characteristics of irregular objects [3,4,15]. Although some controversy exists regarding the determination of fractal dimensions due to the ambiguous boundaries in the gas adsorption process (ranging from monolayer adsorption to multimolecular layer adsorption and adsorption cohesion), gas adsorption data remain a commonly used method for extracting fractal information from porous solid materials [3,4,16,17]. When applying this method, it is crucial to first assess whether the solid material itself exhibits fractal characteristics. Using low-pressure N2 adsorption data, the fractal dimension can be calculated effectively via the Frenkel–Halsey–Hill (FHH) model, providing a quantitative measure of pore structure heterogeneity in porous media [3,18]. The fractal dimension is determined using the following equation:
ln(V/V0) = Kln(ln(P0/P)) + C
In this equation, V and V0 represent the N2 adsorption volume at equilibrium pressure and the monolayer adsorption volume, respectively, both in cm3/g; P and P0 denote the equilibrium and saturation pressures, respectively, in MPa; C is the N2 adsorption constant; and K is closely related to the adsorption mechanism and the fractal dimension of the porous medium. The equation implies a linear relationship between ln(V) and ln[ln(P0/P)], with the fractal dimension calculated from the slope (K) as Df = K + 3. In N2 adsorption experiments, capillary condensation in mesoporous materials is the dominant mechanism at high relative pressures, and the Df can be derived from this equation [3,4,16,17]. The geometric morphology and surface roughness of the pore structure determine the magnitude of Df: higher values approaching 3 indicate more irregular and rough pore surfaces, whereas lower values near 2 correspond to more regular and smooth surfaces [3,18].

4. Results

4.1. Mineral Content

The shales are primarily composed of dolomite, clay, and quartz, with minor amounts of feldspar, calcite, and pyrite (Table 1). Dolomite content ranges from 36.2 to 47.6%, with a mean of 40.1%; clay ranges from 2.1 to 40.7%, averaging 22.6%; quartz ranges from 13.6 to 28.7%, with a mean of 21.5%; feldspar ranges from 0.9 to 12.6%, with a mean of 6.3%; calcite ranges from 2.5 to 11.8%, averaging 7.3%; and pyrite ranges from 0.2 to 4.6%, with a mean of 0.2%.

4.2. Pore Network Characteristics

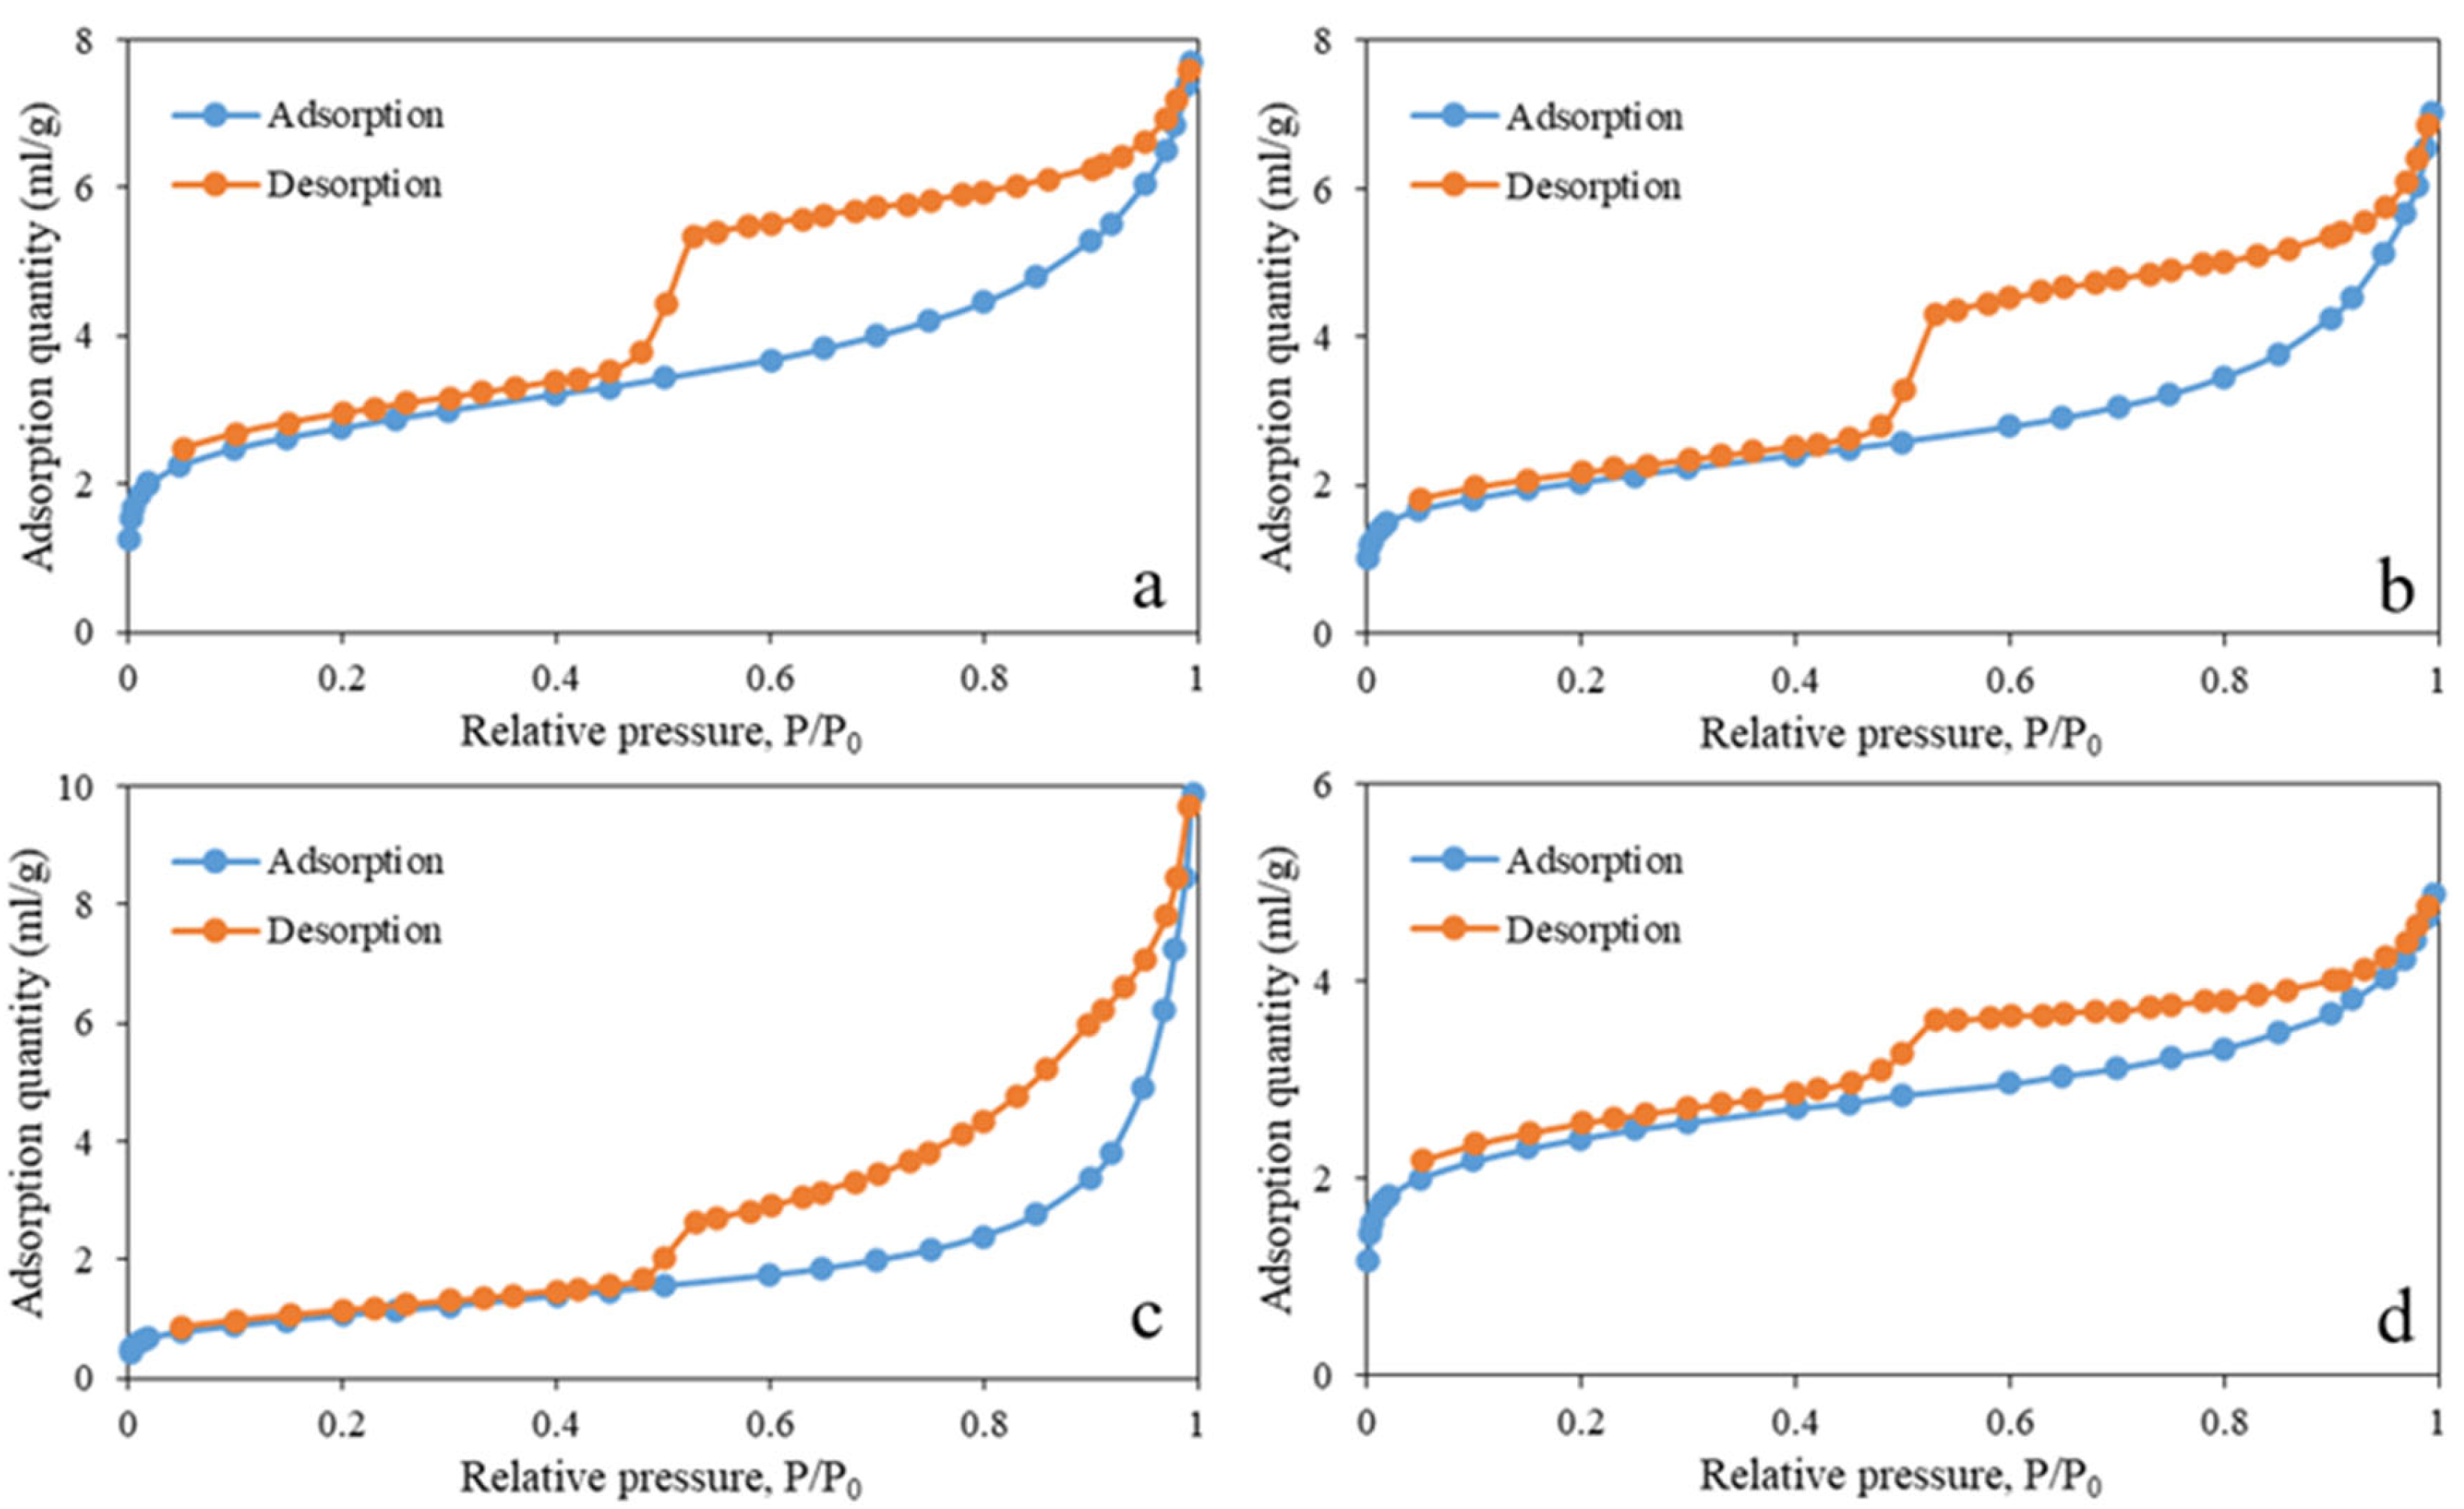
Based on experimental measurements and adsorption theory for porous media, N2 adsorption–desorption isotherms were constructed for all shale samples. Figure 3 shows the isotherms of four representative shales from different depths. According to the IUPAC classification, all samples exhibit type IV behavior with pronounced hysteresis loops, indicating that mesopores dominate and multilayer adsorption occurs, which can be quantitatively analyzed using BET theory. No saturation plateau is observed at relative pressures approaching 1, reflecting the presence of well-developed macropores. Further analysis reveals that the larger hysteresis loops in Figure 3a,b suggest tubular pores with narrow necks and wide bodies, whereas the smaller loops in Figure 3c,d indicate that the pores are primarily narrow fractures.
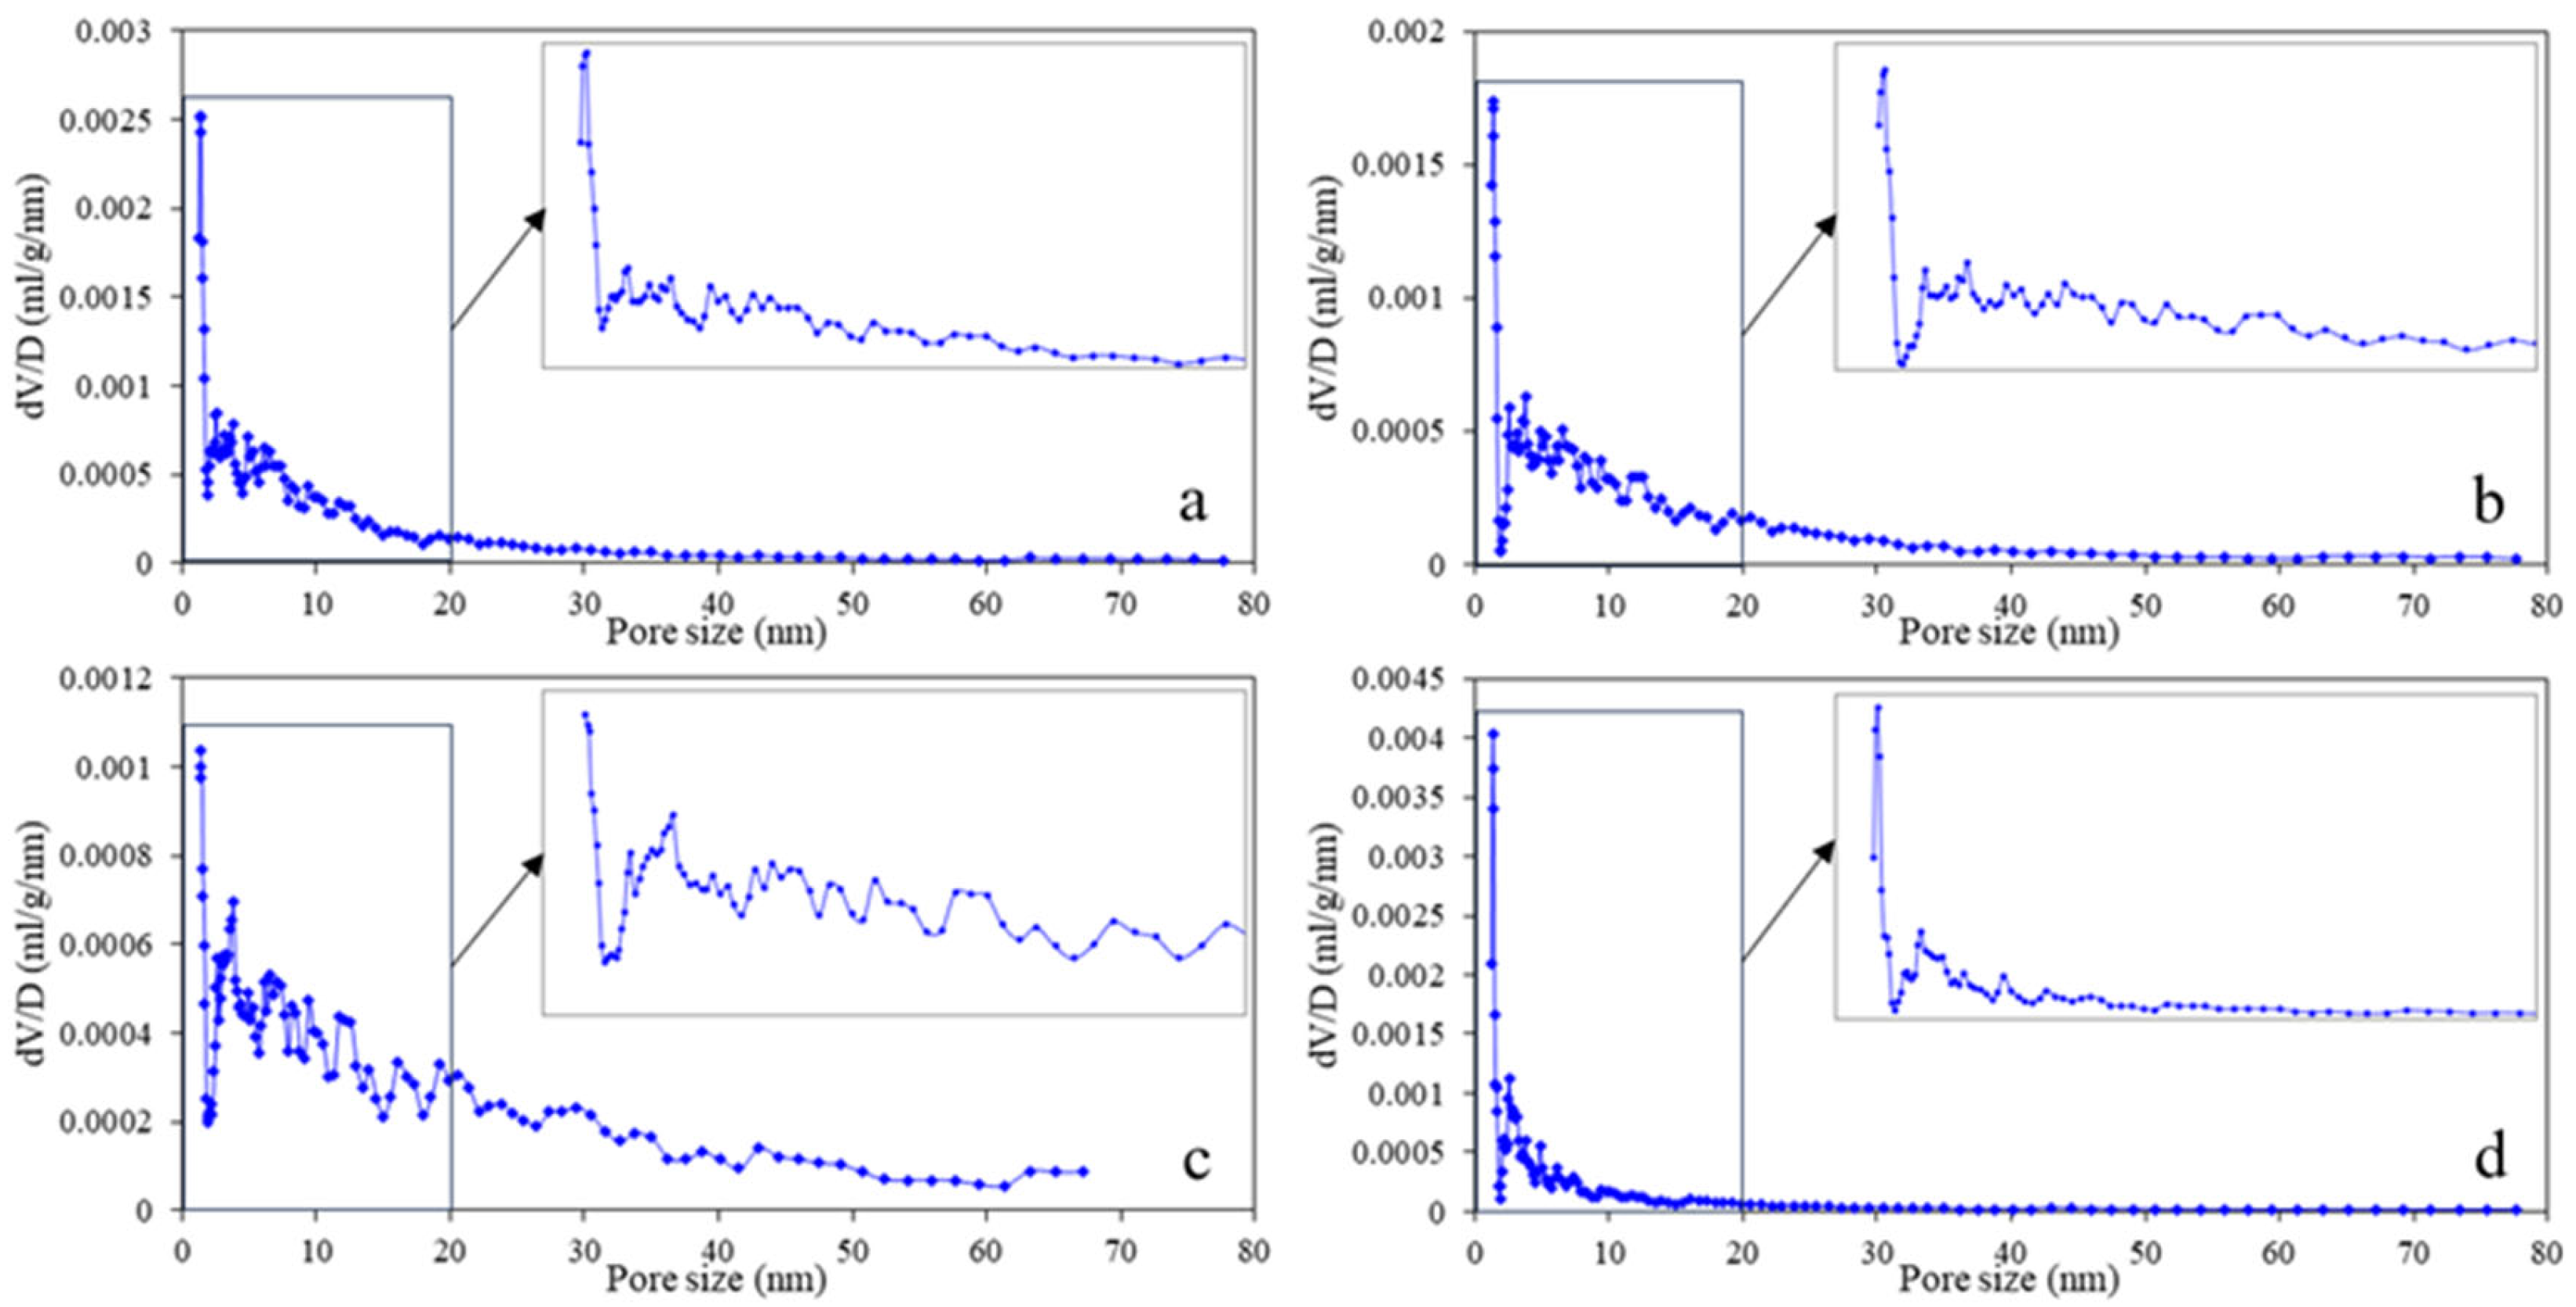
Analysis of the N2 adsorption–desorption data using the DFT method provided the pore-size distributions of the shale samples. Figure 4 presents the distributions for four representative samples from different depths, with pore sizes ranging from 0 to 80 nm and exhibiting multimodal patterns. Specifically, the main peaks for Sample No. 3 occur at 1.3, 2.5, 3.8, 4.9, 6.1, 8.1, and 9.4 nm (Figure 4a); Sample No. 7 shows peaks at 1.4, 2.6, 3.8, 4.9, 6.1, 6.5, 8.2, 9.4, and 12.1 nm (Figure 4b); Sample No. 14 exhibits peaks at 1.3, 2.6, 3.8, 4.9, 6.1, 6.6, 8.1, 9.4, 12.1, 13.9, 16.1, and 19.2 nm (Figure 4c); and Sample No. 19 shows peaks at 1.4, 2.1, 2.6, 3.8, 4.9, and 6.1 nm (Figure 4d). Pores of these various sizes contribute predominantly to the micropore volume of the samples.
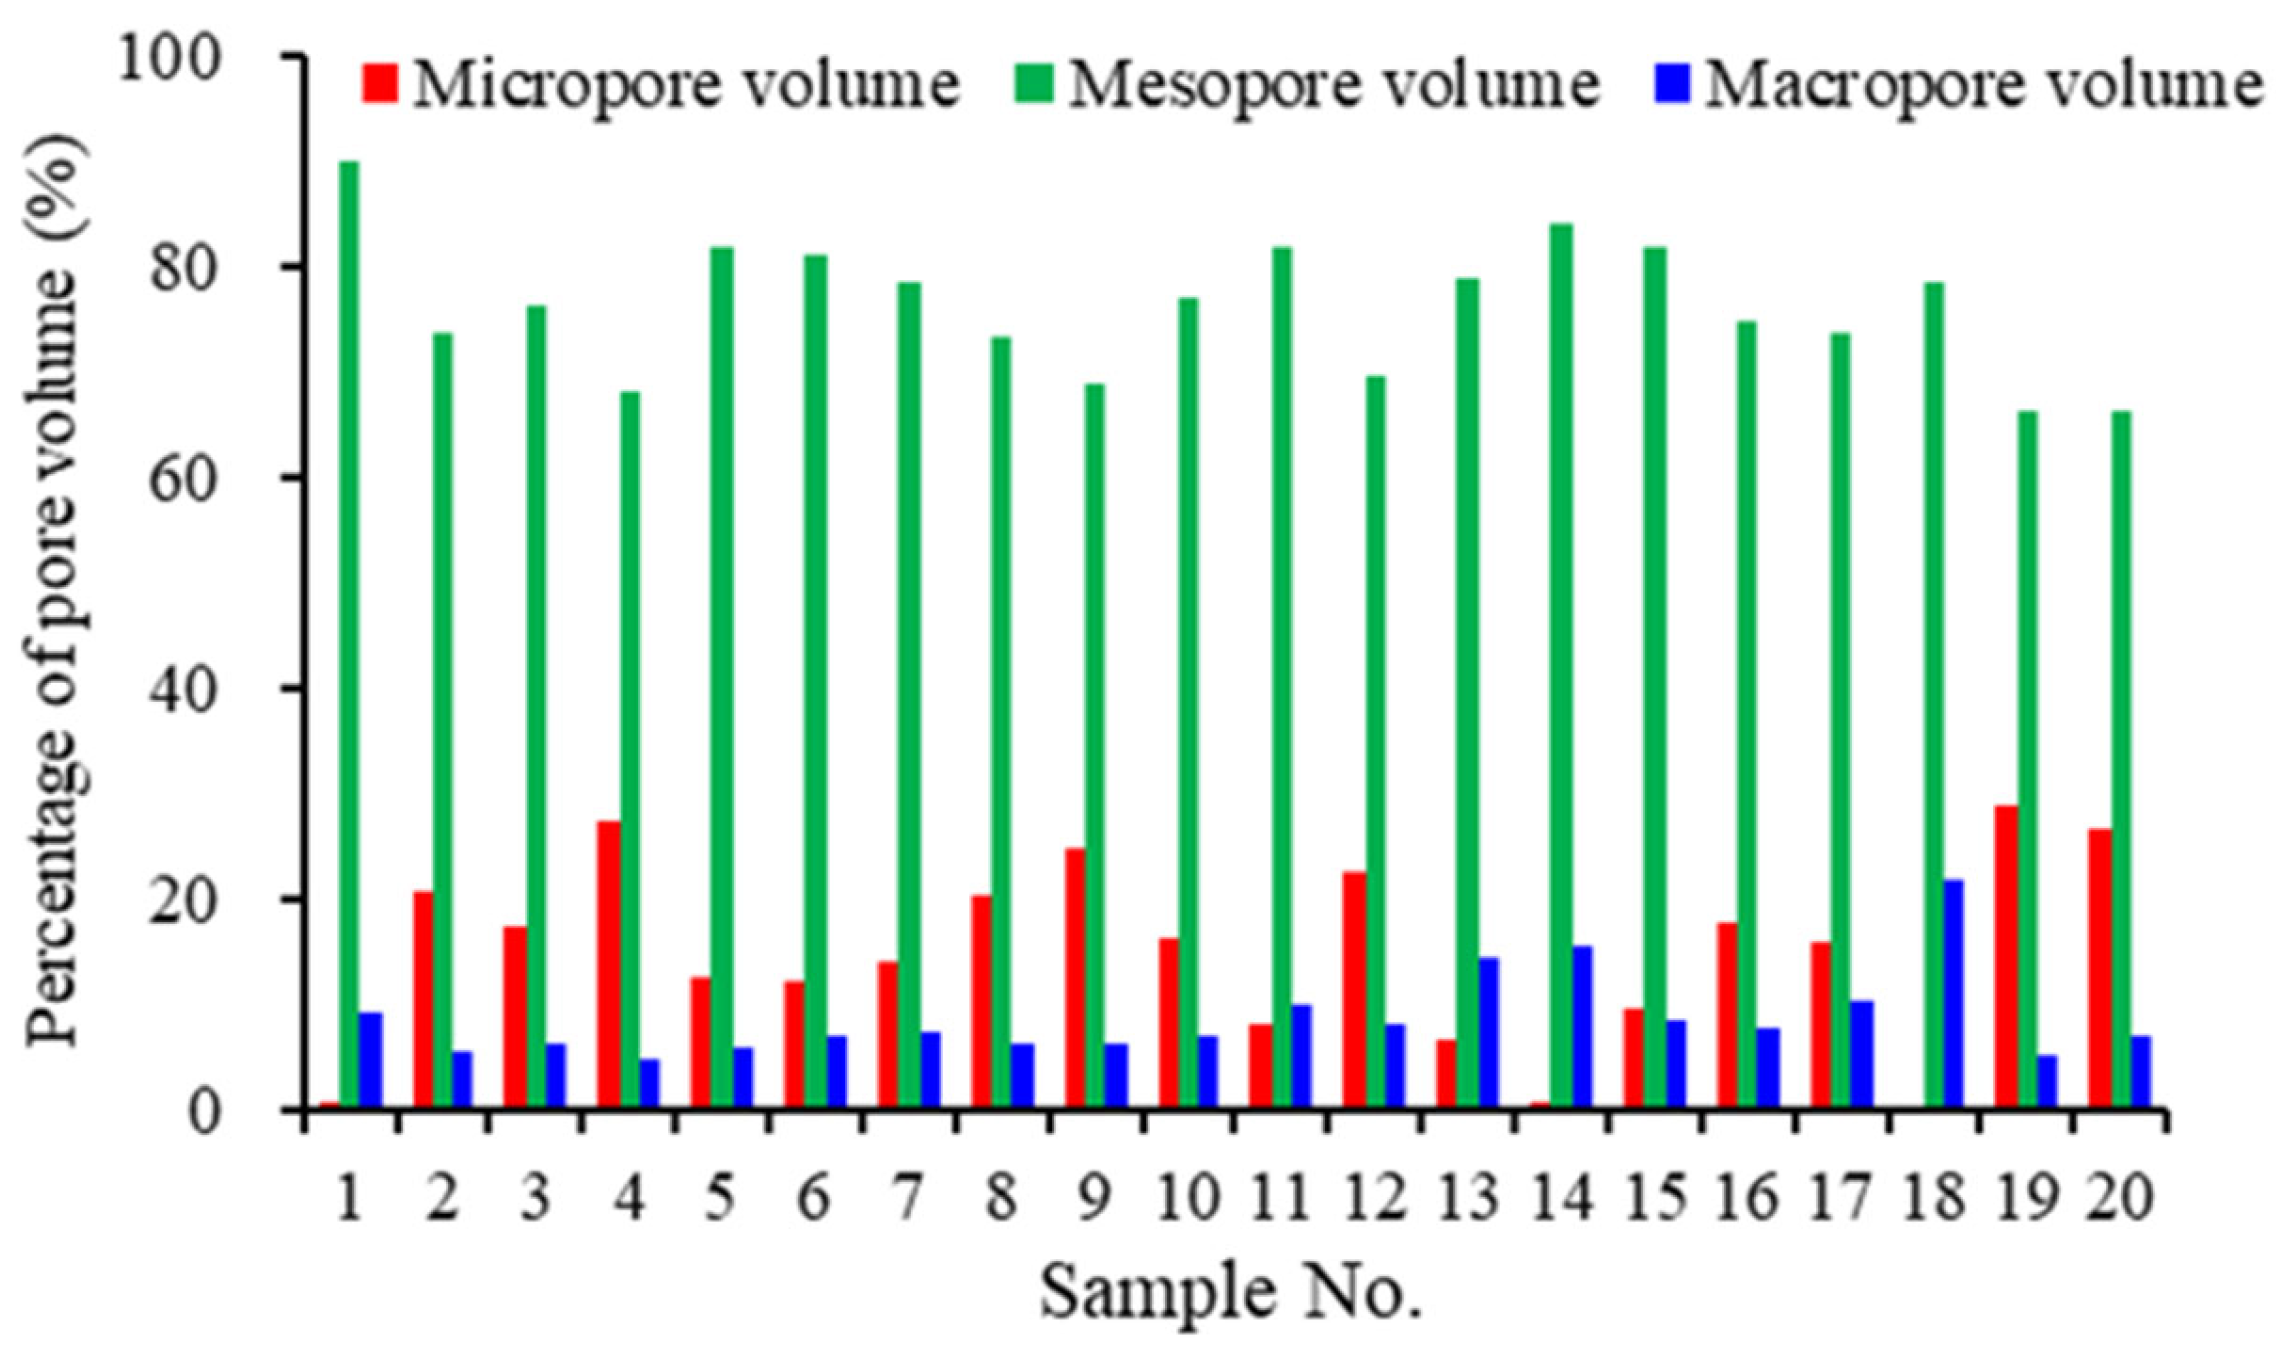
The pore structure characteristics of all samples are summarized in Table 2. The specific surface area of the shales ranges from 3.78 to 11.49 m2/g, with a mean of 8.42 m2/g; total pore volume ranges from 0.003932 to 0.016873 mL/g, averaging 0.009959 mL/g; and average pore size ranges from 3.34 to 17.09 nm, with a mean of 6.25 nm. Micropore volume (<2 nm) varies from 0.0001 to 0.0045 mL/g (mean 0.0016 mL/g); mesopore volume (2–50 nm) ranges from 0.0021 to 0.0124 mL/g (mean 0.0079 mL/g); and macropore volume (>50 nm) ranges from 0.0003 to 0.0021 mL/g (mean 0.0009 mL/g). Figure 5 shows the relative contributions of different pore sizes to total pore volume: micropores account for 0–29% (mean 15%), mesopores for 66–90% (mean 76%), and macropores for 5–22% (mean 9%), indicating that mesopores dominate the pore volume in these shales.

4.3. Fractal Characteristics

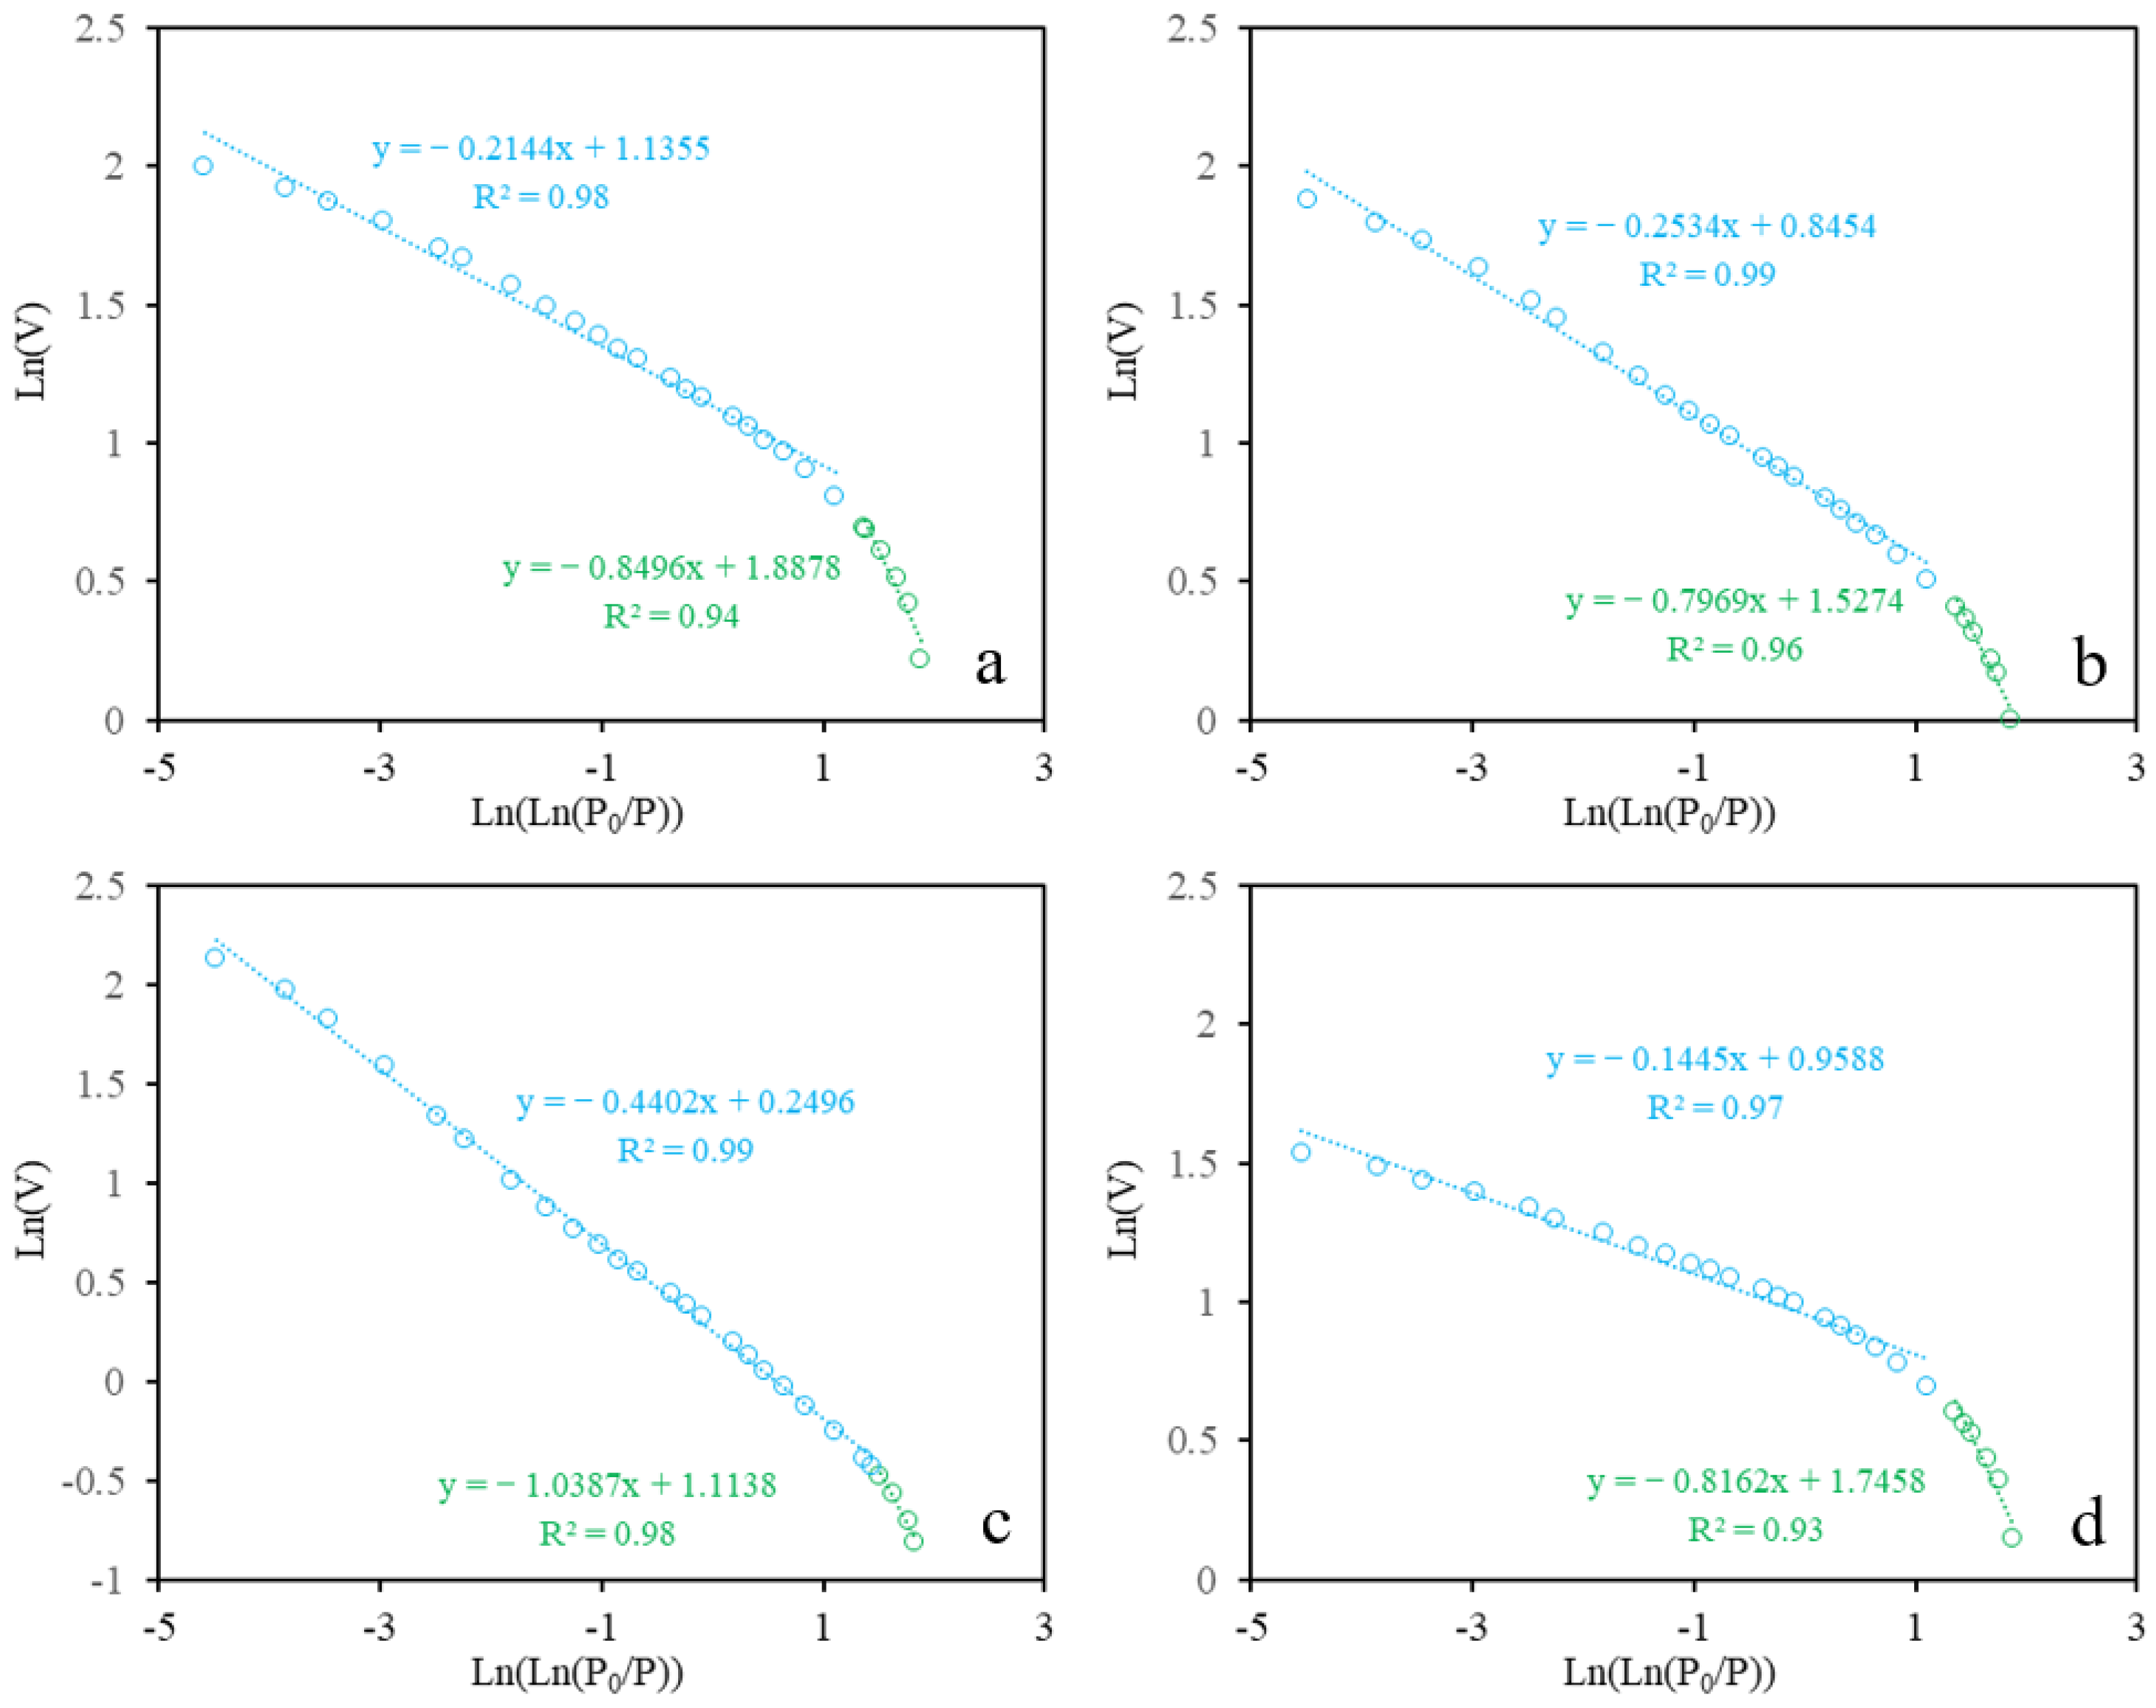
The N2 adsorption data were analyzed by plotting ln(V) versus ln[ln(P0/P)], with Figure 6 showing results for four representative samples. All curves exhibit two distinct linear segments with different slopes, where the blue and green segments correspond to small and large pores, respectively. Using the relationship Df = K + 3, the fractal dimensions of the small and large pores (Df1 and Df2) were calculated. The results for all samples are summarized in Table 3, with correlation coefficients for each segment exceeding 0.93, indicating high reliability. Specifically, Df1 ranges from 2.5 to 2.9, with a mean of 2.8, while Df2 ranges from 2.0 to 2.3, with a mean of 2.2. The pronounced difference between the fractal dimensions of small and large pores reflects the complex and heterogeneous nature of shale pore structures.

5. Discussion

5.1. Correlations Between Df and TOC

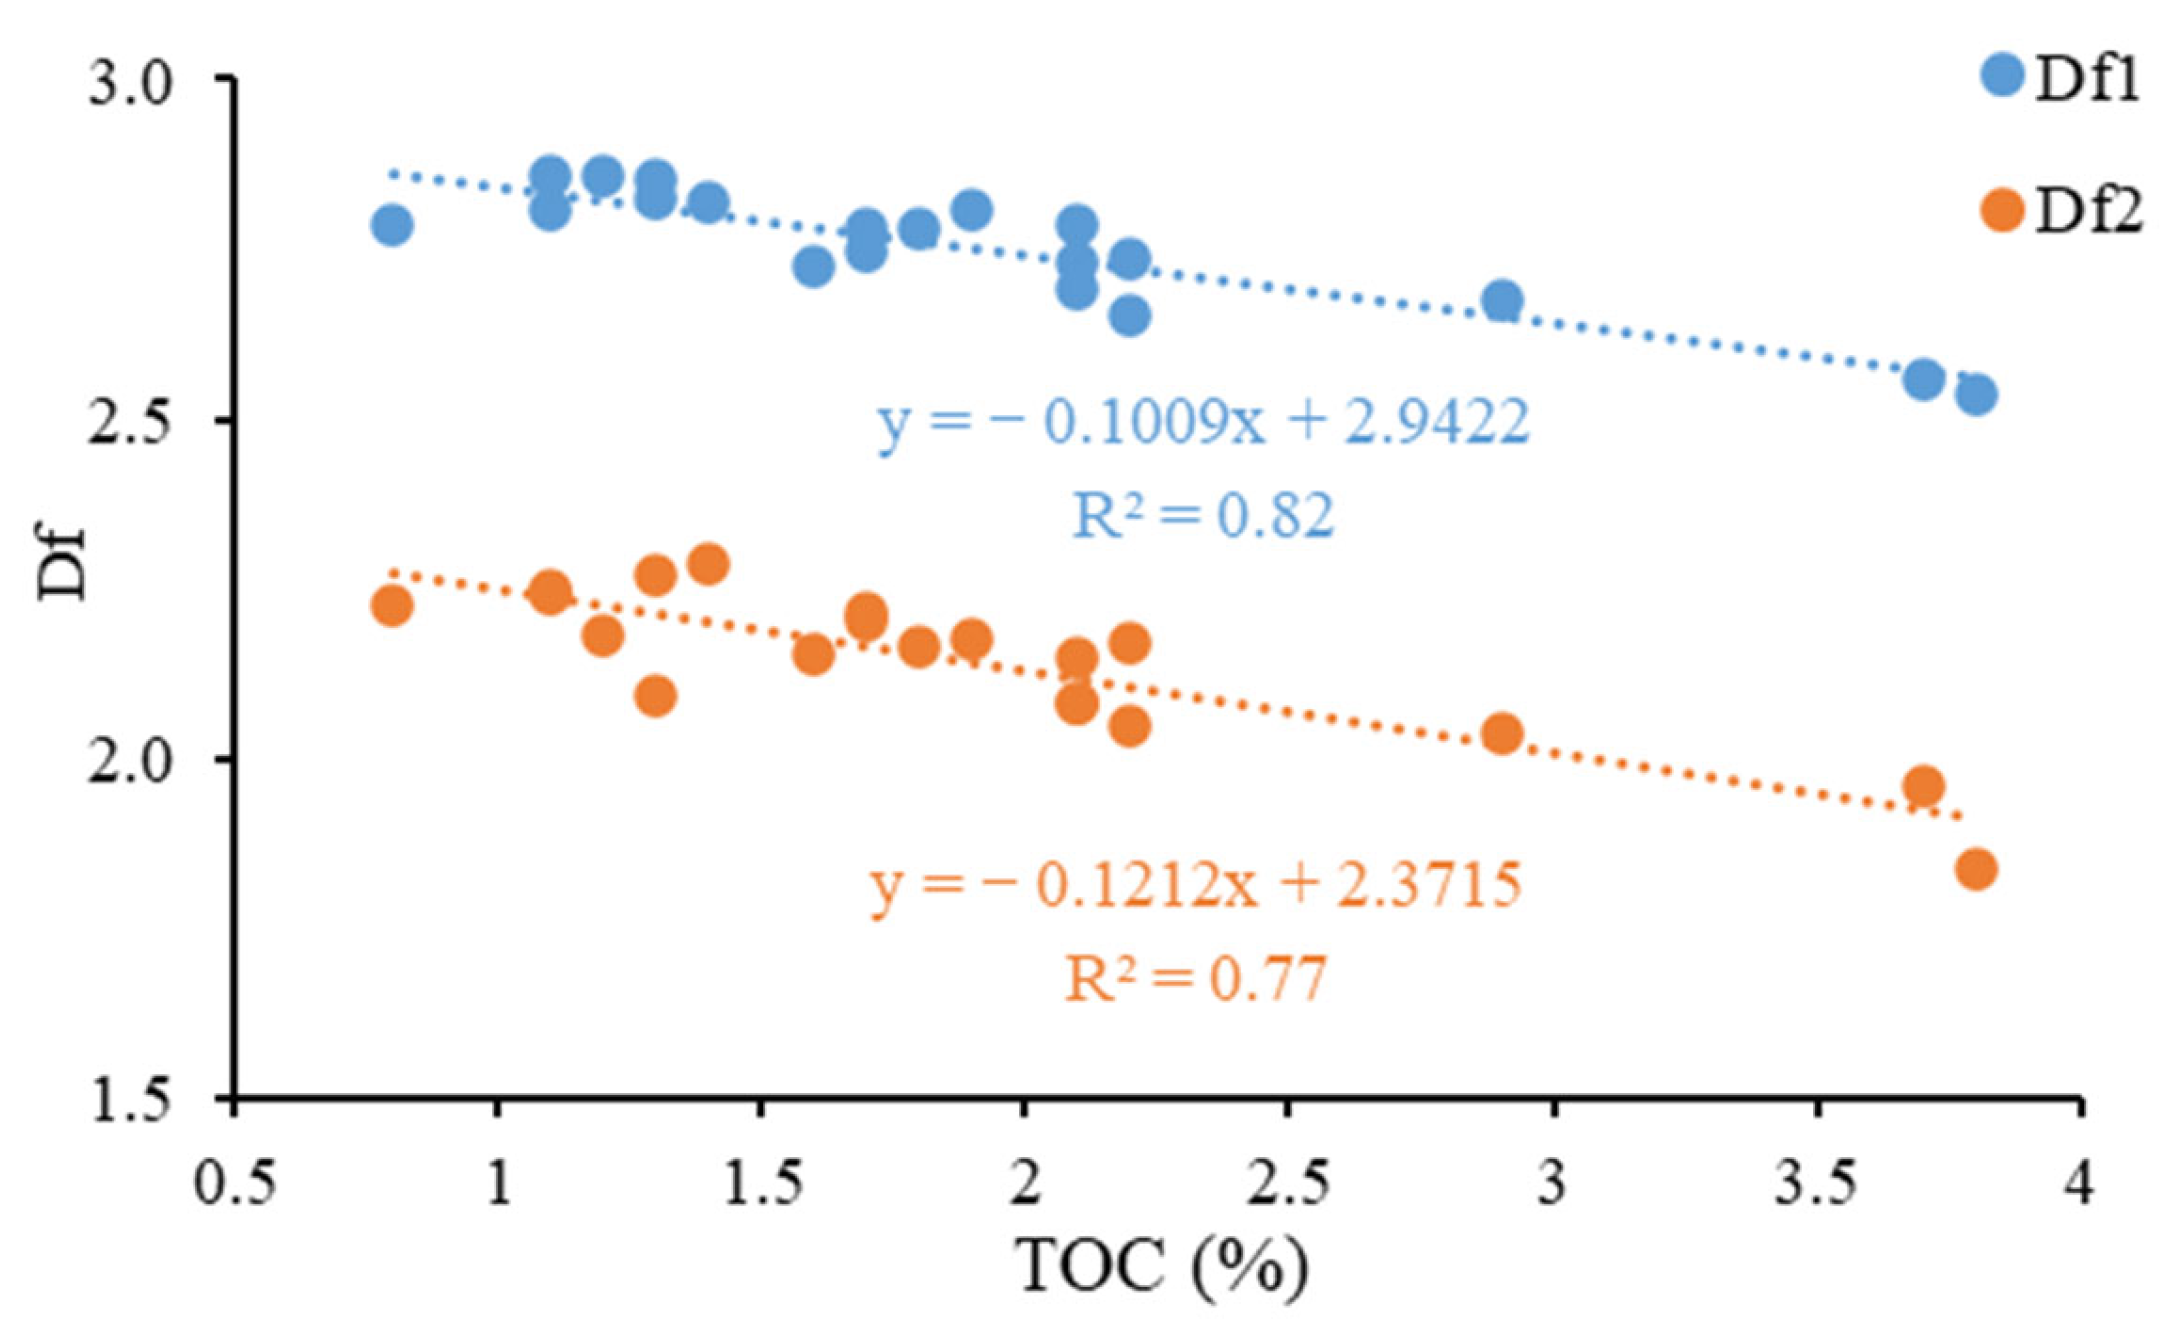
The Df of the shales shows a negative correlation with total organic carbon (TOC) content, decreasing as organic matter increases (Figure 7). Shale pore structures are closely linked to their mineral and organic composition. In mature organic matter, numerous organic pores develop. When TOC content is low, micropore and mesopore volumes contribute minimally to the total pore volume, resulting in high pore-structure heterogeneity [19,20]. As TOC content increases, the proportion of organic matter rises and the volume of organic pores expands. These additional pores enhance pore connectivity and distribution, thereby reducing the complexity of the pore network [3,21,22]. Consequently, in mature shales, higher TOC content corresponds to lower Df, indicating reduced heterogeneity of the pore structure.

5.2. Correlations Between Df and Pore Structure Parameters

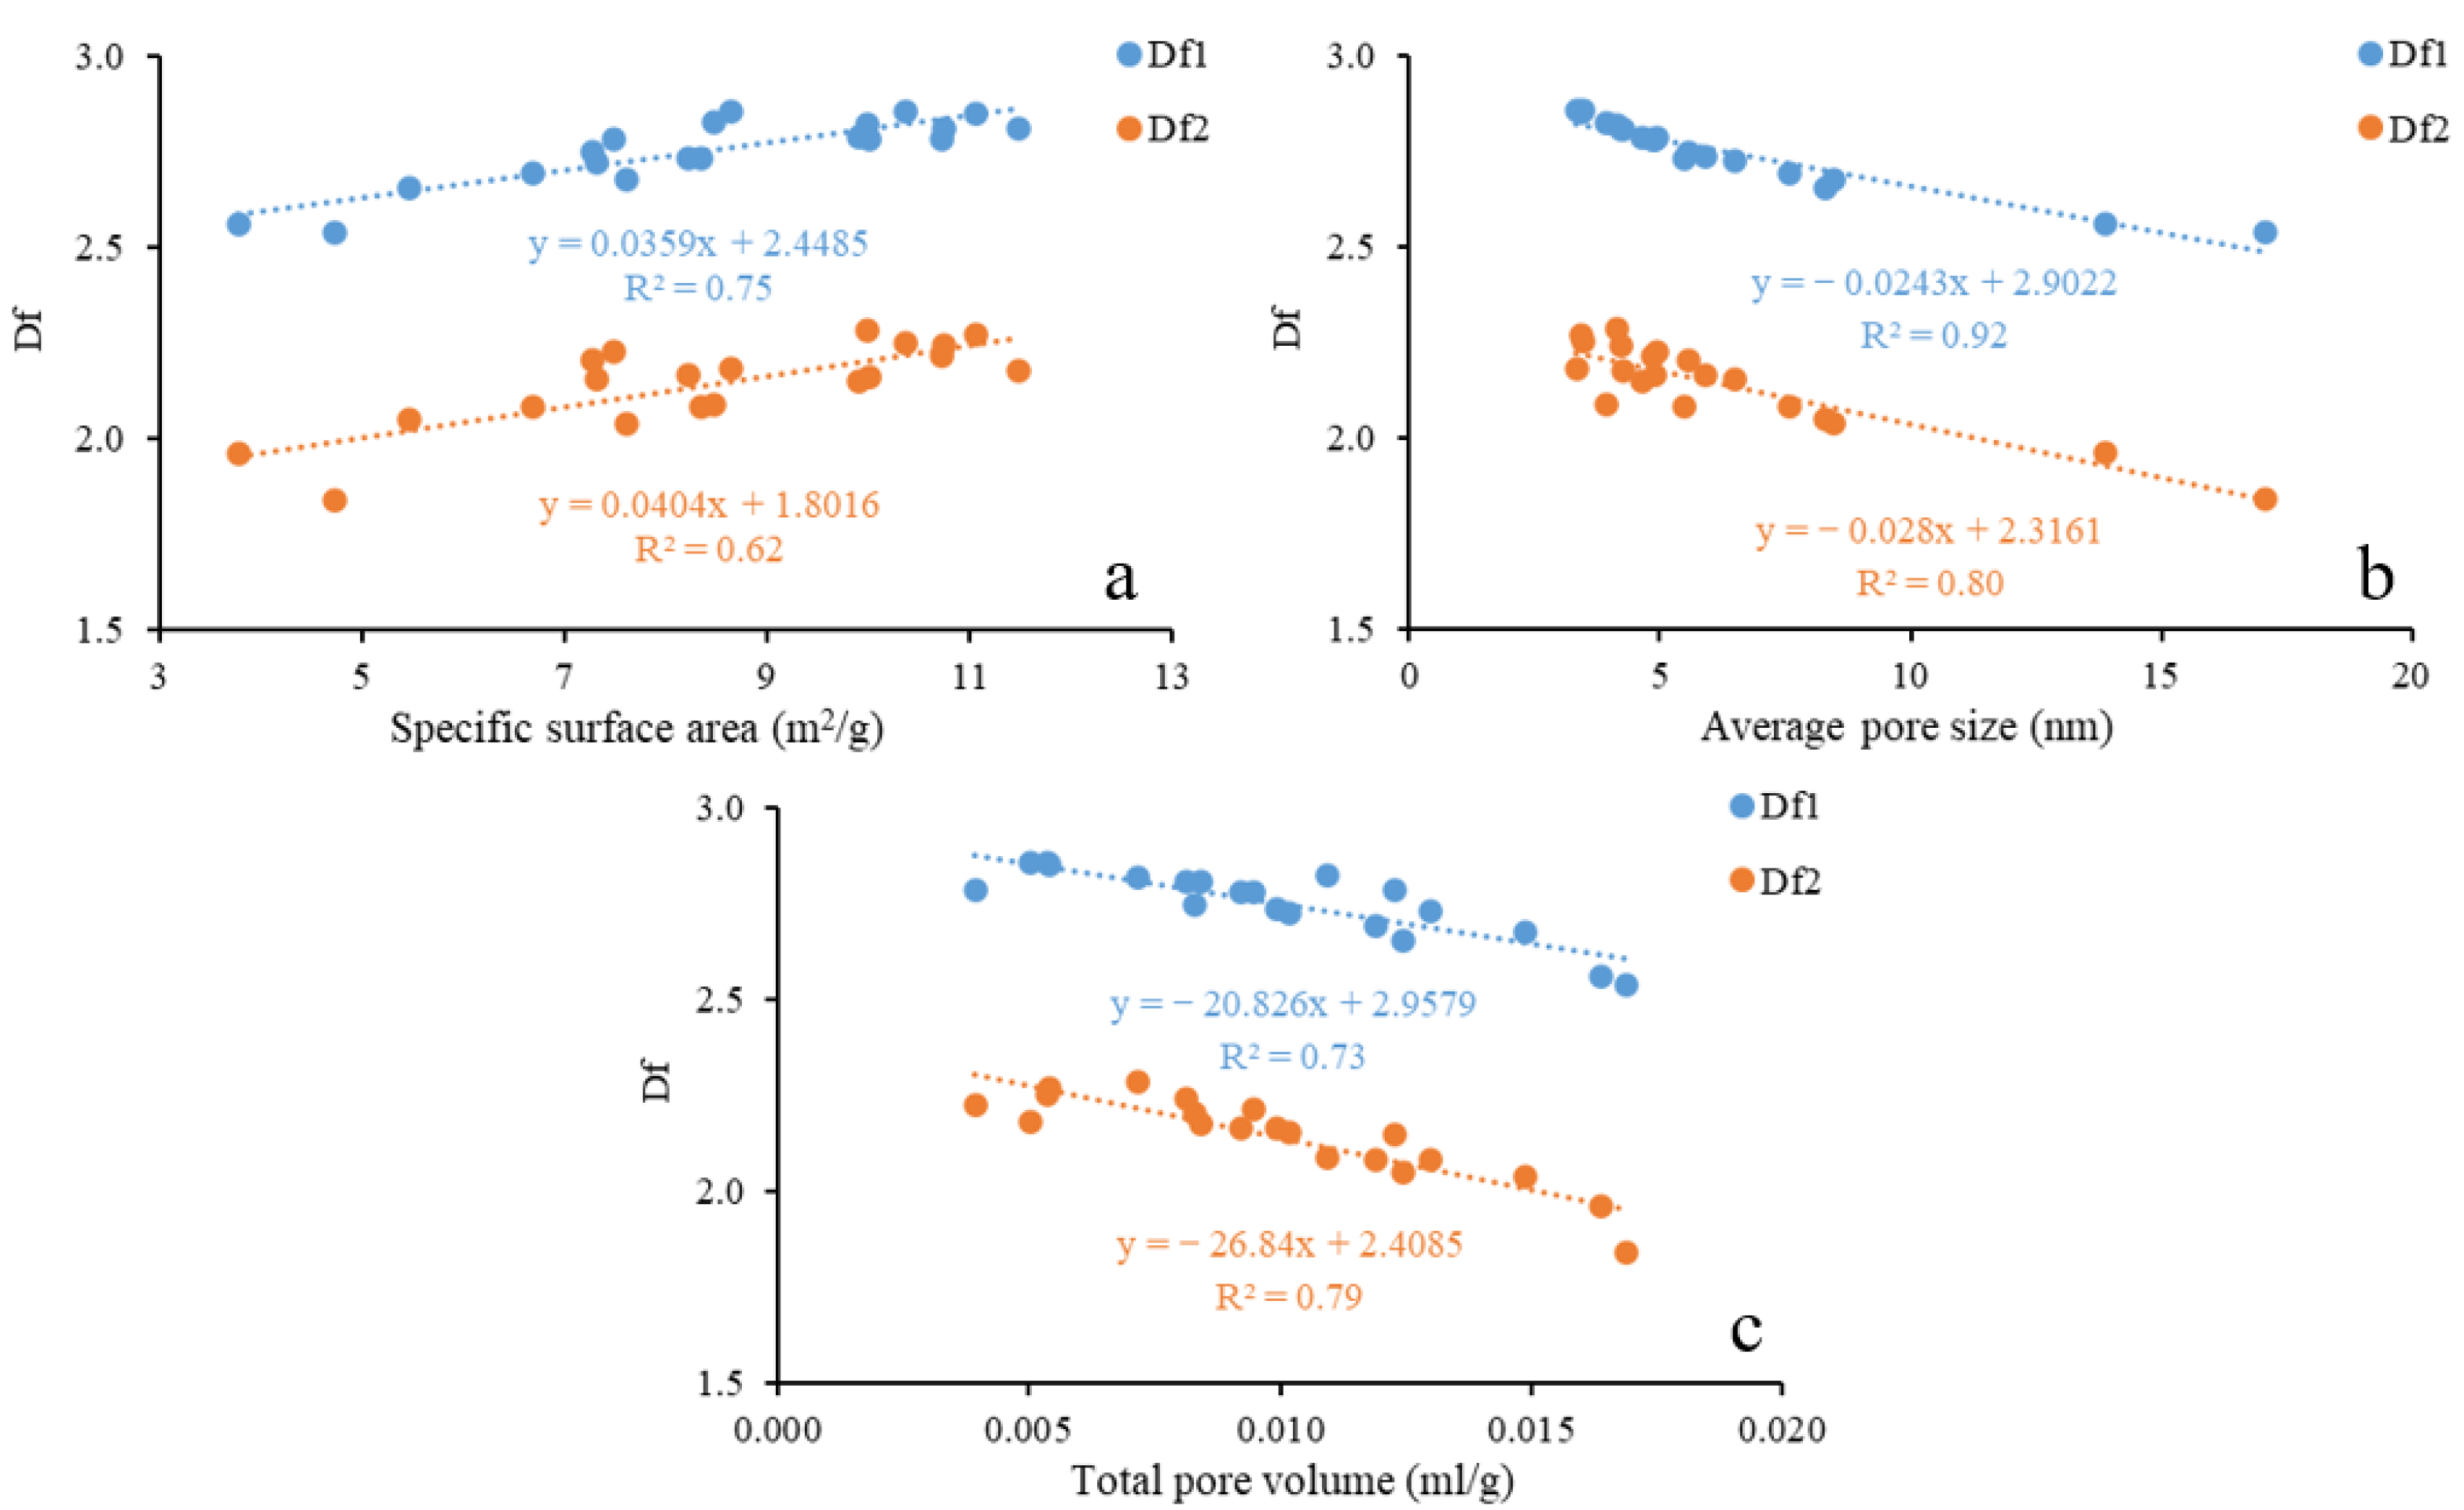
The Df of the shales shows a positive correlation with specific surface area (Figure 8a) and a negative correlation with average pore size (Figure 8b). Micropores typically exhibit high specific surface areas, and an increasing proportion of micropores leads to more complex pore structures and surface morphologies, thereby enhancing pore heterogeneity and increasing fractal complexity [4,18]. Conversely, Df is negatively correlated with total pore volume (Figure 8c). Shales with larger pore volumes generally contain more mesopores and macropores, which have relatively simple surfaces, resulting in a more uniform pore distribution and lower fractal complexity [4,23]. Overall, smaller pore sizes and more irregular pore shapes are associated with higher specific surface areas, greater pore-system heterogeneity, and correspondingly higher Df values.

5.3. Correlations Between Df and Mineral Content

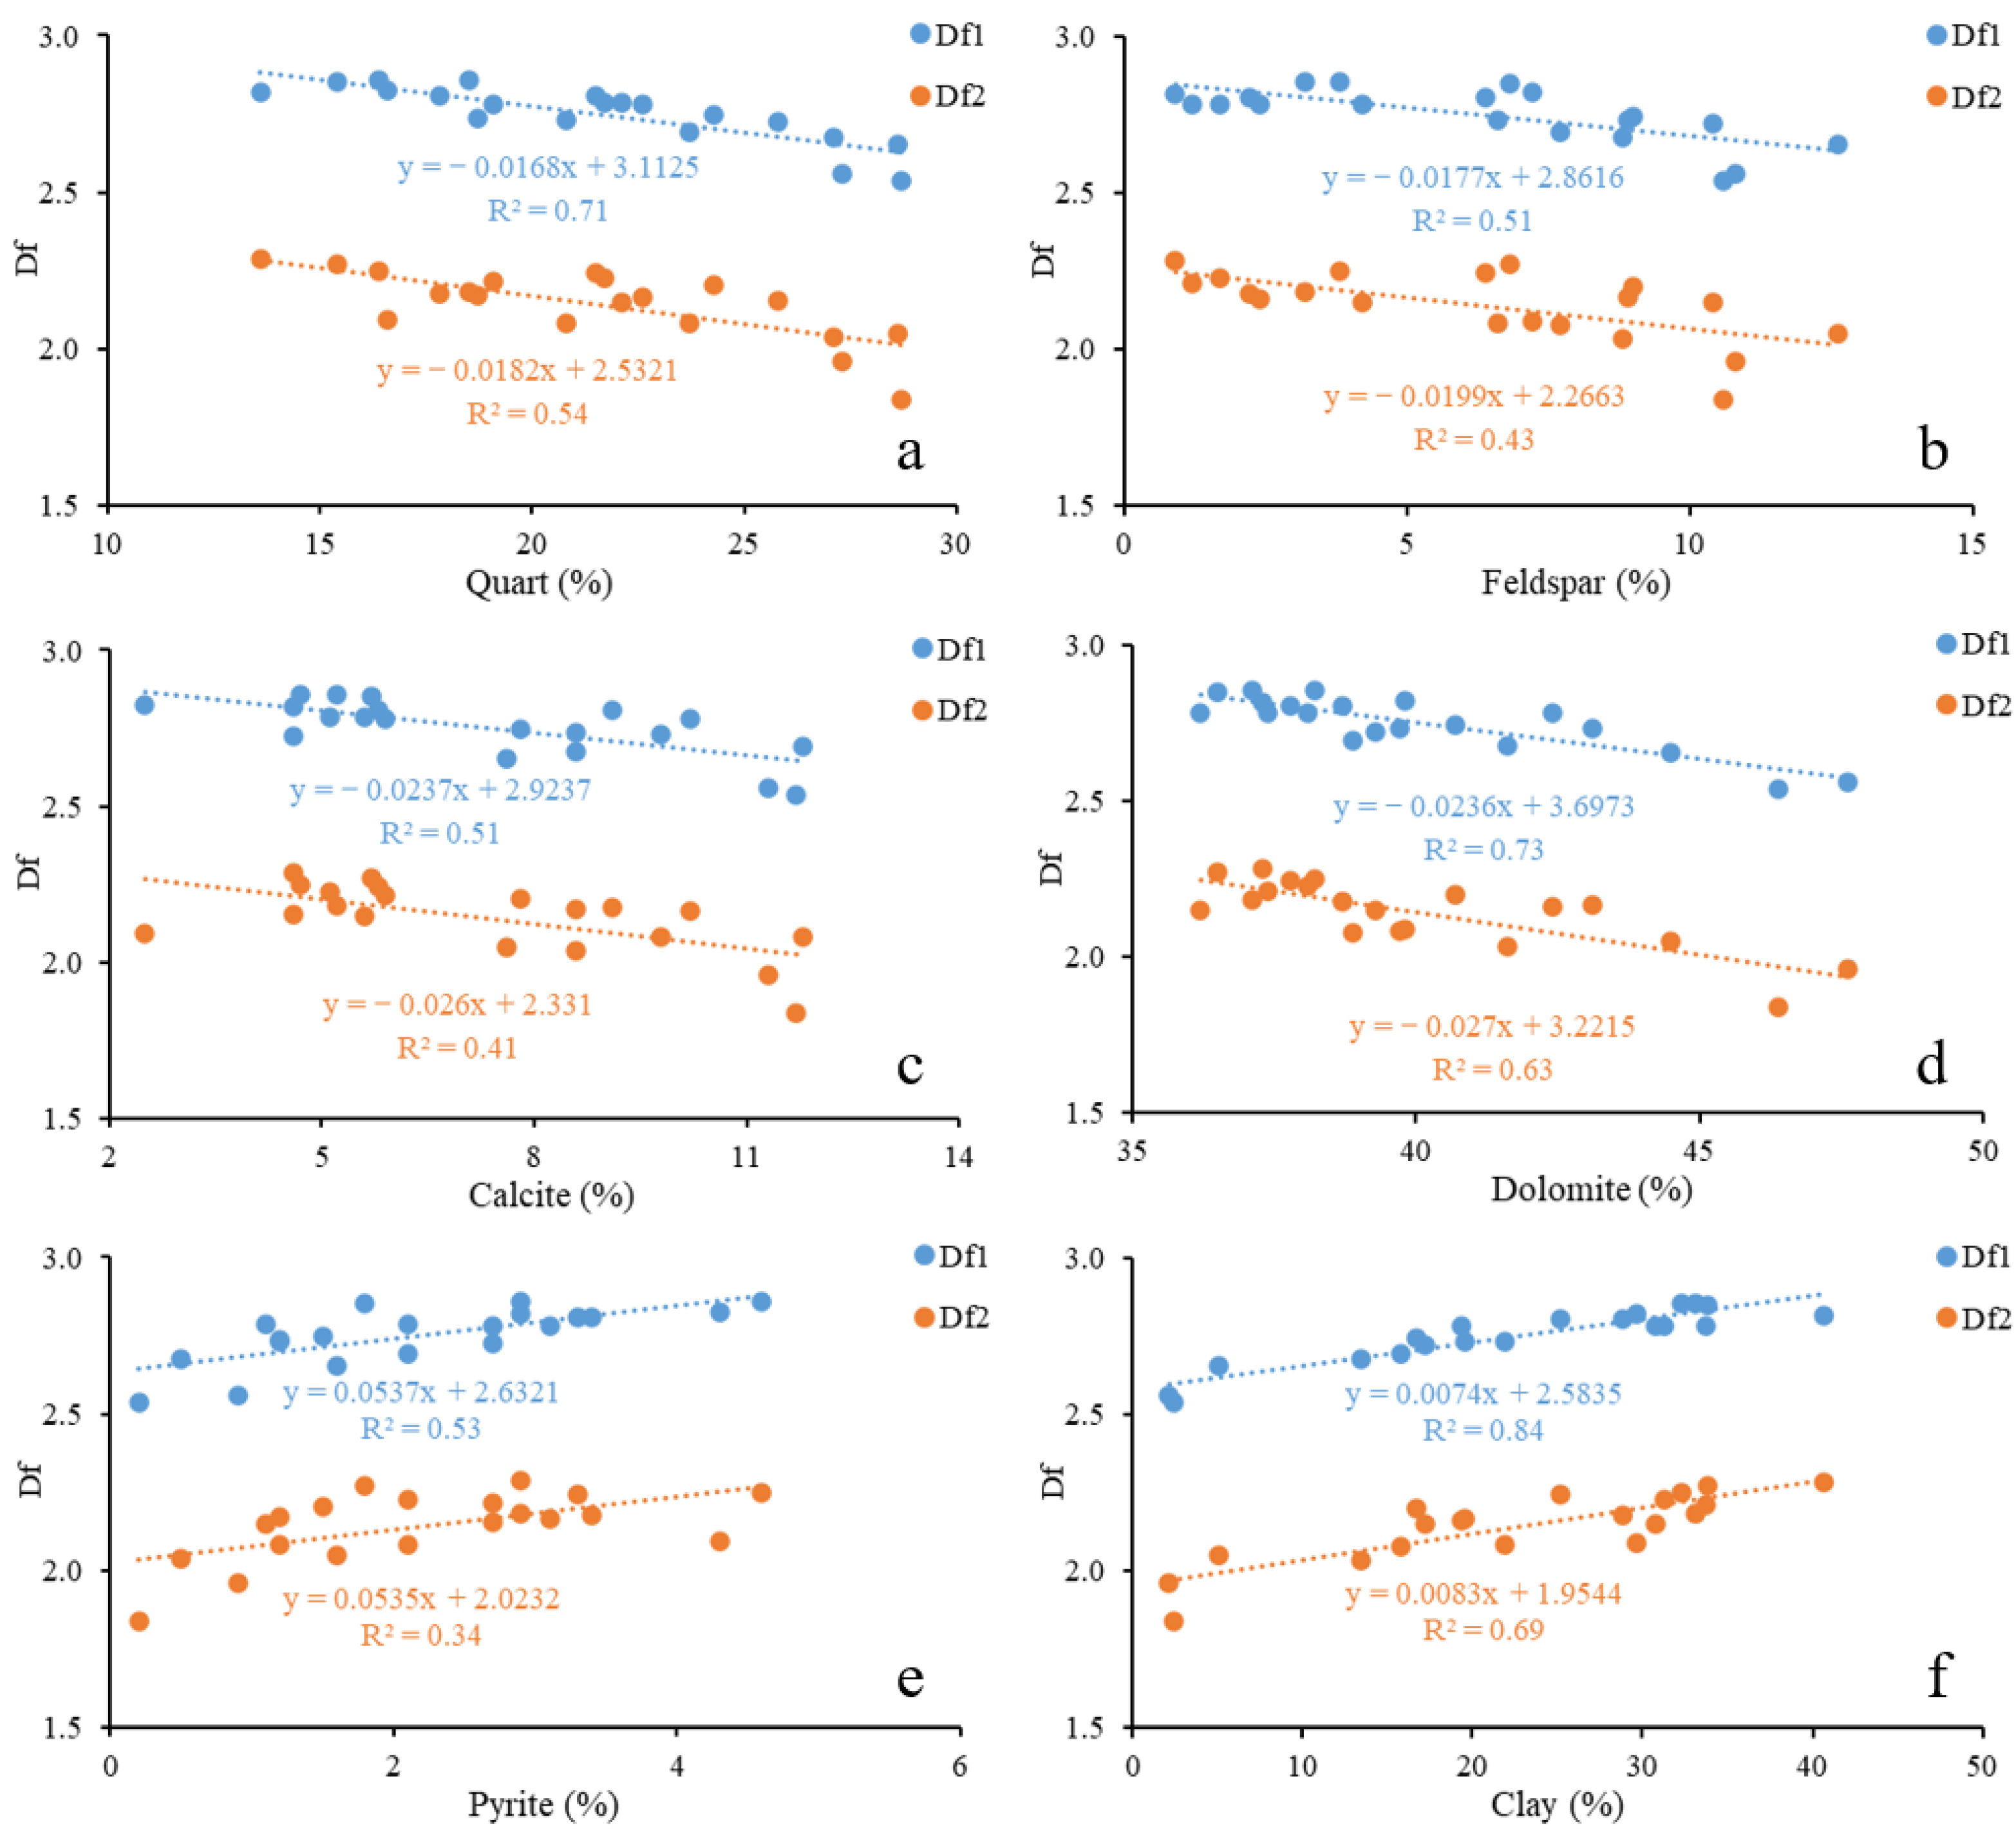
The Df of the shales is negatively correlated with quartz content (Figure 9a). Quartz grains are highly rigid and can preserve the morphology of primary macropores during diagenesis, while their relatively smooth surfaces increase pore-structure homogeneity, thereby reducing Df [18,19]. Similarly, Df is negatively correlated with the contents of feldspar, calcite, and dolomite (Figure 9b–d). During hydrocarbon generation and expulsion, organic acids released from organic matter can dissolve these relatively unstable minerals, enlarging existing pores, smoothing pore surfaces, and potentially creating new dissolution pores. These processes reduce pore-structure complexity, leading to lower Df [7,24]. In contrast, Df shows a weak positive correlation with pyrite content (Figure 9e). Higher pyrite content promotes the formation of interparticle and dissolution pores, which are generally irregular in shape, enhancing pore-structure complexity and increasing Df [3,4,7]. Df is strongly positively correlated with clay content (Figure 9f). Clay is rich in micropores and exhibits irregular pore morphology with rough surfaces, so shales with higher clay content display more complex pore structures and correspondingly higher Df [7,8,18]. Overall, variations in mineral type and content are key factors controlling shale fractal dimensions.

6. Conclusions

Shales from the Doushantuo Formation in the Yichang area are dominated by dolomite, clay minerals, and quartz. N2 adsorption–desorption isotherms exhibit type IV behavior, with mesopores predominating; specific surface areas range from 3.78 to 11.49 m2/g, and total pore volumes from 0.0039 to 0.0169 mL/g. Fractal analysis reveals two distinct fractal dimensions (Df1 = 2.5–2.9, Df2 = 1.8–2.3) corresponding to small and large pores, respectively, reflecting the complexity of the pore microstructure. The fractal dimensions decrease with increasing TOC, quartz, and carbonate contents, but increase with higher clay and pyrite contents, indicating that the heterogeneity and surface roughness of the shale pore system are primarily controlled by both mineral composition and organic matter content.

Author Contributions

F.M. wrote the first draft of the manuscript; Y.S. and X.L. contributed to the conception of the work; Q.Z., T.W., E.S. and Y.L. contributed to the analysis and interpretation of data for the work. All authors have read and agreed to the published version of the manuscript.

Funding

This research was funded by the Doctoral Research Startup Fund Project of Hubei Minzu University, grant number BS25090.

Data Availability Statement

The datasets generated during and/or analyzed during the current study are available from the corresponding author upon reasonable request.

Conflicts of Interest

Author Taifei Wu was employed by the Zhanjiang Branch, China National Offshore Oil Corporation. The remaining authors declare that the research was conducted in the absence of any commercial or financial relationships that could be construed as a potential conflict of interest.

References

  1. McMahon, T.P.; Larson, T.E.; Zhang, T.; Shuster, M. Geologic characteristics, exploration and production progress of shale oil and gas in the United States: An overview. Pet. Explor. Dev. 2024, 51, 925–948. [Google Scholar] [CrossRef]
  2. Stretesky, P.; Grimmer, P. Shale gas development and crime: A review of the literature. Extr. Ind. Soc. 2020, 7, 1147–1157. [Google Scholar] [CrossRef]
  3. Cao, T.; Song, Z.; Wang, S.; Xia, J. Characterization of pore structure and fractal dimension of Paleozoic shales from the northeastern Sichuan Basin, China. J. Nat. Gas Sci. Eng. 2016, 35, 882–895. [Google Scholar] [CrossRef]
  4. He, H.; Liu, P.; Xu, L.; Hao, S.; Qiu, X.; Shan, C.; Zhou, Y. Pore structure representations based on nitrogen adsorption experiments and an FHH fractal model: Case study of the block Z shales in the Ordos Basin, China. J. Pet. Sci. Eng. 2021, 203, 108661. [Google Scholar] [CrossRef]
  5. Clarkson, C.R.; Solano, N.; Bustin, R.M.; Bustin, A.; Chalmers, G.; He, L.; Melnichenko, Y.; Radliński, A.; Blach, T. Pore structure characterization of North American shale gas reservoirs using USANS/SANS, gas adsorption, and mercury intrusion. Fuel 2013, 103, 606–616. [Google Scholar] [CrossRef]
  6. Al-Yaseri, A.Z.; Lebedev, M.; Vogt, S.J.; Johns, M.L.; Barifcani, A.; Iglauer, S. Pore-scale analysis of formation damage in Bentheimer sandstone with in-situ NMR and micro-computed tomography experiments. J. Pet. Sci. Eng. 2015, 129, 48–57. [Google Scholar] [CrossRef]
  7. Yang, R.; Hu, Q.; Yi, J.; Zhang, B.; He, S.; Guo, X.; Hou, Y.; Dong, T. The effects of mineral composition, TOC content and pore structure on spontaneous imbibition in Lower Jurassic Dongyuemiao shale reservoirs. Mar. Pet. Geol. 2019, 109, 268–278. [Google Scholar] [CrossRef]
  8. Meng, F.; Gan, H.; Zhang, Q.; Liu, X.; Li, Y. The Fractal Characteristics of Pore Networks in Tight Sandstones: A Case Study of Nanpu Sag in Bohai Bay Basin, NE China. Fractal Fract. 2025, 9, 560. [Google Scholar] [CrossRef]
  9. Siddiqui, M.A.Q.; Ueda, K.; Komatsu, H.; Shimamoto, T.; Roshan, H. Caveats of using fractal analysis for clay rich pore systems. J. Pet. Sci. Eng. 2020, 195, 107622. [Google Scholar] [CrossRef]
  10. Jiang, G.; Shi, X.; Zhang, S.; Wang, Y.; Xiao, S. Stratigraphy and paleogeography of the Ediacaran Doushantuo Formation (ca. 635–551 Ma) in south China. Gondwana Res. 2011, 19, 831–849. [Google Scholar] [CrossRef]
  11. Zhang, F.; Xiao, S.; Kendall, B.; Romaniello, S.J.; Cui, H.; Meyer, M.; Gilleaudeau, G.J.; Kaufman, A.J.; Anbar, A.D. Extensive marine anoxia during the terminal Ediacaran Period. Sci. Adv. 2018, 4, eaan8983. [Google Scholar] [CrossRef] [PubMed]
  12. Cui, H.; Xiao, S.; Zhou, C.; Peng, Y.; Kaufman, A.J.; Plummer, R.E. Phosphogenesis associated with the Shuram Excursion: Petrographic and geochemical observations from the Ediacaran Doushantuo Formation of South China. Sediment. Geol. 2016, 341, 134–146. [Google Scholar] [CrossRef]
  13. Yang, F.; Ge, Z.; Zheng, J.; Tian, Z. Viscoelastic surfactant fracturing fluid for underground hydraulic fracturing in soft coal seams. J. Pet. Sci. Eng. 2018, 169, 646–653. [Google Scholar] [CrossRef]
  14. Zhang, Z.; Yang, Z. Theoretical and practical discussion of measurement accuracy for physisorption with micro-and mesoporous materials. Chin. J. Catal. 2013, 34, 1797–1810. [Google Scholar] [CrossRef]
  15. Mandelbrot, B.B. Les Objets Fractals: Forme, Hazard et Dimension; Flammarion: Paris, France, 1975. [Google Scholar]
  16. Pfeifer, P.; Wu, Y.J.; Cole, M.W.; Krim, J. Multilayer adsorption on a fractally rough surface. Phys. Rev. Lett. 1989, 62, 1997. [Google Scholar] [CrossRef]
  17. Zhang, S.; Tang, S.; Tang, D.; Huang, W.; Pan, Z. Determining fractal dimensions of coal pores by FHH model: Problems and effects. J. Nat. Gas Sci. Eng. 2014, 21, 929–939. [Google Scholar] [CrossRef]
  18. Lai, J.; Wang, G.; Wang, Z.; Chen, J.; Pang, X.; Wang, S.; Zhou, Z.; He, Z.; Qin, Z.; Fan, X. A review on pore structure characterization in tight sandstones. Earth-Sci. Rev. 2018, 177, 436–457. [Google Scholar] [CrossRef]
  19. Liu, X.; Xiong, J.; Liang, L. Investigation of pore structure and fractal characteristics of organic-rich Yanchang formation shale in central China by nitrogen adsorption/desorption analysis. J. Nat. Gas. Sci. Eng. 2015, 22, 62–72. [Google Scholar] [CrossRef]
  20. Huang, L.; Xiao, Y.; Yang, Q.; Chen, Q.; Zhang, Y.; Xu, Z.; Feng, X.; Tian, B.; Wang, L.; Liu, Y. Gas sorption in shale media by molecular simulation: Advances, challenges and perspectives. Chem. Eng. J. 2024, 487, 150742. [Google Scholar] [CrossRef]
  21. Milliken, K.L.; Olson, T. Silica diagenesis, porosity evolution, and mechanical behavior in siliceous mudstones, Mowry Shale (Cretaceous), Rocky Mountains, USA. J. Sediment. Res. 2017, 87, 366–387. [Google Scholar] [CrossRef]
  22. Cao, Y.; Jin, Z.; Zhu, R.; Liu, K. Pore systems and their correlation with oil enrichment in various lithofacies of saline lacustrine shale strata. Int. J. Coal Geol. 2024, 282, 104444. [Google Scholar] [CrossRef]
  23. Wang, X.; Hou, J.; Li, S.; Dou, L.; Song, S.; Kang, Q.; Wang, D. Insight into the nanoscale pore structure of organic-rich shales in the Bakken Formation, USA. J. Pet. Sci. Eng. 2020, 191, 107182. [Google Scholar] [CrossRef]
  24. Du, X.; Song, X.; Zhang, M.; Lu, Y.; Lu, Y.; Chen, P.; Liu, Z.; Yang, S. Shale gas potential of the Lower Permian Gufeng Formation in the western area of the Lower Yangtze Platform, China. Mar. Pet. Geol. 2015, 67, 526–543. [Google Scholar] [CrossRef]
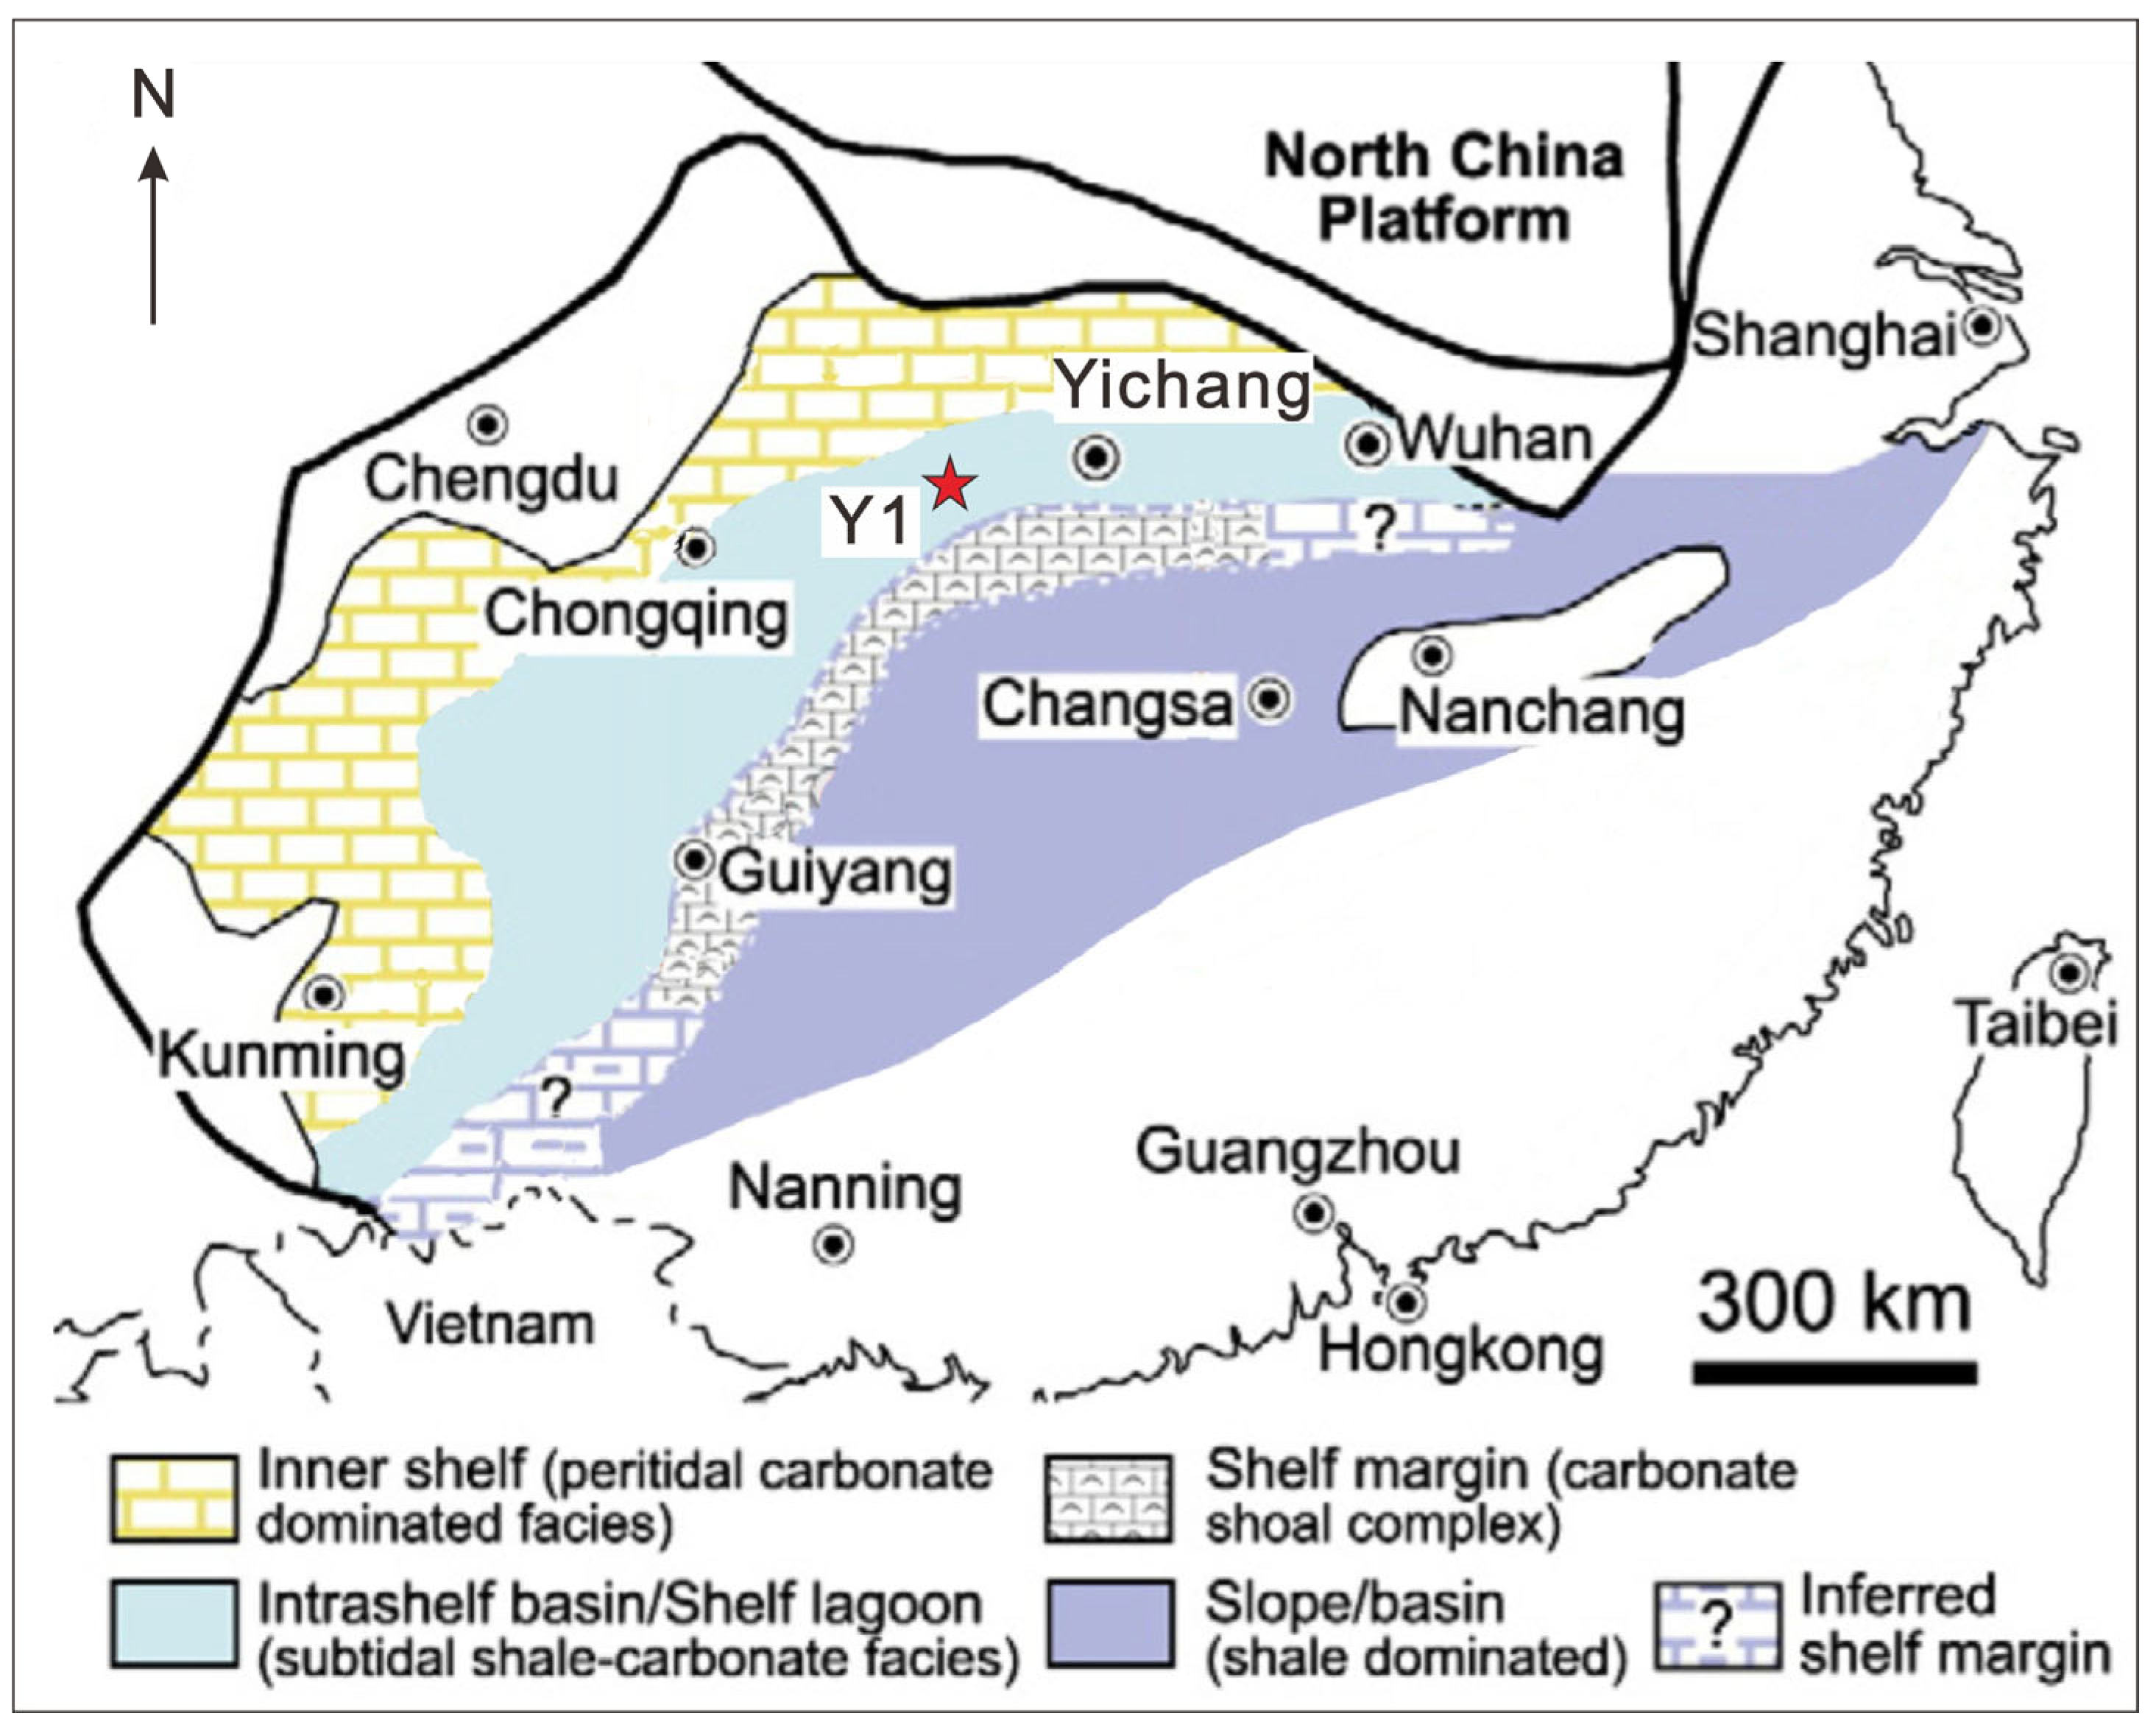
Figure 1. The generalized paleogeography of the Yangtze platform during the Doushantuo deposition (modified from [10]).
Fractalfract 09 00774 g001
Figure 2. (a) Stratigraphic column of the Yichang area; (b) lithologic column and sample distribution in the study interval.
Fractalfract 09 00774 g002
Figure 3. N2 adsorption and desorption isotherms of the samples. (a) Sample No. 3; (b) Sample No. 7; (c) Sample No. 14; (d) Sample No. 19.
Fractalfract 09 00774 g003
Figure 4. DFT pore size distributions of samples. (a) Sample No. 3; (b) Sample No. 7; (c) Sample No. 14; (d) Sample No. 19.
Fractalfract 09 00774 g004
Figure 5. A volume distribution histogram of the micropores, mesopores and macropores.
Fractalfract 09 00774 g005
Figure 6. Double logarithm curves of the logarithms of the volume and relative pressure. (a) Sample No. 3; (b) Sample No. 7; (c) Sample No. 14; (d) Sample No. 19.
Fractalfract 09 00774 g006
Figure 7. Correlation between fractal dimension and TOC.
Fractalfract 09 00774 g007
Figure 8. Correlation between fractal dimension and parameters of pore structure. (a) Df and specific surface area; (b) Df and average pore size; (c) Df and total pore volume.
Fractalfract 09 00774 g008
Figure 9. Corrections between fractal dimension and mineral compositions. (a) Df and quart; (b) Df and feldspar; (c) Df and calcite; (d) Df and dolomite; (e) Df and pyrite; (f) Df and clay.
Fractalfract 09 00774 g009
Table 1. X-ray diffraction analysis results.
Sample No.Quartz (%)Feldspar (%)Calcite (%)Dolomite (%)Pyrite (%)Clay (%)
128.612.67.644.51.65.1
221.56.45.837.83.325.2
322.14.25.636.21.130.8
415.46.85.736.51.833.8
520.86.69.839.71.221.9
618.78.98.643.11.219.5
724.397.840.71.516.7
817.82.29.138.73.428.8
916.67.22.539.84.329.6
1022.62.410.242.43.119.3
1123.77.711.838.92.115.8
1213.60.94.637.32.940.7
1327.18.88.641.60.513.4
1427.310.811.347.60.92.1
1525.810.44.639.32.717.2
1619.11.25.937.42.733.7
1721.71.75.138.12.131.3
1828.710.611.746.40.22.4
1918.53.25.237.12.933.1
2016.43.84.738.24.632.3
Table 2. The pore structure features of the samples.
Sample No.Specific Surface Area (m2/g)Total Pore Volume (mL/g)Average Pore Size (nm)Micropore Volume (mL/g)Mesopore Volume (mL/g)Macropore Volume (mL/g)
15.4740.012448.2990.00010.00950.0010
210.750.0081294.210.00220.00790.0006
39.8990.0122724.6310.00180.00820.0007
411.050.0053943.4140.00240.00600.0004
58.3560.0129695.5060.00130.00890.0006
68.2140.0099315.9170.00140.00920.0008
77.2820.0083155.5730.00130.00750.0007
811.490.0084314.2630.00230.00840.0007
98.470.010933.9440.00450.01240.0012
109.9990.0092114.8810.00180.00880.0008
116.6850.01197.5860.00090.00940.0012
129.9960.0071514.1340.00210.00660.0008
137.6020.014888.480.00100.01150.0021
143.780.0163613.890.00010.01010.0018
157.3170.010176.4850.00100.00870.0009
1610.730.0094794.8680.00210.00900.0009
177.4810.0039324.9470.00070.00330.0005
184.720.01687317.090.00010.00210.0006
198.6510.005043.3380.00200.00450.0003
2010.370.0053653.4760.00220.00550.0006
Table 3. Pore fractal dimension calculation results.
Sample No.K1Df1Df1 Correlation CoefficientK2Df2Df2 Correlation Coefficient
1−0.32.70.98−1.02.00.93
2−0.22.80.98−0.82.20.95
3−0.22.80.98−0.82.20.94
4−0.12.90.96−0.72.30.96
5−0.32.70.99−0.92.10.95
6−0.32.70.99−0.82.20.96
7−0.32.70.99−0.82.20.96
8−0.22.80.98−0.82.20.94
9−0.22.80.98−0.92.10.96
10−0.22.80.99−0.82.20.95
11−0.32.70.99−0.92.10.98
12−0.22.80.98−0.72.30.96
13−0.32.70.99−1.02.00.98
14−0.42.60.99−1.02.00.98
15−0.32.70.98−0.82.20.98
16−0.22.80.99−0.82.20.97
17−0.22.80.99−0.82.20.9
18−0.52.50.99−1.02.00.97
19−0.12.90.97−0.82.20.93
20−0.12.90.96−0.72.30.9
Disclaimer/Publisher’s Note: The statements, opinions and data contained in all publications are solely those of the individual author(s) and contributor(s) and not of MDPI and/or the editor(s). MDPI and/or the editor(s) disclaim responsibility for any injury to people or property resulting from any ideas, methods, instructions or products referred to in the content.