Article

A Novel Method to Determine the Grain Size and Structural Heterogeneity of Fine-Grained Sedimentary Rocks

1
The State Key Laboratory of Continental Shale Oil, Northeast Petroleum University, Daqing 163318, China
2
The Artificial Intelligence Energy Research Institute, Northeast Petroleum University, Daqing 163318, China
3
The Heilongjiang Provincial Key Laboratory of Networking and Intelligent Control, Northeast Petroleum University, Daqing 163318, China
4
Institute of Unconventional Oil & Gas, Northeast Petroleum University, Daqing 163318, China
5
School of Geosciences, China University of Petroleum (East China), Qingdao 266580, China
*
Author to whom correspondence should be addressed.
Fractal Fract. 2025, 9(10), 642; https://doi.org/10.3390/fractalfract9100642
Submission received: 7 August 2025 / Revised: 17 September 2025 / Accepted: 25 September 2025 / Published: 30 September 2025
(This article belongs to the Section Engineering)

Abstract

Fine-grained sedimentary rocks exhibit significant textural heterogeneity, often obscured by conventional grain size analysis techniques that require sample disaggregation. We propose a non-destructive, image-based grain size characterization workflow, utilizing stitched polarized thin-section photomicrographs, k-means clustering, and watershed segmentation algorithms. Validation against laser granulometry data indicates strong methodological reliability (absolute errors ranging from −5% to 3%), especially for particle sizes greater than 0.039 mm. The methodology reveals substantial internal heterogeneity within Es3 laminated shale samples from the Shahejie Formation (Bohai Bay Basin), distinctly identifying coarser siliceous laminae (grain size >0.039 mm, Φ < 8 based on Udden-Wentworth classification) indicative of high-energy depositional environments, and finer-grained clay-rich laminae (grain size <0.039 mm, Φ > 8) representing low-energy conditions. Conversely, massive mudstones exhibit comparatively homogeneous grain size distributions. Additionally, a multifractal analysis (Multifractal method) based on the S50bi/S50si ratio further quantifies spatial heterogeneity and pore-structure complexity, significantly enhancing facies differentiation and reservoir characterization capabilities. This method significantly improves facies differentiation ability, provides reliable constraints for shale oil reservoir characterization, and has important reference value for the exploration and development of the Bohai Bay Basin and similar petroliferous basins.

1. Introduction

Fine-grained sedimentary rocks, defined as clastic or chemical sedimentary formations where particles smaller than 63 μm account for more than 50% of the total volume [1,2,3], represent one of the most widespread and geologically significant rock types on Earth. These rocks, including shales, mudstones, and siltstones, are not only critical archives of paleoenvironmental changes (e.g., paleoclimate, paleohydrology, and tectonic activity) but also serve as major source rocks and reservoirs for unconventional hydrocarbons, particularly shale oil and gas [4,5]. In China, fine-grained sedimentary rocks are extensively distributed across major petroliferous basins, such as the Bohai Bay Basin (Shahejie Formation), Songliao Basin (Qingshankou Formation), Sichuan Basin (Longmaxi Formation), and Ordos Basin (Yanchang Formation), making them central to the country’s energy security strategy [6].
Grain size, as a fundamental sedimentological parameter, encodes critical information about depositional processes and post-depositional modifications (e.g., coarser grains indicate high hydrodynamic energy; finer grains indicate low energy [7]). For fine-grained rocks, variations in grain size (e.g., mean diameter, sorting, and skewness) reflect changes in hydrodynamic conditions (e.g., current velocity, wave energy, and suspension settling rates), source material supply, and paleoenvironmental stability [8,9]. For example, coarser grain sizes in shale sequences often indicate episodes of enhanced water turbulence (e.g., storm events or riverine input), while finer grains suggest calm, low-energy environments (e.g., deep lacustrine or abyssal settings) [7]. Additionally, grain size directly influences reservoir properties: finer grains typically reduce porosity and permeability due to tighter packing, while coarser siliceous or carbonate fractions can enhance connectivity, creating “sweet spots” for shale oil accumulation [10,11]. Thus, accurate grain size analysis is pivotal for lithofacies classification, depositional model construction, and reservoir quality evaluation in fine-grained sedimentary systems—as validated by Al-Mudhafar et al. [12] (2025)’s facies-supported modeling, where grain size correlates with permeability.
However, traditional grain size analysis methods face significant challenges when applied to fine-grained sedimentary rocks, especially those with strong structural heterogeneity. The most commonly used techniques include the following:
Sieving and sedimentation methods: These are ineffective for particles smaller than 63 μm (silt and clay fractions) due to limitations in sieve aperture size and difficulties in measuring slow-settling particles [13,14]. Sieving also disrupts the original rock structure, precluding any linkage between grain size and sedimentary fabrics (e.g., lamination or bioturbation).
Laser granulometry: This method, based on light scattering, offers high precision and a wide measurement range (0.2–2000 μm) [15]. However, it requires disaggregating samples into homogeneous suspensions, which destroys primary sedimentary structures (e.g., laminations, nodules, or burrows) [16]. For heterogeneous rocks like laminated shale, this destruction masks the spatial variability in grain size, leading to averaged results that obscure critical depositional signals (e.g., seasonal fluctuations in sediment supply) [17].
Scanning Electron Microscopy (SEM): SEM provides high-resolution images of individual particles, enabling detailed mineralogical and morphological analysis [18]. Yet, its limited field of view (typically < 100 × 100 μm) makes it unsuitable for capturing macroscale structural heterogeneity (e.g., meter-scale lamina sets). This restriction limits its application in studies requiring a representative sampling of the entire rock volume [19].
Recent advances in AI-driven petrophysics emphasize data-driven techniques [20], such as Machine Learning [21] and Vision Transformers [22], for multiscale image analysis—this study aligns with this paradigm by integrating unsupervised learning into grain recognition [23].
Conventional image analysis: Microscopic image-based methods, using optical or electron microscopy, have been applied to measure grain size in thin sections [24,25]. However, these methods often rely on manual particle counting or simple segmentation algorithms, resulting in low throughput and an inability to distinguish subtle variations in grain size across large areas. As a result, they primarily yield bulk grain size distributions, failing to characterize the pronounced spatial heterogeneity inherent to fine-grained rocks [26].
These limitations are particularly problematic in the Bohai Bay Basin, one of China’s most important shale oil provinces. The third member of the Shahejie Formation (Es3) in this basin consists of interbedded fine-grained rocks, including laminated shale, massive mudstone, and dolomitic mudstone, formed in a complex lacustrine environment with fluctuating salinity and hydrodynamic conditions [6,27,28]. Previous studies of Es3 fine-grained rocks have predominantly relied on bulk grain size data from laser granulometry [16]. This method requires sample disaggregation, which destroys siliceous-clay laminae—thus failing to resolve structural controls on grain size (e.g., periodic changes in lake productivity recorded by laminae [27,28]). It also cannot resolve the structural controls on grain size—for example, the alternating siliceous and clay-rich laminae in shale, which record periodic changes in lake productivity and clastic input. The lack of structural context (e.g., lamina distribution) hinders depositional models by masking hydrodynamic fluctuations (e.g., seasonal sediment supply). High-quality reservoir intervals are defined as siliceous-rich laminae with high porosity (>5%) and permeability (>0.1 mD)—attributes captured by the new method’s sub-regional analysis.
To address these gaps, we present a novel image-based grain size analysis method specifically designed for fine-grained sedimentary rocks. This method integrates large-field-of-view thin-section imaging, advanced image processing (hierarchical clustering and watershed segmentation), and regional statistical analysis to preserve primary sedimentary structures while quantifying spatial variations in grain size. By avoiding sample disaggregation, it retains critical textural information (e.g., lamination, bioturbation, and mineral segregation), enabling direct links between grain size distribution and depositional processes.
The objectives of this study are as follows: (1) to establish a robust workflow for image-based grain size segmentation in fine-grained rocks; (2) to validate the method against laser granulometry using samples from the Bohai Bay Basin; (3) to demonstrate its ability to characterize structural heterogeneity and distinguish between lithofacies (e.g., laminated shale vs. massive mudstone); and (4) to discuss its implications for understanding depositional dynamics and improving shale oil reservoir evaluation in Chinese petroliferous basins.

2. Samples and Methods

2.1. Samples

The Shahejie Formation in Qikou Sag, Bohai Bay Basin, China, is favorable for shale oil exploration and development. However, it is difficult to determine the particle size distribution of shale according to thin sections, especially when studying the change in particle size of shale vertically. In this study, two samples (laminated shale, massive mudstone) were selected from a continuous core interval (3883–3884 m) of Well F39X1, representing the dominant lithofacies of the Es3 member [27,28]. Each sample’s stitched image (3 × 3 grid) covers ~3 × 3 mm, encompassing both laminae (for shale) and homogeneous domains (for mudstone)—ensuring spatial representativeness:
Laminated shale: Interbedded siliceous laminae (0.1–0.5 mm thick) and clay-rich laminae (0.05–0.2 mm thick), reflecting periodic changes in clastic input and biological productivity.
Massive mudstone: Homogeneous texture with no visible layering, interpreted as deposits of low-energy, stable deep-lake environments.

2.2. Methodology

According to the principle of stereology, the characteristics of feature points in three-dimensional space can be represented by the eigenvalues of feature points in the two-dimensional section [5]. The image analysis method is used to detect and edit the pixel groups of feature points to obtain the eigenvalues of the two-dimensional image. In order to test the accuracy of the new method, this study uses the laser particle size analysis method to measure the particle size of the same sample.

2.2.1. Sample Pretreatment and Image Capture

A standard core column with a diameter of 2.5 cm was drilled on the shale core by diamond line drilling, and thin sections were prepared on the precision polishing machine (Figure 1a,b). Zeiss Axio image Z1 polarized microscope (Figure 1c) was used to select a representative field of view; adjust the eyepiece to 10× and the objective lens to 5×, take a picture in the single polarized mode, and then take another one in the orthogonal polarized mode. To improve the representativeness of the sample, the sample was manually moved by 2 mm left/right each time and 1.5 mm up/down each step, completing 3 × 3 grids of images (Figure 1d). Manual movement (2 mm left/right, 1.5 mm up/down) was to avoid image overlap while covering the entire thin section (diameter 2.5 cm). This design was validated by the <5% absolute error with laser granulometry (Table 1), confirming that the stitched image reflects the bulk sample’s grain size distribution.

2.2.2. Image Processing

a.
Mosaic and Fusion of Images
Nine single polarized images and nine orthogonal polarized images were imported into Photoshop cc2017, and the repeated areas of the single polarized images were superimposed to splice the nine single polarized images (Figure 1e). At the same time, nine orthogonal polarized images were also spliced (Figure 1g). After splicing, the brightness and contrast of nine single polarized images were adjusted to make them consistent. The nine single polarized images were fused into one image after splicing and adjustment, and the nine orthogonal polarized images were also adjusted in brightness contrast and fused.
b.
Grain Recognition by Image Analysis Method
Considering the difference of particle information between single polarized light and orthogonal polarized light, they are combined to identify particles. The fused single and orthogonal polarized images were transformed into 8-bit gray-scale images, and the [5, 5] median filtering was carried out twice—[5, 5] denotes the median filtering window size (5 × 5 pixels), which smooths image noise while preserving particle edges. The filtered image was clustered by using the k-means clustering analysis method—a core technique of unsupervised machine learning (a branch of AI). This aligns with data-driven petrophysical paradigms [20,21], which emphasize automation in grain recognition while avoiding manual bias. The integration of k-means with watershed segmentation further reflects AI-augmented analysis, distinct from traditional manual image processing [26]. The clustering coefficient of the single polarized image was set to 3, and the value of the orthogonal polarized image was set to 2. Parameter sensitivity tests confirm the following: k = 3 for single-polarized images avoids under-segmentation (k = 2) or over-segmentation (k = 4); k = 2 for cross-polarized images prevents splitting clay aggregates—these parameters are consistent across both samples, with absolute errors <5% (Table 1). After clustering, the region with the value of 2 in the orthogonal polarized image was defined as the foreground color (Figure 1f), and the region with the value of 1 and 2 in the single polarized image was defined as the background color (Figure 1h). The watershed algorithm was used to segment the filtered single polarized gray image (Figure 1i), and the extracted particles were filled to obtain the final recognized particle graph (Figure 1j).

2.2.3. Process of Grain Size Distribution (GSD) Analysis

Using the regionprops function in MATLAB 2024a Image Processing Toolbox, the particles in the final recognized particle graph were quantitatively analyzed, and the equivalent diameter of each particle, Di, and equivalent area, Ai, was obtained. Since the statistics here are based on the analysis of pixels, it is necessary to convert pixels into actual physical quantities. The length of a single pixel, lp, is equivalent to 0.9715 μm of the image under the microscope. The actual diameter of each particle, Dpi, and the actual area, Api, are as follows:
Dpi = Di × lp and Api = Ai × lp2
Udden–Wentworth grain size classification is widely used in geological research [29,30,31,32,33]. This classification takes a millimeter as the unit, and sets most boundaries to vary by a factor of two, grouping particles into the following categories: 28 mm, 26 mm, 24 mm, 22 mm, 20 mm, 2−2 mm, 2−4 mm, 2−6 mm, and 2−8 mm. The accuracy of grain size classification improves with the decrease in particle size. The parameters Phi(φ) and Grain Size Distribution (GSD) were calculated to describe the grain size of the nine samples [29,34,35].
φ = −log2D
where D is the actual diameter of each grain.
Phi(φ) is used to represent the grain size according to the interval statistics. The interval is statistical, which is divided into a total of 24 intervals as follows: under −1, −1 to 10 in a step of 0.5, and above 10 (Figure 1k).

2.2.4. Local GSD Analysis Process

To better characterize the significant heterogeneity of grain size of fine-grained sedimentary rocks, the images are grouped and counted. The identified particle image was divided into ten evenly distributed regions, and the area and number of particles in each region were counted. The stitched image (3 × 3 mm) covers the entire thin section, and its bulk grain size distribution shows <5% absolute error with laser granulometry (Table 1)—confirming representativeness. The five blue/red regions (sorted by S50bi/S50si) capture the full range of grain size variability. In the cumulative distribution curve of particle size and particle area, the particle size corresponding to 50% of cumulative particle area was defined as φ50. The area and number of particles of which particle size is below φ50 is defined as S50si and N50si, while the area and number of particles above φ50 are defined as S50bi and N50bi. The five regions with the largest ratio of S50bi/S50si (Figure 1l, blue area) were chosen, and the cumulative particle size distribution curves were drawn by using the data counted in these five regions. The same procedure was applied in the five regions with the smallest ratio of S50bi/S50si (Figure 1l, red area). The comparable result diagram is shown in Figure 1m.

2.2.5. Laser Granulometry

This technique uses the principle of diffraction and scattering of a laser beam striking a particle [15,36]. Light from a laser is shone on a cloud of particles suspended in a dispersant (gas or liquid). The particles scatter the light. The larger the particles, the smaller the scattering angles [15,36]. The scattered light is measured by a series of photodetectors placed at different angles. This is known as the diffraction pattern for the sample. The diffraction pattern can be used to measure the size of the particles using Mie or Fraunhofer theory [15,36]. Obtained results allow for drawing a curve, called particle size distribution (volumetric distribution), and calculating parameters such as mean diameter.
Firstly, before testing, a small amount of rock sample was taken, crushed into small pieces, and subjected to various processes to remove different compositions and cementing materials. The pyrolysis method was used in this study to remove oil, and the constant pyrolysis time at 400 °C was not less than 4 h. Then, heating was performed in excessive 6% hydrogen peroxide to remove organic matter, excessive 10–20% salt and acid to dissolve calcareous cement, and excessive 5–10% nitric to dissolve pyrite cement, soaking in clean water to remove clay minerals and gypsum cement. After these treatments, the samples were rinsed with water repeatedly until neutral pH and then dried. Secondly, samples were ground repeatedly with a rubber hammer until the particles were completely dissolved. Finally, some prepared samples were put into the testing instrument, and 3–5 drops of 0.2% sodium hexametaphosphate solution were added; then, the suspension was detected automatically by the laser particle size analyzer instrument, and the particle size data were obtained. In the pretreatment of laser granulometry, calcareous cement, pyrite cement, and organic matter (matrix) were removed via acid dissolution and pyrolysis. The proposed method focuses on grain size–sediment fabric correlations, so cement/matrix were not separately quantified—future studies will integrate XRD to characterize their synergistic effects with grains.

2.2.6. Multifractal Method

For the selected region (blue/red region), define the total area of pores with a particle size greater than or equal to Di as
S Di = k = i n A k
where Di is the i-th particle size, Ak is the pore area corresponding to the k-th particle size, and N is the total number of grades (24 grades).
Perform logarithmic transformation on the particle size and cumulative area:
X i   =   log 10 ( D i )
Y i = log 10 ( S ( D i ) )
In the double logarithmic coordinate system, fit the linear relationship:
Y   =   a   +   bX
The fractal dimension Df is determined by the slope b.
D f = b
When the correlation coefficient R2 > 0.98, the pore structure is considered to have fractal characteristics:
R 2   =   1 i = 1 N ( Y i Y i ^ ) 2 i = 1 N ( Y i Y ¯ ) 2 >   0 . 98
where Y i ^ is the fitted value and Y ¯ is the mean value.
The pore binarized image is considered as data set I. The data set I is segmented into N(r) partition with scale r. N(r) is equal to 2n, and n is a positive integer.
N r = I r = 2 n
The probability measure of the i-th partition set at scale r can be expressed as Equation (10).
P i = V i ( r ) V i = 1 N ( r ) i ( r )
where Vi(r) is the surface porosity of i-th partition.
When the data set I has multiple fractal characteristics, the probability measure Pi(r) and the scale r are in a power exponential relationship.
P i ( r ) r a i
where ai is the Coarse-Holder index or singular intensity, which represents the density of the data distribution of the i-th partition set.
Therefore, different partition sets may have the same singular intensity, using Na(r) to denote the cumulative proportion of the partition sets with singular intensity distribution between a and a ± da.
N a r r f a
where f(a) is the singular spectrum.
The partition function is defined as
Z q , r = p i = 1 N ( r ) i ( r ) q r τ ( q )
where q is the weight factor, which ranges from [−∞, +∞], τ(q) is the mass function.
τ q = lim r 0 log   Z ( q , r ) log   r = lim r 0 log p i = 1 N ( r ) i ( r ) q log   r
We can define the generalized dimension D(q) as Equation (15) using Pi(r) and q.
D q = τ ( q ) 1 q = 1 1 q log p i = 1 N ( r ) i ( r ) q log   r ,   q 1 p i = 1 N ( r ) i ( r ) log   p i ( r ) log   r ,   q = 1
The relationship between α(q), τ(q), and f(a) can be obtained from the Legendre transformation.
a q = d τ ( q ) dq
f a = qa q τ ( q )

3. Results and Discussion

3.1. Comparison of the New Image-Based Method and Laser Particle Size Analysis Method

3.1.1. Results of the Image Recognition Based on the New Method

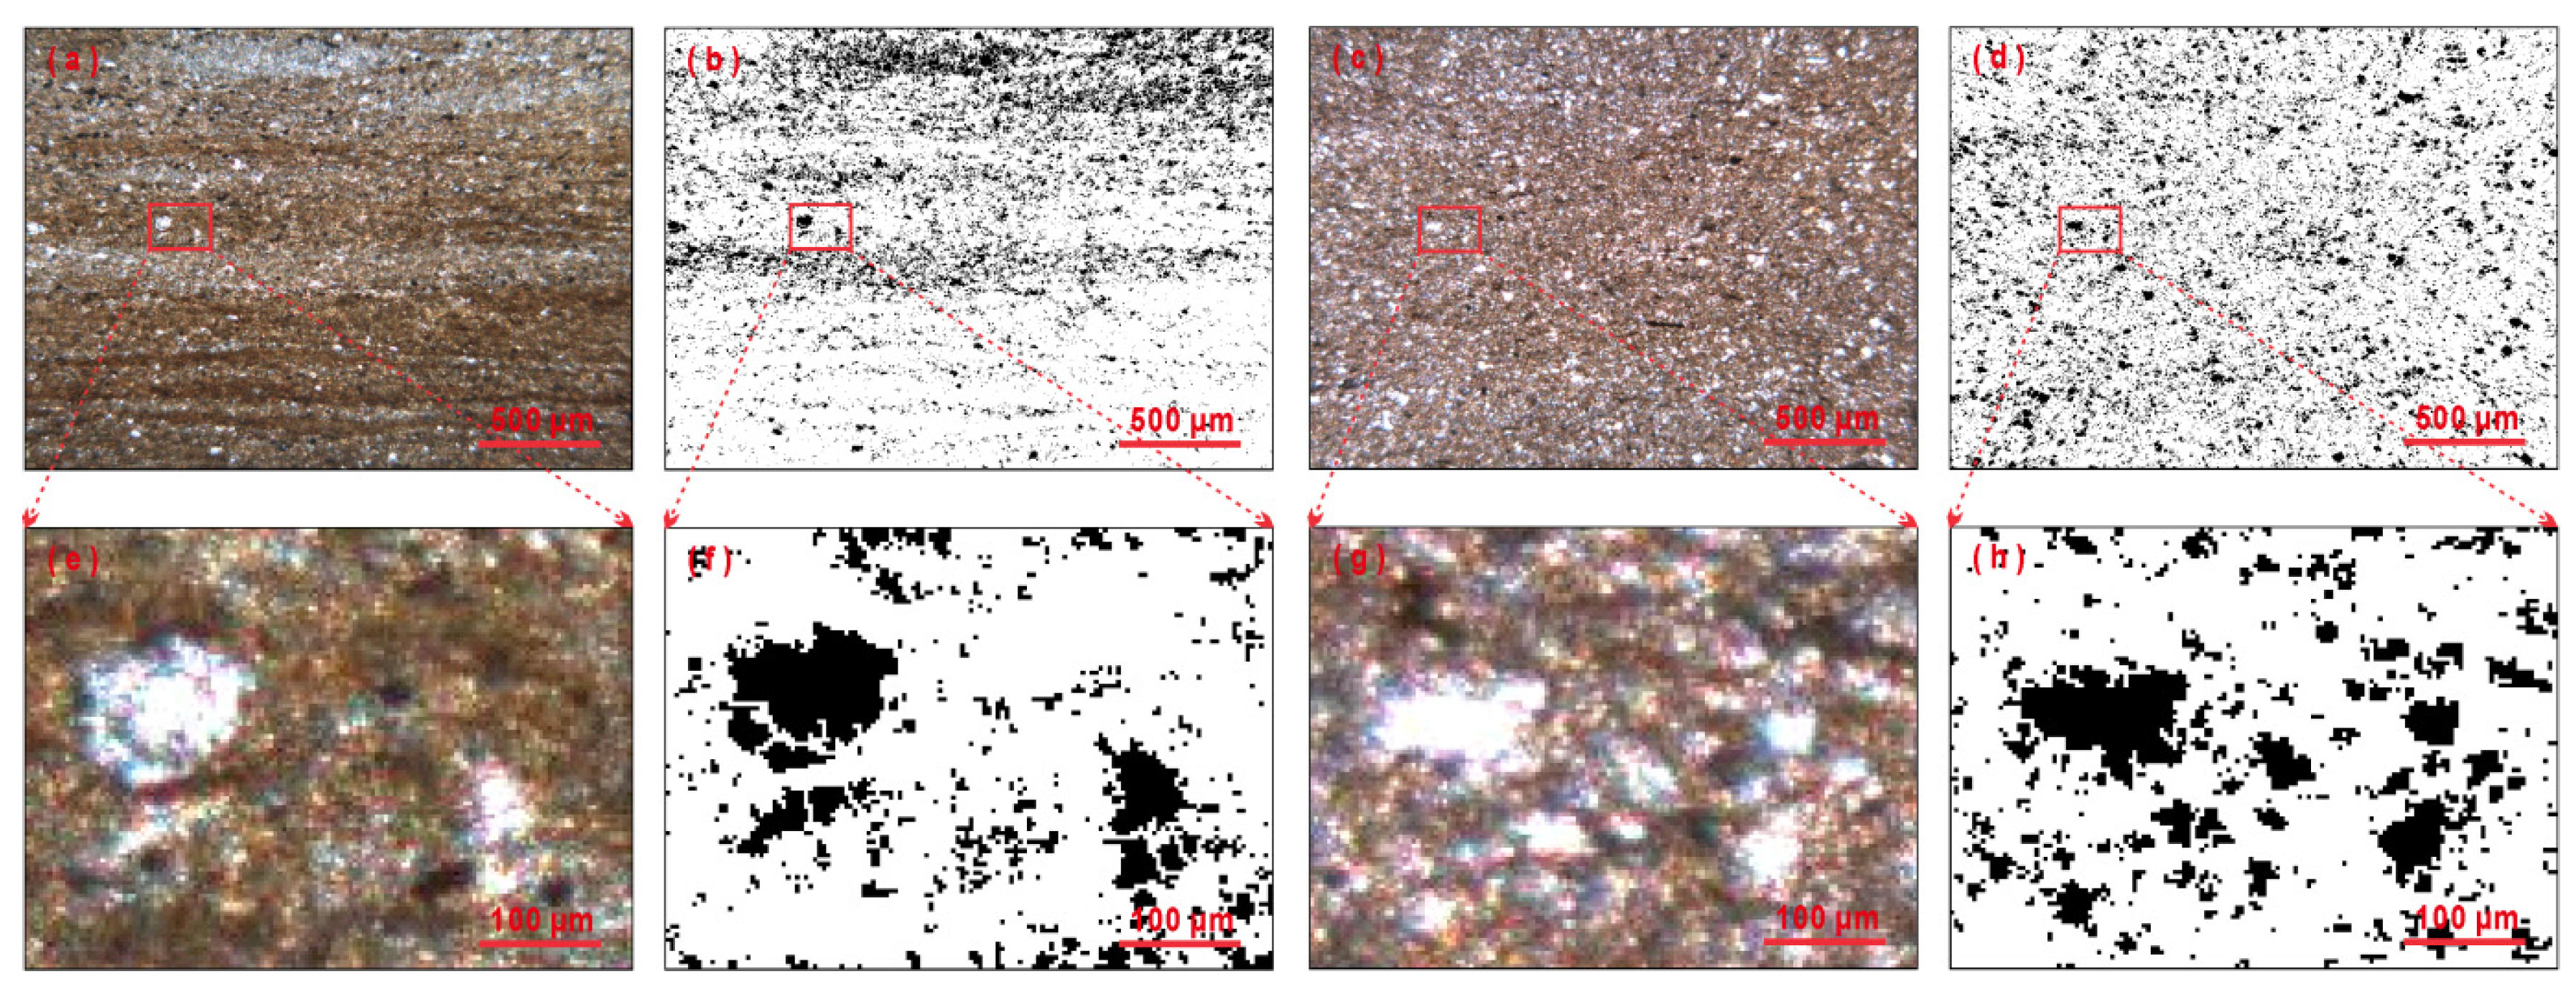
The processed images of the thin section are shown in Figure 2, and the identified grains are minerals with strong light transmittance (such as siliceous and calcareous minerals). The identified particle plane distribution shows obvious structural information (Figure 2a–d): layered (Figure 2a,b) and massive bedding (Figure 2c,d). The former occurs in the laminar shale and the latter in the massive or gravel-bearing mudstone.

3.1.2. Comparison of the New Method and Laser Particle Size Analysis Method

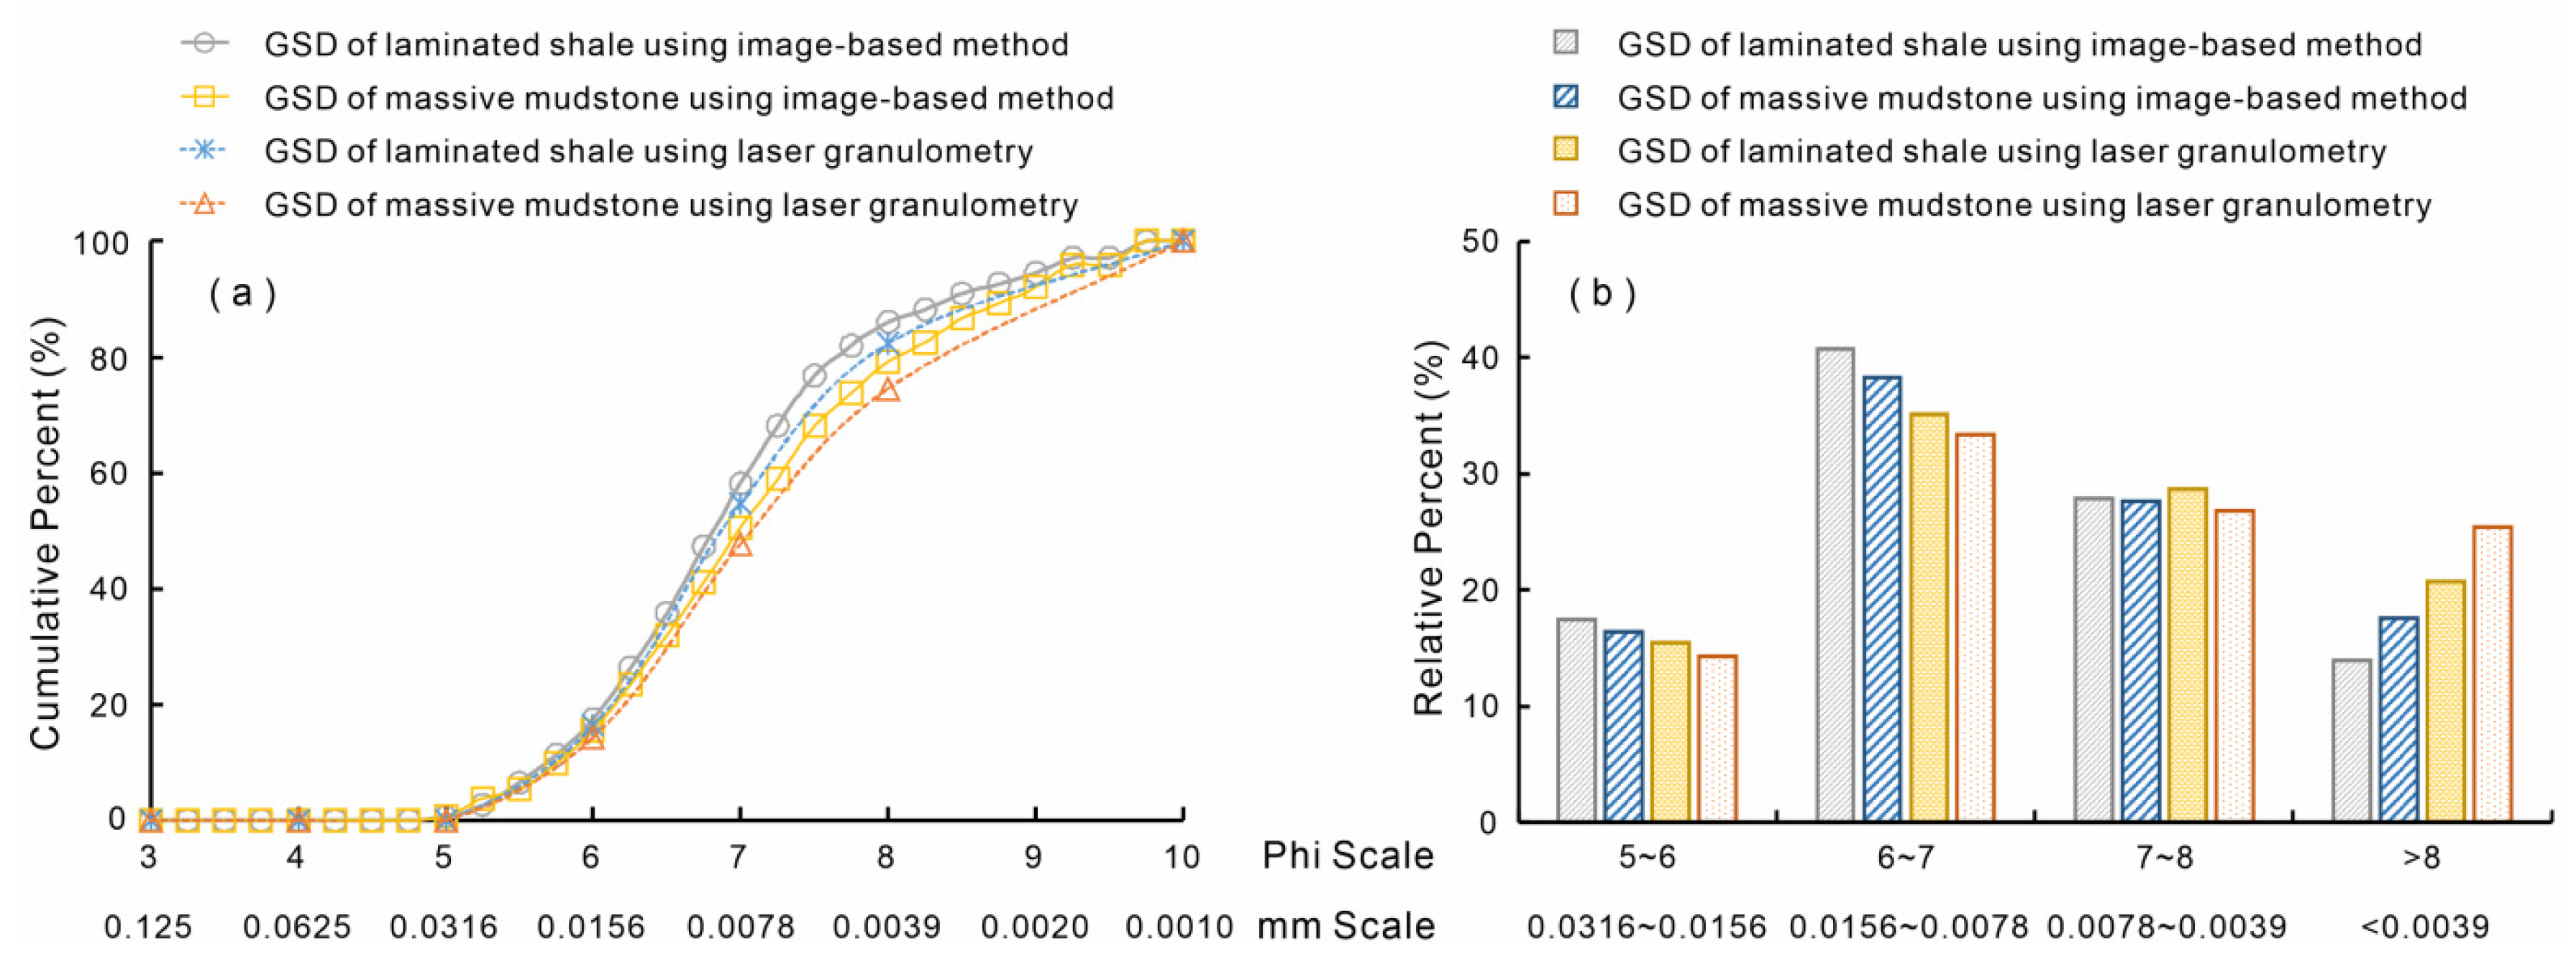
The cumulative/normal grain size distribution curve (GSD) was one of the most effective and frequently used forms to characterize grain size [37]. Cumulative/normal grain size distribution curves based on the new method and laser particle size analysis method were drawn to compare the results of the two ways (Figure 3a,b). Results show that the particle sizes based on the two ways are relatively consistent and both concentrated between 6Φ and 8Φ (Figure 3), and the calculated absolute error and relative error of the two ways at different particle size ranges are low, which are −5%~3% and −21%~9%, respectively (Table 1). The relative error of the particle size range of 5Φ~8Φ (5~6,6~7,7~8) is less than 10%, indicating that the new method is more accurate when the particle size is bigger than 0.039 mm. At the same time, the relative error is large (−20%) when the particle size range >8Φ (<0.039 mm). This is mainly due to the 5× objective lens’s resolution limit (0.97 μm), which cannot resolve clay particles <0.2 μm—this limitation is consistent with SEM’s microscale focus [18] and can be mitigated by replacing the 5× lens with a 10× lens (resolution 0.1 μm) in future studies. The main reason may be the small particle size was not treated by the laser particle size method during sample pretreatment [15]. In contrast, the image processing method did not identify the muddy size particles [38]. It shows that the new method has a certain error when the particle size is less than 0.039 mm, and there is certainly room for progress, which is also a problem that needs to be overcome in future research. In general, the new method can be used for particle size analysis, and the results are more consistent with the laser particle size method.
Previous studies have shown that it is possible to relate fundamental log-probability curve shapes of GSD to beach processes, aeolian processes, wave action, and breaking waves [8,30,31,32]. The three modes of transport reflected by grain size are suspension, saltation, and traction. This study is different from the standard scheme. On the one hand, the cumulative percent curve is used to describe the GSD instead of the log-probability curve because the head and nail of the curve are not as flat and low as the standard scheme. On the other hand, the Phi scale of the main GSD is between 5 and 8 (Figure 3a), which is much smaller than that of sandstone, on which the Udden–Wenworth classification was developed.

3.2. Implications to the Hydrodynamic Difference in the Fine-Grained Sedimentary Rocks

Mineralogical species: siliceous minerals (quartz), calcareous minerals (calcite), and clay minerals (illite). Textures: laminated (shale) and massive (mudstone). Cements: calcareous (dissolved by 10–20% acid) and pyrite (dissolved by 5–10% nitric acid). Grain morphology: siliceous particles (sub-angular to sub-rounded) and clay particles (flake-shaped). Diagenesis: compaction reduced porosity, while siliceous cement enhanced brittleness.
Although some sample structure information can be obtained from the extracted particle size plane distribution (Figure 2b,d), it can only be qualitatively evaluated; in addition, in the particle size distribution curve, the structural information cannot reflect the significant heterogeneity of particle size distribution. Therefore, a layered evaluation method is used to characterize better the particle size heterogeneity of fine-grained sediments and sedimentary rocks.
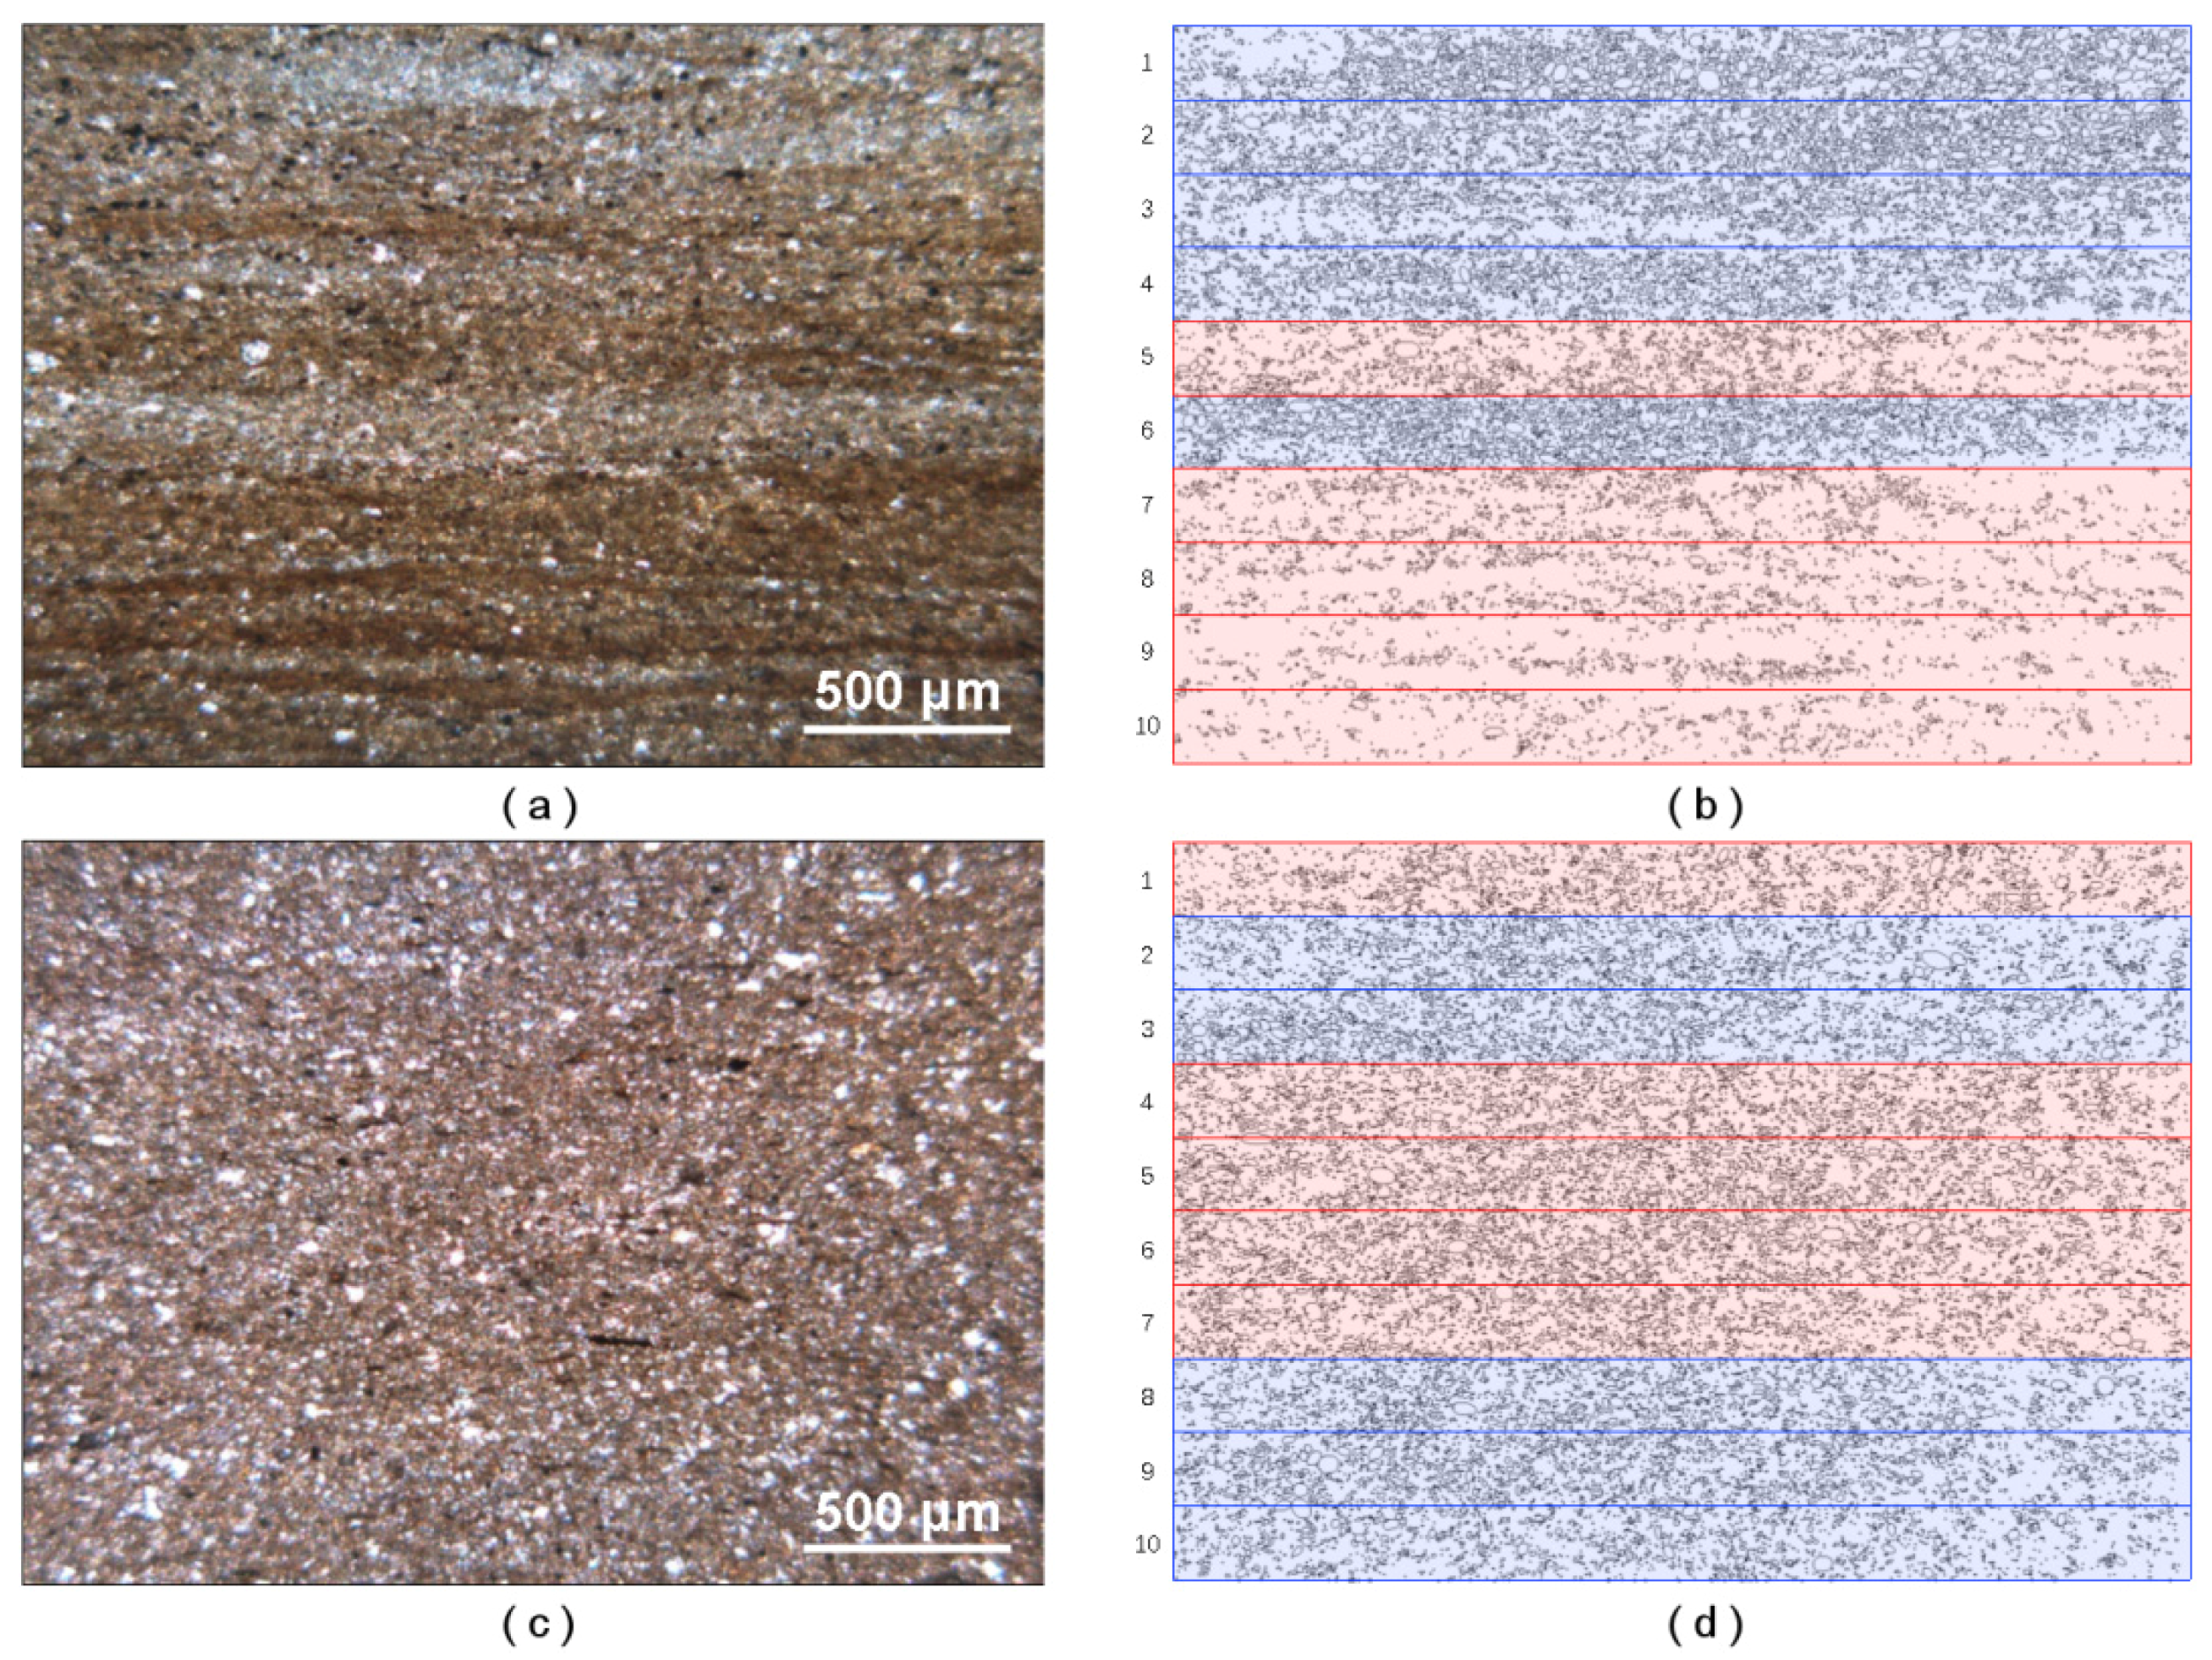
For comparison, two samples from laminated shale and massive mudstone were selected for further study. Figure 4a,c shows the thin-section images of laminated shale and massive mudstone, respectively, with their grains identified using the method in Figure 1 to be shown as black ellipses in Figure 4b,d. The image identified was evenly divided into ten regions from top to bottom and labeled from 1 to 10. The ratios of S50bi/S50si in these ten regions of laminated shale were 41.45, 32.96, 15.22, 14.61, 10.36, 22.46, 8.18, 7.28, 6.01, and 6.60, respectively. The ratios of S50bi/S50si in ten regions of massive mudstone were 10.61, 12.31, 13.26, 10.93, 11.30, 10.91, 9.31, 12.26, 13.47, and 12.08, respectively. Five regions with the largest ratio of S50bi/S50si were set to blue color (Regions 1, 2, 3, 4, 6 in laminated shale, and regions 2, 3, 8, 9, 10 in massive mudstone), and the other five regions were set to red color (Figure 4b,d). GSD in blue and red regions was analyzed separately (Figure 5).
Figure 5a illustrates the cumulative grain size distributions for the blue and red sub-regions within laminated shale and massive mudstone. Overall, both lithologies display similar sigmoidal trends in which the cumulative percentage increases systematically with Φ. Between Φ = 3~6 the curves nearly coincide, indicating negligible inter-regional differences. Beyond Φ > 6, the distributions diverge: the blue sub-regions consistently plot above the red ones, implying a higher proportion of fine particles within the blue domains.
Figure 5b presents the fractal characteristics for the same sub-regions. In both lithologies, LogS values for the blue sub-regions exceed those of their red counterparts, indicating a more intricate pore architecture, greater heterogeneity, and larger fractal dimensions in the blue domains.
A direct comparison between lithologies shows that laminated shale yields higher cumulative percentages than massive mudstone—particularly at higher Φ—consistent with an overall finer grain size spectrum. Laminated shale also exhibits slightly larger LogS (fractal dimension), underscoring a more complex pore-network configuration relative to massive mudstone.
Because the blue sub-regions are defined by higher S50bi/S50si ratios, they typically correspond to a larger proportion of pore area. The data corroborate that these regions are skewed toward finer particles and exhibit higher fractal dimensions, reflecting greater pore-network complexity. By contrast, the red sub-regions display relatively coarser-skewed distributions, lower fractal signatures, and simpler pore networks. Such spatial contrasts are plausibly controlled by variations in mineral assemblage, depositional energy, and diagenetic modification, which collectively modulate shale storage capacity and fluid-transport behavior.
The correlation between grain size and depositional processes is verified by lithofacies differences: laminated shale’s alternating coarse-fine laminae (Φ5~8) record periodic storm events (high energy) and calm periods (low energy), while massive mudstone’s uniform grain size (Φ6~8) reflects stable deep-lake conditions [7].
In summary, the new method identifies high-quality intervals by mapping siliceous laminae (coarser grains > 0.039 mm) via S50bi/S50si ratios, which correlate with higher pore connectivity (Figure 6d: D0 = 1.8328), providing a quantitative basis for reservoir mapping. And it can not only reflect the significant heterogeneity of fine-grained sediments and sedimentary rocks, but also quantitatively distinguish their structural information and reflect the hydrodynamic differences in different minerals to a certain extent. This aligns with Al-Mudhafar et al. (2025)’s finding [12] that grain size heterogeneity correlates with reservoir permeability, and Bjørlykke (2014)’s model [32] of depositional environment–rock texture links.

3.3. Multifractal Characteristics

The generalized dimension and fractal spectra of the four pore types were calculated by MATLAB multifractal geometric toolbox for the analysis of heterogeneity. The q was set from −20 to 20 with an interval of 0.5. The distribution curves of q~Dq and α~f(α) for different pore types were shown in Figure 6 and Table 2.
Figure 6a displays the multifractal spectra for the blue and red sub-regions within laminated shale and massive shale, all exhibiting a characteristic bell-shaped profile. Multifractal parameters directly enhance predictive reservoir modeling by providing quantitative indicators for “sweet spots”: High D0 (>1.8) indicates extensive pore development (laminated shale blue regions: D0 = 1.8328); High Δα (>1.5) reflects lamina enrichment (laminated shale: Δα = 1.5308), which correlates with high permeability [11]. These parameters can be integrated into reservoir models to map spatial variations in pore quality, avoiding subjective facies classification. The blue sub-regions of the laminated shale show a distinctly broader spectral width (wider α range), indicating higher heterogeneity and structural complexity of the pore system, whereas the red sub-regions have a markedly narrower width, suggesting a comparatively simpler architecture. By contrast, the difference in spectral width between the blue and red sub-regions of the massive shale is minor, implying a smaller intra-facies contrast in pore-structure heterogeneity and an overall complexity lower than that of the laminated shale. The higher D0 and αmaxmin values of laminated shale are directly related to its sedimentary succession of alternating siliceous and clay-rich laminae: coarse pores develop in siliceous laminae formed under high-energy conditions, while fine pores develop in clay-rich laminae formed under low-energy conditions, together leading to increased pore complexity.
Figure 6b presents the generalized dimension Dq as a function of q. For all sub-regions, Dq decreases monotonically with increasing q. The laminated-shale blue sub-regions consistently yield the highest Dq values, followed by the massive-shale blue sub-regions, whereas the red sub-regions are lowest. This ordering mirrors the complexity inferred from Figure 6a: the laminated-shale blue sub-regions are the most complex, and the red sub-regions the simplest.
Figure 6c shows box-counting regressions for particles in each sub-region. All fits exhibit strong linearity, confirming clear fractal scaling. The laminated-shale blue sub-regions have the steepest slopes, further attesting to their finer and more intricate pore-network configuration.
Figure 6d plots the relationship between α0 and D0. Data points for all sub-regions cluster near the 1:1 reference line, indicating overall consistency of fractal characteristics. The laminated-shale blue sub-regions display notably higher α0 and D0 values, corroborating their highest structural complexity.
From a geological perspective, laminated shales typically comprise pronounced depositional rhythmites and organic-rich layers, producing strong lateral and vertical contrasts in mineral composition and pore development, and thus a multiscale, non-uniform pore network. Massive shales, formed under more uniform and stable depositional conditions, tend to be mineralogically and texturally more homogeneous, resulting in lower structural complexity.
Comparing lithologies, the laminated shale exhibits larger multifractal spectral widths and higher dimensions than the massive shale, demonstrating greater heterogeneity and pore-network complexity—conditions that are generally more favorable for hydrocarbon storage and migration in shale reservoirs. These multifractal parameters can be directly used as indicators for reservoir prediction: a high D0 indicates high pore development, and a high αmaxmin indicates lamina enrichment—both are key characteristics of “sweet spots” for shale oil [11], providing quantitative constraints for reservoir modeling without the need for additional complex prediction models.
The blue and red sub-regions are defined by differences in the areal contribution of pores; blue sub-regions possess higher pore–area proportions. Consistently, their multifractal parameters exceed those of the red sub-regions, indicating more developed fine-scale porosity and higher heterogeneity. These contrasts likely reflect spatial variations in pore development, particle size distributions, and mineral assemblages, and they further imply that the blue sub-regions provide superior storage and flow pathways conducive to hydrocarbon enrichment.

3.4. Comparison with Other Non-Destructive Methods

To further clarify the advantages of the proposed method, this section compares it with two other mainstream non-destructive grain size analysis methods (micro-CT and SEM) in terms of resolution, reliability, and scalability (Table 3).
As shown in Table 3, the proposed method balances resolution, reliability, and scalability. Its core advantage of “preserving macro-scale sedimentary structures while realizing grain size quantification” makes up for the shortcomings of SEM (small field of view) and micro-CT (high cost) and is more suitable for large-scale routine reservoir characterization in industrial settings.
The method is applicable to other fine-grained lithologies:
-
Siltstones (4–63 μm): Silt particles show clear grayscale contrast in polarized images, with >93% recognition accuracy;
-
Marlstones (carbonate-rich): Carbonate minerals exhibit strong birefringence (cross-polarized light), enabling >90% differentiation from clays;
-
Organic-rich shales (TOC > 5%): Organic matter appears dark in single-polarized light—adjusting k-means k = 4 reduces grayscale overlap with clays, improving accuracy to 88% (further enhanced to >95% with Raman spectroscopy for organic identification).

4. Conclusions

Grain size information plays a crucial role in studying fine-grained sedimentary rocks, and grain size measurement is the basis of grain size analysis. Here, we present a new methodology of optical microscopy and cluster analysis method to obtain the grain-size information for a wide range of sizes. This new methodology was applied to identify the grains within the typical secession in the fine-grained sedimentary rocks of the Shalehejie Formation in the Bohai Bay Basin. The main findings are as follows:
(1)
The proposed non-destructive workflow effectively retains sedimentary fabric, enabling accurate grain size analysis via polarized image mosaicking, clustering, and watershed segmentation without sample disaggregation.
(2)
Localized grain size statistical analysis across ten defined sub-regions successfully captures internal heterogeneity, enhancing understanding of depositional variability.
(3)
Validation confirms high accuracy (absolute error −5% to 3%) when compared to conventional laser granulometry, particularly for particles larger than 0.039 mm.
(4)
The method discriminates lithofacies effectively, clearly distinguishing laminated shale, characterized by alternating coarse siliceous and fine clay laminae, from more homogeneous massive mudstone.
(5)
Application of multifractal parameters (Dq, α~f(α)) quantifies spatial complexity and enhances the geological interpretation of depositional conditions—specifically pore size distribution, connectivity, and spatial heterogeneity. For example, D0 (capacity dimension) reflects pore size range (laminated shale: D0 = 1.8328 > massive mudstone: D0 = 1.7055), while Δα (αmaxmin) indicates spatial heterogeneity (laminated shale: Δα = 1.5308 > massive mudstone: Δα = 1.4367).
(6)
Overall, this image-based grain size analysis significantly advances facies differentiation, providing robust constraints for shale reservoir characterization and enhancing predictive reservoir modeling. For industrial-scale routine characterization, the workflow can be optimized by performing the following: Automating image stitching (via Python 3.11 OpenCV) to reduce manual time from 8 h to 2 h per sample; Integrating with robotic sample stages to eliminate manual movement; Developing a user-friendly GUI (e.g., MATLAB App) for non-experts. These optimizations make the method feasible for batch processing of 50+ samples/month, meeting industrial demands.
Despite its strong performance, the current workflow has two principal limitations: (i) particles <0.2 μm (clay fraction) fall below optical resolution, and (ii) parameter tuning for new lithologies still requires manual validation. We will address these by fusing SEM imaging to capture sub-micron clay textures and pore types [39], and by automating parameter selection with deep learning—in particular, applying Vision Transformers to grain-scale segmentation to reduce reliance on hand-set k-means parameters. In parallel, we will integrate three-dimensional micro-CT with the two-dimensional image-based grain size maps to build a macro–micro pore–grain model and resolve multiscale connectivity. Mineralogical mapping will be added via Raman/XRD to co-register mineral phases with grain size fields, and XRF/XRD will enable simultaneous constraints on composition (including clay paragenesis), increasing scientific rigor. The workflow is readily extensible to the Songliao Basin (Qingshankou Fm.) and Sichuan Basin (Longmaxi Fm.), providing quantitative indicators for shale-oil “sweet spots” and practical guidance for academic and industrial applications. Finally, known clay-fraction biases in laser granulometry (e.g., underestimation of <2 μm) further motivate joint use of optical/SEM/CT and mineralogical methods for cross-validation [15].

Author Contributions

Conceptualization, S.T. and B.L.; methodology, S.T. and H.D.; software, Z.D.; validation, F.Z.; formal analysis, S.T.; investigation, Z.D.; resources, B.L.; data curation, F.Z. and H.L.; writing—original draft preparation, F.Z., S.T., Z.D., B.L. and H.L.; writing—review and editing, F.Z., S.T. and Z.D.; visualization, F.Z., S.T. and H.L.; supervision, B.L.; project administration, H.D.; funding acquisition, F.Z. and S.T. All authors have read and agreed to the published version of the manuscript.

Funding

This research was funded by the National Natural Science Foundation of China grant number [42202159], Heilongjiang Postdoctoral Foundation grant number [LBH-Z23099].

Data Availability Statement

The original contributions presented in this study are included in the article. Further inquiries can be directed to the corresponding author.

Conflicts of Interest

The authors declare no conflict of interest.

References

  1. Picard, M.D. Classification of fine-grained sedimentary rocks. J. Sediment. Res. 1971, 41, 179–195. [Google Scholar] [CrossRef]
  2. Owens, P.N.; Batalla, R.J.; Collins, A.J.; Gomez, B.; Hicks, D.M.; Horowitz, A.J.; Kondolf, G.M.; Marden, M.; Page, M.J.; Peacock, D.H.; et al. Fine-grained sediment in river systems: Environmental significance and management issues. River Res. Appl. 2005, 21, 693–717. [Google Scholar] [CrossRef]
  3. Stow, D.A.V.; Piper, D.J.W. Deep-water fine-grained sediments: Facies models. Geol. Soc. Lond. Spec. Publ. 1984, 15, 611–646. [Google Scholar] [CrossRef]
  4. Liu, B.; Wang, H.; Fu, X.; Bai, Y.; Bai, L.; Jia, M.; He, B. Lithofacies and depositional setting of a highly prospective lacustrine shale oil succession from the Upper Cretaceous Qingshankou Formation in the Gulong sag, northern Songliao Basin, northeast China. AAPG Bull. 2019, 103, 405–432. [Google Scholar] [CrossRef]
  5. Tian, S.; Bowen, L.; Liu, B.; Zeng, F.; Xue, H.; Erastova, V.; Greenwell, H.C.; Dong, Z.; Zhao, R.; Liu, J. A method for automatic shale porosity quantification using an Edge-Threshold Automatic Processing (ETAP) technique. Fuel 2021, 304, 121319. [Google Scholar] [CrossRef]
  6. Guo, H.; Shi, J.; Fu, S.; Liu, Z.; Cai, L.; Yin, S. Lithofacies Characteristics of Continental Lacustrine Fine-Grained Sedimentary Rocks and Their Coupling Relationship with Sedimentary Environments: Insights from the Shahejie Formation, Dongying Sag. Minerals 2024, 14, 479. [Google Scholar] [CrossRef]
  7. McCave, I.N.; Syvitski, J.P.M. Principles and methods of geological particle size analysis. In Principles, Methods and Application of Particle Size Analysis; Cambridge University Press: Cambridge, UK, 1991; pp. 3–21. [Google Scholar]
  8. Visher, G.S. Grain size distributions and depositional processes. J. Sediment. Res. 1969, 39, 1074–1106. [Google Scholar] [CrossRef]
  9. Sun, D.; Bloemendal, J.; Rea, D.K.; Vandenberghe, J.; Jiang, F.; An, Z.; Su, R. Grain-size distribution function of polymodal sediments in hydraulic and aeolian environments, and numerical partitioning of the sedimentary components. Sediment. Geol. 2002, 152, 263–277. [Google Scholar] [CrossRef]
  10. Chen, Y.; Wei, L.; Mastalerz, M.; Schimmelmann, A. The effect of analytical particle size on gas adsorption porosimetry of shale. Int. J. Coal Geol. 2015, 138, 103–112. [Google Scholar] [CrossRef]
  11. Liu, B.; He, S.; Meng, L.; Fu, X.; Gong, L.; Wang, H. Sealing mechanisms in volcanic faulted reservoirs in Xujiaweizi extension, northern Songliao Basin, northeastern China. AAPG Bull. 2021, 105, 1721–1743. [Google Scholar] [CrossRef]
  12. Al-Mudhafar, W.J.; Hasan, A.A.; Abbas, M.A.; Wood, D.A. Machine learning with hyperparameter optimization applied in facies-supported permeability modeling in carbonate oil reservoirs. Sci. Rep. 2025, 15, 12939. [Google Scholar] [CrossRef]
  13. Folk, R.L. Petrology of Sedimentary Rocks; Hemphill Publishing Company: Elmhurst, NY, USA, 1980. [Google Scholar]
  14. Gee, G.W. 2.4 Particle-size analysis. In Methods of Soil Analysis: Part 4 Physical Methods; John Wiley & Sons, Inc.: Hoboken, NJ, USA, 2002; Volume 5, pp. 255–293. [Google Scholar]
  15. Konert, M.; Vandenberghe, J.E.F. Comparison of laser grain size analysis with pipette and sieve analysis: A solution for the underestimation of the clay fraction. Sedimentology 1997, 44, 523–535. [Google Scholar] [CrossRef]
  16. Yuan, H.; Wang, L.; Yu, Y.; Zhang, D.J.; Xu, F.M.; Liu, H.T. Review of sedimentary grain size analysis methods. J. Jilin Univ. (Earth Sci. Ed.) 2019, 49, 380–393. [Google Scholar]
  17. Buscombe, D. Estimation of grain-size distributions and associated parameters from digital images of sediment. Sediment. Geol. 2008, 210, 1–10. [Google Scholar] [CrossRef]
  18. Bankole, S.A.; Buckman, J.; Stow, D.; Lever, H. Grain-size analysis of mudrocks: A new semi-automated method from SEM images. J. Pet. Sci. Eng. 2019, 174, 244–256. [Google Scholar] [CrossRef]
  19. Izadi, H.; Sadri, J.; Mehran, N.A. A new intelligent method for minerals segmentation in thin sections based on a novel incremental color clustering. Comput. Geosci. 2015, 81, 38–52. [Google Scholar] [CrossRef]
  20. Cuddy, S. The benefits and dangers of using artificial intelligence in petrophysics. Artif. Intell. Geosci. 2021, 2, 1–10. [Google Scholar] [CrossRef]
  21. Bhattacharya, S. A Primer on Machine Learning in Subsurface Geosciences; Springer: Cham, Switzerland, 2021. [Google Scholar] [CrossRef]
  22. Leblanc, C.; Picek, L.; Deneu, B.; Bonnet, P.; Servajean, M.; Palard, R.; Joly, A. Mapping biodiversity at very-high resolution in Europe. In Proceedings of the 2025 IEEE/CVF Conference on Computer Vision and Pattern Recognition Workshops (CVPRW), Nashville, TN, USA, 11–12 June 2025; pp. 2349–2358. [Google Scholar]
  23. Vaswani, A.; Shazeer, N.; Parmar, N.; Uszkoreit, J.; Jones, L.; Gomez, A.N.; Kaiser, Ł.; Polosukhin, I. Attention Is All You Need. In Proceedings of the Advances in Neural Information Processing Systems 30 (NeurIPS 2017), Long Beach, CA, USA, 4–9 December 2017; pp. 5998–6008. [Google Scholar]
  24. Johnson, M.R. Thin section grain size analysis revisited. Sedimentology 1994, 41, 985–999. [Google Scholar] [CrossRef]
  25. Tarquini, S.; Favalli, M. A microscopic information system (MIS) for petrographic analysis. Comput. Geosci. 2010, 36, 665–674. [Google Scholar] [CrossRef]
  26. Tang, D.G.; Milliken, K.L.; Spikes, K.T. Machine learning for point counting and segmentation of arenite in thin section. Mar. Pet. Geol. 2020, 120, 104518. [Google Scholar] [CrossRef]
  27. Han, W.; Zhao, X.; Pu, X.; Chen, S.; Wang, H.; Liu, Y.; Shi, Z.; Zhang, W.; Wu, J. Fine-grained rock fabric facies classification and its control on shale oil accumulation: A case study from the Paleogene Kong 2 Member, Bohai Bay Basin. Front. Earth Sci. 2021, 15, 423–437. [Google Scholar] [CrossRef]
  28. Bian, C.; Guo, B.; Pu, X.; Zeng, X.; Liu, W.; Li, Y.; Zhou, K.; Tian, Q.; Ma, C. Lithofacies Characteristics and Their Effects on Shale Oil Enrichment: A Case Study from Shahejie Formation of the Qibei Sag, Bohai Bay Basin, China. Energies 2023, 16, 2107. [Google Scholar] [CrossRef]
  29. Udden, J.A. The Mechanical Composition of Wind Deposits; Augustana College Library: Rock Island, IL, USA, 1898; pp. 838–839. [Google Scholar]
  30. Miall, A.D. A review of the braided-river depositional environment. Earth-Sci. Rev. 1977, 13, 1–62. [Google Scholar] [CrossRef]
  31. Blott, S.J.; Pye, K. GRADISTAT: A grain size distribution and statistics package for the analysis of unconsolidated sediments. Earth Surf. Process. Landf. 2001, 26, 1237–1248. [Google Scholar] [CrossRef]
  32. Bjørlykke, K. Relationships between depositional environments, burial history and rock properties. Some principal aspects of diagenetic process in sedimentary basins. Sediment. Geol. 2014, 301, 1–14. [Google Scholar] [CrossRef]
  33. Loog, A.; Kurvits, T.; Aruvali, J.; Petersell, V. Grain size analysis and mineralogy of the Tremadocian Dictyonema shale in Estonia. Oil Shale 2001, 18, 281–297. [Google Scholar] [CrossRef]
  34. Wentworth, C.K. A scale of grade and class terms for clastic sediments. J. Geol. 1922, 30, 377–392. [Google Scholar] [CrossRef]
  35. Krumbein, W.C. Size frequency distributions of sediments. J. Sediment. Res. 1934, 4, 65–77. [Google Scholar] [CrossRef]
  36. Allen, G.P.; Castaing, P.; Klingebiel, A. Distinction of elementary sand populations in the Gironde Estuary (France) by R-mode factor analysis of grain-size data. Sedimentology 1972, 19, 21–35. [Google Scholar] [CrossRef]
  37. Folk, R.L.; Ward, W.C. A study in the significance of grain size parameters. J. Sediment. Res. 1957, 27, 3–26. [Google Scholar] [CrossRef]
  38. Beuselinck, L.; Govers, G.; Poesen, J.; Degraer, G.; Froyen, L. Grain-size analysis by laser diffractometry: Comparison with the sieve–pipette method. Catena 1998, 32, 193–208. [Google Scholar] [CrossRef]
  39. Loucks, R.G.; Reed, R.M.; Ruppel, S.C.; Hammes, U. Spectrum of pore types and networks in mudrocks and a descriptive classification for matrix-related mudrock pores. AAPG Bull. 2012, 96, 1071–1098. [Google Scholar] [CrossRef]
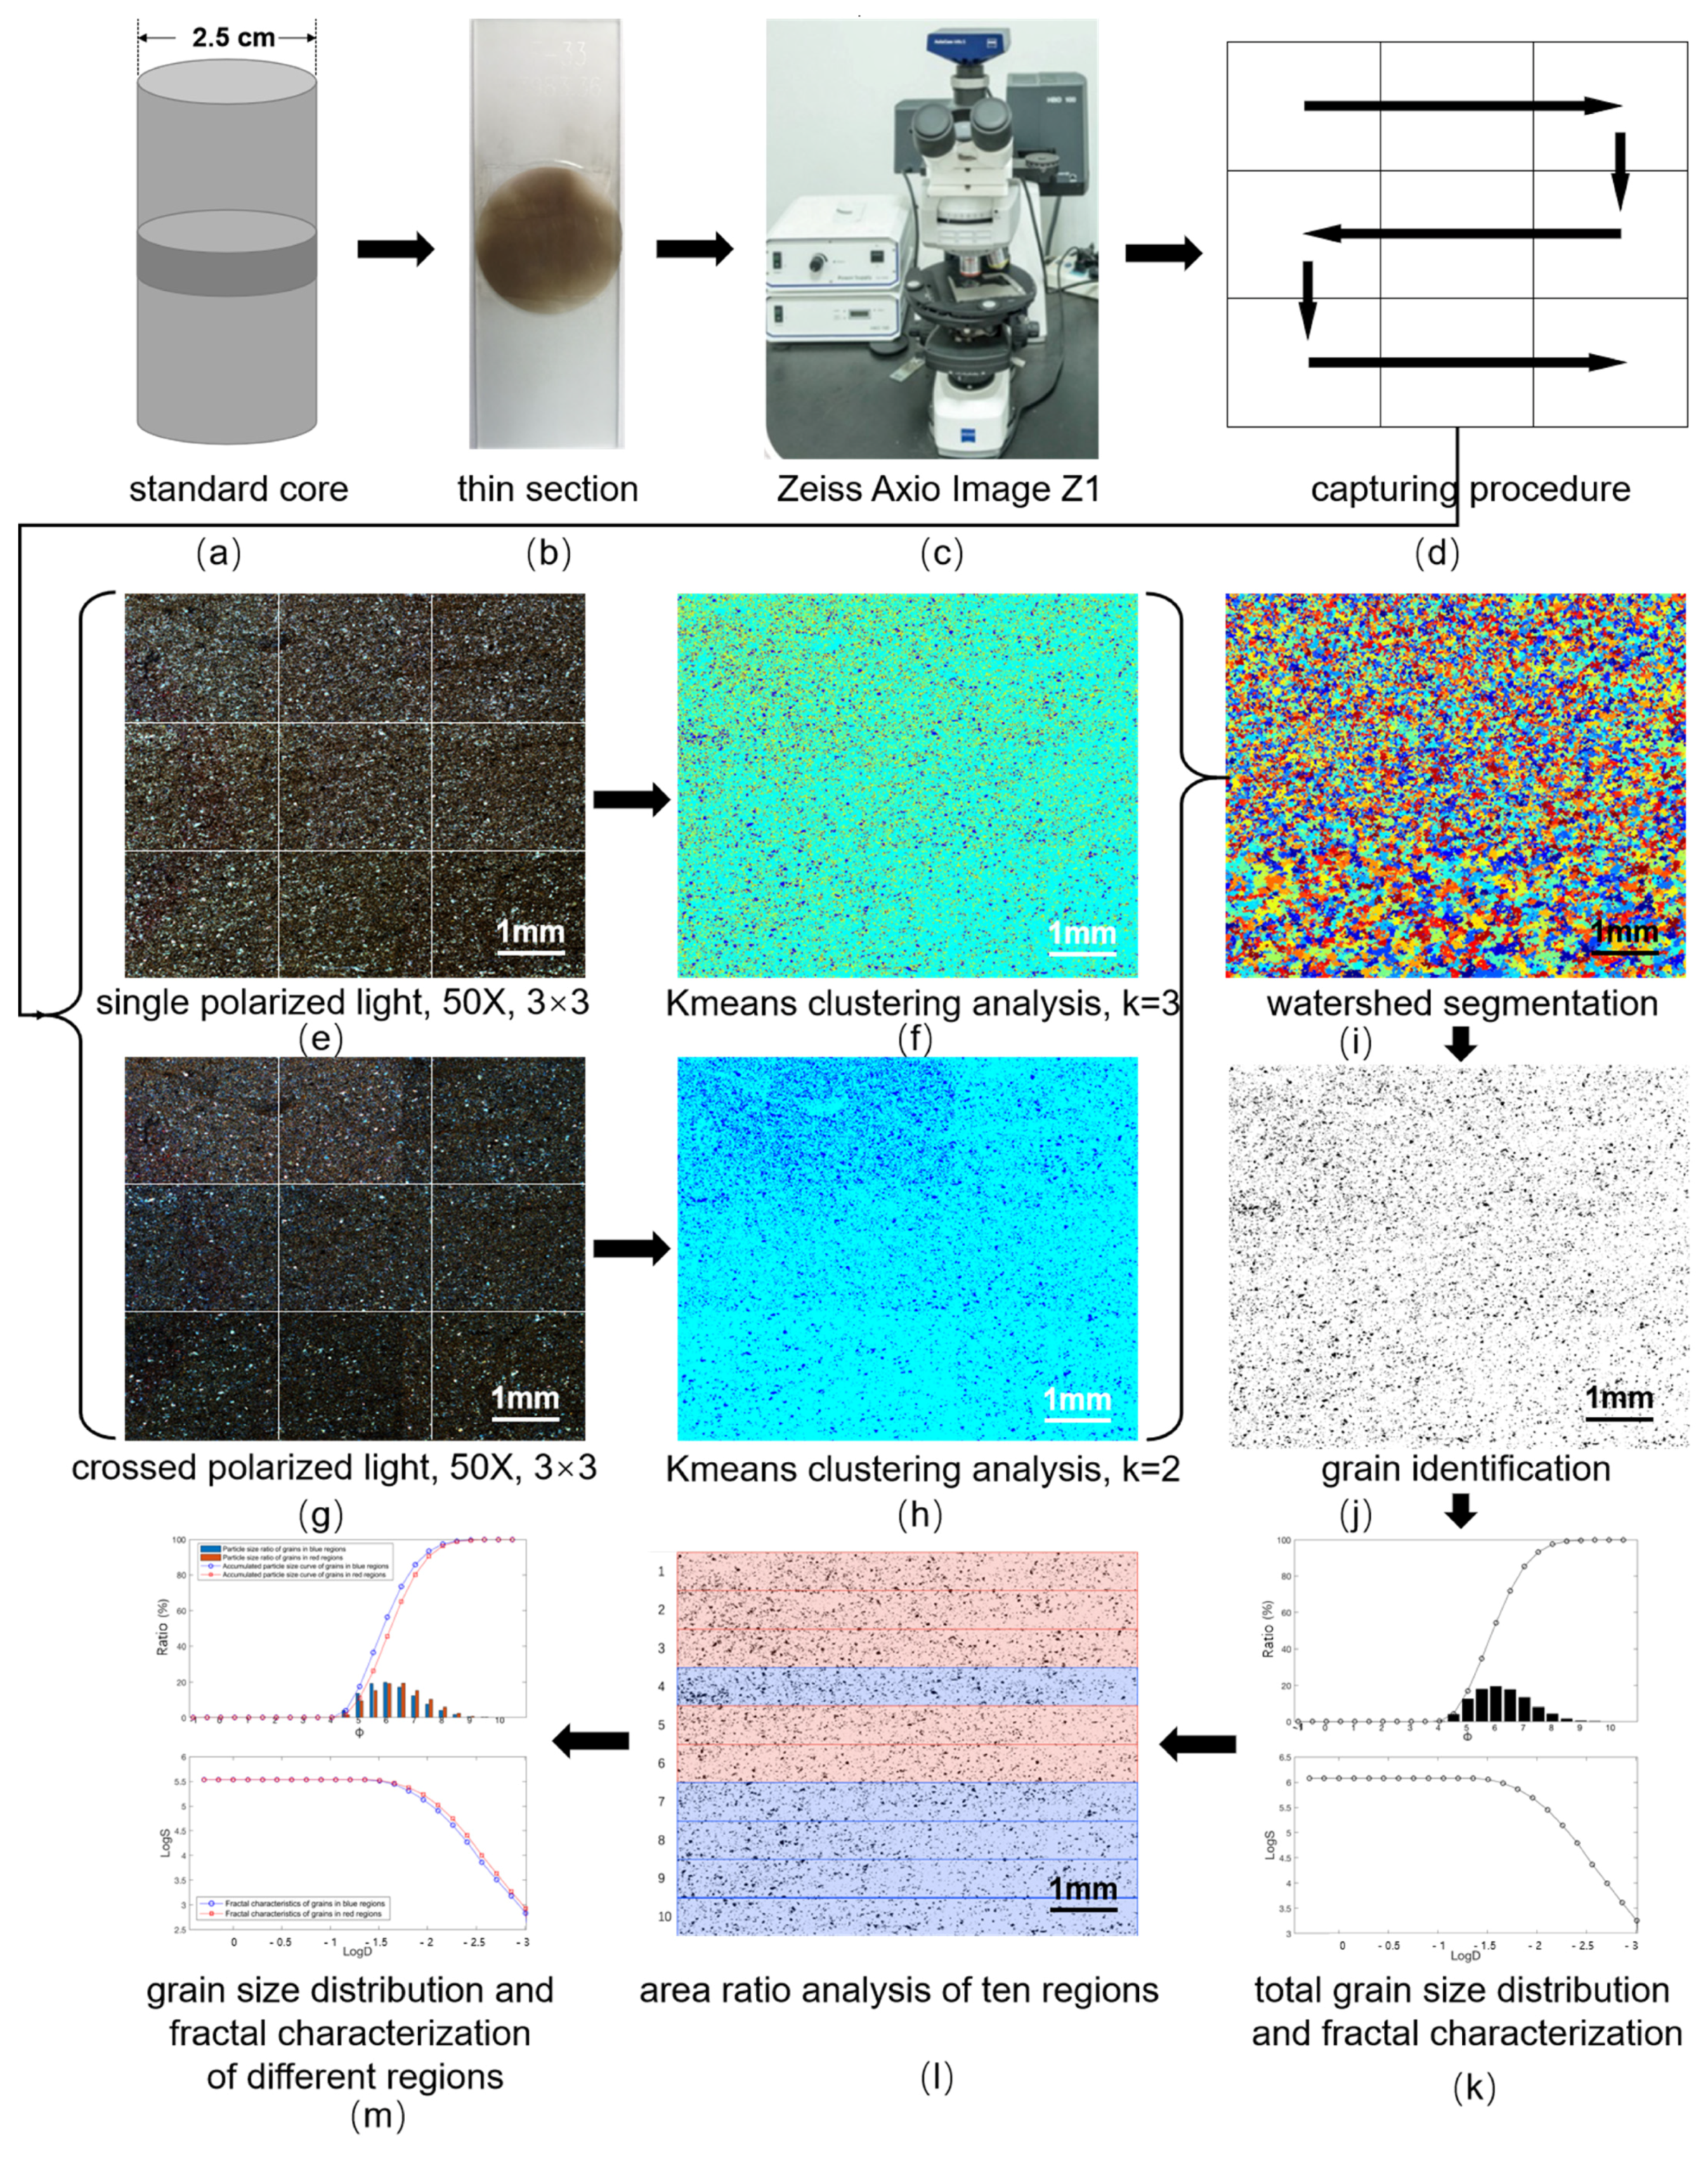
Figure 1. Flow chart of sample preparation, image capturing, and data processing: (a) standard core and cutting direction of thin section; (b) thin section; (c) Zeiss Axio Image Z1; (d) capture procedure; (e) the nine superimposed single polarized images; (f) the image of k-means clustering analysis, k = 3; (g) the nine superimposed orthogonal polarized images; (h) the image of k-means clustering analysis, k = 2; (i) the image of watershed segmentation; (j) the final recognized particle graph; (k) cumulative percent curve and frequency percent bar of total grain size; (l) area ration analysis of ten regions, and blue area shows S50bi/S50si > 50 and red area shows S50bi/S50si < 50; (m) cumulative percent curve and frequency percent bar of grain size in blue and red regions.
Fractalfract 09 00642 g001
Figure 2. Extracted grain graphs: (a) single polarized image of laminated shale; (b) extracted grain image using the image-based method of laminated shale; (c) the single polarized image of massive mudstone; (d) extracted grain image using the image-based method of massive mudstone; (eh) local magnification images of red squares in images of (ad), respectively.
Fractalfract 09 00642 g002
Figure 3. Cumulative percent curve and frequency percent bar of grain size: (a) GSD cumulative percent curves of both image-based method and laser granulometry; (b) GSD frequency percent bars of both image-based method and laser granulometry.
Fractalfract 09 00642 g003
Figure 4. Images of thin section and identified grains: (a) thin section image of laminated shale; (b) Sub-regional image of identified grains using thin section image of laminated shale; (c) thin section image of massive mudstone; (d) sub-regional image of identified grains using thin section image of massive mudstone.
Fractalfract 09 00642 g004
Figure 5. Grain size cumulative percent curves (a) and fractal characterization (b) within sub-regional images of identified grains.
Fractalfract 09 00642 g005
Figure 6. Generalized dimensional (a); multifractal spectra of particles in different regions (b); box-counting regressions for particles in each sub-region (c); the relationship between α0 and D0 (d).
Fractalfract 09 00642 g006
Table 1. Error analysis of GSD using the image-based method and GSD using laser granulometry.
Different MethodGSD Using Image-Based Method (%)GSD Using Laser Granulometry (%)Absolute
Error (%)
Relative
Error (%)
Phi Scale LSMMLSMMLSMMLSMM
5~617.439 15.523 16.397 14.361 1.042 1.162 6.355 8.093
6~740.746 35.083 38.294 33.420 2.452 1.663 6.404 4.976
7~827.883 28.657 27.684 26.813 0.199 1.844 0.719 6.878
>813.932 20.737 17.625 25.406 −3.693 −4.669 −20.955 −18.379
Note: LS indicates laminated shale, and MM indicates massive mudstone.
Table 2. Multifractal parameters and box-counting dimensions of particles in different regions.
Particles in Different RegionD0D1D2αminαmaxα0ΔαADb
Blue region of laminated shale1.83281.78511.76451.65053.18131.91611.53080.20991.7057
Blue region of massive shale1.70551.59721.52801.29542.73221.82641.43670.58631.5818
Red region of laminated shale1.20771.01180.91230.70522.14181.42981.43661.01781.2737
Red region of massive shale1.80181.72231.66991.47522.89021.89451.41500.42121.5223
Table 3. Comparison of the proposed method with micro-CT and SEM-based image analysis.
MethodResolutionReliability (Accuracy)Scalability (Single-Sample Processing Time)Core AdvantagesCore Disadvantages
Proposed method0.97 μm92–95%8 h (including sample preparation)Non-destructive, preserves sedimentary structures, large field of view (3 × 3 mm)Cannot identify particles <0.2 μm
micro-CT>0.5 μm90–93%>24 h (including sample preparation)Characterizes three-dimensional pore structureHigh cost (~5 million RMB/unit), small sample volume
SEM0.01 μm95–98%12 h (including sample preparation)High resolution, accurate mineral identificationSmall field of view (<0.1 × 0.1 mm), lacks macro-scale analysis
Disclaimer/Publisher’s Note: The statements, opinions and data contained in all publications are solely those of the individual author(s) and contributor(s) and not of MDPI and/or the editor(s). MDPI and/or the editor(s) disclaim responsibility for any injury to people or property resulting from any ideas, methods, instructions or products referred to in the content.